
94% of researchers rate our articles as excellent or good
Learn more about the work of our research integrity team to safeguard the quality of each article we publish.
Find out more
ORIGINAL RESEARCH article
Front. Environ. Sci., 02 December 2021
Sec. Freshwater Science
Volume 9 - 2021 | https://doi.org/10.3389/fenvs.2021.797971
This article is part of the Research TopicThe Urban Fluvial and Hydro-Environment SystemView all 21 articles
 Chen Chen1,2
 Tiejian Li1,3,4*
 Bellie Sivakumar1,5
 Ashish Sharma6John D. Albertson7
 Li Zhang1Guangqian Wang1,3,4
Climate warming has increased grassland productivity on the Qinghai-Tibet Plateau, while intensified grazing has brought increasing direct negative effects. To understand the effects of climate change and make sustainable management decisions, it is crucial to identify the combined effects. Here, we separate the grazing effects with a climate-driven probability model and elaborate scenario comparison, using the Normalized Difference Vegetation Index (NDVI) of the grassland on the Qinghai-Tibet Plateau. We show that grazing has positive effects on NDVI in the beginning and end of the growing season, and negative effects in the middle. Because of the positive effects, studies tend to underestimate and even ignore the grazing pressure under a warming climate. Moreover, the seasonality of grazing effects changes the NDVI-biomass relationship, influencing the assessment of climate change impacts. Therefore, the seasonality of grazing effects should be an important determinant in the response of grassland to warming in sustainability analysis.
Grasslands provide food and habitats for humankind and animals (de Jong et al., 2013), but are facing increasing pressure under climate change, in addition to intensifying human activities and increasing food demands (Chen et al., 2013; Seddon et al., 2016; Zhu et al., 2016). A key concern, at the current time, is whether grassland systems are sustainable under these double threats. While grasslands are among the most important indicators of the impacts of climate change (Li et al., 2018a), only very little research has been done on the role of human activities on the grasslands in climate change models (Väisänen et al., 2014).
The Three-River Headwaters Region (TRHR) on the Qinghai-Tibet Plateau is a crucial rangeland ecosystem with great importance to water resources and ecological security of China (Figure 1A) (Zhang et al., 2016; Han et al., 2018). Dubbed as China’s Water Tower, the TRHR is the source of the Yellow River, the Yangtze River, and the Lancang River (the upper part of the Mekong River). The Plateau grassland, covering 91% of the land surface with a mean altitude of 4,500 m above mean sea level (Zheng et al., 2018), is mainly used as rangeland of nomadic Tibetans, providing grass for Tibetan yak and sheep, as well as wild animals, to graze (Figures 1B,C).
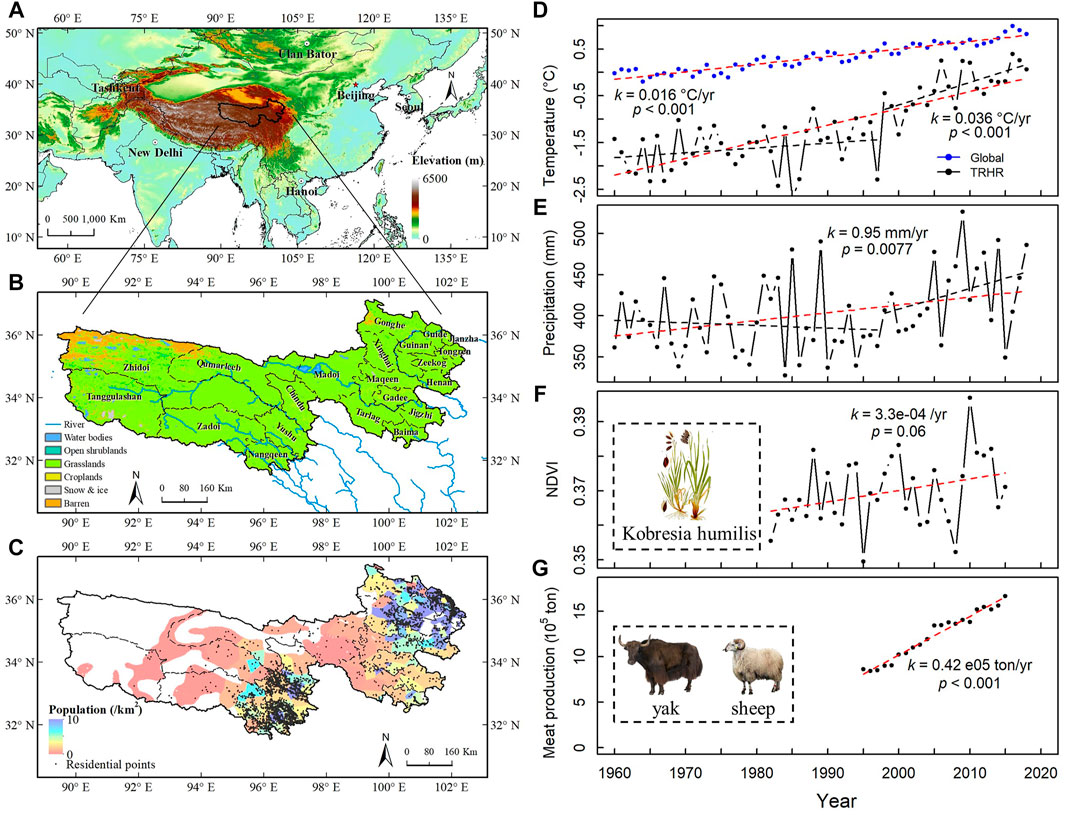
FIGURE 1. The background and climate change of the Three-River Headwaters Region (TRHR). (A) Location of the TRHR; (B) Land cover of the TRHR; (C) Population density in 2015; (D) Station-based annual mean air temperature from 1961 to 2018; (E) Station-based annual mean precipitation from 1961 to 2018; (F) Growing season (May to September) NDVI from 1981 to 2015; (G) Grazing meat production from 1995 to 2015.
Weather station data revealed that air temperature and precipitation had increased significantly from 1960 to 2018 in the TRHR, and the increasing trend had particularly accelerated since the 1990s (Figures 1D,E). The warming trend in the TRHR (at a rate of 0.036°C/yr) had been much stronger than that at the global level (0.016°C/yr), with more than double the rate (Figure 1D). Climate change, including warming and CO2 fertilizing, currently contributes to the greening of vegetation (Figure 1F) in the water-temperature-constrained TRHR (Nemani et al., 2003). On the other hand, the grazing intensity (represented by meat production throughout this paper) almost doubled from 1995 to 2015 (Figure 1G), exerting great pressure on the grassland ecosystem. The sustainability of the rangeland as well as the heritage of this unique Tibetan nomadic culture are facing huge challenges. However, the effects of grazing and climate change combine together to impact vegetation [e.g., yielding an overall rising Normalized Difference Vegetation Index (NDVI)], thus making it difficult to analyze and assess the influences and impacts, not to mention the complex nature of the individual factors involved as well as their interactions.
The combined effects of climate change and grazing on vegetation productivity, phenology and ecosystem properties have been explored by some studies (Klein et al., 2007; Zhang et al., 2015; Li et al., 2018c; Kohli et al., 2021). On the one hand, grazing alters the response of vegetation to climate change by modulating the dependency of vegetation growth on temperature (Wei et al., 2020). On the other hand, warming offsets the grazing effects on vegetation through altering the vegetation living state, i.e. increasing the plant height and the aboveground biomass (Zhang et al., 2015; Tang et al., 2019). The complexity associated with climate change and grazing and, hence, their combined effects on vegetation has generated contrasting results (Li et al., 2011; Wang et al., 2012; Xu et al., 2014; Ge et al., 2021). For example, grazing could exert both positive and negative influences on biomass due to the complex relationships between livestock grazing and biomass (Li et al., 2019a). How climate change and grazing interactively affect the biomass, biodiversity and ecosystem sustainability needs further investigation (Li et al., 2018c).
We analyzed the combined effects of climate change and grazing with elaborate scenario comparison (O'Neill and Nakicenovic, 2008; Huntzinger et al., 2013; McKenna et al., 2021), using a climate-driven probability model for time series, i.e., the Non-Homogeneous Hidden Markov Model (NHMM) (Holsclaw et al., 2017). First, we used the NHMM to simulate the vegetation dynamics month by month at county scale (a total of 414 months and 22 counties, Figure 1B, Supplementary Table S1), with the standardized climate inputs and NDVI. Then, we devised two scenarios to separate the grazing effects. We find that, besides the negative effects on NDVI in the middle of the growing season (May to September), grazing shows surprising but obvious positive effects in the beginning and end of the growing season. This seasonal pattern has important implications for better understanding of the grazing pressure on grasslands and for modifying the existing NDVI-biomass relationships, towards a more reliable indication of climate change.
Climate data. In general, climatic factors impose complex and varying limitations on vegetation growth (Nemani et al., 2003). Therefore, monthly precipitation and temperature data were obtained from the Climate Hazards Group Infrared Precipitation with Stations (CHIRPS) (Funk et al., 2015) and ERA-Interim (Dee et al., 2011), respectively, to feed the NHMM. The data from CHIRPS have a spatial resolution of 0.05° for the period from 1981 to the time being, and the monthly-mean surface temperature at 2-m from ERA-interim has a resolution of 0.125° for the period from 1979 to the present. To evaluate the amplitude of climate change on the Qinghai-Tibet Plateau study area, the monthly gauging station data from 1960 to 2018 provided by the China Meteorological Administration were used. Moreover, global temperature anomaly data were obtained from the National Oceanic and Atmospheric Administration (NOAA) to make comparison between regional and global warming, and to demonstrate the relatively extraordinary effects of warming on rangeland vegetation on the Qinghai-Tibet Plateau. Since the non-stationary climate system might also be related to vegetation growth, the climate oscillation indexes from NOAA were used as candidate predictors in our model.
Vegetation data. NDVI, a proxy of vegetation greenness and production, was acquired from the Global Inventory Monitoring and Modelling Studies (GIMMS) NDVI3g (Tucker et al., 2005). The biweekly datasets span from July 1981 to December 2015 with a spatial resolution of 0.083°. Monthly NDVI was composited from the biweekly data using the Maximum Value Composite method (Holben, 1986). The moderate-resolution imaging spectroradiometer (MODIS) land cover data (MCD12Q1) (Friedl et al., 2010), with 500 m resolution, were utilized to composite a binary pasture mask. The grassland pixels were classified as the pasture area. Apart from the non-grassland pixel, the surrounding eight pixels were masked out to make the classifying result more robust.
Anthropogenic data. Yak and sheep meat production data, for the period 1995–2015, were obtained from the records of the Qinghai Statistical Almanacs, considering the lack of information and reliability on the livestock population data. Here it is noted that during our study analysis, we have found a clear correlation between the meat production and the livestock population data, thus meat production could be used as a convincing surrogate for the grazing effect. The livestock density (LD) for each county was defined as meat production divided by pasture area. Annual time series were converted to monthly series based on linear interpolation. The Gridded Population of the World, Version 4 (Center for International Earth Science Information Network - CIESIN - Columbia University, 2018) was used to demonstrate population density of the study area.
The linear regression method was applied for the trend analysis, with Student’s two-tailed t-test for significance test, and the Pettitt change point test was used for change point detection (Pettitt, 1979). Since livestock data were at the county scale, the gridded climate data and NDVI were aggregated to county scale after eliminating the non-pasture area. The assumption for the attribution of grazing effects was that the climate zone was homogeneous across the TRHR and, therefore, it was reasonable to calibrate the NHMM for one county and apply it to another. To meet this assumption, the climate data and NDVI were further processed with standardized normalization. The standardized NDVI was denoted as
Viovy and Saint (1994) adopted the Hidden Markov Model (HMM) for modelling the vegetation dynamics, but it has the issues of poor representation in the temporal variability and spatial variability (Holsclaw et al., 2016). In our study, the NHMM (Hughes and Guttorp, 1994; Hughes et al., 1999) was applied for modelling the monthly vegetation time series, i.e.
where
In the NHMM, we introduced two types of exogenous variables (Holsclaw et al., 2016; Holsclaw et al., 2017). Time series
The Markov chain Monte Carlo (MCMC) algorithm (Holsclaw et al., 2017) was applied to estimate the posterior full conditional distributions for
For the purpose of attribution of grazing effects, we devised two scenarios in opposite directions. Scenario 1 (S1) was to calibrate and verify the model in five counties that had the least grazing density, to get five sets of model parameters (i.e., five similar calibrated models), and then apply them to the remaining 17 counties (Supplementary Table S1; Supplementary Figure S4). For each of the 17 application sites, we got five sets of simulation results. Scenario 2 (S2) was the opposite of S1, i.e. to calibrate the models in five counties that had the highest grazing density. For either of these scenarios, the grazing effects were estimated by comparison between the five-county and 17-county groups, and the results were cross-verified by the opposite directions for confirmation. The NHMMs always explicitly used local climate forcing as inputs for each county, and then yielded NDVI results for each county. This way, the results for the application counties would reflect the grazing impacts, as at the counties where the model was calibrated, implicitly through parameters. Therefore, we hypothesized that the difference in the results and model performance of the NHMMs would reflect the livestock density that differs between model calibration and application counties. In S1, the simulated standardized
If we denote
where
For S2, the relationship between
For both scenarios, we assumed that
Consistent with the definition of ecological resilience (Holling, 1973), vegetation sensitivity to grazing was defined as the ratio of change in vegetation to change in livestock density:
where
It was assumed that vegetation sensitivity to grazing was a function of climate forcing. Therefore, vegetation sensitivity to grazing was evaluated at different temperature-precipitation ranges.
Consistent with our hypothesis, the performance metric of the model used in this study, i.e. root-mean-square deviation (RMSE), correlated with livestock density. For S1, the performance of the five model applications became worse when they were migrated to counties with increasing livestock density (Figure 2A). Meanwhile, for the models calibrated in counties that had the highest grazing density (S2), model performance became worse in counties that had less grazing density (Figure 2B). The results suggested that the livestock density was a strong controlling factor of NDVI. As the results from the two scenarios yielded reliable cross-verification, we have general confidence that the model could detect the signal of the impacts of grazing.
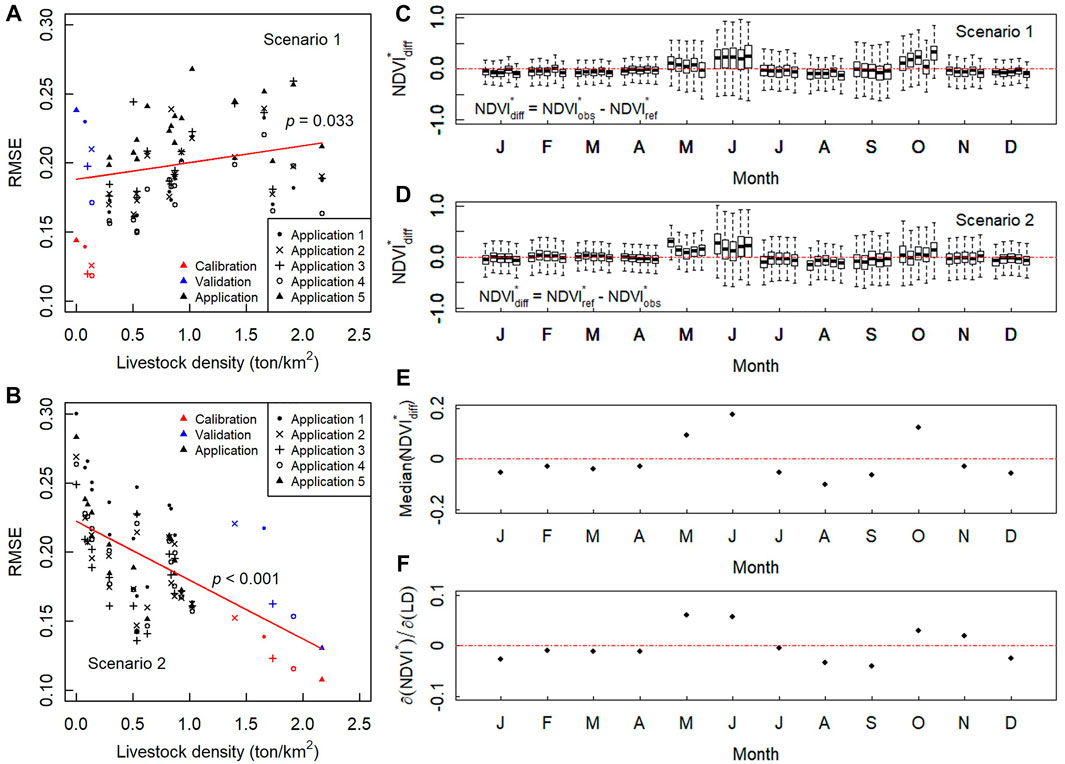
FIGURE 2. Attribution of grazing effects. (A) RMSE for S1; (B) RMSE for S2; (C)
We attributed the difference in standardized NDVI (
Since
With these results, we quantified the seasonal grazing effects on rangeland NDVI for the TRHR, and only focused on the growing season. After recovering
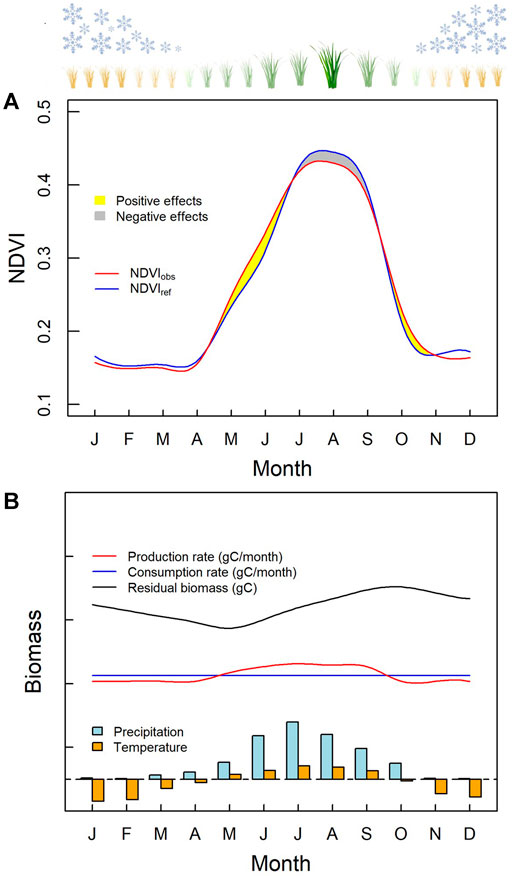
FIGURE 3. Seasonal grazing effects on vegetation. (A) Seasonality of grazing effects on NDVI; (B) Seasonality of grazing effects on biomass. The reference NDVI (
It is appropriate to note, at this point, that NDVI is an index of the earth surface’s status of greenness (Nemani et al., 2003; Tucker et al., 2005). Grazing effects on increasing NDVI values in the early and late growing season are partly benefited from the exposure of chlorophyll-rich grass parts. This, however, does not guarantee the improvement of grassland productivity and ecology. An effective quantification of grassland productivity is biomass production. Here, we proposed a conceptual diagram to illustrate the seasonal processes of biomass production rate, grazing consumption rate, and residual biomass (Figure 3B). During the growing season, the mean temperature was above zero and the amount of precipitation constituted most of a year. The biomass production rate was estimated from NDVI using the empirical relationship (Zhao and Running, 2010), and the grazing consumption rate was assumed to be constant, for the simplicity. The residual biomass was calculated from the accumulated difference between the biomass production rate and the grazing consumption rate. Within an annual cycle, the production rate of biomass only exceeded the grazing consumption rate during the middle of the growing season. Therefore, the residual biomass reached its maximum after maximum NDVI appeared in July or August without any coverage.
From biomass point of view, the sustainability of rangeland is determined by considering whether the maximum residual biomass, reached in the late growing season, is sufficient for grazing until biomass production surplus occurs in the next growing season. Both climate and grazing factors influence the accumulation for the maximum residual biomass. The climate is related to the biomass production, and the grazing is linked with the biomass consumption. To represent the maximum residual biomass by NDVI, as well as the grazing effects on biomass, the best indicator is the NDVI in August. This is because August is the closest month before the maximum biomass appears in September and has the maximum in both NDVI value and grazing effects on NDVI.
In view of this, we plotted the monthly mean NDVI anomaly (
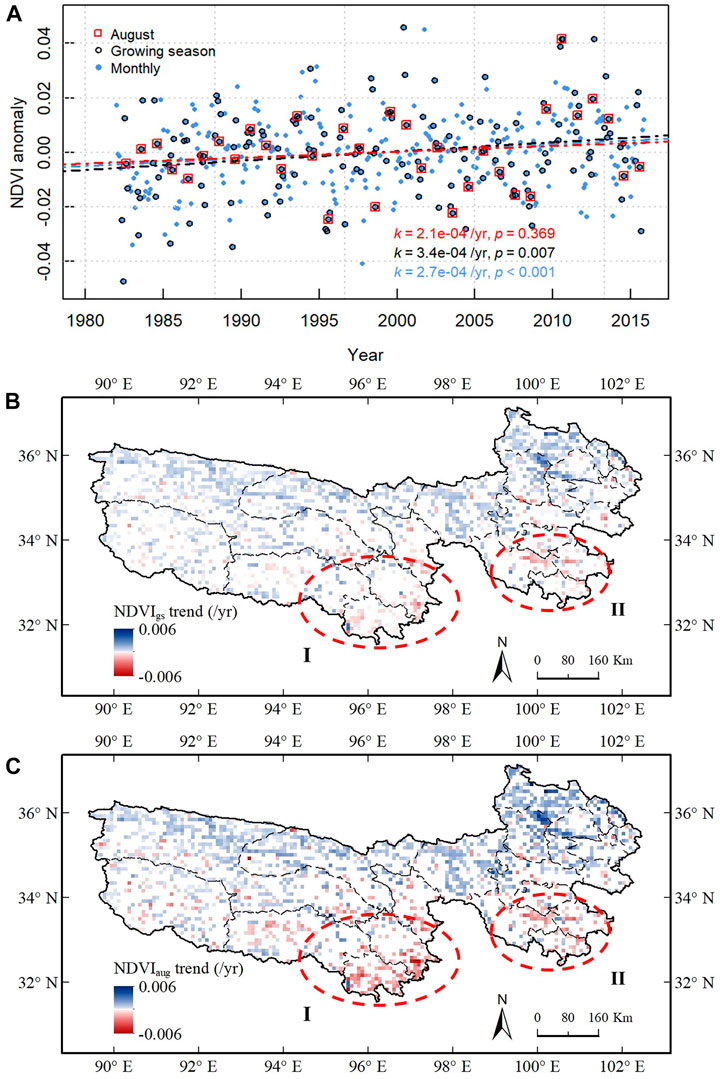
FIGURE 4. Assessment of grazing pressure on vegetation. (A) Inter-annual trends of
Underestimation of the grazing effects by using
The positive grazing effects in the beginning and end of the growing season would offset the negative grazing effects on NDVI. However, they had little to do with biomass production and accumulation. Therefore, when the overall whole-year or growing-season trend was used to investigate the rangeland sustainability, it might have given an illusion that the climate change benefit overwhelmed the grazing impacts. This might not be true, however; the grassland condition index that represented the yearly biomass surplus best, i.e., August NDVI, did not have a significant increasing trend.
The difficulty in assessing the effects of grazing also emphasizes the need to better understand the climate change effects on vegetation. Grazing activities regulate the responses of the grassland to climate change, even if biomass is used instead of NDVI. Because remotely-sensed biomass is also derived from NDVI, the underlying relationship between NDVI (for greenness) and biomass (for production) is widely evaluated for different vegetation types and seasons (Hansen and Schjoerring, 2003; Wessels et al., 2006); however, grazing and other human activities can change the NDVI-biomass relationship by reducing biomass and shifting the phenological process (Li et al., 2019b), with inconsistent change in greenness. Unfortunately, this has seldom been considered in studies evaluating the large-scale effects of climate change on vegetation, which requires some modifications to consider the grazing effects. Particularly, since the seasonality in grazing effects changes the NDVI-biomass relationships, modifications to the existing relationships should be different for different seasons, and even for different months.
Finally, we examined the historical trend of grazing effects and also whether the rangeland ecosystem would be sustainable in the future. For Figure 5A, each boxplot represents August
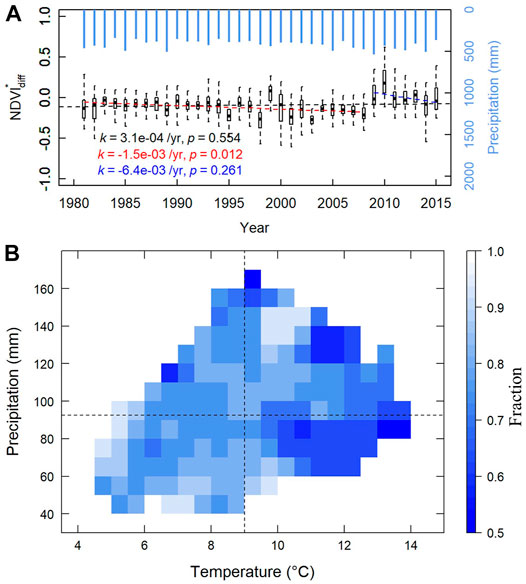
FIGURE 5. Trend and sensitivity of grazing impacts on August NDVI. (A) Inter-annual trend of August
This research revealed the seasonal grazing effects on rangeland NDVI, biomass, and its sustainability in the TRHR on the Qinghai-Tibet Plateau. It also revealed the possible underestimation of grazing effects when the growing-season or whole-year NDVI values were used in evaluation, as what has normally been done in most studies. The seasonality in grazing effects on NDVI also brought uncertainties in the application of the existing NDVI-biomass relationships to derive biomass data products, which have commonly been used for climate change impact assessment. Although climate change has been found to provide more favorable conditions for grassland on the Qinghai-Tibet Plateau, the grazing effects have been generally negative and their magnitude still growing. Therefore, the sustainability of the rangeland ecosystem might degrade, provided grazing intensity continues to rise and warming temperature causes droughts in some regions by increasing the evapotranspiration demands. While there is a broad consensus among researchers that climate in the future will continue to change, evidence shows that the relationship between temperature and vegetation activity is weakening for the boreal region (Piao et al., 2014). Therefore, more attention should be paid to the combined effects of climate change and human activities on those fragile vegetation ecosystems. Further experimental and field observations will help to improve our statistical model and disclose the fundamental physics of the problem. This would constitute our future work.
The original contributions presented in the study are included in the article/Supplementary Material, further inquiries can be directed to the corresponding authors.
CC, TL, and GW conceived the initial idea, CC and TL performed the analysis, CC, BS, AS, JA, LZ, and GW contributed to the manuscript, TL and GW provided the funding.
This study was funded by the Major Project of Qinghai Provincial Department of Science and Technology (2021-SF-A6), the State Key Laboratory of Hydroscience and Engineering of Tsinghua University (2017-KY-04), and the National Key Research and Development Program of China (2016YFE0201900, 2017YFC0403600).
The authors declare that the research was conducted in the absence of any commercial or financial relationships that could be construed as a potential conflict of interest.
All claims expressed in this article are solely those of the authors and do not necessarily represent those of their affiliated organizations, or those of the publisher, the editors and the reviewers. Any product that may be evaluated in this article, or claim that may be made by its manufacturer, is not guaranteed or endorsed by the publisher.
The Supplementary Material for this article can be found online at: https://www.frontiersin.org/articles/10.3389/fenvs.2021.797971/full#supplementary-material
Albon, S. D., and Langvatn, R. (1992). Plant Phenology and the Benefits of Migration in a Temperate Ungulate. Oikos 65, 502–513. doi:10.2307/3545568
Center for International Earth Science Information Network - CIESIN - Columbia University (2018). Gridded Population of the World, Version 4 (GPWv4): Population Density, Revision 11. Palisades, NY: NASA Socioeconomic Data and Applications Center. doi:10.7927/H49C6VHW
Chen, C., Li, T., Sivakumar, B., Li, J., and Wang, G. (2020). Attribution of Growing Season Vegetation Activity to Climate Change and Human Activities in the Three-River Headwaters Region, China. J. Hydroinform. 22, 186–204. doi:10.2166/hydro.2019.003
Chen, H., Zhu, Q., Peng, C., Wu, N., Wang, Y., Fang, X., et al. (2013). The Impacts of Climate Change and Human Activities on Biogeochemical Cycles on the Qinghai-Tibetan Plateau. Glob. Change Biol. 19, 2940–2955. doi:10.1111/gcb.12277
de Jong, R., Schaepman, M. E., Furrer, R., De Bruin, S., and Verburg, P. H. (2013). Spatial Relationship between Climatologies and Changes in Global Vegetation Activity. Glob. Change Biol. 19, 1953–1964. doi:10.1111/gcb.12193
Dee, D. P., Uppala, S. M., Simmons, A. J., Berrisford, P., Poli, P., Kobayashi, S., et al. (2011). The ERA-Interim Reanalysis: Configuration and Performance of the Data Assimilation System. Q.J.R. Meteorol. Soc. 137, 553–597. doi:10.1002/qj.828
Friedl, M. A., Sulla-Menashe, B., Schneider, A., Ramankutty, N., Sibley, A., and Huang, X. (2010). Sulla-MenasheMODIS Collection 5 Global Land Cover: Algorithm Refinements and Characterization of New Datasets. Remote Sensing Environ. 114, 168–182. doi:10.1016/j.rse.2009.08.016
Funk, C., Peterson, P., Landsfeld, M., Pedreros, D., Verdin, J., Shukla, S., et al. (2015). The Climate Hazards Infrared Precipitation with Stations-A New Environmental Record for Monitoring Extremes. Sci. Data 2, 150066. doi:10.1038/sdata.2015.66
Ge, W., Deng, L., Wang, F., and Han, J. (2021). Quantifying the Contributions of Human Activities and Climate Change to Vegetation Net Primary Productivity Dynamics in China from 2001 to 2016. Sci. Total Environ. 773, 145648. doi:10.1016/j.scitotenv.2021.145648
Han, Z., Song, W., Deng, X., and Xu, X. (2018). Grassland Ecosystem Responses to Climate Change and Human Activities within the Three-River Headwaters Region of China. Sci. Rep. 8, 9079. doi:10.1038/s41598-018-27150-5
Hansen, P. M., and Schjoerring, J. K. (2003). Reflectance Measurement of Canopy Biomass and Nitrogen Status in Wheat Crops Using Normalized Difference Vegetation Indices and Partial Least Squares Regression. Remote Sensing Environ. 86, 542–553. doi:10.1016/s0034-4257(03)00131-7
Hebblewhite, M., Merrill, E., and McDermid, G. (2008). A Multi-Scale Test of the Forage Maturation Hypothesis in a Partially Migratory Ungulate Population. Ecol. Monogr. 78, 141–166. doi:10.1890/06-1708.1
Holben, B. N. (1986). Characteristics of Maximum-Value Composite Images from Temporal AVHRR Data. Int. J. Remote Sensing 7, 1417–1434. doi:10.1080/01431168608948945
Holling, C. S. (1973). Resilience and Stability of Ecological Systems. Annu. Rev. Ecol. Syst. 4, 1–23. doi:10.1146/annurev.es.04.110173.000245
Holsclaw, T., Greene, A. M., Robertson, A. W., and Smyth, P. (2016). A Bayesian Hidden Markov Model of Daily Precipitation over South and East Asia. J. Hydrometeorol. 17, 3–25. doi:10.1175/Jhm-D-14-0142.1
Holsclaw, T., Greene, A. M., Robertson, A. W., and Smyth, P. (2017). Bayesian Nonhomogeneous Markov Models via Pólya-Gamma Data Augmentation with Applications to Rainfall Modeling. Ann. Appl. Stat. 11, 393–426. doi:10.1214/16-aoas1009
Hughes, J. P., and Guttorp, P. (1994). A Class of Stochastic Models for Relating Synoptic Atmospheric Patterns to Regional Hydrologic Phenomena. Water Resour. Res. 30, 1535–1546. doi:10.1029/93wr02983
Hughes, J. P., Guttorp, P., and Charles, S. P. (1999). A Non‐homogeneous Hidden Markov Model for Precipitation Occurrence. J. R. Stat. Soc. Ser. C (Applied Statistics) 48, 15–30. doi:10.1111/1467-9876.00136
Huntzinger, D. N., Schwalm, C., Michalak, A. M., Schaefer, K., King, A. W., Wei, Y., et al. (2013). The North American Carbon Program Multi-Scale Synthesis and Terrestrial Model Intercomparison Project - Part 1: Overview and Experimental Design. Geosci. Model. Dev. 6, 2121–2133. doi:10.5194/gmd-6-2121-2013
Klein, J. A., Harte, J., and Zhao, X.-Q. (2007). Experimental Warming, Not Grazing, Decreases Rangeland Quality on the Tibetan Plateau. Ecol. Appl. 17, 541–557. doi:10.1890/05-0685
Kohli, M., Mijiddorj, T. N., Suryawanshi, K. R., Mishra, C., Boldgiv, B., and Sankaran, M. (2021). Grazing and Climate Change Have Site‐dependent Interactive Effects on Vegetation in Asian Montane Rangelands. J. Appl. Ecol. 58, 539–549. doi:10.1111/1365-2664.13781
Li, C., de Jong, R., Schmid, B., Wulf, H., and Schaepman, M. E. (2019a). Spatial Variation of Human Influences on Grassland Biomass on the Qinghai-Tibetan Plateau. Sci. Total Environ. 665, 678–689. doi:10.1016/j.scitotenv.2019.01.321
Li, G., Jiang, C., Cheng, T., and Bai, J. (2019b). Grazing Alters the Phenology of alpine Steppe by Changing the Surface Physical Environment on the Northeast Qinghai-Tibet Plateau, China. J. Environ. Manage. 248, 109257. doi:10.1016/j.jenvman.2019.07.028
Li, L., Zhang, Y., Liu, L., Wu, J., Li, S., Zhang, H., et al. (2018a). Current Challenges in Distinguishing Climatic and Anthropogenic Contributions to alpine Grassland Variation on the Tibetan Plateau. Ecol. Evol. 8, 5949–5963. doi:10.1002/ece3.4099
Li, P., Peng, C., Wang, M., Luo, Y., Li, M., Zhang, K., et al. (2018b). Dynamics of Vegetation Autumn Phenology and its Response to Multiple Environmental Factors from 1982 to 2012 on Qinghai-Tibetan Plateau in China. Sci. Total Environ. 637-638, 855–864. doi:10.1016/j.scitotenv.2018.05.031
Li, W., Li, X., Zhao, Y., Zheng, S., and Bai, Y. (2018c). Ecosystem Structure, Functioning and Stability under Climate Change and Grazing in Grasslands: Current Status and Future Prospects. Curr. Opin. Environ. Sustainability 33, 124–135. doi:10.1016/j.cosust.2018.05.008
Mårell, A., Hofgaard, A., and Danell, K. (2006). Nutrient Dynamics of Reindeer Forage Species along Snowmelt Gradients at Different Ecological Scales. Basic Appl. Ecol. 7, 13–30. doi:10.1016/j.baae.2005.04.005
McKenna, C. M., Maycock, A. C., Forster, P. M., Smith, C. J., and Tokarska, K. B. (2021). Stringent Mitigation Substantially Reduces Risk of Unprecedented Near-Term Warming Rates. Nat. Clim. Change 11, 126–131. doi:10.1038/s41558-020-00957-9
Mysterud, A., Hessen, D. O., Mobæk, R., Martinsen, V., Mulder, J., and Austrheim, G. (2011). Plant Quality, Seasonality and Sheep Grazing in an alpine Ecosystem. Basic Appl. Ecol. 12, 195–206. doi:10.1016/j.baae.2011.03.002
Na, L., Genxu, W., Yan, Y., Yongheng, G., and Guangsheng, L. (2011). Plant Production, and Carbon and Nitrogen Source Pools, Are Strongly Intensified by Experimental Warming in alpine Ecosystems in the Qinghai-Tibet Plateau. Soil Biol. Biochem. 43, 942–953. doi:10.1016/j.soilbio.2011.01.009
Nemani, R. R., Keeling, C. D., Hashimoto, H., Jolly, W. M., Piper, S. C., Tucker, C. J., et al. (2003). Climate-driven Increases in Global Terrestrial Net Primary Production from 1982 to 1999. Science 300, 1560–1563. doi:10.1126/science.1082750
O’Neill, B. C., and Nakicenovic, N. (2008). Learning from Global Emissions Scenarios. Environ. Res. Lett. 3, 045014. doi:10.1088/1748-9326/3/4/045014
Pettitt, A. N. (1979). A Non-parametric Approach to the Change-point Problem. Appl. Stat. 28, 126–135. doi:10.2307/2346729
Piao, S., Nan, H., Huntingford, C., Ciais, P., Friedlingstein, P., Sitch, S., et al. (2014). Evidence for a Weakening Relationship between Interannual Temperature Variability and Northern Vegetation Activity. Nat. Commun. 5, 5018. doi:10.1038/ncomms6018
Ren, H., Han, G., Lan, Z., Wan, H., Schönbach, P., Gierus, M., et al. (2016). Grazing Effects on Herbage Nutritive Values Depend on Precipitation and Growing Season in Inner Mongolian Grassland. Jpecol 9, 712–723. doi:10.1093/jpe/rtw011
Seddon, A. W. R., Macias-Fauria, M., Long, P. R., Benz, D., and Willis, K. J. (2016). Sensitivity of Global Terrestrial Ecosystems to Climate Variability. J. Plant Ecol. 531, 229–232. doi:10.1038/nature16986
Tang, L., Zhong, L., Xue, K., Wang, S., Xu, Z., Lin, Q., et al. (2019). Warming Counteracts Grazing Effects on the Functional Structure of the Soil Microbial Community in a Tibetan Grassland. Soil Biol. Biochem. 134, 113–121. doi:10.1016/j.soilbio.2019.02.018
Tucker, C. J., Pinzon, J. E., Brown, M. E., Slayback, D. A., Pak, E. W., Mahoney, R., et al. (2005). An Extended AVHRR 8‐km NDVI Dataset Compatible with MODIS and SPOT Vegetation NDVI Data. Int. J. Remote Sensing 26, 4485–4498. doi:10.1080/01431160500168686
Väisänen, M., Ylänne, H., Kaarlejärvi, E., Sjögersten, S., Olofsson, J., Crout, N., et al. (2014). Consequences of Warming on Tundra Carbon Balance Determined by Reindeer Grazing History. Nat. Clim. Change 4, 384–388. doi:10.1038/nclimate2147
Viovy, N., and Saint, G. (1994). Hidden Markov Models Applied to Vegetation Dynamics Analysis Using Satellite Remote Sensing. IEEE Trans. Geosci. Remote Sensing 32, 906–917. doi:10.1109/36.298019
Wang, S., Duan, J., Xu, G., Wang, Y., Zhang, Z., Rui, Y., et al. (2012). Effects of Warming and Grazing on Soil N Availability, Species Composition, and ANPP in an alpine Meadow. Ecology 93, 2365–2376. doi:10.1890/11-1408.1
Wei, D., Zhao, H., Zhang, J., Qi, Y., and Wang, X. (2020). Human Activities Alter Response of alpine Grasslands on Tibetan Plateau to Climate Change. J. Environ. Manage. 262, 110335. doi:10.1016/j.jenvman.2020.110335
Wessels, K. J., Prince, S. D., Zambatis, N., Macfadyen, S., Frost, P. E., and Van Zyl, D. (2006). Relationship between Herbaceous Biomass and 1‐km2 Advanced Very High Resolution Radiometer (AVHRR) NDVI in Kruger National Park, South Africa. Int. J. Remote Sensing 27, 951–973. doi:10.1080/01431160500169098
Xu, X., Luo, Y., Shi, Z., Zhou, X., and Li, D. (2014). Consistent Proportional Increments in Responses of Belowground Net Primary Productivity to Long-Term Warming and Clipping at Various Soil Depths in a Tallgrass Prairie. Oecologia 174, 1045–1054. doi:10.1007/s00442-013-2828-z
Zhang, Y., Gao, Q., Dong, S., Liu, S., Wang, X., Su, X., et al. (2015). Effects of Grazing and Climate Warming on Plant Diversity, Productivity and Living State in the alpine Rangelands and Cultivated Grasslands of the Qinghai-Tibetan Plateau. Rangel. J. 37, 57–65. doi:10.1071/rj14080
Zhang, Y., Zhang, C., Wang, Z., Chen, Y., Gang, C., An, R., et al. (2016). Vegetation Dynamics and its Driving Forces from Climate Change and Human Activities in the Three-River Source Region, China from 1982 to 2012. Sci. Total Environ. 563-564, 210–220. doi:10.1016/j.scitotenv.2016.03.223
Zhao, M., and Running, S. W. (2010). Drought-Induced Reduction in Global Terrestrial Net Primary Production from 2000 through 2009. Science 329, 940–943. doi:10.1126/science.1192666
Zheng, Y., Han, J., Huang, Y., Fassnacht, S. R., Xie, S., Lv, E., et al. (2018). Vegetation Response to Climate Conditions Based on NDVI Simulations Using Stepwise Cluster Analysis for the Three-River Headwaters Region of China. Ecol. Indicators 92, 18–29. doi:10.1016/j.ecolind.2017.06.040
Keywords: climate change, grazing, vegetation, sustainability, qinghai-tibet plateau
Citation: Chen C, Li T, Sivakumar B, Sharma A, Albertson JD, Zhang L and Wang G (2021) Combined Effects of Warming and Grazing on Rangeland Vegetation on the Qinghai-Tibet Plateau. Front. Environ. Sci. 9:797971. doi: 10.3389/fenvs.2021.797971
Received: 19 October 2021; Accepted: 08 November 2021;
Published: 02 December 2021.
Edited by:
Jaan H. Pu, University of Bradford, United KingdomReviewed by:
Lubo Liu, California State University, Fresno, United StatesCopyright © 2021 Chen, Li, Sivakumar, Sharma, Albertson, Zhang and Wang. This is an open-access article distributed under the terms of the Creative Commons Attribution License (CC BY). The use, distribution or reproduction in other forums is permitted, provided the original author(s) and the copyright owner(s) are credited and that the original publication in this journal is cited, in accordance with accepted academic practice. No use, distribution or reproduction is permitted which does not comply with these terms.
*Correspondence: Tiejian Li, bGl0aWVqaWFuQHRzaW5naHVhLmVkdS5jbg==
Disclaimer: All claims expressed in this article are solely those of the authors and do not necessarily represent those of their affiliated organizations, or those of the publisher, the editors and the reviewers. Any product that may be evaluated in this article or claim that may be made by its manufacturer is not guaranteed or endorsed by the publisher.
Research integrity at Frontiers
Learn more about the work of our research integrity team to safeguard the quality of each article we publish.