
95% of researchers rate our articles as excellent or good
Learn more about the work of our research integrity team to safeguard the quality of each article we publish.
Find out more
ORIGINAL RESEARCH article
Front. Environ. Sci. , 14 January 2022
Sec. Interdisciplinary Climate Studies
Volume 9 - 2021 | https://doi.org/10.3389/fenvs.2021.792918
This article is part of the Research Topic Vegetation Phenology and Response to Climate Change View all 8 articles
 Peijun Ju1,2,3
 Wenchao Yan1,2,3
 Jianliang Liu1,2
 Xinwei Liu1,2
 Liangfeng Liu1,2
 Yixin He1,2*
 Huai Chen1,2,4*
As a sensitive, observable, and comprehensive indicator of climate change, plant phenology has become a vital topic of global change. Studies about plant phenology and its responses to climate change in natural ecosystems have drawn attention to the effects of human activities on phenology in/around urban regions. The key factors and mechanisms of phenological and human factors in the process of urbanization are still unclear. In this study, we analyzed variations in xylophyta phenology in densely populated cities during the fast urbanization period of China (from 1963 to 1988). We assessed the length of the growing season affected by the temperature and precipitation. Temperature increased the length of the growing season in most regions, while precipitation had the opposite effect. Moreover, the plant-growing season is more sensitive to preseason climate factors than to annual average climate factors. The increased population reduced the length of the growing season, while the growing GDP increased the length of the growing season in most regions (8 out of 13). By analyzing the impact of the industry ratio, we found that the correlation between the urban management of emerging cities (e.g., Chongqing, Zhejiang, and Guizhou) and the growing season is more significant, and the impact is substantial. In contrast, urban management in most areas with vigorously developed heavy industry (e.g., Heilongjiang, Liaoning, and Beijing) has a weak and insignificant effect on plant phenology. These results indicate that different urban development patterns can influence urban plant phenology. Our results provide some support and new thoughts for future research on urban plant phenology.
In recent decades, the number of studies on plant phenology and the annual sequence of plant developmental stages, has increased rapidly, providing vital information about how ecosystems respond to climate change (Menzel et al., 2006; Chuine and Régnière, 2017; Chen et al., 2018; Stucky et al., 2018). The global surface temperature during 2011–2020 was 1.09 (0.95–1.20)°C higher than that during 1850–1900 (IPCC, 2021), strongly affecting phenological periods in terrestrial ecosystems (Linderholm, 2006; Rosenzweig et al., 2008; Richardson et al., 2013). The growing season lengthens as the average temperature rises (Steinaker and Wilson, 2008), thus, affecting life cycles, the seasonal variation of energy and water exchange, the carbon cycle, and aerosols formed between the surface of the land and the atmosphere (Ryu et al., 2008; Yang and Rudolf, 2010; Wolf et al., 2017; Fu et al., 2020). Satellite-based studies have revealed that the start of the growing season has been gradually earlier, and the end of the growing season has been delayed over the past 3 decades (Piao et al., 2006; Jeong et al., 2011; Zhu et al., 2012). This earlier start and later end of the growing season has been reported to coincide with a warming trend in recent decades (Peñuelas and Filella, 2001; Fu et al., 2015).
The establishment of the international phenological network has facilitated the collection and sharing of phenological data on a large and standardized scale (Templ et al., 2018). However, a variety of factors, such as poor observation conditions (e.g., clouds, snow, and ice), bidirectional reflection distribution function (BRDF) effects, and sensor shifts, may reduce the accuracy of the satellite-based large-scale estimation of plant phenological events (Pinzon and Tucker, 2014; Piao et al., 2019). It is necessary to establish an in situ observation network, which will help to synthesize the various factors. The urban and natural ecosystems differed in influencing plant phenology factors (Yoshie and Fukuda, 1994; Omoto and Aono, 2010), especially the temperature and precipitation in the vicinity of large and medium-sized urban agglomerations. In addition, human activities such as urbanization are essential factors affecting climate conditions, soil properties, hydrology, and ecosystem processes (Ren et al., 2018). Combined with increasing human activity, the causal relationship between biological trends and climate change is more complex (Parmesan and Yohe, 2003). Urbanization and other human activities also affect climate conditions, soil properties, hydrology, and ecosystem processes, so they also influence plant phenology (Ren et al., 2018). It is urgent to analyze it comprehensively.
Most previous studies in China have also suggested that the start of the growing season has an early trend, and there is a tendency of postponement at the end of it (Piao et al., 2006; Ma and Zhou, 2012). However, phenological changes differed among regions in China, and it is still controversial and remains unclear. After the 1980s, regional phenology changed due to regional climate differences. The spring phenology was advanced in northeast China, North China, and the Lower Reaches of the Yangtze River but was delayed in the east and southwest of the middle reaches of the Yangtze River (Ge et al., 2014). Most regional studies suggest that phenological changes are driven by temperature, but some areas, such as the Tibetan Plateau, are almost always related to precipitation and vegetation types (Yu et al., 2010; Shen et al., 2014).
Studies on plant phenology in China are insufficient, with fewer analyses than those in Europe and North America (Schwartz and Chen, 2002). Moreover, the IPCC AR4 global comprehensive assessment did not cover the study of plant phenological changes in China (IPCC, 2007). However, China is a very suitable region for studying plant phenology changes during urbanization. In the late 1970s, China implemented the reform and opening-up policy and established a market economy. Noticeable changes have taken place in all aspects of the urban economic structure of China, especially the economic development zone on the east coast (Li et al., 2005; Chen et al., 2007). The high concentration of central cities in the coastal areas and the large dispersion in the mainland are prominent features of the urban system of China (Zhou and Zhang, 2003). The Chinese Phenological Observation Network was established in 1963. In the early 1990s, systematic phenological observations gradually stopped, but valuable data were still left to support the study of phenology in this particular period (Ge, 2010). Nevertheless, there is little research on the influencing factors of plant phenology in these major urban agglomerations.
Analyzing the plant phenology and its influencing factors in eastern urban regions during the economic transition period of China (1963–1988), we aimed to solve the following problems: 1) changes in urban plant phenology during the rapid onset of urbanization in China, 2) the effects of climate factors and anthropogenic factors on plant phenology in the vicinity of cities in the fast urbanization period in China, and 3) the effects of different urban development routes on urban plant phenology.
Our study area covers the eastern coastal region of China (108°12′E∼135°05′E, 20°54′N∼53°33′N), including 13 provinces, which are distributed in three different zones (see Figure 1, zones II to IV). Zone II and zone III belong to the monsoon climate of medium latitudes, and zone IV belongs to the subtropical monsoon climate. They all have distinct seasons, with higher temperatures and more precipitation in summer. These three different zones belong to other vegetation types, including temperate coniferous and broadleaved mixed forest (zone II), warm temperate broadleaved deciduous forest (zone III), and subtropical evergreen broadleaved forest (zone IV). After data screening, we selected phenological records from 17 phenological observation sites (Figure 1), and these observation sites were located in parks or school gardens in cities. Zone II contains one site in Heilongjiang. Zone III contains one site in Liaoning, two in Beijing, three in Shandong, one in Shanxi, and one in Henan. Zone IV contains two sites in Jiangsu, one site in Zhejiang, one in Hunan, one in Chongqing, one in Guangxi, one in Guizhou, and one in Sichuan.
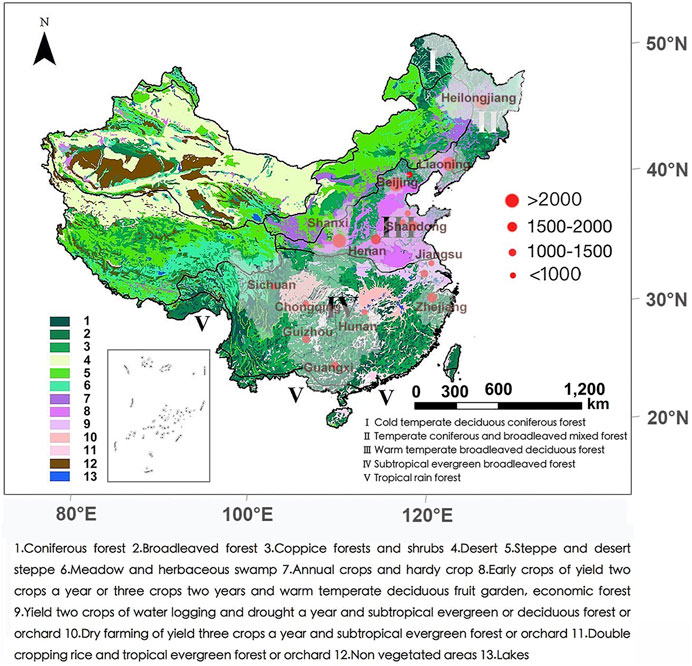
FIGURE 1. The distribution of sites and vegetation types in the study area. The red dots represent the selected sites, and their size represents the data volume of phenological data of sites. The different colors of the base map represent the different types of plants from the vegetation map of China (1:4,000,000) (Hou, 1983). The vegetation regionalization map of China (1:6,000,000) was provided by the Data Center for Resources and Environmental Sciences, Chinese Academy of Sciences (http://www.resdc.cn).
The phenological data come from the Chinese Phenological Observation Network (CPON) established in 1963 (http://www.geodata.cn), administered by the Institute of Geographical Sciences and Natural Resources Research (IGSNRR) and the Chinese Academy of Sciences (CAS). The weather data were collected by the Chinese Meteorological Agency (http://data.cma.cn/). Population and GDP figures come from the National Bureau of Statistics of China (https://data.stats.gov.cn/).
From the obtained data, we selected 17 observation sites with a cumulative observation time of more than 10 years from 1963 to 1988. After that, we selected data from the phenological data of these sites (see Supplementary Figure S1 for tree species information of each site) with plant species that had the entire germination stage (GES) and wilting stage (WIS). The length of the growing season (GSL) is derived from the date of the total discoloration of the leaves and the date of the beginning of the leafing.
The data we obtained were the average temperature at the monthly scale in China from 1963 to 1988. By averaging the monthly average of 12 months per year, we obtained the average annual temperature of each site from 1963 to 1988. On the regional scale, we obtained the average annual temperature of the region by calculating the average of all the sites. We also averaged the annual total precipitation for all the sites in the region as the annual total precipitation for the region. The temperature and precipitation from January to March and the temperature and rainfall from August to October are preseasonal climate factors.
We chose the population and GDP representing anthropogenic factors that are commonly used in other studies. Because city-scale demographic and economic statistics are not readily available for the observation sites, we obtained the total population and GDP of the provinces from 1963 to 1988. To compare differences between regions, we calculated the population per unit area of the site and further calculated GDP per capita. To further analyze the influence of human activities on urban plant phenology under different industrial structures, we also calculated the proportion of output value of the tertiary industry in each study area from 1963 to 1988. The ratio is obtained by calculating the third industry output and the total GDPs of each site.
The change in the phenological period was obtained by calculating the average GSL from 1963 to 1988 in the study area. After that, we calculated the annual mean temperatures and annual mean precipitation, and their changes from 1963 to 1988.
We calculated the average GSL of all species separately for the selected sites. Then we calculated annual mean temperatures and annual total precipitation. Afterward, the change rate in GSL was linearly correlated with changes in temperature and precipitation. To determine the main factors influencing plant phenology in urban areas, we also carried out correlation analyses between preseason climatic factors and phenological periods and between industry proportion and phenological periods. The annual rate of change of the germination stage and the wilting stage were obtained by calculating the mean value of the germination stage (we start the date of opening the leaflet as the germination stage) and the wilting stage (we use the date of the discoloration of the leaves as the wilting stage).
Due to the differences in area and population of each site, to increase the comparability between regions, we calculated the GDP per capita and population per unit area of all the study sites and calculated the rate of change of all the above datasets year by year. After that, we also calculated the annual change rates of the output value and total output value of the tertiary industry, which, together with the change rates of GDP and population, were used as anthropogenic factors and the length of the growing season for correlation analyses.
To discriminate the different effects of factors, linear fitting regressions of temperature, precipitation, population, and GDP were conducted with the GSL. The fitting results were tested for significance by the two-tailed method. The correlation coefficients were calculated by Pearson’s and Spearman’s rank correlation analyses. Significant differences in factor effects between the sites were obtained by one-way analysis of variance (ANOVA). In the correlation, a p-value less than 0.05 was considered significant, and a p value less than 0.01 was considered extremely significant. Principal component analysis (PCA) was used to determine the importance of influencing factors on the GSL in each sub-region. All data were statistically analyzed by IPM SPSS Statistics 22. The above analysis is presented by Origin pro 8 in the form of a figure. The spatial distribution of the correlation of linear analysis is a product made by ArcMap 10.5.
By calculating the annual mean temperature and the annual total precipitation over all study sites, we obtained their changes from 1963 to 1988 (Figure 2). The temperature changes in this period showed a trend in fluctuation and increase at the whole regional scale, with obvious inter-annual differences. The maximum annual mean temperature is 14.36°C, and the minimum value is 12.58°C. During this period, the precipitation showed a trend of fluctuation and decline at the scale of the whole area, and there was a great difference in precipitation between years. The maximum annual mean precipitation was 1,097.09 mm, with a minimum of 816.74 mm.
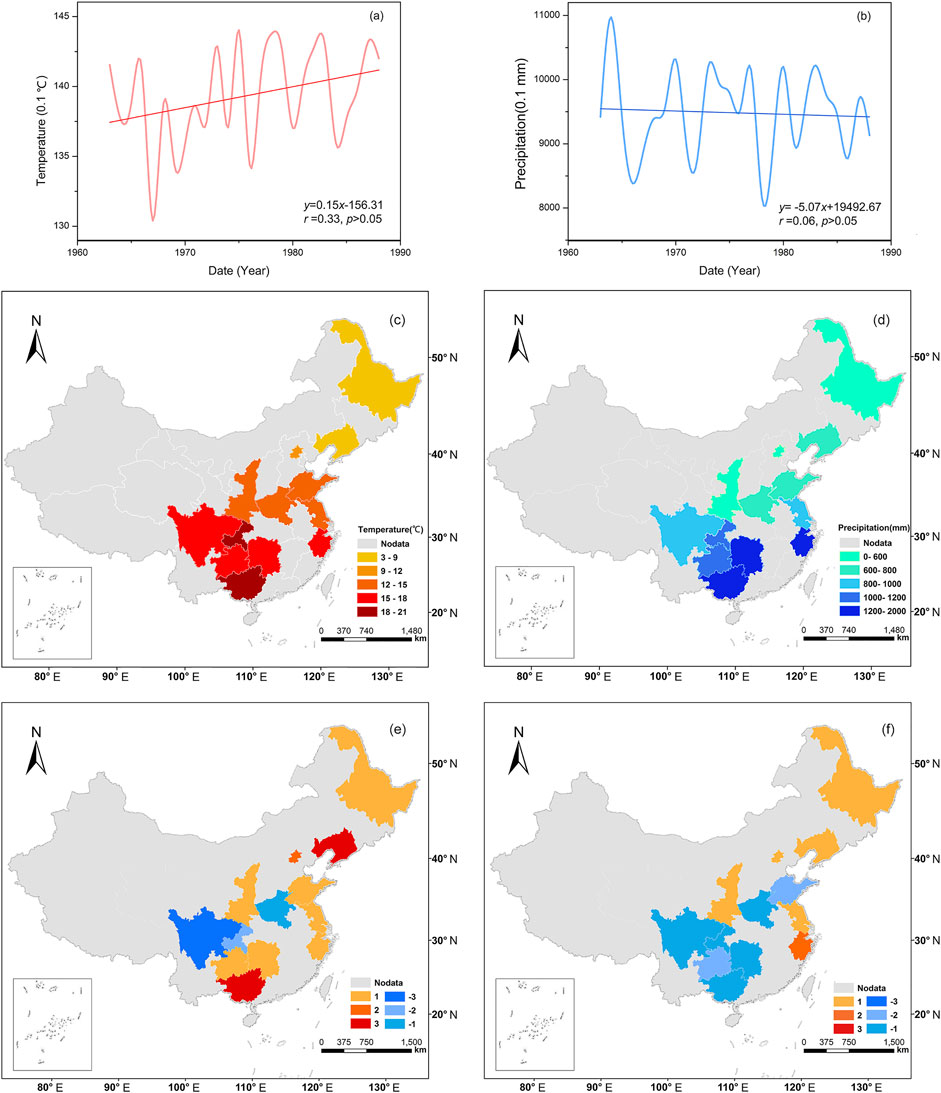
FIGURE 2. The spatiotemporal dynamics of climate at the study sites (1963–1988). (A) Inter-annual average temperature variation curves of the mean values across all study sites. (B) Inter-annual total precipitation variation curves of the mean values across all study sites, (C) Spatial distribution of mean annual temperature (MAT). (D) Spatial distribution of mean annual precipitation (MAP), (E) Spatial distribution of the change trend in MAT, (F) Spatial distribution of the change trend in MAP. The light gray areas in the figures represent the areas with no data; the blue area represents the declining trend; the red area represents the increasing trend, and the color from light to dark indicates the increasing significance (±1: p > 0.05, ±2: p < 0.05, ±3: p < 0.01).
Due to the influence of geographical location and topography, the climate of subregions in the whole area varies greatly. The average temperature in the subregion was the highest in Guangxi (19.31°C) and the lowest in Heilongjiang (3.64°C). The annual total precipitation of subregions was the highest in Guangxi (1,869.8 mm) and the lowest in Heilongjiang (530.7 mm). The temperature of most regions is increasing, and the most significant is in Guangxi and Liaoning. Three subregions showed a decreasing trend in temperature, namely, Sichuan, Chongqing, and Henan. Among them, the temperature decrease in Sichuan is the most significant. There are five sub-regions with increased rainfall, none of which is extremely significant, and only Zhejiang is significant. There are seven subregions with reduced rainfall, but decreased rainfall is significant only in Shandong and Guizhou. Overall, temporal variations in temperature are more significant than precipitation variations.
The temporal and spatial dynamics of anthropogenic factors in the study area were obtained by the statistics of population per unit area and GDP per capita of each sub-region each year (Figure 3; Supplementary Tables S1, and S2). The population increased from 28.45 million per unit area to 43.21 million per unit area, and the corresponding per capita GDP increased from 0.018 to 0.145.
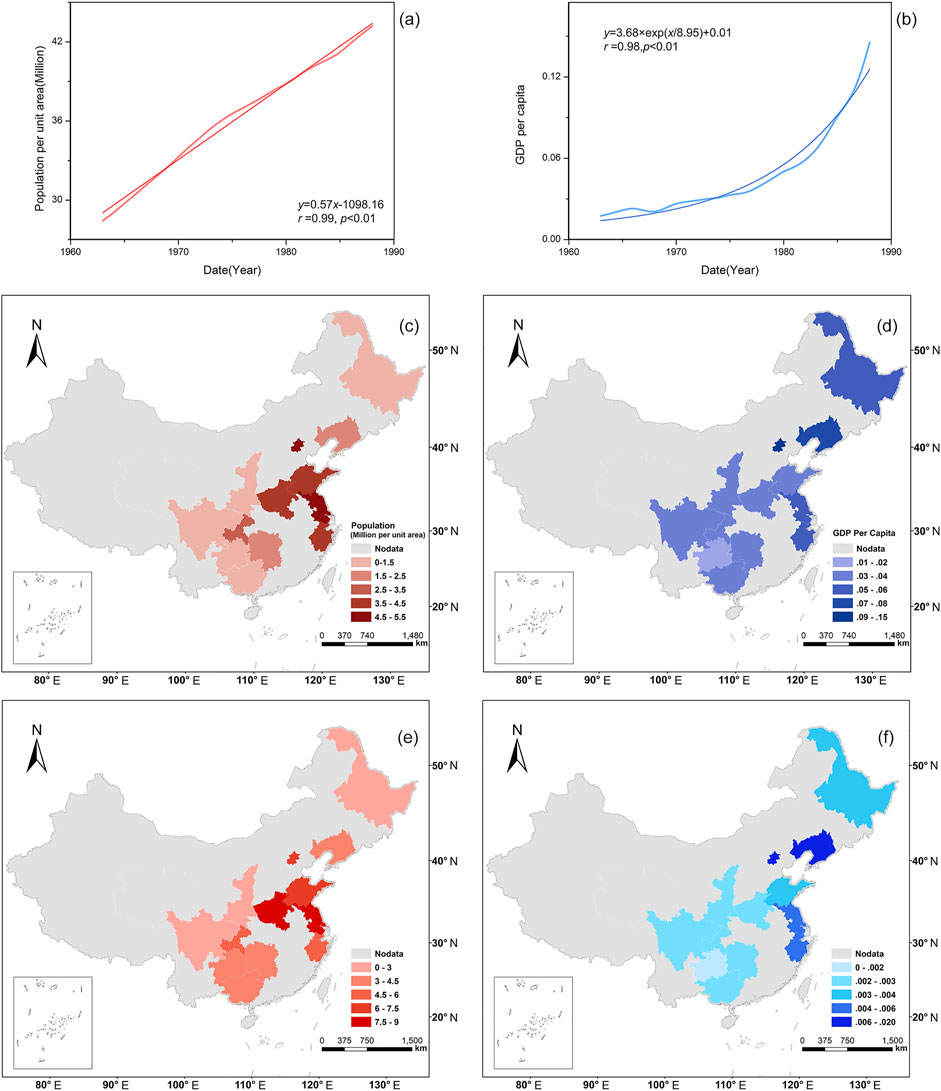
FIGURE 3. The spatiotemporal dynamics of human activities at the study sites (1963–1988). (A) Inter-annual population density variation curves. (B) Inter-annual GDP per capita variation curves. (C) Spatial distribution of mean annual population densities (MAPD). (D) Spatial distribution of mean annual GDP per capita (MAG). (E) spatial distribution of the change trend in MAPD. (F) Spatial distribution of the change trend in MAG. The light gray areas in the figures represent the areas with no data, and in (E) and (F), the color from light to dark indicates an increase in amplitude (p < 0.01).
Beijing is the most populous and developed, with unit area population and unit area GDP of 631.5 × 10⁴ km−2 and 244.2 × 10⁸ RMB km−2 in 1988, respectively. The northernmost province of Heilongjiang is the most sparsely populated, with a unit area population size of approximately 76.2 × 10⁴ km−2 in 1988. Its unit area GDP is slightly higher than that of Guizhou, only 12.1 × 10⁸ RMB km−2. In terms of quantitative sorting, the order of population and GDP in the eastern provinces of China was basically the same in 1988. In other words, it shows that densely populated cities are more developed.
The population growth and development of different provinces were quite different from 1963 to 1988. The population growth rate of Beijing was the greatest in all provinces, reaching 9.33 × 10⁴ km−2 year−1. Heilongjiang also has the lowest population growth rate of 0.95 × 10⁴ km−2 year−1. Although the population of the unit area in Henan is not particularly large, its growth rate is only second to that of Beijing. The fastest and slowest growth in GDP is Beijing and Heilongjiang, approximately 13.38 × 10⁸ and 0.63 × 10⁸ RMB km−2 year−1, respectively. We found that the rate of urban development was almost synchronous with the rate of population growth.
The temporal dynamics of plant phenology in 1963–1988 were calculated and analyzed based on the germination stage, wilting stage, and the length of the growing season of the woody plants (Figure 4; Supplementary Figures S1–S3). During the period from 1963 to 1988, the length of the growth season of the whole region ranged from 183.0 to 213.2 days, with an average of 200.1 days. The germination stage was concentrated on days 92.5–116.8 of each year, with an average of approximately 102.1, and the years with the largest variation were concentrated in 1976, 1980, and 1987. The wilting stage occurred on days 277.0–296.5 of each year, with an average of approximately 286.5, and the years with the largest variation were concentrated from 1974 to 1978.
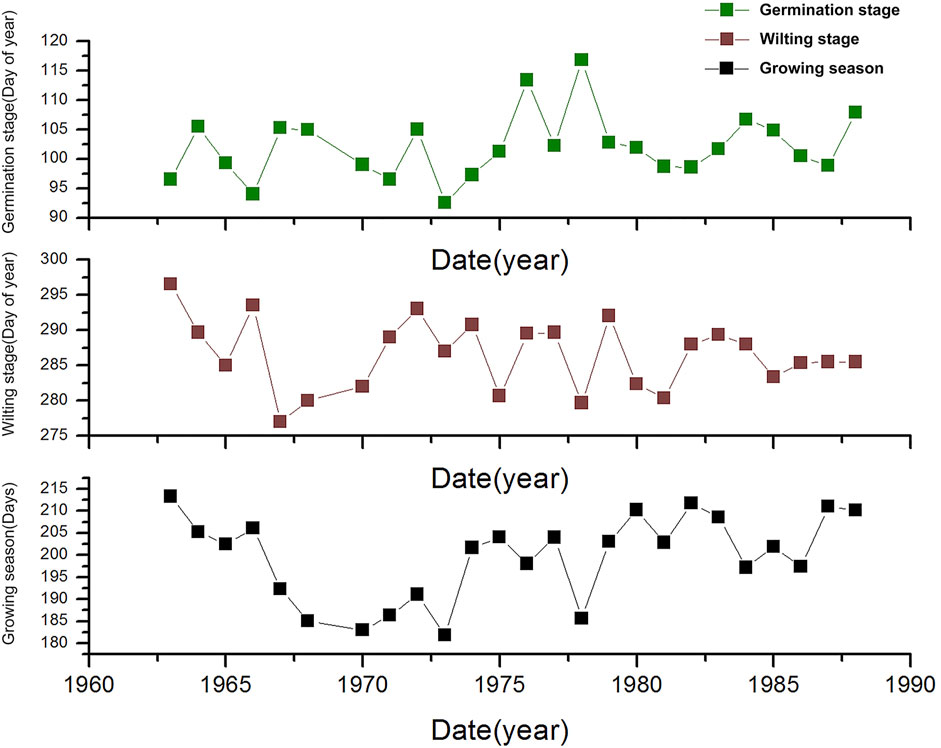
FIGURE 4. The temporal dynamics of the phenological period at the study sites (1963–1988). The green line is the inter-annual variation in the germination stage; the brown broken line shows the inter-annual variation in the wilting stage, and the black broken line shows the inter-annual variation in the length of the growing season.
The spatial dynamics of plant phenology were calculated and analyzed in sub-regions (Figure 5). Spatially, the germination stage showed an obvious pattern of gradual delays from north to south. Although there was a similar pattern for the wilting stage, the delay was less pronounced in the interior southwest. This reduced the increases in the length of the growing season in these southern subregions. Germination stages were delayed in all other sub regions except Guizhou. The variations in germination stages in northern subregions, such as Heilongjiang, Shanxi, and Liaoning, were not significant, while those in southern sub-regions, such as Guizhou, Guangxi, and Zhejiang, were significant, indicating regional differences between the north and the south. Coastal areas were more likely to wither earlier. Inland Chongqing and Hunan, however, experienced a significant delay in wilting. The growing season lengthened only in two northeast and two southwest subregions, especially in Chongqing and Guizhou.
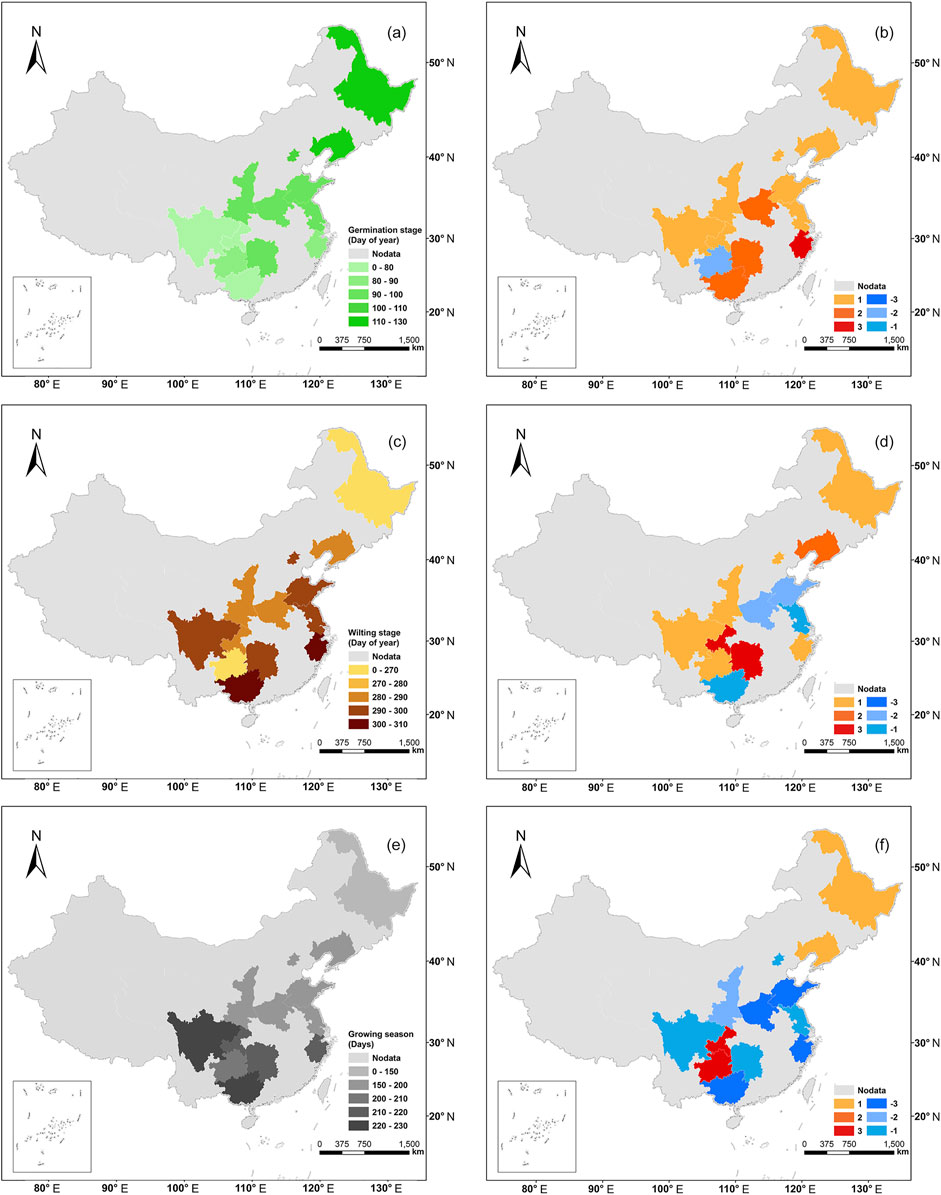
FIGURE 5. The spatial dynamics of the phenological period at the study sites (1963–1988). (A) Spatial distribution of germination stage. (B) Spatial distribution of the change trend in germination stage. (C) Spatial distribution of the wilting stage. (D) Spatial distribution of the change trend in the wilting stage. (E) Spatial distribution of the growing season. (F) Spatial distribution of the change trend in the growing season. The light gray areas in the figures represent the areas with no data. In(B), (D), and (F), the blue area represents the declining trend, while the red area represents the increasing trend, and the color from light to dark indicates increasing significance (±1: p > 0.05, ±2: p < 0.05, ±3: p < 0.01).
We conducted linear analyses of the annual mean temperature of each sub-region and the annual rate of the length of the growing season, and the average annual precipitation, population per unit area, and GDP per capita were similarly analyzed (Figure 6; Supplementary Table S3). We found that temperature changes were positively related to the length changes during the growing season in most regions. The most significant correlation sub-region was Beijing (slope = 0.523, R2 = 0.692, p < 0.01). Temperature had a great influence on the growth season of Guizhou, but the correlation was not significant (slope = 1.059, R2 = 0.009, p = 0.323). There were four southern sites that were negatively correlated with the length of the growing season, in Zhejiang, Guangxi, Sichuan, and Jiangsu (slope = −2.19, −0.899, −0.626, and −0.012, respectively).
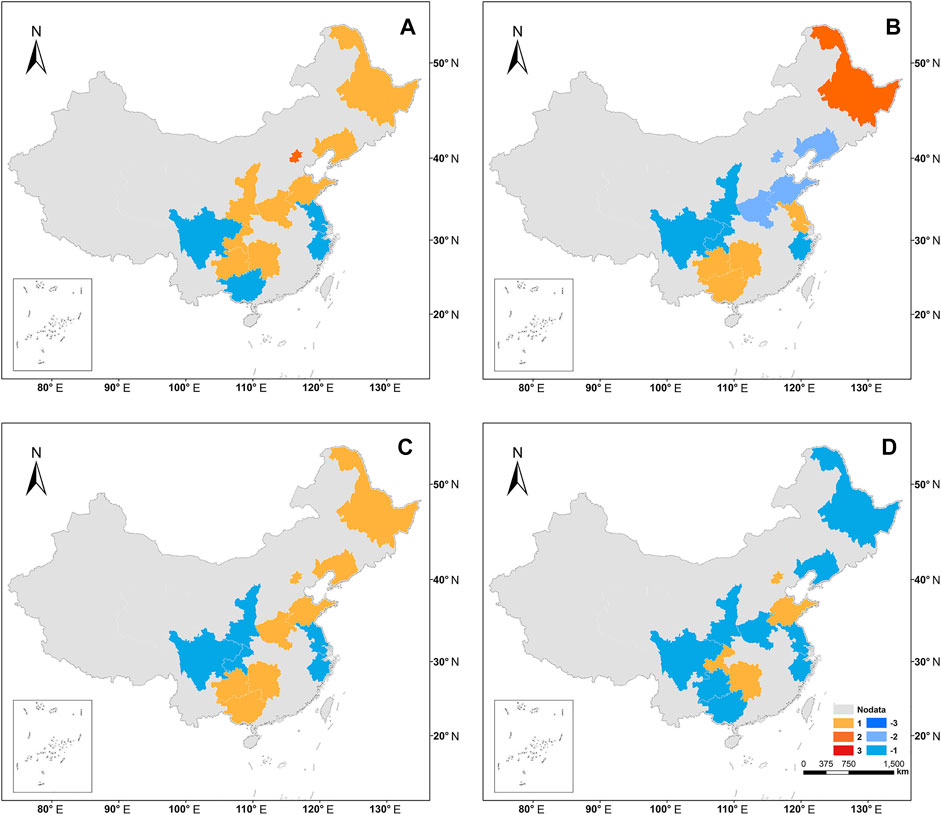
FIGURE 6. The effect of factors on the length of the growing season. Orange is negative, and green is positive. (A) Spatial distribution of the relationship between temperature and the length of the growing season. (B) Spatial distribution of the relationship between precipitation and the length of the growing season. (C) Spatial distribution of the relationship between GDP and the length of the growing season. (D) Spatial distribution of the relationship between population and the length of the growing season. The light gray areas in the figures represent the areas with no data. The blue area represents the declining trend, while the red area represents the increasing trend, and the color from light to dark indicates the increasing significance (±1: p > 0.05, ±2: p < 0.05, ±3: p < 0.01).
In contrast, the change in precipitation mainly caused the negative response of the growth season length in each subregion. Basically, all negative correlations occur in the Yellow River basin. Even positively correlated, the impact is not quite significant. Moreover, the influence of precipitation on the length of the growing season is obviously less than that of temperature, and the correlation is not significant in almost all subregions. Only Henan had a significant correlation among all the subregions (slope = −0.067, R = 0.232, p < 0.05).
The change in population leads to a positive change in the length of the growing season in most areas. The region most affected by the length of the growing season was Guangxi (slope = 24.826, R2 = 0.167, p < 0.05). Both the degree of change and the population size in this area are small. However, population change has no significant impact on the length of the growth season in Beijing.
In most areas, the increase in GDP led to a decline in the length of the growing season. At the same time, the most significant impact of the change in GDP is in Chongqing (slope = 1.434, R2 = 0.612, p < 0.01). In addition, although the correlation between the GDP of Henan and the length of the growing season was not significant (Slope = −0.291, R2 = 0.206, p = 0.059), it showed the best negative correlation.
The changes in population and GDP have had an un-ignorable impact on plant phenology in cities, and, in some areas, this effect has been even more significant than climate factors. Moreover, the impact of population is often higher than that of GDP. However, in terms of correlation, GDP is more correlated with the length of the growing season. At the same time, we also found that the linear analysis of population and GDP has a positive intercept on the X-axis. This indicates that the length of the growing season will not change under the GDP change of the quantity represented by these intercepts.
To better our understanding of the effects of climate factors on plant phenology, we conducted a correlation analysis of preseason climate factors with germination and wilting (Figure 7; Supplementary Table S4). The effects of preseason climatic factors on their phenological changes were different at each site. Temperature had a negative effect on germination in most regions, and their linearly correlated fitting lines intersected the coordinate axes at the positive half axis, i.e., germination was delayed when the temperature did not change. This shows that the preseason temperature rise leads to earlier germination. In the three northeastern sites, they presented a negative correlation. In addition, there are many different sites where, even though the preseason temperature effect is not strong, the average temperature has a high correlation (e.g., Guizhou, Shanxi, Chongqing). However, preseason precipitation and germination were mainly positive. This shows that the preseason precipitation decrease leads to earlier germination. In terms of correlation and impact strength, the preseason precipitation effect is similar to the preseason temperature (e.g., Liaoning, Chongqing, etc.).
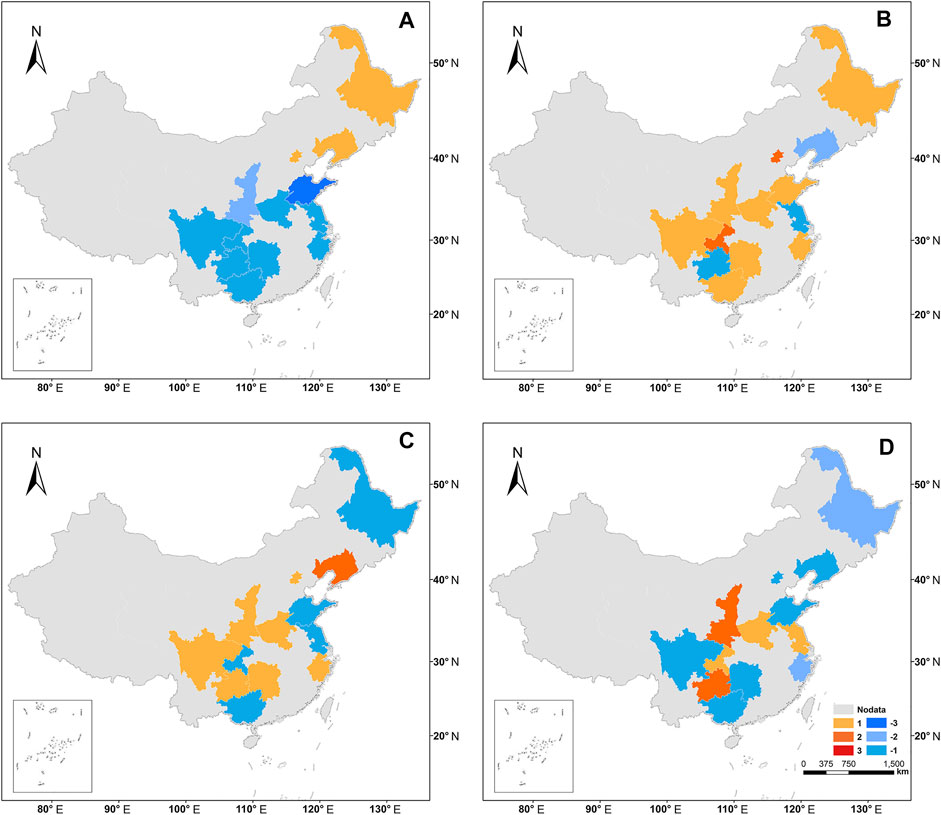
FIGURE 7. The effect of the preseason climate on the germination stage and the wilting stage. Orange is negative, and green is positive. (A) The spatial distribution of correlation between preseason temperature and germination stage. (B) The spatial distribution of correlation between preseason precipitation and germination stage. (C) The spatial distribution of correlation between preseason temperature and the wilting stage, and (D) the spatial distribution of correlation between preseason precipitation and wilting stage. The light gray areas in the figures represent the areas with no data. The blue area represents the declining trend, while the red area represents the increasing trend, and the color from light to dark indicates the increasing of significance (±1: p > 0.05, ±2: p < 0.05, ±3: p < 0.01).
For the wilting stage, the relationship between preseason climate factors and wilting was not as stark as that of germination. Among all of the subregions, Guizhou was the most affected by preseason temperature during the wilting stage. The most significant effect of precipitation on wilting was observed in Hunan. The effects of preseason climate factors on germination were more significant than those on wilting. At the same time, preseason temperature is more significant than preseason rainfall in most areas.
Since we found a high correlation between the length of the growing season and GDP in some subregions, we further analyzed the influence of industrial structure on phenology by analyzing the ratio of tertiary industry to GDP in each subregion and the correlation analyses between it and the length of the growing season (Figure 8; Supplementary Tables S5 and S6). We found a significant relationship between the tertiary sector ratio and the length of the growing season. However, the tertiary ratio has different effects on the length of the growing season in different regions. The tertiary ratio has a strong positive influence on the growing season in southern cities with late development, such as Chongqing, Zhejiang, and Guizhou (slope = 137.20, 149.22, 129.28, R2 = 0.207, 0.201, 0.338, p = 0.159, 0.082, 0.047). Most of the other subregions showed a negative correlation, among which Hunan and Henan were the most significant (slope = −60.68, −69.96, R2 = 0.221, 0.375, p = 0.105, 0.015).
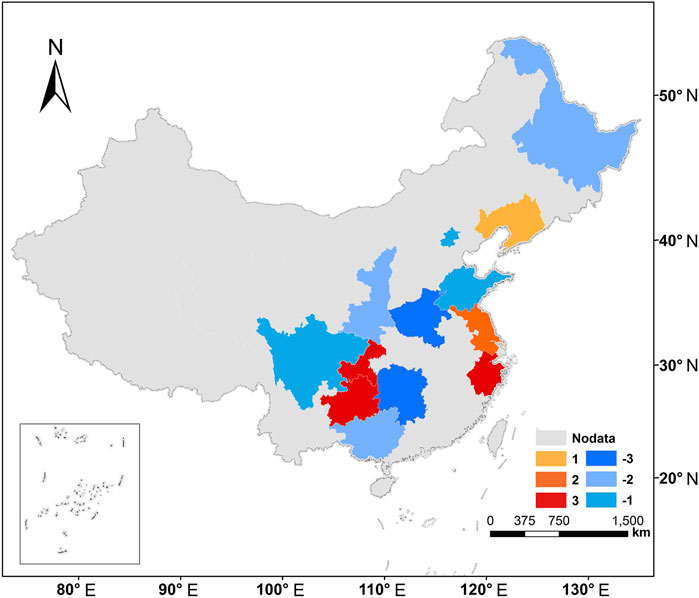
FIGURE 8. The effect of the ratio of tertiary industry to industry on the length of the growing season. The light gray areas in the figures represent the areas with no data. The blue area represents the declining trend, while the red area represents the increasing trend, and the color from light to dark indicates the increasing of significance (±1: p > 0.05, ±2: p < 0.05, ±3: p < 0.01).
Through our observation and analysis of the data, we found that even in the vicinity of an urban area, the results of most sites in the north still showed the obvious influence of temperature and precipitation on the phenological period of plants. The spatial distribution of the main factors affecting plant phenology in different regions was found through the calculation of the importance proportion of each factor affecting plant phenology (Figure 9). We found that the most important factor affecting plant phenology was temperature in Beijing, Shandong, Shaanxi, and Zhejiang, and the main impact factor was precipitation in Heilongjiang, Henan, and Sichuan. Although these major factors are not the only factors that affect the length of the growing season, for example, in Heilongjiang, temperature and GDP also have a non-negligible influence on the length of the growing season. Changes in population and GDP also have a significant impact in some subregions, and it is even more important than climate in some regions. In addition, the effect of population on the length of the plant-growing season tends to be more strongly related to GDP in more subregions. The main influencing factor is the population change in Guangxi and Guizhou. The main influencing factor is the change in GDP in Chongqing. The main influencing factors are the tertiary ratio in Hunan and Liaoning. No significant influencing factors were found in Jiangsu.
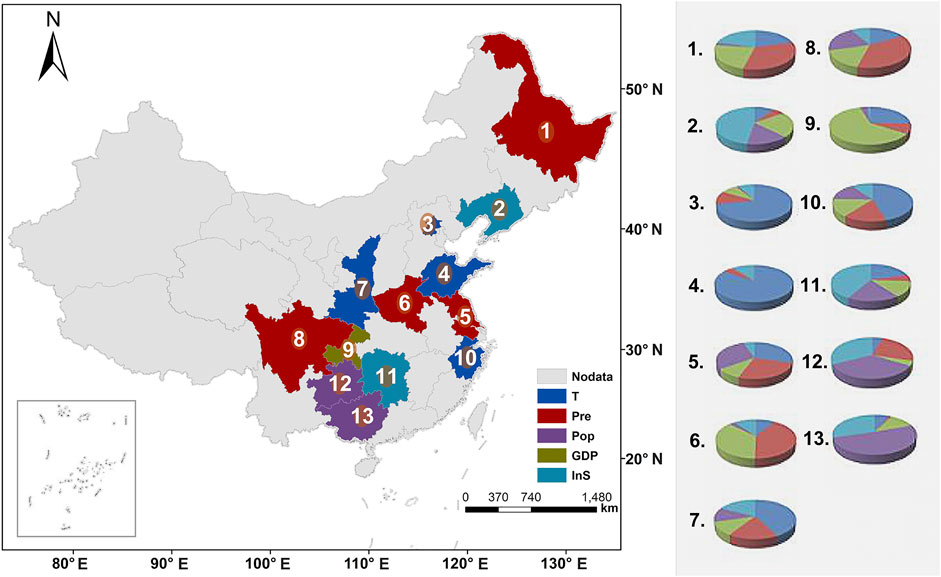
FIGURE 9. Spatial distribution of the main factors affecting the phenology of urban plants in the region. Different colors in the left figure indicate the main influencing factors of urban plant phenology in this subregion. The numbers in the figure on the right correspond to the subregions in the figure on the left, and each number corresponds to the pie chart to represent the contribution of each influencing factor affecting urban plant phenology in this region.
Climate change has widely affected urban plant phenology (Ren et al., 2018; Wohlfahrt et al., 2019). We found a significant correlation between plant phenology and warming, consistent with other studies, which indicated that higher temperatures lengthen growing seasons (Menzel, 2003; Badeck et al., 2004; Cleland et al., 2007). However, germination has been suggested to be more sensitive to daytime warming than nighttime warming, both at the species and ecosystem levels (Piao et al., 2015; Rossi and Isabel, 2017). Due to the acceleration of nighttime warming over the past few decades (Davy et al., 2017), any method of reflecting this asymmetric warming may lead to an underestimation of the temperature sensitivity at the start of the growing season.
Compared with non-populated western China (Chen et al., 2011; Shen et al., 2011), our study found that precipitation has no significant influence on plant phenology, unlike temperature, in eastern China (Figure 6B). In addition, our results suggested that the influence of precipitation in the north was more significant than in the south, with regional differences. The differences are probably affected by water status (Jaworski and Hilszczański, 2013). In the regions with abundant groundwater, the dependence on precipitation was weak, leading to a weak significant correlation (Ballestrini et al., 2010).
Studies have shown that some species are resilient to climate change, but different species respond at different rates (Burns et al., 2003; Visser et al., 2004; Visser and Both, 2005), reflected in our results by the fact that plant phenology is affected by the different climates and vegetation in the sub-regions. Temperature has a great influence on the length of the plant-growing season in Guizhou, especially the preseason temperature, with a significant correlation (germination and wilting). This may be caused by the special geographical location and climate conditions of Guizhou. Temperature there was lower at high altitudes (with an average altitude of 1,100 m); thus, its plant phenology was more sensitive to temperature fluctuations (Ke et al., 2016). In Zhejiang, Guangxi, and Sichuan, the negative correlation between temperature and growing season length of local plants suggested that the earlier start and end of the growing season caused by climate warming cannot compensate for each other. The germination stage of plants may not be temperature-restricted in these regions (Meng, 1988). The variation in growing season length in Beijing is significantly correlated with temperature but not significantly correlated with precipitation, and the reason for this may be that the large population of Beijing and economic development caused more heat (Zhou and Zhang, 2003; Li et al., 2005). Now that plant phenology in subregions such as Beijing is mainly affected by local climate change, including the urban heat island effect, and light effect (Jochner and Menzel, 2015; Li F. et al., 2017), more data support is needed to separate these human activities from climate change.
Urbanization affects plant phenology in different ecosystems (Roetzer et al., 2000; Zhou and Zhang, 2003; Li et al., 2005). Similar to other regions of the world, this phenomenon has occurred in China; for example, satellite data showed that urbanization in the Yangtze River Delta region also lengthens the growing season (Han et al., 2008). On the one hand, phenology is affected by the urban heat island effect (Zhang et al., 2004; Jochner and Menzel, 2015). On the other hand, our results showed that the changed population had a greater impact on urban plant phenology than GDP, which indirectly reflected the effect of heat increase caused by population change, consistent with previous studies (Li X. et al., 2017).
We found that plant phenology is more influenced by climate than human activity in some urbanized areas (Figure 9). The effects of urbanization on phenology vary with vegetation types (Li X. et al., 2017; Ren et al., 2018), but these regional differences are not just due to differences in the types of vegetation. Combined with our results and some results from other researchers (Yan-Ming et al., 2004; Jochner and Menzel, 2015; Gunawardena et al., 2017), the human management of urban plants has a critical impact on urban plant phenology. The industrial development of the emerging urban agglomeration was late, with a scientific economic structure, and the change in the proportion of the tertiary industry had a great impact on the length of growing season. This suggests that these cities may have invested more in urban plant management, which counteracted the effects of climate change on urban plant phenology (Supplementary Figure S4).
The rapid growth of the region despite a small population base gave rise to the lengthening of the growing season being most affected by population changes in Guangxi (Figure 9). With the approval of the central government, Guangxi urgently built and/or rebuilt 33 frontier highways in 1979, which greatly influenced local plant phenology (Wei, 1998). The subregion with the most significant impact of GDP change is Chongqing. Due to its unique location and strategic position, although this region is located in western inland China, the GDP increased significantly, which had a key important impact on the lengthened growing season of urban plants (Chen et al., 2007). In the context of global warming, management and policies (e.g., urban greening) should pay more attention to maintaining the stability of urban plant phenology.
Although we tried our best to select plant data from the same species for analyses, our data cannot fully represent the whole region due to the differences in vegetation types in large-scale cross-regional studies. Second, this study obtained data through field observations, and the sample size of selected sites and samples was smaller than that of other methods, such as remote sensing.
In addition, since the statistical data of the urban population and GDP cannot be obtained, the inter-annual changes in population and GDP per unit area of the sample point on the provincial scale were used to measure the changes in population and GDP. Such data are used to analyze their impact on plant phenology, which probably underestimates their impact on plant phenology due to the higher population and GDP in cities than in the countryside. In addition, the establishment of measurement standards for human factors is also of great research value, such as the establishment of urbanization index and land-use type change index, all of which need further research and exploration.
In 1963–1988, temperature change had a positive impact on the growth season length change of most cities in the study, or the higher the temperature was, the longer was the growth season. In contrast, precipitation change mainly leads to a negative impact on the growth season length. At most sites, a preseason temperature rise leads to earlier germination, and reduced preseason precipitation leads to earlier wilting. Moreover, the influence of preseason climate factors on plant phenology was more significant than the average influence of climate factors. Population change leads to a positive change in growth season length in most regions, and GDP growth has shortened the growing season. At the same time, the tertiary industry ratio in southern cities had a marked influence on the length of the growing season, while the heavy industry cities in northeast China had the opposite effect. In the rapid urbanization period in China, urban plant phenology is influenced not only by climate change but also by anthropogenic factors through further heat effects and more management of urban plants.
The original contributions presented in the study are included in the article/Supplementary Material. Further inquiries can be directed to the corresponding authors.
All authors have made substantial contributions to the submission and have approved the final version of the manuscript. The data in this study were analyzed, and the manuscript was written by HC, PJ, WY, and YH. These data were collected and filed by JL, XL, and LL. We hope that the manuscript is satisfactory to your journal.
This study was supported by the Strategic Priority Research Program of the Chinese Academy of Sciences (XDA2005010404).
The authors declare that the research was conducted in the absence of any commercial or financial relationships that could be construed as a potential conflict of interest.
All claims expressed in this article are solely those of the authors and do not necessarily represent those of their affiliated organizations, or those of the publisher, the editors, and the reviewers. Any product that may be evaluated in this article, or claim that may be made by its manufacturer, is not guaranteed or endorsed by the publisher.
The Supplementary Material for this article can be found online at: https://www.frontiersin.org/articles/10.3389/fenvs.2021.792918/full#supplementary-material
Badeck, F. W., Bondeau, A., Böttcher, K., Doktor, D., Lucht, W., Schaber, J., et al. (2004). Responses of spring Phenology to Climate Change. New Phytol. 162 (2), 295–309. doi:10.1111/j.1469-8137.2004.01059.x
Ballestrini, C., Tezara, W., and Herrera, A. (2010). Environmental Drivers of Leaf Phenology in Trees of the Tropical Species Ficus Obtusifolia. Braz. J. Plant Physiol. 23, 113–122. doi:10.1590/S1677-04202011000200003
Burns, C. E., Johnston, K. M., and Schmitz, O. J. (2003). Global Climate Change and Mammalian Species Diversity in U.S. National parks. Proc. Natl. Acad. Sci. 100 (20), 11474–11477. doi:10.1073/pnas.1635115100
Chen, Y., Li, X., and Xu, X. (2007). Spatial Evolvement and its Affecting Factors of Urbanization in China after Reforming and Open-Up. Scientia Geographica Sinica 27 (2), 142–148. doi:10.3969/j.issn.1000-0690.2007.02.003
Chen, H., Zhu, Q., Wu, N., Wang, Y., and Peng, C.-H. (2011). Delayed Spring Phenology on the Tibetan Plateau May Also Be Attributable to Other Factors Than Winter and Spring Warming. Proc. Natl. Acad. Sci. 108 (19), E93. author reply E95. doi:10.1073/pnas.1100091108
Chen, X., Wang, D., Chen, J., Wang, C., and Shen, M. (2018). The Mixed Pixel Effect in Land Surface Phenology: A Simulation Study. Remote Sensing Environ. 211, 338–344. doi:10.1016/j.rse.2018.04.030
Chuine, I., and Régnière, J. (2017). Process-Based Models of Phenology for Plants and Animals. Annu. Rev. Ecol. Evol. Syst. 48 (1), 159–182. doi:10.1146/annurev-ecolsys-110316-022706
Cleland, E., Chuine, I., Menzel, A., Mooney, H., and Schwartz, M. (2007). Shifting Plant Phenology in Response to Global Change. Trends Ecol. Evol. 22 (7), 357–365. doi:10.1016/j.tree.2007.04.003
Davy, R., Esau, I., Chernokulsky, A., Outten, S., and Zilitinkevich, S. (2017). Diurnal Asymmetry to the Observed Global Warming. Int. J. Climatol. 37 (1), 79–93. doi:10.1002/joc.4688
Fu, Y. H., Zhao, H., Piao, S., Peaucelle, M., Peng, S., Zhou, G., et al. (2015). Declining Global Warming Effects on the Phenology of spring Leaf Unfolding. Nature 526 (7571), 104–107. doi:10.1038/nature15402
Fu, Y., Li, X., Zhou, X., Geng, X., Guo, Y., and Zhang, Y. (2020). Progress in Plant Phenology Modeling under Global Climate Change. Sci. China Earth Sci. 63 (9), 1237–1247. doi:10.1007/s11430-019-9622-2
Ge, Q., Zhang, X., and Zheng, J. (2014). Simulated Effects of Vegetation Increase/Decrease on Temperature Changes from 1982 to 2000 Across the Eastern China. Int. J. Climatol. 34 (1), 187–196. doi:10.1002/joc.3677
Ge, Q. (2010). The Progress of Phenology Studies and Challenges to Modern Phenology Research in China. Bull. Chin. Acad. Sci. 3 (7), 310–316. doi:10.3969/j.issn.1000-3045.2010.03.013
Gunawardena, K. R., Wells, M. J., and Kershaw, T. (2017). Utilising green and Bluespace to Mitigate Urban Heat Island Intensity. Sci. Total Environ. 584-585, 1040–1055. doi:10.1016/j.scitotenv.2017.01.158
Han, G., Xu, J., and Yuan, X. (2008). Impact of Urbanization on Vegetation Phenology in Major Cities in Yangtze River Delta Region. Chin. J. Appl. Ecol. 19 (8), 1803–1809. doi:10.13287/j.1001-9332.2008.0305
Hou, H.-Y. (1983). Vegetation of China with Reference to its Geographical Distribution. Ann. Mo. Bot. Garden 70, 509. doi:10.2307/2992085
IPCC (2007). “Climate Change 2007: Impacts, Adaptation and Vulnerability,” in Contribution of Working Group II to the Fourth Assessment Report of the Intergovernmental Panel on Climate Change. Editors M. L. Parry, O. F. Canziani, J. P. Palutikof, P. J. van der Linden, and C. E. Hanson (Cambridge, UK: Cambridge University Press).
IPCC (2021). “Climate Change 2021: The Physical Science Basis,” in Contribution of Working Group I to the Sixth Assessment Report of the Intergovernmental Panel on Climate Change. Editors V. Masson-Delmotte, P. Zhai, A. Pirani, C.P. L. Connors, S. Bergeret al. (Cambridge, UK: Cambridge University Press. In Press).
Jaworski, T., and Hilszczański, J. (2013). The Effect of Temperature and Humidity Changes on Insects Development Their Impact on forest Ecosystems in the Expected Climate Change. For. Res. Pap. 74 (4), 345–355. doi:10.2478/frp-2013-0033
Jeong, S.-J., Ho, C.-H., Gim, H.-J., and Brown, M. E. (2011). Phenology Shifts at Start vs. End of Growing Season in Temperate Vegetation over the Northern Hemisphere for the Period 1982-2008. Glob. Change Biol. 17 (7), 2385–2399. doi:10.1111/j.1365-2486.2011.02397.x
Jochner, S., and Menzel, A. (2015). Urban Phenological Studies - Past, Present, Future. Environ. Pollut. 203, 250–261. doi:10.1016/j.envpol.2015.01.003
Ke, C. Q., Li, X. C., Xie, H., Liu, X., and Kou, C. (2016). Variability in Snow Cover Phenology in China from 1952 to 2010. Hydrol. Earth Syst. Sci. Discuss. 12 (4), 4471–4506. doi:10.5194/hess-20-755-2016
Li, F., Wang, R., Paulussen, J., and Liu, X. (2005). Comprehensive Concept Planning of Urban Greening Based on Ecological Principles: A Case Study in Beijing, China. Landscape Urban Plann. 72 (4), 325–336. doi:10.1016/j.landurbplan.2004.04.002
Li, F., Song, G., Liujun, Z., Xiuqin, F., and Yanan, Z. (2017a). “Urban Vegetation Phenology Analysis and the Response to the Temperature Change,” in 2017 IEEE International Geoscience and Remote Sensing Symposium (IGARSS), Fort Worth, TX, USA, 23-28 July 2017, 5743–5746.
Li, X., Zhou, Y., Asrar, G. R., Mao, J., Li, X., and Li, W. (2017b). Response of Vegetation Phenology to Urbanization in the Conterminous United States. Glob. Change Biol. 23 (7), 2818–2830. doi:10.1111/gcb.13562
Linderholm, H. W. (2006). Growing Season Changes in the Last Century. Agric. For. Meteorology 137, 1–14. doi:10.1016/j.agrformet.2006.03.006
Ma, T., and Zhou, C. (2012). Climate-Associated Changes in Spring Plant Phenology in China. Int. J. Biometeorol. 56 (2), 269–275. doi:10.1007/s00484-011-0428-3
Meng, X. (1988). Diurnal Difference between Accumulated Temperature at Anthesis of Apple. China Fruits 1988 (01), 40–41. doi:10.16626/j.cnki.issn1000-8047.1988.01.017
Menzel, A., Sparks, T. H., Estrella, N., Koch, E., Aasa, A., Ahas, R., et al. (2006). European Phenological Response to Climate Change Matches the Warming Pattern. Glob. Change Biol. 12 (10), 1969–1976. doi:10.1111/j.1365-2486.2006.01193.x
Menzel, A. (2003). Plant Phenological Anomalies in Germany and Their Relation to Air Temperature and NAO. Climatic Change 57 (3), 243–263. doi:10.1023/a:1022880418362
Omoto, Y., and Aono, Y. (2010). Estimation of Change in Blooming Dates of Cherry Flower by Urban Warming. J. Agric. Meteorology 46 (3), 123–129. doi:10.2480/agrmet.46.123
Parmesan, C., and Yohe, G. (2003). A Globally Coherent Fingerprint of Climate Change Impacts across Natural Systems. Nature 421 (6918), 37–42. doi:10.1038/nature01286
Peñuelas, J., and Filella, I. (2001). Responses to a Warming World. Science 294 (5543), 793–795. doi:10.1126/science.1066860
Piao, S., Fang, J., Zhou, L., Ciais, P., and Zhu, B. (2006). Variations in Satellite-Derived Phenology in China's Temperate Vegetation. Glob. Change Biol. 12 (4), 672–685. doi:10.1111/j.1365-2486.2006.01123.x
Piao, S., Tan, J., Chen, A., Fu, Y. H., Ciais, P., Liu, Q., et al. (2015). Leaf Onset in the Northern Hemisphere Triggered by Daytime Temperature. Nat. Commun. 6 (1), 6911. doi:10.1038/ncomms7911
Piao, S., Liu, Q., Chen, A., Janssens, I. A., Fu, Y., Dai, J., et al. (2019). Plant Phenology and Global Climate Change: Current Progresses and Challenges. Glob. Change Biol. 25 (6), 1922–1940. doi:10.1111/gcb.14619
Pinzon, J. E., and Tucker, C. J. (2014). A Non-Stationary 1981–2012 AVHRR NDVI3g Time Series. Remote Sensing 6 (8), 6929–6960. doi:10.3390/rs6086929
Ren, Q., He, C., Huang, Q., and Zhou, Y. (2018). Urbanization Impacts on Vegetation Phenology in China. Remote Sensing 10 (12), 1905. doi:10.3390/rs10121905
Richardson, A. D., Klosterman, S., and Toomey, M. (2013). “Near-Surface Sensor-Derived Phenology,” in Phenology: An Integrative Environmental Science. Editor M.D. Schwartz. (Dordrecht: Springer Netherlands), 413–430. doi:10.1007/978-94-007-6925-0_22
Roetzer, T., Wittenzeller, M., Haeckel, H., and Nekovar, J. (2000). Phenology in central Europe - Differences and Trends of spring Phenophases in Urban and Rural Areas. Int. J. Biometeorology 44 (2), 60–66. doi:10.1007/s004840000062
Rosenzweig, C., Karoly, D., Vicarelli, M., Neofotis, P., Wu, Q., Casassa, G., et al. (2008). Attributing Physical and Biological Impacts to Anthropogenic Climate Change. Nature 453 (7193), 353–357. doi:10.1038/nature06937
Rossi, S., and Isabel, N. (2017). Bud Break Responds More Strongly to Daytime Than Night-Time Temperature under Asymmetric Experimental Warming. Glob. Change Biol. 23 (1), 446–454. doi:10.1111/gcb.13360
Ryu, Y., Baldocchi, D. D., Ma, S., and Hehn, T. (2008). Interannual Variability of Evapotranspiration and Energy Exchange over an Annual Grassland in California. J. Geophys. Res. Atmospheres 113 (D9), D09104. doi:10.1029/2007JD009263
Schwartz, M., and Chen, X. (2002). Examining the Onset of spring in China. Clim. Res. 21 (2), 157–164. doi:10.3354/cr021157
Shen, M., Tang, Y., Chen, J., Zhu, X., and Zheng, Y. (2011). Influences of Temperature and Precipitation before the Growing Season on spring Phenology in Grasslands of the central and Eastern Qinghai-Tibetan Plateau. Agric. For. Meteorology 151 (12), 1711–1722. doi:10.1016/j.agrformet.2011.07.003
Shen, M., Zhang, G., Cong, N., Wang, S., Kong, W., and Piao, S. (2014). Increasing Altitudinal Gradient of spring Vegetation Phenology during the Last Decade on the Qinghai-Tibetan Plateau. Agric. For. Meteorology 189-190, 71–80. doi:10.1016/j.agrformet.2014.01.003
Steinaker, D. F., and Wilson, S. D. (2008). Phenology of fine Roots and Leaves in forest and Grassland. J. Ecol. 96 (6), 1222–1229. doi:10.1111/j.1365-2745.2008.01439.x
Stucky, B., Guralnick, R., Deck, J., Denny, E., Bolmgren, K., and Walls, R. (2018). The Plant Phenology Ontology: A New Informatics Resource for Large-Scale Integration of Plant Phenology Data. Front. Plant Sci. 9, 517. doi:10.3389/fpls.2018.00517
Templ, B., Koch, E., Bolmgren, K., Ungersböck, M., Paul, A., Scheifinger, H., et al. (2018). Pan European Phenological Database (PEP725): A Single point of Access for European Data. Int. J. Biometeorol. 62 (6), 1109–1113. doi:10.1007/s00484-018-1512-8
Visser, M. E., and Both, C. (2005). Shifts in Phenology Due to Global Climate Change: the Need for a Yardstick. Proc. R. Soc. B. 272 (1581), 2561–2569. doi:10.1098/rspb.2005.3356
Visser, M. E., Both, C., and Lambrechts, M. M. (2004). Global Climate Change Leads to Mistimed Avian Reproduction. Adv. Ecol. Res. 35, 89–110. doi:10.1016/s0065-2504(04)35005-1
Wei, C. (1998). Review of the Initial Stage of Guangxi's Reform and Opening up – Celebrating the 40th Anniversary of the Establishment of Guangxi Zhuang Autonomous Region. Lit. Hist. Spring autumn 6, 58–63.
Wohlfahrt, G., Tomelleri, E., and Hammerle, A. (2019). The Urban Imprint on Plant Phenology. Nat. Ecol. Evol. 3 (12), 1668–1674. doi:10.1038/s41559-019-1017-9
Wolf, A. A., Zavaleta, E. S., and Selmants, P. C. (2017). Flowering Phenology Shifts in Response to Biodiversity Loss. Proc. Natl. Acad. Sci. USA 114 (13), 3463–3468. doi:10.1073/pnas.1608357114
Yang, L. H., and Rudolf, V. H. W. (2010). Phenology, Ontogeny and the Effects of Climate Change on the Timing of Species Interactions. Ecol. Lett. 13 (1), 1–10. doi:10.1111/j.1461-0248.2009.01402.x
Yan-Ming, L. I., Guo, J., and Feng, J. Y. (2004). Urban Green Space and its Effect on Urban Heat Island Effect. Urban Environ. Urban Ecol. 17 (1), 1–4.
Yoshie, F., and Fukuda, T. (1994). Effects of Growth Temperature and winter Duration on Leaf Phenology of Erythronium Japonicum, a forest spring Geophyte. Oecologia 97 (3), 366–368. doi:10.1007/BF00317326
Yu, H., Luedeling, E., and Xu, J. (2010). Winter and Spring Warming Result in Delayed Spring Phenology on the Tibetan Plateau. Proc. Natl. Acad. Sci. 107 (51), 22151–22156. doi:10.1073/pnas.1012490107
Zhang, X., Friedl, M. A., Schaaf, C. B., and Strahler, A. H. (2004). Climate Controls on Vegetation Phenological Patterns in Northern Mid- and High Latitudes Inferred from MODIS Data. Glob. Change Biol. 10 (7), 1133–1145. doi:10.1111/j.1529-8817.2003.00784.x
Zhou, Y., and Zhang, L. (2003). China's Urban Economic Region in the Open Context. Acta Geographica Sinica 58 (2), 271–284. doi:10.11821/xb200302015
Keywords: phenology, eastern China, climate change, urban, development
Citation: Ju P, Yan W, Liu J, Liu X, Liu L, He Y and Chen H (2022) Plant Phenology and Its Anthropogenic and Natural Influencing Factors in Densely Populated Areas During the Economic Transition Period of China. Front. Environ. Sci. 9:792918. doi: 10.3389/fenvs.2021.792918
Received: 14 October 2021; Accepted: 23 November 2021;
Published: 14 January 2022.
Edited by:
Binhui Liu, Northeast Forestry University, ChinaReviewed by:
Xiangjin Shen, Northeast Institute of Geography and Agroecology (CAS), ChinaCopyright © 2022 Ju, Yan, Liu, Liu, Liu, He and Chen. This is an open-access article distributed under the terms of the Creative Commons Attribution License (CC BY). The use, distribution or reproduction in other forums is permitted, provided the original author(s) and the copyright owner(s) are credited and that the original publication in this journal is cited, in accordance with accepted academic practice. No use, distribution or reproduction is permitted which does not comply with these terms.
*Correspondence: Yixin He, aGV5eEBjaWIuYWMuY24=; Huai Chen, Y2hlbmh1YWlAY2liLmFjLmNu
Disclaimer: All claims expressed in this article are solely those of the authors and do not necessarily represent those of their affiliated organizations, or those of the publisher, the editors and the reviewers. Any product that may be evaluated in this article or claim that may be made by its manufacturer is not guaranteed or endorsed by the publisher.
Research integrity at Frontiers

Learn more about the work of our research integrity team to safeguard the quality of each article we publish.