 Hui Jin1,2Cheng Zhao1
 Yi Yin1,2*Guangming Zheng1,2
 Lichun li1
 Qi Shan1,2Meiyu Zhang1Linting Wei1Xiaona Shi1,2Heqing Huang1Wenjing Zhang1Shugui Liu1
- 1Pearl River Fisheries Research Institute, Chinese Academy of Fishery Sciences, Guangzhou, China
- 2College of Food Science and Technology, Shanghai Ocean University, Shanghai, China
A simple, sensitive, and simultaneous method was established and validated for the active clinical components of teicoplanin and ramoplanin in environmental water by LC-MS/MS coupled with cascade elution. Moreover, a cascade elution method, which was rapid, solvent-less, and high-extraction efficient was successfully proposed to realize the extraction and purification of seven targets in one step. Under optimized conditions, the method showed excellent linearity with the correlation coefficient (R2) ≥0.998 in the range of 1.0–100.0 ng L−1. Low matrix effects and good recoveries which ranged from 86 to 114% were reached with RSDs lower than 3.0% for most targets. The limits of detection and limit of quantification were 0.1–1.3 and 0.3–4.0 ng L−1, respectively. This method was successfully applied for the determination of teicoplanin and ramoplanin in water samples from the Pearl River and the South China Sea. TA2-2,3 was quantified in only one sample with the concentration of 8.0 ng L−1.
Introduction
Antibiotics are an effective approach for the treatment of various bacterial infections and animal growth promotion. However, the overuse of antibiotics leads to increased antibiotics residues in the environment, thereby increasing drug resistance, which has become a global issue (Carvalho and Santos, 2016; United Nations (UN), 2016). In the past 10 years, glycopeptide antibiotics have been incrementally used as the last resort for the clinical treatment of serious Gram-positive bacterial infections (Wilson, 2000; Binda et al., 2014). Among glycopeptide antibiotics, teicoplanin (TEC) and ramoplanin (RAM) are commonly used and studied antibiotics in clinical settings (Farver et al., 2005; Tanwar et al., 2014). TEC, extracted from Actinoplanes teichomyceticus, is used to treat various serious Gram-positive bacterial infections, especially methicillin-resistant Staphylococcus aureus (MRSA) infections (Cavalcanti et al., 2010). Similarly, RAM is a novel antibiotic with unique antibacterial mechanisms and significant activities against MRSA and vancomycin-resistant Clostridium difficile (Farver et al., 2005). However, its widespread clinical applications pose a potential threat to environmental water. The glycopeptide was present in environmental water from 12.68 to 24.25 μg L−1 (Soran et al., 2017). TEC and RAM are transferred to the environmental water through various transfer pathways, including the pharmaceutical factory wastewater, laboratory waste, hospital wastewater, and domestic sewage (Feng et al., 2020). The TEC contents in patient feces (de Lalla et al., 1992) and urine (Riva et al., 1987) were 118–2413 and 0.1–10 mg L−1, respectively. The residues of TEC and RAM could induce antibacterial resistance through agricultural irrigation, aquaculture, and direct drinking (Sartelli, 2010; WHO, 2014). These residues, even at a lower concentration, are a threat to the microbial flora and aquatic animals, increasing the risk of aquatic ecological imbalance (Roose-Amsaleg and Laverman, 2016; Grenni et al., 2018). To the best of our knowledge, very few methods have been reported for the analysis of TEC and RAM in environmental water. Therefore, it is of great significance to establish a reliable detection method for TEC and RAM in environmental water.
TEC and RAM have high molecular weight and multicomponent substances, which primarily contain cyclic polypeptides (connected by some amino acids), glycosyl groups, and lipophilic side chains. TEC, mainly composed of TA2-1, TA2-2, TA2-3, TA2-4, TA2-5, and TA3-1, has similar structures but diverse antibacterial activities (Parenti et al., 1978). Ramoplanin is a mixture of three components, namely, ramoplanin A1–A3 (RA1, RA2, and RA3). RA2 is used individually in the clinical application due to its unique antibacterial activities (Cavalleri, 1984). Thus, TA2-1, TA2-2, TA2-3, TA2-4, TA2-5, and TA3-1 in TEC and RA2 in RAM were selected as the analytical objects to improve the practicality and efficiency of the analysis.
So far, many analytical methods have been developed for the determination of TEC and RAM, including amicrobiological assay (Awni et al., 1991), fluorescence polarization immunoassay (Xu and Käll, 2002; Ali et al., 2020), nano-gold fluorescence assay (Teepoo et al., 2013), micellar electrokinetic chromatography (Tsai et al., 2009), HPLC-UV (Riva et al., 1987), HPLC-ELSD (Song et al., 2018), and LC-MS/MS (Ewles et al., 2011; Begou et al., 2017). Among these methods, LC-MS/MS has the unique advantages of high sensitivity, high selectivity, and stability for multicomponent glycopeptide antibiotics. Hence, it is regarded as the gold standard for traceability and quality (Castro-Puyana et al., 2017). Begou et al. (2017) introduced the LC-MS/MS method for determining teicoplanin (TA2-2). Ewles et al. (2011) validated a bioanalytical method for the quantification of RAM using LC-MS/MS. Thus, LC-MS/MS was selected in this study.
The solid phase extraction method is a simple, efficient, and mature pretreatment technology for trace-level analysis of antibiotics in environmental water, enriching the analytes and removing impurity interference (Ongay et al., 2012; Sadutto and Picó, 2020). However, a simple elution usually cannot obtain a good elution rate for all targets simultaneously in terms of different multicomponent or multi-type antibiotics (Kang et al., 2010; Wei et al., 2014; Botero-Coy et al., 2018). The cascade elution is based on a profound understanding of all targets. First, all targets are classified and ranked in advance according to some attributes, such as polarity and pKa, and then one or a series of solvent systems is designed for accurate extraction of targets. Secil Yilmaz Turan classified the ingredients in wheat bran, ensured the extraction sequence of these compounds, and used a cascade method to obtain good extraction of proteins and feruloylated arabinoxylans (Yilmaz-Turan et al., 2020). Paola Imbimbo also separated active phycocyanin and fatty acids from Galdieria phlegrea through the cascade method (Imbimbo et al., 2019). The cascade method is rapid, solvent-less, and highly efficient, which was successfully proposed to realize the extraction and purification in one step. In this study, the conditions of instrument and pretreatment were optimized. The cascade elution method was developed for detecting the active clinical components of teicoplanin and ramoplanin in environmental water by LC-MS/MS. This method was applied to real environmental samples, including river water, lake water, aquaculture water, and sea water.
Materials and Methods
Reagents and Materials
Acetonitrile (ACN), methanol (MeOH), ethyl acetate (EAC), and cyclohexane (CYH) of LC-MS grade were obtained from Merck (Darmstadt, Germany). Other solvents, including formic acid (FA), ammonium acetate, and ammonium hydroxide solution (25–28%), were obtained from Tokyo Chemical Industry (Tokyo, Japan), Aladdin (Shanghai, China), and Macklin (Shanghai, China), respectively. Glass microfiber filters (GF/F grade) were purchased from Whatman (Buckinghamshire, United Kingdom). Ultrapure water (18.2 μs cm−1 at 25°C) was prepared by the Genie 15 system of RephiLe (Shanghai, China). Sep-pak@vac C18 SPE cartridge (200 mg, 3 ml), Oasis HLB SPE cartridge (200 mg, 6 ml), and Oasis WCX SPE cartridge (200 mg, 6 ml) were supplied by Waters (Milford, MA, United States). Superlclean SCX SPE cartridge (500 mg, 3 ml) was supplied by Superlco Corporation (Beffefonte, United States). BE Carbon-300NH2 SPE cartridge (500 mg, 6 ml) and Bond Elut-SAX (500 mg, 6 ml) were purchased from Agilent technologies (CA, United States). The solid-phase extraction procedure was performed using 24-port Visiprep SPE vacuum manifold with a minipump from Agela (Tianjin, China).
Standards and Stock Solution
Teicoplanin (TEC, purity 98%, containing TA3-1, TA2-1, TA2-2, TA2-3, TA2-4, and TA2-5) was purchased from Standards (Shanghai, China) and ramoplanin (RA2, purity 99%) was purchased from TRC (Toronto, Canada). The internal standard polymyxin B sulfate (PMB, purity 91%) was obtained from Dr. Ehrenstrofer GmbH (Augsburg, Germany). The stock solutions (1.0 mg ml−1) for RA2, TEC, and PMB were prepared by 0.1% FA aqueous solution and stored in the dark for 3 months at −20°C. The mixed standard working solution (10.0 μg ml−1 for TEC and RA2) and the internal standard (1.0 μg ml−1) were prepared by diluting each stock solution with MeOH-0.1% FA aqueous solution (50:50, v/v) in a brown glass bottle and stored at 4°C for a month.
Mass Spectrometry
The Agilent 6470B triple quadrupole mass spectrometric system was employed for mass spectrometry condition analysis. The electrospray ionization (ESI) source in the positive ion mode was selected for the analytes. The following mass spectrometer parameters were adopted: drying gas temperature, 300°C; the flow rate of drying gas, 5 L min−1; nebulizer gas pressure, 35 psi; sheath gas temperature, 325°C; the flow rate of sheath gas, 9 L min−1; capillary positive voltage, 3500 v; and nozzle-positive voltage, 500 v. The multiple reaction monitoring (MRM) mode was used to analyze each component. The detailed optimal parameters of the mass spectrum, including fragmentor, collision energy, cell accelerator voltage, and mass transitions, are listed in Table 1. The data were handled by Agilent MassHunter qualitative analysis 10.0 and Agilent MassHunter quantitative analysis for QQQ 10.1 equipped with the system.
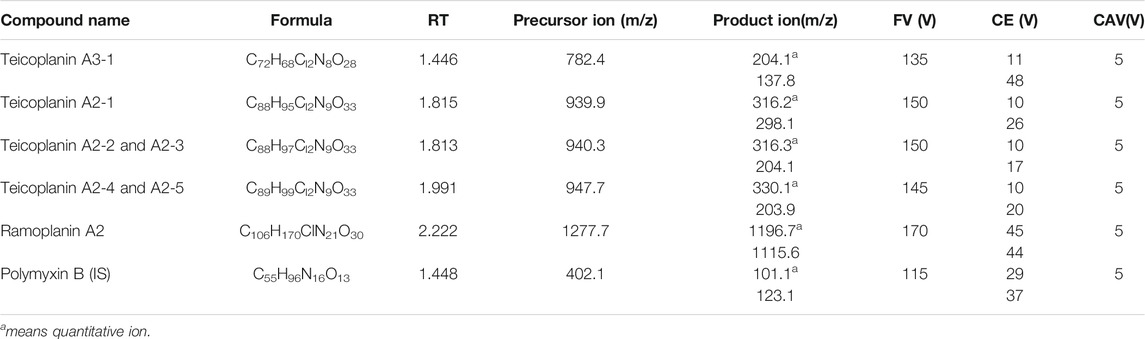
TABLE 1. MRM parameters of all target peaks and the internal standard.
Liquid Chromatography
The Agilent 1290 UHPLC system was employed to optimize the liquid chromatography conditions. The SB C18 REHD 2.1 × 100 mm (1.8 µm) column (Agilent Technologies, United States) was applied for chromatographic separation. The injection volume was 10 μL, and the autosampler tray temperature was stabilized at 20°C, whereas the column oven was maintained at 35°C. The mobile phase consisted of water (A) and acetonitrile (B), containing 0.1% (v/v) formic acid (FA). The total analysis time was 4 min at a flow rate of 0.35 ml min−1. All the analytes were well-separated sequentially under the following linear gradient: 0 ∼ 0.5 min, 5% B; 0.5 ∼ 1.5 min, 5–30% B; 1.5 ∼ 2.4 min, 30–40% B; 2.4 ∼ 3 min, 95% B; and 3 ∼ 4 min, 5% B. The chromatogram of each component is shown in Figure 1. (The chromatograms of real water matrix at the spiked concentration of LOQs for each target are shown in Supplementary Figure S1).
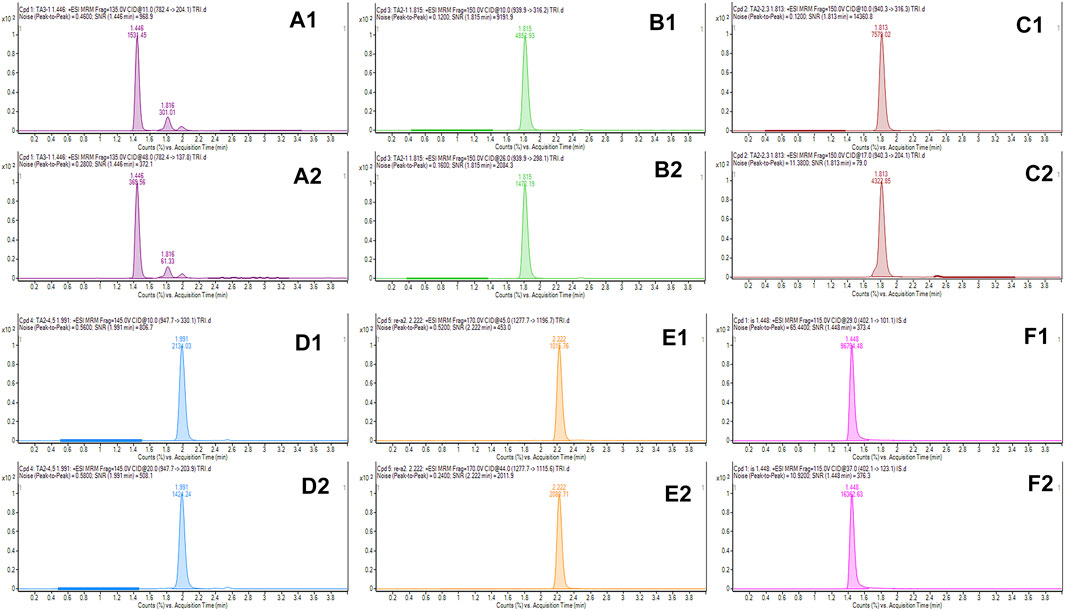
FIGURE 1. Representative chromatograms obtained from the calibrator standard at 100 ng ml–1 for teicoplanin, ramoplanin, and the internal standard. A1, A2, B1, B2, C1, C2, D1, D2, E1, E2, F1, and F2 refer to TA3-1 (782.4/204), TA3-1 (782.4/137.8), TA2-1 (939.9/316.2), TA2-1 (939.9/298.1), TA2-2,3 (940.3/316.3), TA2-2,3 (940.3/204.1), TA2-4,5 (947.7/330.1), TA2-4,5 (947.7/203.9), RA2(1277.7/1196.7), RA2 (1277.7/1115.6), IS (402.1/101.1), and IS (402.1/123.1), respectively.
Sample Preparation
The HLB cartridge was selected to enrich and purify the sample after filtering by 0.7-µm glass microfiber filters. First, the HLB cartridge was activated with 1 ml methanol and equilibrated with 1 ml water. Then, the 1-L sample with 20 ng L−1 internal standard was automatically loaded onto the SPE device through a vacuum pump at a flow rate of 2 ∼ 3 ml min−1. After sample loading, it was washed with 1 ml of water and eluted with 1 ml of methanol and 1 ml of 20% (v/v) methanol water (containing 0.5% formic acid) sequentially at a flow rate of 0.5 ml min−1. Finally, the eluent was determined by the LC-MS/MS method after being vortexed.
Matrix Effect
The matrix effect (ME) is usually caused by the matrix components extracted with the analyte, which could inhibit or enhance the ionization response of the analyte under ESI conditions. It is calculated by comparing the slope of the standard curve (Rstandard) with the slope of the matrix standard curve (Rmatrix), as per the formula [(Rmatrix- Rstandard)/Rstandard] × 100%. A positive value of the ME refers to the signal enhancement of targets, while a negative value indicates signal suppression. Overall, the ME around −20∼20, −20 ∼ −50, or 20–50% and > ±50% shows weak, moderate, and strong matrix effects, respectively (Economou et al., 2009).
Results and Discussion
Mass Spectrometry Optimization
Jaewan Jung (Jung et al., 2019) used PMB as the internal standard of TEC due to lack of hydrogen isotope internal standard of TEC and RAM. Based on the similar structures of TEC and RAM, PMB was selected as the internal standard for this study. The electrospray ionization (ESI) source operating conditions were optimized by injecting 1.0 μg ml−1 of the analyte solution. First, the most abundant m/z value was selected as the precursor ion through the full-scan mass spectrum. The positive ESI mode was selected due to weak signal or no signal of targets in the negative ESI mode (Peteghem et al., 2003). Unlike some single small molecules, TEC and RAM produced abundant interfering fragments, interference between components, and relatively low molecular ions with different charges. It was inferred that they do not exist in the standard substance or do not completely dissolve in the solvent. Furthermore, the 0.1% formic acid aqueous solution, water, methanol, and acetonitrile were compared to obtain a fine solvent of targets. The results showed that the 0.1% formic acid aqueous solution was the best. Then, the [M + H]+ ion, [M + 2H]2+ ion, and [M + 3H]3+ ion of each target were compared to obtain the most abundant ion. The [M + 2H]2+ ion was found with a best response toward TEC and RAM, and the [M + 3H]3+ ion was most suitable for PMB among these three ions due to its strong response intensity. Since each mass spectrum has different resolutions, the ions with the closest mass-charge ratio to the theoretical precursor ions and the highest response value were selected as the actual precursor ions. At the same time, the full scanning spectrum generated by multiple injections was confirmed. Later, these precursor ions were used to produce the daughter ions, and each analyte was monitored by one precursor ion and two daughter ions. The fragmentor, collision energy, cell accelerator voltage, and other parameters were optimized. Also, the best ESI conditions, such as sheath gas temperature and the flow rate of sheath gas, were acquired. It was worth noting that TA2-2 and TA2-3 were a pair of isomers with the same mass spectrum performance and TA2-4 and TA2-5 were also the same.
Chromatographic Optimization
SB-C18 1.8 μ m 2.1 × 100 mm was selected to obtain good sensitivity and peak shape. Then, methanol and acetonitrile were contrasted for the elution experiment. Acetonitrile exerted a better separation effect for each component. It was showed that 0.1% formic acid improved the peak shape in Figure 2, by comparing with 0.2% formic acid and 10 mM ammonium acetate. The best elution procedures were obtained by adjusting the elution ratio and gradient, testing the column equilibrium time, washing time, and the stability of the column separation. The flow rate of the mobile phase and column temperature was also obtained to ensure the efficiency of the analysis and the separation ability.
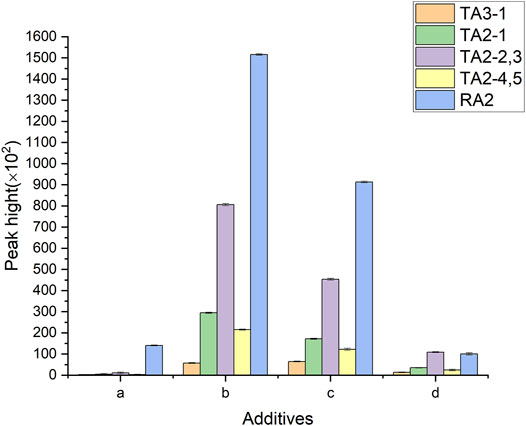
FIGURE 2. Effect of different additives on the sensitivity of the analytes. (A–D) refer to the mobile phases without formic acid, the mobile phases with 0.1% formic acid, the mobile phases with 0.2% formic acid, and the mobile phases with 10 mM ammonium acetate.
Optimization of Sample Pretreatment
Selection of the SPE Column
TEC and RAM are amphoteric compounds with strong polarity, which are easily soluble in water and hardly dissolve in nonpolar solvents. The pKa of teicoplanin is 5.66, but of RAM is 8.0 (Bardone et al., 1978; Cavalleri et al., 1984). Six kinds of SPE columns, including C18 SPE cartridge, HLB SPE cartridge, SCX strong cation exchange cartridge, WCX weak cation exchange cartridge, carbon-300NH2 forward amino extraction cartridge, and SAX weak anion exchange cartridge, were selected to extract 5 ml of the 10-μg ml−1 mixed standard solution. SCX, WCX, and carbon-300NH2 had low recovery (less than 30%) as teicoplanin was slightly acidic and lost loading. As shown in Figure 3A, the adsorption and elution ability of the HLB SPE cartridge (86.09–106.4%) was better than that of the C18 SPE (58.91–81.91%) and SAX SPE cartridges (34.89–65.01%) for all targets. Thus, the HLB SPE cartridge was selected for the SPE column. The optimal activation (in Supplementary Figure S2) and washing (in Supplementary Figure S3) procedures of SPE are summarized in the supplementary information.
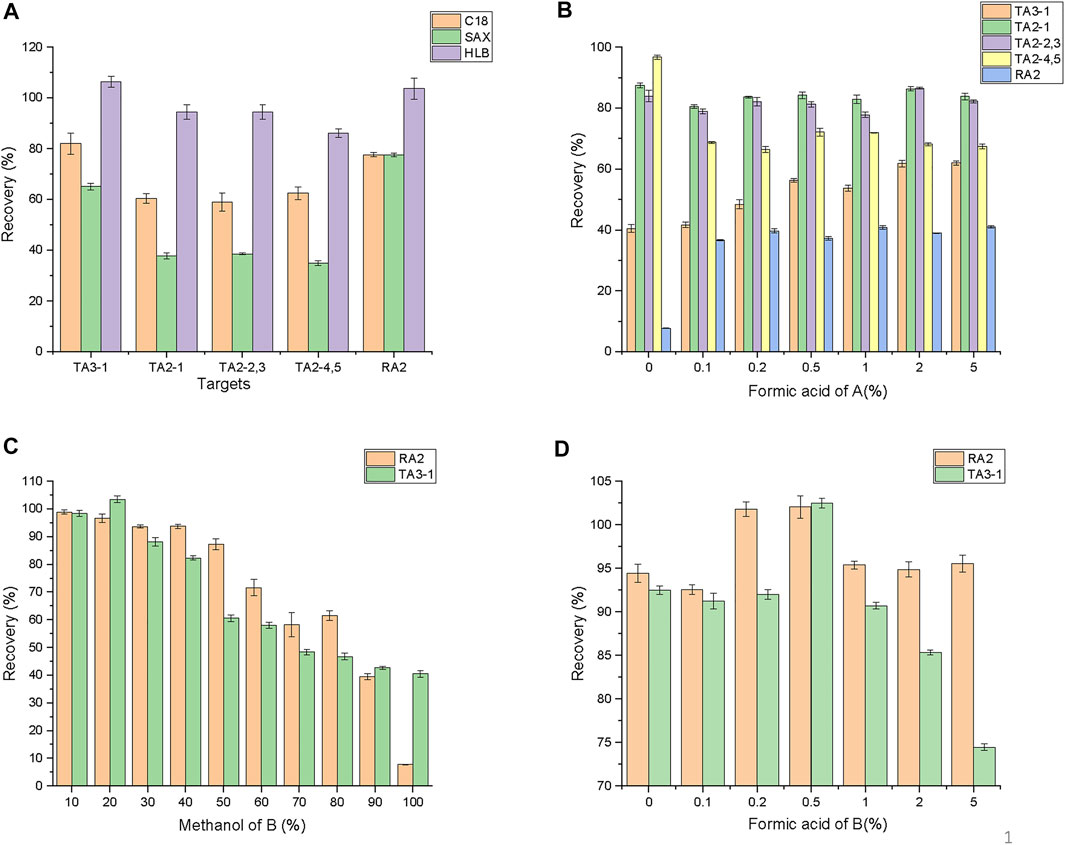
FIGURE 3. Optimization of SPE procedures. (A) for SPE columns; (B) for concentrations of formic acid in eluent A, formic acid of A means the concentrations of formic acid in methanol; (C) for contents of methanol in eluent B, methanol of B mean the concentrations of methanol in water; (D) for contents of formic acid in eluent B, formic acid of B means the concentrations of formic acid in 20% methanol water.
Optimization of Cascade Elution
The cascade elution was designed carefully according to the TEC and RAM characteristics. TEC and RAM showed good water solubility and strong polarity. TA3-1 has strong polarity due to the lack of long lipophilic side chains in the six main components of TEC. Compared with TEC, RAM possesses good hydrophilic property on account of dispersed benzene rings and more hydrophilic groups, including amino, imino, carbonyl, and phenolic hydroxyl. Thus, TA2-1, TA2-2, TA2-3, TA2-4, and TA2-5 with low polarity were eluted as the first type of the targets (A). Then, RA2 and TA3-1 were eluted as the second type of the targets (B). Methanol possesses a strong elution ability compared with that of other pure solvents in SPE. Formic acid and water have good polarity and could produce competitive hydrogen bonding with the targets. Hence, one or a series of solvent systems similar to the polarity of the target substance was prepared by adjusting the proportions of methanol, formic acid, and water to ensure good purification.
First, methanol and different acidic concentrations of methanol were compared to achieve good elution efficiency of TA2-1, TA2-2, TA2-3, TA2-4, and TA2-5. As shown in Figure 3B, methanol was the best (83.9–96.74%). Additionally, with the increase in acidity, the elution efficiency of TA2-4 and TA2-5 dropped from 96.7 to 67.4%, whereas the elution efficiency of TA2-1, TA2-2, and TA2-3 was stable at around 82%. Notably, the elution efficiency of TA3-1 increased from 41.7 to 61.9%, and the elution efficiency of RAM increased from 7.7 to 41.0% under this condition, indicating that formic acid improved the elution efficiency of TA3-1 and RAM. The reason could be the acidity of the solvent close to pKa of phenolic hydroxyl or carboxyl in the molecule. It is noteworthy that the excessive use of the extractant could be helpful to the elution efficiency of the targets and might extract more impurities. With the increase in methanol, the elution efficiency of all the components increased slowly with less than 2% growth, as shown in Supplementary Figure S4. Therefore, 1 ml was considered as the most suitable elution volume.
Then, RA2 and TA3-1 were isolated from the HLB SPE cartridge. Remarkably, the increase in formic acid might lead the elution efficiency of RAM and TA3-1 to 80%. Meanwhile, it might cause their degradation and not reach satisfactory recovery (Wang et al., 2020). Thus, a solvent with suitable polarity was explored by adjusting the proportion of methanol, water, and formic acid. As shown in Figure 3C, with the increase in methanol proportion, the elution efficiency of TA3-1 increased and then declined from 103.4 to 40.4%, while the elution efficiency of RA2 dropped after the methanol proportion was increased by 50%. Moreover, RA2 and TA3-1 acquired the best elution efficiency by 20% methanol aqueous solutions. Afterward, different concentrations of formic acid were added with 20% methanol aqueous solutions. As shown in Figure 3D, the elution efficiency of RA2 and TA3-1 increased by 0–0.5% formic acid and decreased by 0.5–5% formic acid, especially TA3-1. Furthermore, the 20% methanol aqueous solution with 0.5% formic acid had the optimal recoveries (102.0–102.5%). Hence, it was confirmed as the second eluent of the cascade elution (optimization of the elution volume is shown in Supplementary Figure S5). Finally, the cascade elution was validated and it achieved the best elution, compared with 20% methanol (containing 0.5% formic acid) and methanol (Figure 4). The whole elution process takes 4 min, and only 1.2 ml of methanol is used.
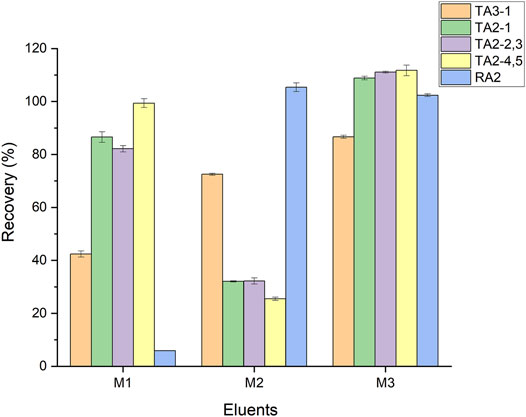
FIGURE 4. Comparison of the cascade elution and other simple modes of SPE procedures. M1, M2, and M3 means methanol, 0.5% FA in 20% methanol, water, and cascade elution (methanol and 0.5% FA in 20% methanol water), respectively.
Method Validation
The method was evaluated by the linearity, sensitivity, accuracy, and precision in real samples under the best conditions. Ultimately, the effectiveness and applicability of the method were ensured.
Linearity and Sensitivity
The linearity of this method was assessed by the correlation coefficient obtained from the calibration equation. As summarized in Table 2, the correlation coefficient (R2) of all components was greater than 0.998, with the linear range of 1–100 ng ml−1. The sensitivity was evaluated by the limit of detection (LOD) and limit of quantification (LOQ). Specifically, the LOD is defined by the signal-to-noise ratio (SNR) of 3 and the LOQ is calculated by the SNR of 10. The results suggested that the LODs and LOQs of all analytes were in the ranges of 0.1–1.3 and 0.3–4.0 ng L−1, respectively. The detailed procedures are demonstrated in Table 2, which indicated that this method had good selectivity, satisfactory linearity, and significant sensitivity.
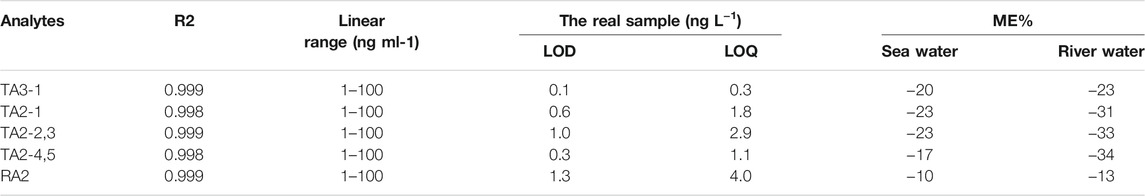
TABLE 2. Linearity, sensitivity, and matrix effects of the developed method for analytes.
Precision and Accuracy
The precision and accuracy of this method were expressed as the relative standard deviations (RSDs) and recoveries, respectively. The spiked samples with three different concentrations were prepared using two different spiked samples, namely, sea water and river water. They were measured repeatedly after sample pretreatment. In Table 3, the intra-day and inter-day precision of all components in different samples were 0.5–3.0% and 0.4–2.8%, respectively. Furthermore, the recoveries of all targets in the intra-day and inter-day were 86.0–114.5% and 86.1–113.9%, respectively. Thus, this method had good precision and high accuracy.
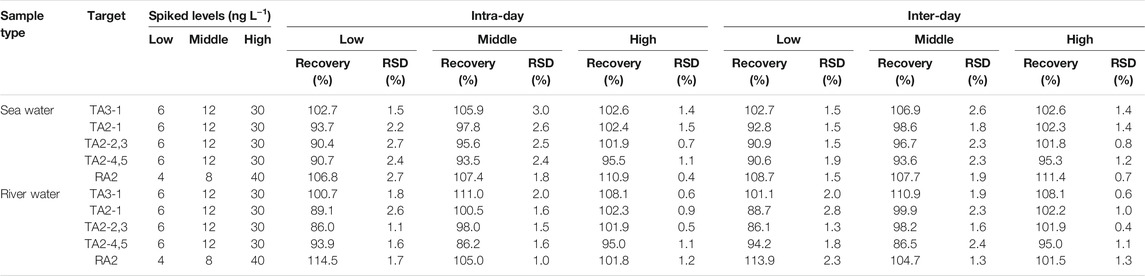
TABLE 3. Precision and recovery of analytes in two samples (n = 9).
Matrix Effect
In trace analysis, the influence of the matrix effect is not negligible. In the environmental water, water usually dissolves many organic and inorganic substances, including human medicines, nursing products, veterinary medicines, and industrial products. Therefore, two kinds of matrix samples were used to prepare a calibration working curve to determine, and the results are shown in Table 2. The matrix effect range of all components of TEC in sea water and river water was −17 ∼ −34%, indicating the presence of medium ion inhibition in the enriched samples. The matrix effect range of RAM in sea water and river water was −10 ∼ −13%, illustrating the presence of weak ion inhibition. The cascade elution method used a small volume of the solvent to efficiently elute the targets, leaving most of the impurities in the HLB SPE cartridge. Thus, a low matrix effect was obtained in this method.
Applications to the Real Sample
Since the coastal cities have developed industries, large urban populations and high consumption of antibiotics and their water resources are seriously threatened, affecting the entire water ecological environment once they flow into the sea. Thus, the samples were randomly collected from water resources, such as river water, lake water, aquaculture water, and sea water. The aquaculture water was collected from the Pearl River Basin (including Pearl River inlet, middle Pearl River, and Pearl River outlet). These water samples were collected in a 1-L brown glass bottle and stored at 4°C in the laboratory. Every sample was acquired by a 2-L professional sampler in accordance with the principles of random sampling. TA2-2,3 was found, and the concentration was 8 ng L−1 in one of these samples. The results showed that the method could be used for determining real complex samples.
Conclusion
In this study, a new method, based on the cascade elution procedure, has been developed for the simultaneous determination of seven active clinical components of TEC and RAM in environmental water. Additionally, a cascade method was successfully applied for elution and purification in only 4 min, showing selectivity and effectiveness. Moreover, the combination of the cascade elution with LC-MS/MS is fast and accurate for environmental water, as the consumption of the organic solvent is reduced in one step of the method. The proposed method was applied for the quantitative analysis of multiple environmental water samples. To the best of our knowledge, this is the first time that TA2-2,3 was detected in the lake of China with the concentration of 8 ng L−1.
Data Availability Statement
The datasets presented in this study can be found in online repositories. The names of the repository/repositories and accession number(s) can be found below: Figshare [DOI: 10.6084/m9.figshare.16704544, 10.6084/m9.figshare.16704643, 10.6084/m9.figshare.16704664, and 10.6084/m9.figshare.16704670].
Author Contributions
YY contributed to the conception and design of the study. HJ and CZ organized the database. HJ and CZ performed the statistical analysis. HJ wrote the first draft of the manuscript. CZ wrote sections of the manuscript. HJ and CZ contributed equally to this study. All authors contributed to manuscript revision, read, and approved the submitted version.
Funding
TThis study were supported by a research grant (CAMC-2018F) from the China-ASEAN Maritime Cooperation Fund and a project (No. 2017YFC1600704) from the National Key Research and Development Program of China.
Conflict of Interest
The authors declare that the research was conducted in the absence of any commercial or financial relationships that could be construed as a potential conflict of interest.
Publisher’s Note
All claims expressed in this article are solely those of the authors and do not necessarily represent those of their affiliated organizations, or those of the publisher, the editors, and the reviewers. Any product that may be evaluated in this article, or claim that may be made by its manufacturer, is not guaranteed or endorsed by the publisher.
Acknowledgments
We would like to thank all members who helped in this study.
Supplementary Material
The Supplementary Material for this article can be found online at: https://www.frontiersin.org/articles/10.3389/fenvs.2021.785408/full#supplementary-material
References
Ali, M. F. B., Salman, B. I., Hussein, S. A., and Marzouq, M. A. (2020). Applicability of Ninhydrin as a Fluorescent Reagent for Estimation of Teicoplanin in Human Plasma Using Salting‐out Assisted Liquid-Liquid Extraction Technique. Luminescence. 35, 1118–1124. doi:10.1002/bio.3824
Awni, W. M., St. Peter, W. L., Guay, D. R. P., Kenny, M. T., and Matzke, G. R. (1991). Teicoplanin Measurement in Patients With Renal Failure. Ther. Drug Monit. 13, 511–517. doi:10.1097/00007691-199111000-00008
Bardone, M. R., Paternoster, M., and Coronelli, C. (1978). Teichomycins, New Antibiotics From Actinoplanes Teichomyceticus Nov. Sp. II. Extraction and Chemical Characterization. J. Antibiot. 31, 170–177. doi:10.7164/antibiotics.31.170
Begou, O., Kontou, A., Raikos, N., Sarafidis, K., Roilides, E., Papadoyannis, I. N., et al. (2017). An Ultra-High Pressure Liquid Chromatography-Tandem Mass Spectrometry Method for the Quantification of Teicoplanin in Plasma of Neonates. J. Chromatogr. B. 1047, 215–222. doi:10.1016/j.jchromb.2016.01.042
Binda, E., Marinelli, F., and Marcone, G. (2014). Old and New Glycopeptide Antibiotics: Action and Resistance. Antibiotics. 3, 572–594. doi:10.3390/antibiotics3040572
Botero-Coy, A. M., Martínez-Pachón, D., Boix, C., Rincón, R. J., Castillo, N., Arias-Marín, L. P., et al. (2018). 'An Investigation into the Occurrence and Removal of Pharmaceuticals in Colombian Wastewater'. Sci. Total Environ. 642, 842–853. doi:10.1007/s11783-013-0580-610.1016/j.scitotenv.2018.06.088
Carvalho, I. T., and Santos, L. (2016). Antibiotics in the Aquatic Environments: A Review of the European Scenario. Environ. Int. 94, 736–757. doi:10.1016/j.envint.2016.06.025
Castro-Puyana, M., Pérez-Míguez, R., Montero, L., and Herrero, M. (2017). Application of Mass Spectrometry-Based Metabolomics Approaches for Food Safety, Quality and Traceability. Trac Trends Anal. Chem. 93, 102–118. doi:10.1016/j.trac.2017.05.004
Cavalcanti, A. B., Goncalves, A. R., Almeida, C. S., Bugano, D. D., and Silva, E. (2010). Teicoplanin Versus Vancomycin for Proven or Suspected Infection. Cochrane Database Syst. Rev. 6, CD007022. doi:10.1002/14651858.CD007022.pub2
Cavalleri, B., Pagani, H., Volpe, G., Selva, E., and Parenti, F. (1984). A-16686, a New Antibiotic From Actinoplanes I. Fermentation, Isolation and Preliminary Physico-Chemical Characteristics. J. Antibiot. 37, 309–317. doi:10.7164/antibiotics.37.309
Cavalleri, (1984). Cavalleri, Antibiotic A/16686 Factor A.Sub2,the Process for the Preparation Thereof and the Co-produced Antibiotic A/16686 Factors A.Sub1 and A.sub3[P].US:4427656. Available at: https://www.freepatentsonline.com/4427656.pdf/.
de Lalla, F., Nicolin, R., Rinaldi, E., Scarpellini, P., Rigoli, R., Manfrin, V., et al. (1992). Prospective Study of Oral Teicoplanin Versus Oral Vancomycin for Therapy of Pseudomembranous Colitis and Clostridium Difficile-Associated Diarrhea. Antimicrob. Agents Chemother. 36, 2192–2196. doi:10.1128/AAC.36.10.2192
Economou, A., Botitsi, H., Antoniou, S., and Tsipi, D. (2009). Determination of Multi-Class Pesticides in Wines by Solid-phase Extraction and Liquid Chromatography-Tandem Mass Spectrometry. J. Chromatogr. A. 1216, 5856–5867. doi:10.1016/j.chroma.2009.06.031
Ewles, M. F., Turpin, P. E., Goodwin, L., and Bakes, D. M. (2011). Validation of a Bioanalytical Method for the Quantification of a Therapeutic Peptide, Ramoplanin, in Human Dried Blood Spots Using LC-MS/MS. Biomed. Chromatogr. 25, 995–1002. doi:10.1002/bmc.1555
Farver, D. K., Hedge, D. D., and Lee, S. C. (2005). Ramoplanin: A Lipoglycodepsipeptide Antibiotic. Ann. Pharmacother. 39, 863–868. doi:10.1345/aph.1E397
Feng, L., Cheng, Y., Zhang, Y., Li, Z., Yu, Y., Feng, L., et al. (2020). Distribution and Human Health Risk Assessment of Antibiotic Residues in Large-Scale Drinking Water Sources in Chongqing Area of the Yangtze River. Environ. Res. 185, 109386. doi:10.1016/j.envres.2020.109386
Grenni, P., Ancona, V., and Barra Caracciolo, A. (2018). Ecological Effects of Antibiotics on Natural Ecosystems: A Review. Microchemical J. 136, 25–39. doi:10.1016/j.microc.2017.02.006
Imbimbo, P., Romanucci, V., Pollio, A., Fontanarosa, C., Amoresano, A., Zarrelli, A., et al. (2019). A Cascade Extraction of Active Phycocyanin and Fatty Acids From Galdieria Phlegrea. Appl. Microbiol. Biotechnol. 103, 9455–9464. doi:10.1007/s00253-019-10154-0
Jung, J., Lee, K., Oh, J., Choi, R., Woo, H. I., Park, H.-D., et al. (2019). Therapeutic Drug Monitoring of Teicoplanin Using an LC-MS/MS Method: Analysis of 421 Measurements in a Naturalistic Clinical Setting. J. Pharm. Biomed. Anal. 167, 161–165. doi:10.1016/j.jpba.2019.02.001
Kang, Y.-Y., Hwang, S.-R., Shin, S.-K., Koo, S.-H., Sim, K.-T., and Kim, T.-S. (2010). The Study of Analytical Method for Sulfonamide Antibiotics and Their Metabolites in Environmental Samples. Anal. Sci. Technology. 23, 437–445. doi:10.5806/AST.2010.23.5.437
Ongay, S., Boichenko, A., Govorukhina, N., and Bischoff, R. (2012). Glycopeptide Enrichment and Separation for Protein Glycosylation Analysis. J. Sep. Sci. 35, 2341–2372. doi:10.1002/jssc.201200434
Parenti, F., Beretta, G., Berti, M., and Arioli, V. (1978). Teichomycins, New Antibiotics From Actinoplanes Teichomyceticus Nov. Sp. I. Description of the Producer Strain, Fermentation Studies and Biological Properties. J. Antibiot. 31, 276–283. doi:10.7164/antibiotics.31.276
Peteghem, C. V., Keyser, K. D., Baltusnikiene, A. B., and McEvoy, J. D. G. (2003). Liquid Chromatographic–Tandem Mass Spectrometric Detection of Banned Antibacterial Growth Promoters in Animal Feed. Analytica Chim. Acta. 483, 99–109. doi:10.1016/S0003-2670(03)00018-7
Riva, E., Ferry, N., Cometti, A., Cuisinaud, G., Gallo, G. G., and Sassard, J. (1987). Determination of Teicoplanin in Human Plasma and Urine by Affinity and Reversed-Phase High-Performance Liquid Chromatography. J. Chromatogr. B: Biomed. Sci. Appl. 421, 99–110. doi:10.1016/0378-4347(87)80383-3
Roose-Amsaleg, C., and Laverman, A. M. (2016). Do antibiotics Have Environmental Side-Effects? Impact of Synthetic Antibiotics on Biogeochemical Processes. Environ. Sci. Pollut. Res. 23, 4000–4012. doi:10.1007/s11356-015-4943-3
Sadutto, D., and Picó, Y. (2020). Sample Preparation to Determine Pharmaceutical and Personal Care Products in an All-Water Matrix: Solid Phase Extraction. Molecules. 25, 5204. doi:10.3390/molecules25215204
Sartelli, M. (2010). A Focus on Intra-Abdominal Infections. World J. Emerg. Surg. 5, 9. doi:10.1186/1749-7922-5-9
Song, X., Xie, J., Zhang, M., Zhang, Y., Li, J., Huang, Q., et al. (2018). Simultaneous Determination of Eight Cyclopolypeptide Antibiotics in Feed by High Performance Liquid Chromatography Coupled With Evaporation Light Scattering Detection. J. Chromatogr. B. 1076, 103–109. doi:10.1016/j.jchromb.2018.01.020
Soran, M.-L., Lung, I., Opriş, O., Floare-Avram, V., and Coman, C. (2017). Determination of Antibiotics in Surface Water by Solid-Phase Extraction and High-Performance Liquid Chromatography with Diode Array and Mass Spectrometry Detection. Anal. Lett. 50, 1209–1218. doi:10.1080/00032719.2016.1209516
Tanwar, J., Das, S., Fatima, Z., and Hameed, S. (2014). Multidrug Resistance: an Emerging Crisis. Interdiscip. Perspect. Infect. Dis. 2014, 1–7. doi:10.1155/2014/541340
Teepoo, S., Chumsaeng, P., Palasak, K., Bousod, N., Mhadbamrung, N., and Sae-lim, P. (2013). Unmodified Gold Nanoparticles as a Simple Colorimetric Probe for Ramoplanin Detection. Talanta. 117, 518–522. doi:10.1016/j.talanta.2013.08.021
Tsai, I., Wu, F., Gau, C., and Kuo, C. (2009). Method Development for the Determination of Teicoplanin in Patient Serum by Solid Phase Extraction and Micellar Electrokinetic Chromatography. Talanta. 77, 1208–1216. doi:10.1016/talanta.2008.08.022
United Nations (Un) (2016). General Assembly, Seventy-First Session, High Level Meeting on Antimicrobial Resistance (GA/11825). Available at: https://www.un.org/press/en/2016/ga11825.doc.htm.
Wang, X. X., Jin, P. F., Li, P. M., Xu, S., Kong, X. D., Qin, W., et al. (2020). Interlaboratory Analysis of Teicoplanin Plasma Concentration Assays Among Chinese Laboratories. J. Clin. Pharm. Ther. 45, 983–990. doi:10.1111/jcpt.13115
Wei, Y., Zhang, Y., Xu, J., Guo, C., Li, L., and Fan, W. (2014). Simultaneous Quantification of Several Classes of Antibiotics in Water, Sediments, and Fish Muscles by Liquid Chromatography-Tandem Mass Spectrometry. Front. Environ. Sci. Eng. 8, 357–371. doi:10.1007/s11783-013-0580-6
WHO (2014). Antimicrobial Resistance Global Report on Surveillance. Available at: http://apps.who.int/iris/bitstream/10665/112642/1/9789241564748eng.pdf?ua=1.
Wilson, A. P. (2000). Clinical Pharmacokinetics of Teicoplanin. Clin. Pharmacokinet. 39, 167–183. doi:10.2165/00003088-200039030-00001
Xu, H., and Käll, M. (2002). Modeling the Optical Response of Nanoparticle-Based Surface Plasmon Resonance Sensors. Sensors Actuators B: Chem. 87, 244–249. doi:10.1016/S0925-4005(02)00243-5
Keywords: teicoplanin, LC-MS/MS, cascade elution, environmental water, ramoplanin
Citation: Jin H, Zhao C, Yin Y, Zheng G, li L, Shan Q, Zhang M, Wei L, Shi X, Huang H, Zhang W and Liu S (2021) Simultaneous Determination of Active Clinical Components of Teicoplanin and Ramoplanin in Environmental Water by LC-MS/MS Coupled With Cascade Elution. Front. Environ. Sci. 9:785408. doi: 10.3389/fenvs.2021.785408
Received: 29 September 2021; Accepted: 08 November 2021;
Published: 07 December 2021.
Edited by:
Orsolya Valkó, Hungarian Academy of Science, HungaryReviewed by:
Bo Cheng, Chinese Academy of Fishery Sciences (CAFS), ChinaZhe Jiao, Dongguan University of Technology, China
Jincan He, Guangdong Pharmaceutical University, China
Yi Zhang, Shenzhen Polytechnic, China
Copyright © 2021 Jin, Zhao, Yin, Zheng, li, Shan, Zhang, Wei, Shi, Huang, Zhang and Liu. This is an open-access article distributed under the terms of the Creative Commons Attribution License (CC BY). The use, distribution or reproduction in other forums is permitted, provided the original author(s) and the copyright owner(s) are credited and that the original publication in this journal is cited, in accordance with accepted academic practice. No use, distribution or reproduction is permitted which does not comply with these terms.
*Correspondence: Yi Yin, eWluLnlpQDEyNi5jb20=