
94% of researchers rate our articles as excellent or good
Learn more about the work of our research integrity team to safeguard the quality of each article we publish.
Find out more
ORIGINAL RESEARCH article
Front. Environ. Sci., 17 December 2021
Sec. Toxicology, Pollution and the Environment
Volume 9 - 2021 | https://doi.org/10.3389/fenvs.2021.784477
This article is part of the Research TopicEnvironmental Contamination Solutions for Complex Heterogeneous SystemsView all 10 articles
Formation of the inversion layer causes a lack of vertical movement of the atmosphere and the occurrence of long-lasting high concentrations of pollution. The new invention makes use of shock waves, created by explosions of a mixture of flammable gases and air. These shock waves destroy the structure of the temperature inversion layer in the atmosphere and restore natural convection. Restoring vertical movements within the atmosphere causes a reduction in air pollution at the ground level. The system was tested at full technical scale in the environment. Preliminary effects indicate an average 24% reduction in PM10 concentration in the smog layer at ground level up to 20 m, with the device operating in 11-min series consisting of 66 explosions. It was also shown that the device is able to affect a larger area, at least 4 km2.
According to data from the World Health Organization (WHO), 90% of the world’s population is affected by polluted air. Exposure to air pollution causes about 4.2 million deaths annually (WHO Observatory, 2018). More than 60% of the global population is exposed to PM2.5 concentrations above 20 µg m−3 (van Donkelaar et al., 2016). Pollution negatively affects the human body, especially the respiratory, circulatory, reproductive, and nervous systems, causing many negative effects, including asthma, respiratory tract infections, and heart attacks (Sinha and Kumar, 2019). In the EU, Poland remains the most polluted by PM2.5. The world is facing a considerable challenge in improving air quality. The best known phenomenon associated with air pollution is smog. The term is applied to extensive contamination by atmospheric aerosol particles (London-type smog) or ozone (Los Angeles-type smog). London-type smog appears during winter, when a lot of particulate matter is emitted mainly from solid fuel furnaces used residentially. Because of these emissions released at a relatively low altitude (low-stack emission), together with the lack of pollutant dispersion under ground inversion, we can observe high concentrations of particulate matter and other pollutants. Los Angeles type of smog (called also photochemical or summer smog) appears due to the formation of ozone through the photochemical reaction of nitrogen oxides and volatile organic compounds emitted from vehicle engines (Seinfeld and Pandis, 1997).
Emission from the transportation, agriculture, and residential sectors is released at low altitudes (low-stack emissions), which makes it difficult to disperse pollutants (Ni et al., 2021). Unfavorable meteorological conditions (lack of wind and precipitation, temperature inversion) as well as terrain conditions (valleys) also hinder natural movements of air masses, causing local pollution concentrations (Li et al., 2001; Paciorek et al., 2013; Bei et al., 2016; Iwanek et al., 2017; Giemsa et al., 2021). Such weather conditions favor the formation of an inversion layer. Temperature inversion (an increase in temperature with altitude in the troposphere) reduces the vertical air movement–convection and turbulence, which causes long-lasting high PM concentration (Janhäll et al., 2006; Feng et al., 2020). In this article, the term temperature inversion will be used to refer to ground-based inversion as the most common problem in inhabitant areas. This type of inversion occurs in the low troposphere as the result of various processes, including radiation inversion and advection inversion (Zhang et al., 2009). Predicting the possible application of the invention, we distinguish three regimes of smog under the inverse temperature layer: dynamic formation, smog stagnancy, and dynamic decomposition. Counteraction of dynamic formation may be the first solution. The temperature inversion layer can appear in a few situations. It appears mainly at night with no clouds and wind, when the radiative cooling of the ground leads to colder air near the surface level rather than above it. Temperature inversion can also be formed when hotter air masses from higher ground levels move to a valley, thus closing cooler air masses. When emitted pollutants are trapped in the stable air mass below the inverse temperature layer, the concentration of pollutants rapidly increases near the ground (Seinfeld and Pandis, 1997). In this phase, forecasting is crucial. The next solution is to shorten the periods of smog stagnancy. It should be understood as a lack of vertical and horizontal movements of the ambient air. Then the concentration of pollutants increases near the ground due to local emissions. The last stage is dynamic decomposition, when the air mass moves and the inversion layer breaks down within a few hours. Usually, due to Sun radiation, the ground and air start warming and the atmosphere becomes unstable. In this case, we also consider the possibility of speed-up.
Purification methods based on urban forest planting are well known (Hirabayashi, 2021). However, its sorption capacity is inefficient during periods of the highest concentration caused by meteorological conditions. A similar method based on surface sorption consists of using the synthetic SUNSPACE coating. The material can be applied to all city surfaces (for example, walls, roofs, etc.) (Zanoletti et al., 2018). Another type of coating material is airlite paint with purification capacity based on the photocatalytic oxidation effect of titanium dioxide. Its application is similar to that of SUNSPACE (AIRLITE, 2018). These methods are a type of passive measures, dedicated to the global reduction of PM concentrations. However, the efficiency is not very high and the big-scale effect is needed to obtain a noticeable reduction. Therefore, the application is costly, requiring regular replacement of sorption surfaces and regeneration of synthetic materials. Generally, passive methods have no impact on the conditions with the highest concentration.
In contrast, there are a few different systems based on active action, such as an immediate response to smog observation. For example, there are a few types of filtering towers: Airlabs tower, Purevento’s filtrators, U-Earth’s bioreactors (Zanni and Bonoli, 2014; Cyranoski, 2018; Laxmipriya et al., 2018; Burki, 2019; PURVENTO, 2019). The concept of these solutions is based on two different types of filtering methods: physical sorption on sieves (e.g., HEPA) with an ion generator, or chemical digestion. The only limitation is that towers can treat only small areas within a limited radius (Laxmipriya et al., 2018). There is no scientific evidence for their sufficient efficiency in open urban open spaces with relatively large areas. In reality, vacuum-like solutions could provide only indoor utility to create a smog-free closed zone (Guttikunda and Jawahar, 2020). However, these actions are highly necessary, because outdoor air pollution strongly affects indoor air conditions and exposure (Leung, 2015; Brągoszewska and Biedroń, 2021; Goldstein et al., 2021). Another type of active method involves inducing ventilation of an urban area by a group of ventilation towers placed in rows. It focuses on cooperation between ventilators to reduce the effects of air pollution and smog by generating a continuous airstream with sufficient velocity to aid natural ventilation (Flaga et al., 2019). The authors are considering the installation of ventilation towers of a height exceeding 70 m each. Although the model seems to be effective, its actual use is unrealistic due to the difficulty of its installation in a closed urban development. In addition, it constitutes a permanent interference in the landscape. In conclusion, all recent innovations available on the market are inefficient on a large scale. Solutions that would be applicable to urban areas are still in the conceptual phase and there is no complex technology.
Therefore, we would like to present a completely new approach with a slightly different functionality. The main difference is the expected impact on the inversion layer (a cause of smog) by the generation of a series of shock waves. The method was already tested in a full-scale field test, and this paper summarizes the obtained results. The basis of this technology is the generation of shock waves, which are created by explosions of a mixture of flammable gases and air. The main thesis is that shock waves can destroy the structure of the temperature inversion layer in the atmosphere. This restores vertical movements within the atmosphere that cause a reduction in air pollution at ground level. Hence, the operation of the device enables natural convection processes to disperse the particulate matter.
The basic concept of operation is presented in Figure 1. The system consists of a mobile air quality monitoring system (3), equipped with devices for measuring air temperature, wind speed, and particulate matter concentration; and a shock wave generator 1) with a detonation chamber (1a) and a funnel-shaped barrel (1b). The operation was carried out according to the procedure provided by pending patent no. EU no. EP20217680.6–1001 (Leszczynski et al., 2020).
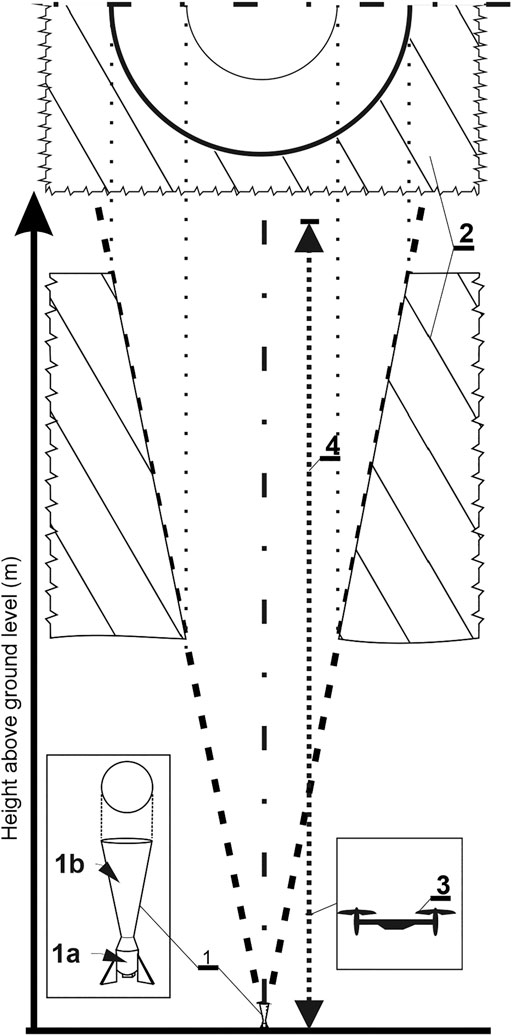
FIGURE 1. Operational concept of the impact of the invention: 1—shock wave generator, (A)–detonation chamber, (B)–funnel-shaped barrel, 2–temperature inversion layer, 3–air quality monitoring system.
Figure 2 shows the system operation algorithm. First, air temperature, wind speed, and PM10, PM2.5 concentration are measured using the air quality monitoring system (AQS). Measurements of those measurables occur in the vertical profile by measuring from 0 to the altitude at which the temperature inversion layer is identified. Measurements are made at fixed points 1–20 m apart, preferably 1 m apart. If the average wind speed, calculated from previous measurements, is greater than 0.8 m s−1 and/or the temperature drop by every 10 m at altitude is greater than 1.0°C, there are conditions for natural dispersion of smog and the measurement is interrupted. On the other hand, in the case when the wind speed is lower than 0.8 m s−1 and/or the temperature drop by 10 m in altitude is lower than 1.0°C, the air quality monitoring system will continue the operation. If the air quality monitoring system records five consecutive measurements for which the concentration of PM10 and/or PM2.5 is greater than 50 μg m−3 and/or 25 μg m−3, respectively and the temperature drop at the altitude of 10 m is less than 0.1°C, the studied area is considered as the temperature inversion layer (TI). The lower limit of this temperature inversion layer is the altitude at which the exceedances of the permissible particulate matter concentration values were measured. To determine the upper limit of the inversion layer, the measurements are continued until at least five consecutive measurements of PM10 and/or PM2.5 decrease below the permissible limits and a temperature drop at an altitude of 10 m is greater than 0.1°C. The upper limit of the inversion layer is the last altitude at which the measurement showed exceeded the concentration values of PM2.5 and PM10. Based on these measurements, the height and thickness of the temperature inversion layer are determined, and the power, frequency, and duration of the shock wave cycle are calculated. Then, a series of shock waves are generated by inserting a fuel-air mixture into the detonation chamber in the shock wave generator. After the generated shock wave cycle, the concentration of particulate matter concentration is measured at a distance of 10–20 m from the shot axis using the air quality monitoring system. To check the effects of the generated shock wave cycle, the arithmetic mean is calculated from the concentration measurements taken from 0 m to the level of the upper inversion layer, before and after the shock wave generation cycle. If the average concentration of PM2.5 and PM10 decreased by 15%, the action is suspended for at least 1–4 h. If it was less than 15%, the shock wave generation cycle is repeated immediately.
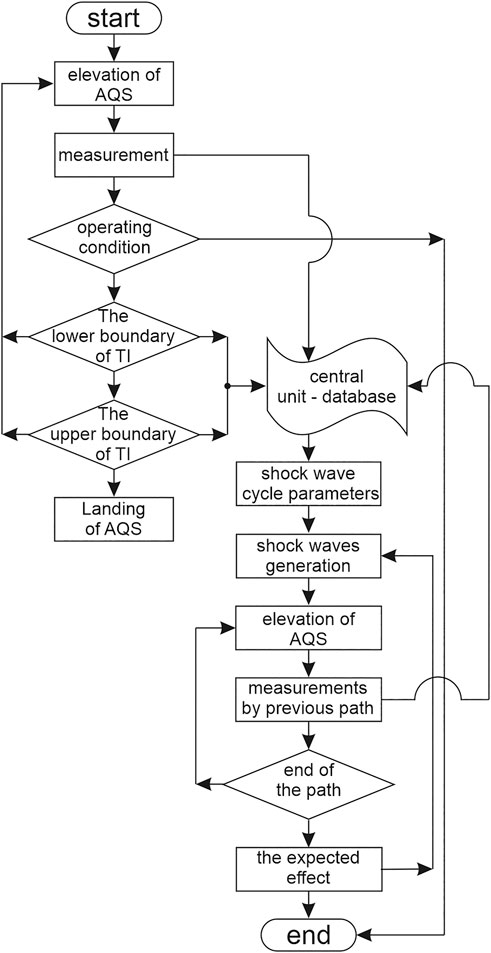
FIGURE 2. Algorithm of the method of the invention: AQS–air quality monitoring system; TI–temperature inversion layer.
The experiments were carried out in an open environment of Zabierzów municipality, located in the suburbs of Kraków–southern Poland. The test site was a partially built-up area. On one side there was a cultivated field and on the other there was a dense development of detached houses. The initial test 1 was conducted on November 25, 2019. The monitoring system consisted of a drone equipped with an altimeter, temperature, and pressure sensor, and a laser-type sensor to measure the concentration of particulate matter (PM10, PM2.5). The integrated system was made by Flytronic S.A, model: Nosacz 2 was mounted on a DJI MATRICE 200 drone. The full specification is presented in Table 1. The measurement with the monitoring system was performed in the vertical profile, where the recorded data was continuously transmitted by radio to the recorder. The results were averaged for every 5 m of altitude. The test started with the first vertical measurement. Then the drone was brought to the ground and then the generator system began to operate. The shock wave generator system was an acetylene-fed anti-hail gun with a detonation chamber with an approximate volume of 0.205 m3. The detonation lasted 11 min in cycles of 10 s (there were 66 explosions in total). After the shock wave generation cycle, PM10 and PM2.5 were measured along an altitude of 0–100 m, at a distance of 10 m from the generator. During the second test, the detonation cycle lasted 29 min with about 174 explosions. Additional data was collected from two Airly PM stations, distanced from anit hail canon at 1.109 and 2.108 km, respectively, and installed near ground level. The Airly sensor specification is described in Table 1. The location of the test is presented in Figure 3.
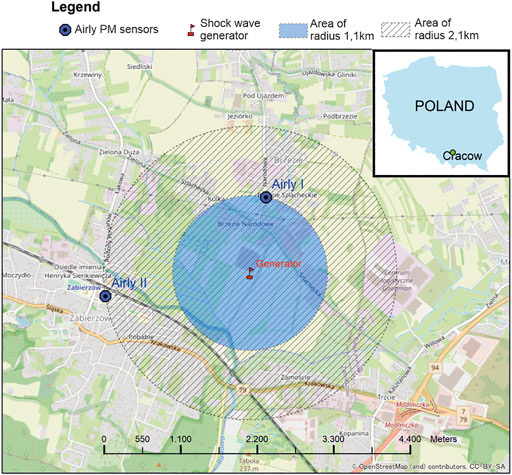
FIGURE 3. The place of operations. The area of possible impact of the invention: blue label–certain; cross-hatch label–uncertain.
To identify the scale of the application, a data set from the Polish Environmental Protection Inspectorate was analysed. In Krakow, the average height of temperature inversion for most of the year is approximately 300 m, while in summer it is approximately 250 m (Godłowska, 2019). The analysis conducted in 1961 showed that the annual number of days when the inversion of temperature was reported to be in the range of 96–175 (Palarz, 2014). Due to the high emission of pollutants, unfavorable meteorological and terrain conditions, the air quality in Kraków and the surrounding towns is bad, especially in winter (Bokwa, 2011; Godłowska, 2019). The monthly average concentration of PM10 1) and the number of days when the concentration of PM10 was greater than 50 µg m−3 2) in 2020 in selected stations located in Kraków and Zabierzów are presented in Figure 4 (Inspectorate for Environmental Protection, 2020). According to the presented historical data, on average there were 56 days with a high concentration of PM in the studied area. The test location was settled in Zabierzów as the second most polluted region. The Aleje Krasińskiego was unfavorable due to the high-density housing.
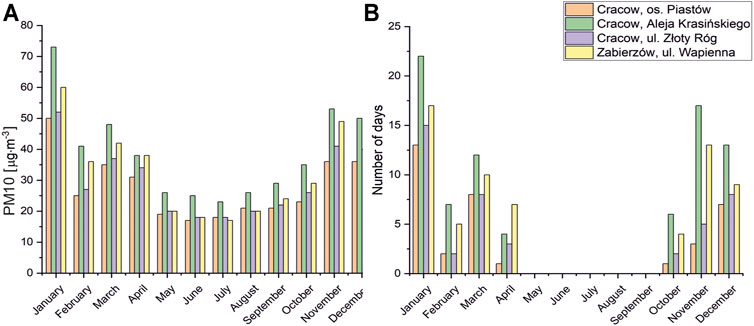
FIGURE 4. Data set of selected stations in 2020: (A) Monthly average concentration of PM10 (B) Number of days when the PM10 concentration exceeded 50 µg m−3 (Inspectorate for Environmental Protection, 2020).
The atmospheric conditions before the operation are described in Table 2, which shows the data at the ground level during both tests. According to Table 2, it can be seen that the PM concentrations were above the limits. In the EU, the annual average concentration of PM10 should not exceed 40 µg m−3 and should be no more than 35 days with a PM10 concentration greater than 50 µg m−3. The average annual concentration of PM2.5 should not exceed 25 µg m−3. In addition, the air had constant conditions (high humidity, low wind speed).
In Test 1, the temperature profile was also examined. Figure 5 shows the temperature distribution in the vertical profile during the first measurement, before the shock generation was started. The aim of measuring the temperature was to show the presence of the inversion layer, an operational condition of the method. The inversion layer is connected with the inverted distribution of the temperature profile but also with the constant temperature in the profile. Both conditions lead to the disappearance of natural convection (Yasmeen, 2011). The presence of a temperature inversion is a fundamental condition for the operation of the invention, the main purpose of which is to restore natural convection in the atmosphere. The temperature inversion layer was observed during the test 1 operation from an altitude of 50–90 m, where the decrease was below the setup value (0.1°C/10 m). This is a typical ground inversion resulting from the ground cooling overnight.
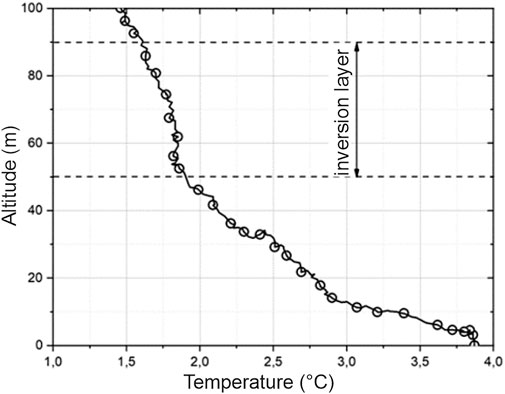
FIGURE 5. Temperature distribution in the vertical profile, including the determined region of an inversion layer.
To indicate a wider impact on air movement, the existing air monitoring system was used. Figure 6 shows the variability of PM10 and PM2.5 concentrations during both tests performed. In the figure, the linear regression is marked, as well as an area of standard deviation, as a measure of variation. The results of test 1 (Figures 6A,B) and test 2 (Figures 6C,D) showed the following correlations. Sensor 2, located 2.1 km away, did not detect the impact of the shock wave in both tests. The readings did not exceed the area of standard deviation. Another correlation was detected with sensor 1, where the concentration values of all PM clearly exceeded the border of the standard deviation areas. The effect was observed to be greater for particles of larger diameter (PM10). It shows a region affected by the invention operations, which is larger than the area of 1.1 km in diameter and less than 2.1 km in diameter. It was assumed that the impact was the same in each direction from the generator. The area of possible impact is indicated in Figure 3 by the blue region. These correlations were confirmed by performing test 2 under similar conditions.
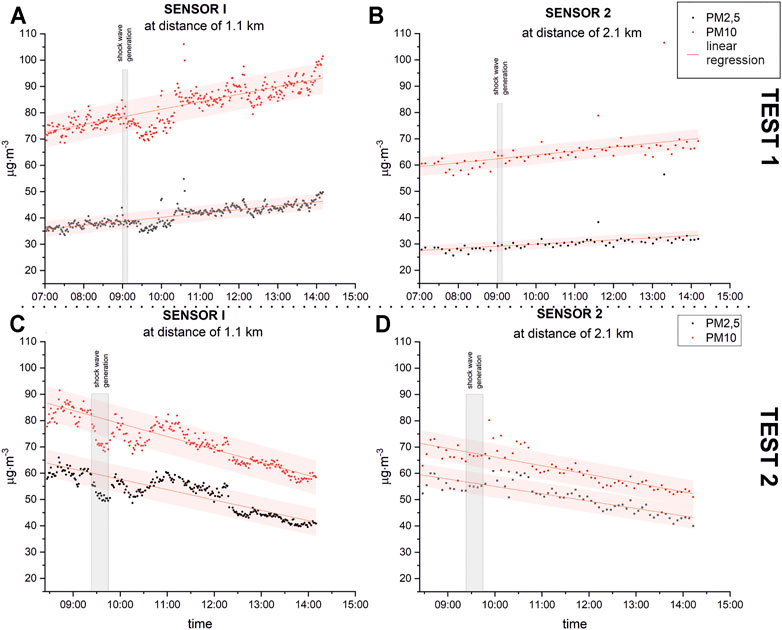
FIGURE 6. Concentration of PM10 and PM2.5 in Airly sensors in adjacent areas during the initial test: (A) sensor 1 (test 1), distanced by 1.1 km; (B) sensor 2 (test 1) distanced by 2.1 km; (C) sensor 1 (test 2); (D) sensor 2 (test 2).
To show the effectiveness of the interaction on a time scale, the variability of the concentration on the Airly PM sensors is presented in Figure 7. The Figures 7A,B shows the difference between the measured concentration of PM10 and PM2.5 and a linear regression of them shown in Figure 6. In the linear regression of the concentration of PM10 and PM2.5, it was not include the period when the shock waves generator was operating. In Test 1, the generation of 66 shock waves for 10 min resulted in a maximum reduction in PM10 concentration by 10 μg/m3 and in PM2.5 by approximately 5 μg/m3. The lower concentration of PM10 and PM2.5 values persisted for 80 min, during which time we can consider the atmosphere to be less stable. After this time, the dynamics of changes in PM10 and PM2.5 concentration returned to the upward trend. In the case of the second test in 2021, the number of generated shock waves was almost tripled. This resulted in a greater reduction in PM10 and PM2.5 concentrations by 12 and 10 μg/m3, respectively, and extended time of reduced PM10 and PM2.5 concentration to approximately 95 min after using the shock waves generator. After this time, the dynamics of the concentration changes returned to the previous trend. Therefore, with an increase in the duration of shock wave generation, the impact on PM10 and PM2.5 concentration was more noticeable in the longer term. Considering the atmosphere as a semi-equilibrum state, there is a visible tendency to return to the previous condition. However, it is possible to predict that a change in equilibrium will occur during the prolonged operation. The atmosphere is constantly changing to new equilibrium states by various factors. In case of a sufficiently long execution of the explosion, in relation to global changes, a new semi-equilibrium should be found under completely different conditions. This is a fundamental area that needs to be explored further.
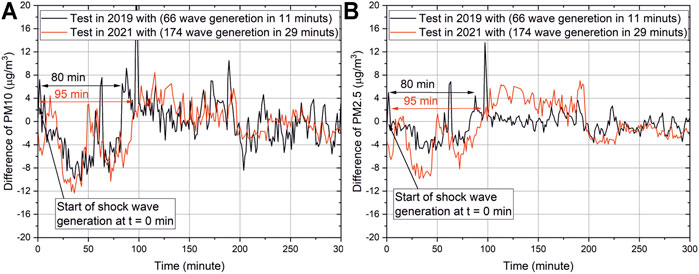
FIGURE 7. The difference between the concentration and the linear approximation for: (A) PM10 and (B) PM2.5.
The concentration of the PM10 and PM2.5 fractions is shown in Figure 8. It shows the distribution of both fractions during flight 1 and flight 2, which accordingly represents the condition before and 10 min after the shock wave generation. The analysis demonstrated the appearance of a lift force that impacts the particulate matter. At ground level, PM concentrations decreased; an increase in level was observed above 80 m. The average concentration of PM10 up to 20 m decreased by 24%, from 75.2 µg m−3–56.8 µg m−3. PM2.5 particles were less affected by air flow. The average concentration of PM2.5 up to 20 m decreased by 15%, from 52.6 µg m−3–44.9 µg m−3.
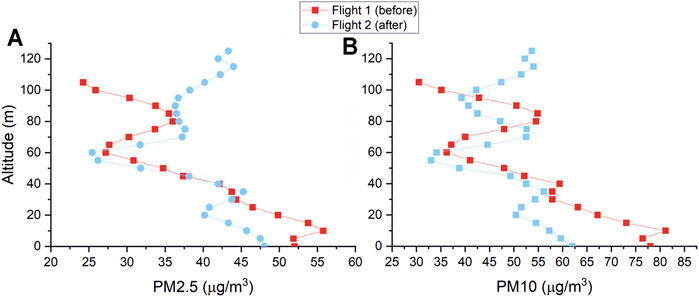
FIGURE 8. Concentration graph (test 1) before and after shock wave generation: (A) PM10 and (B) PM2.5.
The air purification system has been shown to affect a larger area. The impact on PM concentration in air was observed at a distance of 1.1 km. This means that the effect could be perceived on an area of at least 4 km2. We have obtained satisfactory results that demonstrate long-range impact in two independent seasons.
What is striking here is the significant impact during a short action. A reduction in PM10 and PM2.5 concentrations was observed in the short-range observation. The greatest impact was observed for PM10 particles; the average concentration near the ground was reduced by 24%. However, other particle concentrations of smaller diameter were also reduced.
The potential of the invention for destruction of the inversion layer was recognized along with the possibility of reducing the period of stagnation of the atmosphere. Therefore, the method can be used in highly urbanized areas with significant low stack emissions, where there are natural conditions for the presence of smog due to the formation of an inversion layer (basin, river valleys).
The method according to the invention does not require significant investment in infrastructure. The shock wave generator can be mounted on a vehicle and moved anywhere. It eliminates passive waiting for a change in atmospheric conditions, which will reduce the level of PM level in the area under the inversion layer. These results provide a significant first step towards the brand-new method of air purification.
For the purposes of the presented tests of the invention, the authors wished to demonstrate only effects on the basis of the initial and final parameters. This study provides the basis for a new method of air purification. Future research is needed to assess the potential of the scaling effect to achieve complete purification of a larger area.
The raw data supporting the conclusion of this article will be made available by the authors, without undue reservation.
All authors were engaged in obtaining data from both tests. FJ, DG, and JZ analyzed the data. FJ, DG, and JZ wrote the paper. JL, KS, MS, BK, and WS provided substantive comments, corrections and valuable suggestions for improving the manuscript.
This work was partially supported by the research subvention supported by the Polish Ministry of Education and Science grant number 16.16.210.476 and as part of the research project untitled “Development of an intervention system to reduce particulate matter concentration in the air” as part of the Innovation Incubation 4.0 project, application no. MNiSW/2020/316/DIR.
The authors declare that the research was conducted in the absence of any commercial or financial relationships that could be construed as a potential conflict of interest.
All claims expressed in this article are solely those of the authors and do not necessarily represent those of their affiliated organizations, or those of the publisher, the editors and the reviewers. Any product that may be evaluated in this article, or claim that may be made by its manufacturer, is not guaranteed or endorsed by the publisher.
The authors gratefully acknowledge use of the data from Airly Inc. Air monitoring system.
The Supplementary Material for this article can be found online at: https://www.frontiersin.org/articles/10.3389/fenvs.2021.784477/full#supplementary-material
Bei, N., Xiao, B., Meng, N., and Feng, T. (2016). Critical Role of Meteorological Conditions in a Persistent Haze Episode in the Guanzhong Basin, China. Sci. Total Environ. 550, 273–284. doi:10.1016/j.scitotenv.2015.12.159
Bokwa, A. (2011). Influence of Air Temperature Inversions on the Air Pollution Dispersion Conditions in Krakow. Prace Geograficzne 126, 4219.
Brągoszewska, E., and Biedroń, I. (2021). Efficiency of Air Purifiers at Removing Air Pollutants in Educational Facilities: A Preliminary Study. Front. Environ. Sci. 9, 370. doi:10.3389/fenvs.2021.709718
Burki, T. K. (2019). The Innovations Cleaning Our Air. Lancet Respir. Med. 7 (2), 111–112. doi:10.1016/S2213-2600(19)30002-5
Cyranoski, D. (2018). China Tests Giant Air Cleaner to Combat Smog. Nature 555 (7695), 152–153. doi:10.1038/d41586-018-02704-9
[Dataset] Inspectorate for Environmental Protection (2020). Air Quality - Measurement Data Bank. Available at: https://powietrze.gios.gov.pl/pjp/archives (Accessed on: November 24, 2021).
Feng, X., Wei, S., and Wang, S. (2020). Temperature Inversions in the Atmospheric Boundary Layer and Lower Troposphere Over the Sichuan Basin, China: Climatology and Impacts on Air Pollution. Sci. Total Environ. 726, 138579. doi:10.1016/j.scitotenv.2020.138579
Flaga, Ł., Pistol, A., Pistol, A., Krajewski, P., and Flaga, A. (2019). Model Tests of Dynamic Action on the Atmospheric Boundary Layer - Linear Configuration of Ventilation Towers on a Rough Terrain. Czasopismo Techniczne 7, 63–79. doi:10.4467/2353737xct.19.072.10723
Giemsa, E., Soentgen, J., Kusch, T., Beck, C., Münkel, C., Cyrys, J., et al. (2021). Influence of Local Sources and Meteorological Parameters on the Spatial and Temporal Distribution of Ultrafine Particles in Augsburg, Germany. Front. Environ. Sci. 8, 280. doi:10.3389/fenvs.2020.609846
Godłowska, J. (2019). Influence of Meteorological Conditions on Air Quality in Krakow. Comparative Research and an Attempt at a Model Approach. Kraków, Poland: Institute of Meteorology and Water Management National Research Institute.
Goldstein, A. H., Nazaroff, W. W., Weschler, C. J., and Williams, J. (2021). How Do Indoor Environments Affect Air Pollution Exposure? Environ. Sci. Technol. 55 (1), 100–108. doi:10.1021/acs.est.0c05727
Guttikunda, S., and Jawahar, P. (2020). Can We Vacuum Our Air Pollution Problem Using Smog Towers? Atmosphere 11 (9), 922. doi:10.3390/atmos11090922
Hirabayashi, S. (2021). Technical Specifications of Urban Forests for Air Purification: A Case Study in Tokyo, Japan. Trees, Forests and People 4, 100078. doi:10.1016/j.tfp.2021.100078
Iwanek, J. S., Kamiński, J., Durka, P., Kobus, D., Kostrzewa, J., and Pecka, T. (2017). Analysis of Selected Episodes of High Concentrations of PM10 from the Years 2013-2016. Warsaw, Poland: Chief Inspectorate of Environmental Protection.
Janhäll, S., Olofson, K., Andersson, P., Pettersson, J., and Hallquist, M. (2006). Evolution of the Urban Aerosol during winter Temperature Inversion Episodes. Atmos. Environ. 40 (28), 5355–5366. doi:10.1016/j.atmosenv.2006.04.051
Laxmipriya, S., Kumar, A. A., Aravinthan, S., and Arunachalam, N. (2018). Reduction of Air Pollution Using Smog-Free-Tower a Review Paper. IRJAET 4, 3251–3255.
Leszczynski, J. K. B., Suwała, W., Stobiński, M., Szarłowicz, K., Zyśk, J., Jędrzejek, F., et al. (2020). The Method of Reducing Dust Accumulation in the Smog Layer, Which Is the Inversion Layer. Munich, Germany: European Patent Office, EP20217680.
Leung, D. Y. C. (2015). Outdoor-indoor Air Pollution in Urban Environment: Challenges and Opportunity. Front. Environ. Sci. 2, 69. doi:10.3389/fenvs.2014.00069
Li, W.-W., Orquiz, R., Garcia, J. H., Espino, T. T., Pingitore, N. E., Gardea-Torresdey, J., et al. (2001). Analysis of Temporal and Spatial Dichotomous PM Air Samples in the El Paso-Cd. Juarez Air Quality Basin. J. Air Waste Manage. Assoc. 51 (11), 1551–1560. doi:10.1080/10473289.2001.10464377
Ni, H., Huang, R.-J., Pieber, S. M., Corbin, J. C., Stefenelli, G., Pospisilova, V., et al. (2021). Brown Carbon in Primary and Aged Coal Combustion Emission. Environ. Sci. Technol. 55 (9), 5701–5710. doi:10.1021/acs.est.0c08084
[Online] PURVENTO (2019). Fresh Air for Kiel: City of Kiel and Purevento GmbH to Start Test Phase with City Air Purifier at Theodor-Heuss-Ring. Trittau, Germany: Kiel. February 6, 2019. Available at: https://www.purevento.com/wp-content/uploads/2019/02/Purevento_Kiel-tests-the-city-air-cleaner-pressinformation-EN.pdf (Accessed on: November 24, 2021).
Paciorek, M. K. E., Klejnowski, K., Ośródka, L., Hajto, M., Szeflińska, K., Wojtylak, M., et al. (2013). Analysis of Selected Episodes of High PM10 Concentrations Based on Measurement and Meteorological Data and Trajectory Analysis. Warsaw, Poland: Chief Inspectorate of Environmental Protection.
Palarz, A. (2014). Zmienność Inwersji Temperatury Powietrza Nad Krakowem W Świetle Warunków Cyrkulacyjnych. Prace Geograficzne 138, 29–43. doi:10.4467/20833113PG.14.016.2698
Seinfeld, J. H., and Pandis, S. N. (1997). Atmospheric Chemistry and Physics : From Air Pollution to Climate Change. New York: Wiley-Interscience.
Sinha, J., and Kumar, N. (2019). Mortality and Air Pollution Effects of Air Quality Interventions in Delhi and Beijing. Front. Environ. Sci. 7, 15. doi:10.3389/fenvs.2019.00015
van Donkelaar, A., Martin, R. V., Brauer, M., Hsu, N. C., Kahn, R. A., Levy, R. C., et al. (2016). Global Estimates of Fine Particulate Matter Using a Combined Geophysical-Statistical Method with Information from Satellites, Models, and Monitors. Environ. Sci. Technol. 50 (7), 3762–3772. doi:10.1021/acs.est.5b05833
WHO Observatory (2018). Mortality from Household Air Pollution. Luxembourg, Luxembourg: World Health Organization.
Yasmeen, Z. (2011). Inversion Layer and its Environmental Impact over Karachi. Pakistan J. Meteorology 7, 1–10.
Zanni, S., and Bonoli, A. (2014). Indoor Air Quality in Waste Treatment: Environmental Issue and Biotechnology Application for Air Pollution Containment, a Case Study. WSEAS Trans. Environ. Develop. 10, 529–541.
Zanoletti, A., Bilo, F., Borgese, L., Depero, L. E., Fahimi, A., Ponti, J., et al. (2018). SUNSPACE, A Porous Material to Reduce Air Particulate Matter (PM). Front. Chem. 6, 534. doi:10.3389/fchem.2018.00534
Keywords: environmental pollution, air purification, particulate matter, air pollution, shock wave generator, urban space, temperature inversion
Citation: Jędrzejek F, Gryboś D, Zyśk J, Leszczyński J, Szarłowicz K, Stobiński M, Kubica B and Suwała W (2021) The Innovative Method of Purifying Polluted Air in the Region of an Inversion Layer. Front. Environ. Sci. 9:784477. doi: 10.3389/fenvs.2021.784477
Received: 01 October 2021; Accepted: 17 November 2021;
Published: 17 December 2021.
Edited by:
Ravi Naidu, University of Newcastle, AustraliaReviewed by:
Atar Singh Pipal, Ming Chi University of Technology, TaiwanCopyright © 2021 Jędrzejek, Gryboś, Zyśk, Leszczyński, Szarłowicz, Stobiński, Kubica and Suwała. This is an open-access article distributed under the terms of the Creative Commons Attribution License (CC BY). The use, distribution or reproduction in other forums is permitted, provided the original author(s) and the copyright owner(s) are credited and that the original publication in this journal is cited, in accordance with accepted academic practice. No use, distribution or reproduction is permitted which does not comply with these terms.
*Correspondence: F. Jędrzejek, amVkcnplamVrQGFnaC5lZHUucGw=
Disclaimer: All claims expressed in this article are solely those of the authors and do not necessarily represent those of their affiliated organizations, or those of the publisher, the editors and the reviewers. Any product that may be evaluated in this article or claim that may be made by its manufacturer is not guaranteed or endorsed by the publisher.
Research integrity at Frontiers

Learn more about the work of our research integrity team to safeguard the quality of each article we publish.