 Xinlong Qin
- 1College of Water Conservancy, Yunnan Agricultural University, Kunming, China
- 2Yunnan Hydrology and Water Resources Bureau, Kunming, China
Nanpan River is the source of the Pearl River in China, and thus, the exploitation of water resources in the Nanpan River Basin directly affects development in its middle and lower reaches. In the present study, the availability of water resources in the Nanpan River Basin and their differences were investigated. Sixteen statistical variables including the 25th and 75th percentiles, the coefficient of variation of the seasonal and annual precipitation and the annual precipitation concentration index were examined using monthly precipitation data collected in 33 stations in the Nanpan River Basin from 1956 to 2016. This paper studies the relationship between the Spearman’s rank correlation coefficient and the distance between stations, and uses principal component analysis (PCA) and cluster analysis to identify the homogeneous precipitation regions in the Nanpan River Basin. The results reveal the following: 1) The Spearman’s rank correlation coefficients for the monthly, seasonal and annual precipitation of the stations exhibit negative correlations with the interstation distance; the stronger the spatial correlation between both parameters, the shorter the time scale. 2) The factors controlling the spatial patterns of precipitation in the basin are its interannual and intra-annual variations. 3) Precipitation for the Nanpan River Basin produce two homogenous regions, which are associated with the influences of the South Asian monsoon, the North Atlantic Oscillation and the South Branch Trough. The first region is mainly to the east of longitude 104°E, while the second is principally to the west.
1 Introduction
The Pearl River is a major river in southern China that connects East China to West China and has the second largest discharge of any river in China, and its downstream area is one of the most economically developed regions in the country (Zhang et al., 2012). Existing studies on precipitation in the Pearl River Basin have mainly used the lower reaches of the Pearl River Basin as the study area (Zhang et al., 2009; Fischer et al., 2010; Fischer et al., 2012). However, as the source of the Pearl River system (Dou and Qiyang, 2020), the Nanpan River Basin, particularly the precipitation in the region, has been the subject of relatively few studies.
In recent years, climate change has exacerbated the heterogeneity of the temporal and spatial distribution of precipitation (Li et al., 2016; Vu et al., 2018), which has caused changes in the intensity and frequency of precipitation (Ma et al., 2015; Cooley and Chang, 2017), in turn affecting the development and utilization of water resources (Immerzeel et al., 2012; Berghuij et al., 2017). Research on the spatial distribution and regionalization of precipitation is conducive to the development and utilization of water resources (Berndtsson and Niemczynowicz, 1988; Dinpashoh et al., 2004; Ilbay-Yupa et al., 2021). Correlation analysis, principal component analysis (PCA), spectral analysis and cluster analysis (Fazel and Berndtsson, 2018) are commonly used to study the spatial distribution and regionalization of precipitation, and the combination of PCA and cluster analysis can better describe the spatial distribution of precipitation and identify homogeneous precipitation regions (Dinpashoh et al., 2004; Modarres and Sarhadi, 2011; Fazel and Berndtsson, 2018). However, different basins have different spatial distributions of precipitation (Fazel and Berndtsson, 2018). Although it is the source of the second-largest river in China, few scholars have studied the spatial distribution of precipitation and precipitation zoning in the Nanpan River Basin.
Therefore, we performed spatial correlation analysis on the monthly precipitation data of 33 precipitation stations in the Nanpan River Basin. The relationship between Spearman’s rank correlation coefficient and the distance between stations was analysed to reveal the spatial variation and overall picture of regional precipitation and whether the basin is a uniform precipitation area (Berndtsson and Niemczynowicz, 1988). On this basis, 16 statistical indicators related to precipitation were extracted for PCA; the principal component score was used for cluster analysis to divide the Nanpan River Basin into two regions of homogeneous precipitation areas; the differences between the two homogeneous precipitation regions were analysed; and the effects of the South Asian monsoon, the North Atlantic Oscillation (NAO), and the South Branch trough on different precipitation areas were investigated.
2 Materials and Methods
2.1 Study Area and Data
The Nanpan River Basin is located in Yunnan Province, China, with a drainage area of 43,181 km2 (Chen et al., 2017). The Nanpan River provides important water resources for the development of the Central Yunnan Economic Zone in Yunnan Province (Xu-Yu and Zhang, 2012). The topography of the basin is complex, with high elevations in the west and low elevations in the east, and the highest peak, Liangwang Mountain, is 2,820 m above sea level. The average elevation is 297–2,820 m, and it spans from 102.2 to 106.2°E and from 23.2 to 26.8°N. Belonging to the subtropical monsoon climate zone, the wet season is from May to October, the dry season is from November to april of the following year, and the precipitation is concentrated in summer (Zhou et al., 2006).
In this study, the monthly precipitation data of 33 precipitation stations with complete records from the years 1956-2016 were selected to analyse the regional characteristics of precipitation in the Nanpan River Basin. The data came from the Yunnan Hydrology and Water Resources Bureau, China, an organization that specializes in the collection of data and the management of regional hydrology and water resources, so the deemed data are reliable. The elevation of the selected stations is between 530 and 2,060 m, so the maximum elevation difference between any two stations is 1,530 m, and the distribution of stations is generally even. The longitude and latitude of the stations range from 102.4 to 105.82°E and 23.38–26.22°N (Figure 1), respectively. Based on the monthly precipitation data, the multiyear average precipitation, spring (March–May) precipitation, summer (June–August) precipitation, autumn (September–November) precipitation, and winter (December–February) precipitation at each station were extracted. The multiyear average precipitation is between 712.1 and 1646.7 mm (Table 1). The spatial distribution of precipitation is not uniform, and the most precipitation-rich station, Luoping, receives 934.6 mm more precipitation than the least precipitation-rich station, Yuguopo. At the same time, the South Asian summer monsoon index (SASMI) (http://www.lijianping.cn) (Jianping and Zeng, 2002; Li and Zeng, 2003) and the North Atlantic Oscillation Index (NAO Index) (Jones et al., 1997) (http://www.cru.uea.ac.uk/cru/data/nao/) were collected.
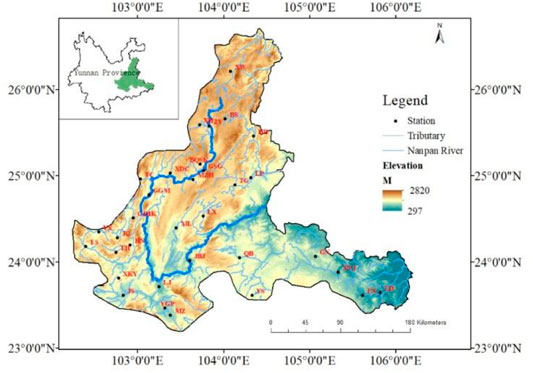
FIGURE 1. Locations of meteorological stations.
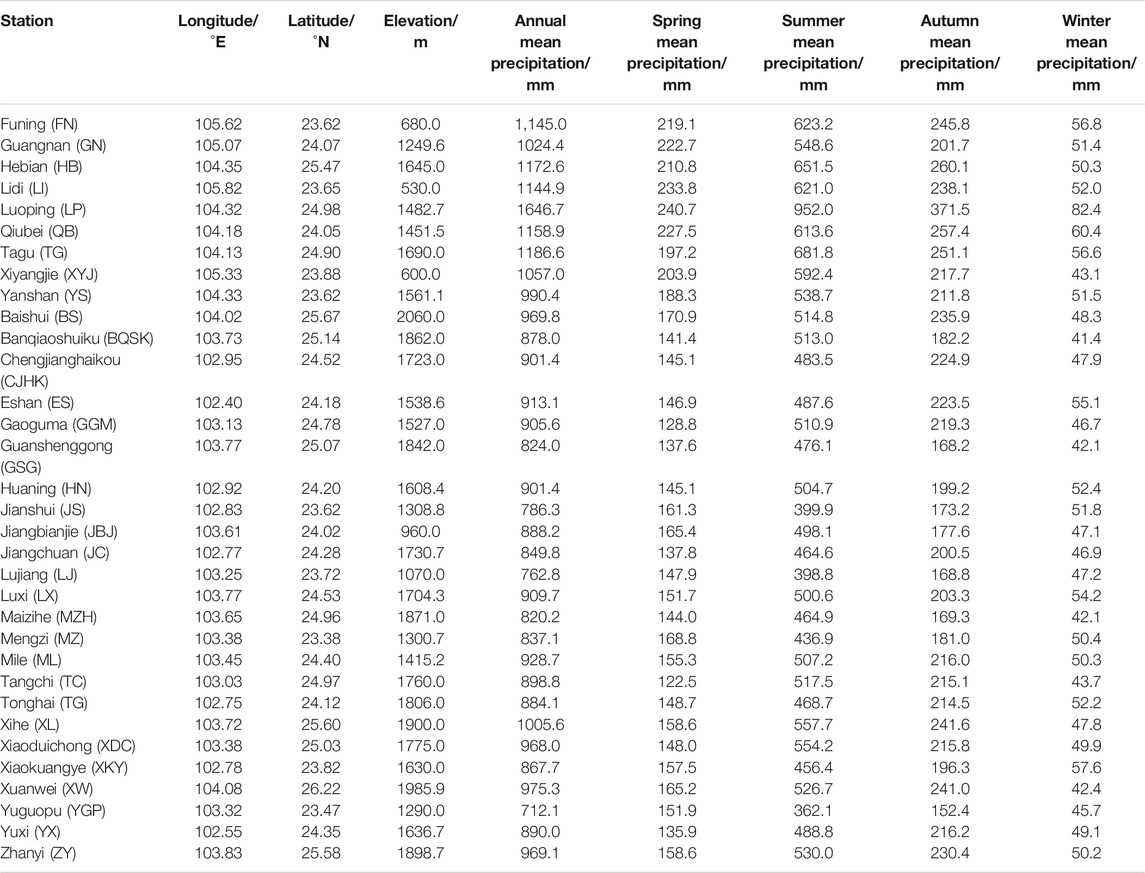
TABLE 1. Geographic information and annual and seasonal precipitation at rainfall station of Nanpan River basin (1956-2016).
2.2 Methods
In this study, Spearman’s rank correlation coefficient between station precipitation is first calculated to analyse the correlation with station distance and is used to describe the spatial correlation of precipitation. Sixteen statistical indicators were extracted from monthly precipitation data, and the principal components affecting precipitation were obtained by dimensionality reduction using principal component analysis. Cluster analysis was then carried out using the principal component scores of individual stations and was used to identify the spatial pattern of precipitation and homogeneous precipitation areas in the Nanpan River Basin.
2.2.1 Spearman’s Rank Correlation Coefficient
Spearman’s rank correlation coefficient (ρ) is often used in statistics to measure the correlation between two variables x and y (Hubert, 1972; Szmidt and Kacprzyk, 2010), where the correlation between the variables can be described using a monotonic function. If y tends to increase when x increases, then ρ > 0; if y tends to decrease when x increases, then ρ < 0; and if y has no tendency to increase or decrease when x increases, then ρ = 0. The correlation coefficient estimated by the Spearman method is more reasonable and has less error than other variables. The correlation coefficient ρ is given by the following equation:
where x and y are two random variables, the number of variables is N, and the ith value of the two random variables (1 ≤ i ≤ N) is denoted by xi and yi, respectively.
Spatial correlations between stations can be derived by combining Spearman’s rank correlation coefficients for station precipitation with the interstation distances.
2.2.2 PCA
PCA is a validated climate zoning method (Richman, 2010). The main steps are as follows:
1) Standardize the original data matrix
2) Calculate the correlation matrix
3) Find the eigenvalues and eigenvectors of the correlation matrix R.
Arrange the eigenvalues in order of magnitude,
4) Calculate the Factor Load Matrix
5) Perform Varimax Rotation
Varimax rotation is adopted to simplify the structure of the factor load matrix and facilitate the interpretation of each principal factor. In the factor load matrix, the maximum variance V of each factor load is used as the criterion to simplify the factor load matrix, and the factor load matrix with the simplest structure is finally obtained through calculations.
6) Calculate the Factor Score
where,
In addition, before PCA, the Kaiser–Meyer–Olkin (KMO) test needs to be run (Henry, 1970) to verify whether the data are reasonable. The value of the test result ranges from 0 to 1, and it needs to be greater than 0.5 and, ideally, close to one to be suitable for PCA. The calculation is as follows:
where
The 16 precipitation indicators used in this study (PCI, and the 25th percentile, 75th percentile, and coefficient of variation (CV) of annual and seasonal precipitation) include not only those reflecting precipitation (the 25th percentile and 75th percentile of annual and seasonal precipitation) but also those reflecting the annual distribution and interannual variation in precipitation (PCI and CV). PCA can reduce the complexity of the variables and leave only the main components for further study.
2.2.3 Cluster Analysis
Cluster analysis is an important method for quantitatively studying the classification and zoning of samples. Common cluster analysis methods include hierarchical cluster methods, dynamic cluster methods, and fuzzy cluster methods. The basic principle is that, according to the attributes of the samples, the affinity between the samples is quantitatively described using mathematical methods based on a certain similarity or difference, and the samples are clustered according to the calculated affinity (Xu, 1996).
In this study, to determine which stations were similar in the Nanpan River Basin, Ward’s method, which is the most commonly used method in climate zoning, was run in SPSS Statistics 26 software for hierarchical cluster analysis (Uvo, 2003; Sarhadi and Heydarizadeh, 2013; Fazel and Berndtsson, 2018). The cosine distance was used (Hajeer, 2012). The calculation method is shown in Equation (4):
where, xjk is the calculated
3 Results and Analysis
3.1 Spatial Correlation
Based on Eq. 1, Spearman’s rank correlation coefficients of precipitation at each station over different time scales were calculated, and the relationship between Spearman’s rank correlation coefficients of the precipitation of all 33 stations and the interstation distance was obtained, as shown in Figure 2. This process was conducted to reveal the spatial correlation at different time scales and whether the basin is a homogeneous precipitation region.
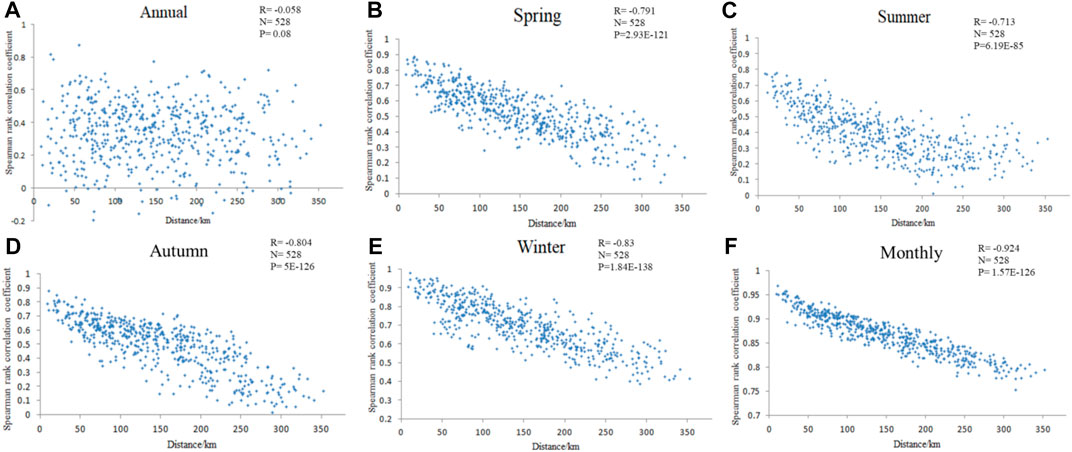
FIGURE 2. Spatial correlation of rainfall stations at different time scales (A: Annual, B–E: Seasonal, F: Monthly).
Figure 2A shows that on the annual scale, Spearman’s rank correlation coefficient varies widely, between -0.2 and 0.9, and the variation is most significant when the interstation distance is less than 50 km, which occurs when slopes that have the same exposure experience rainfall of similar magnitudes. Hence, there is an increase in correlation between stations on equally oriented slopes, whereas over shorter distances, there may be a decrease in correlation. This behaviour is known as the hole effect (Bacchi and Kottegoda, 1995). As the distance increases, the variation range of Spearman’s rank correlation coefficient gradually decreases. At 200 km, Spearman’s rank correlation coefficient is between 0 and 0.6. Analysis of the relationship between distance and Spearman’s rank correlation coefficient of precipitation yields a Pearson correlation coefficient R of -0.058, which is significant at the 90% confidence level, indicating that the annual precipitation has a certain negative spatial correlation.
As shown in Figures 2B–F, at a certain distance, the variation amplitude of Spearman’s rank correlation coefficient on the seasonal and monthly scales is smaller than that on the annual scale, and with increasing distance, the coefficient gradually decreases. The absolute value of the R between distance and Spearman’s rank correlation coefficient of precipitation is greater than 0.7. The R values of spring, summer, autumn, winter, and monthly precipitation are −0.791, −0.713, −0.804, −0.83, and −0.924, respectively, which are all significant at the 99.9% confidence level. These results indicate that there is a significant negative spatial correlation in the seasonal and monthly precipitation in the Nanpan River Basin.
According to the spatial correlation at different scales, the R is worst at the annual scale, at -0.058, followed by those at the seasonal scale, at −0.791, −0.713, −0.804, and −0.83, while R is best at the monthly scale, at −0.924. These results indicate that the spatial correlation of precipitation in the Nanpan River Basin is greater at finer time scales, and in terms of precipitation, the Nanpan River Basin is not a homogeneous precipitation region. PCA and cluster analysis can be used to further analyse and identify the homogeneous precipitation regions.
3.2 Homogeneous Rainfall Groups and Precipitation Characteristics
The Kaiser–Meyer–Olkin (KMO) test value of 0.647 obtained using Eq. 3 indicates that the selected variables are suitable for PCA. Based on the monthly precipitation data, 16 precipitation indicators, including the 25th and 75th percentiles, the CVs of the annual and seasonal precipitation and the PCI were calculated for each station, and the results are presented in Table 2. Based on the PCA analysis, five main components (PC1–PC5) were obtained from these indicators, while the varimax rotation was employed to improve the significance of the influencing variables. According to the matrices of the five principal components after rotation presented in Table 3, PC1, PC2, PC3, PC4 and PC5 explain 39.2, 16.3, 11.5, 11.4 and 10.1% of the total variance, respectively (Figure 3A); that is, 88.5% of the total variance. The comprehensive scores of the five PCs were obtained from the factor score calculated using Eq. 2. Based on the comprehensive scores for each station, the spatial distribution map was created using the ArcGIS 10.2 (Figure 4).
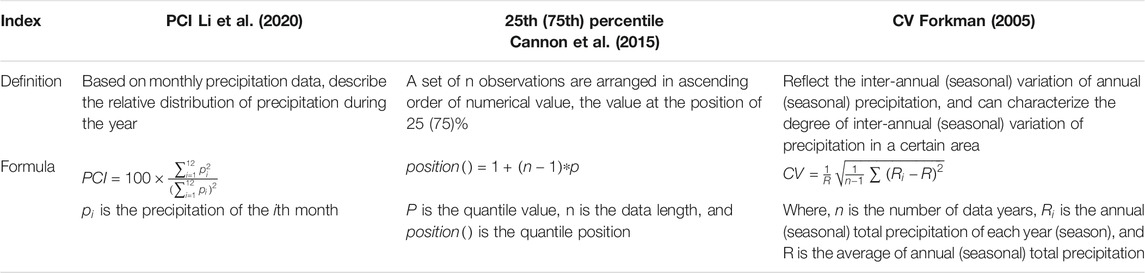
TABLE 2. PCI、25th (75th) Percentile、CV calculation formula.
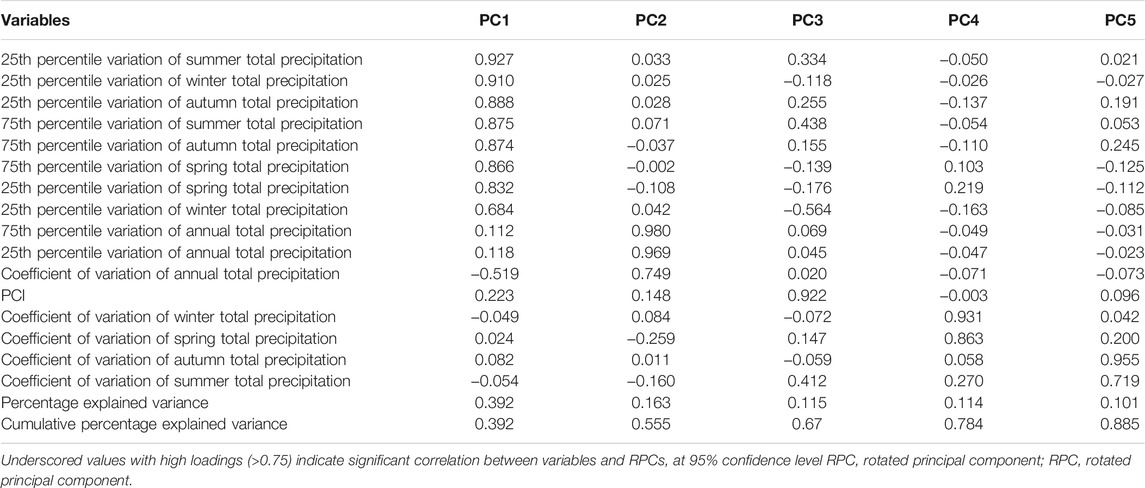
TABLE 3. Summary of principal component analysis.
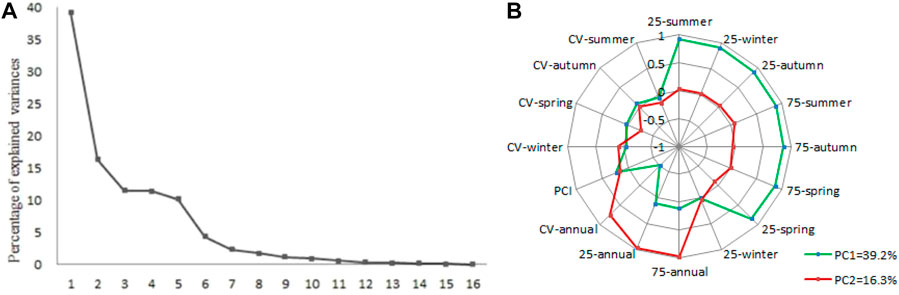
FIGURE 3. Principal Component analysis (PCA) graphs (A: Line chart of eigenvalues. B: Loading diagram of the first two principal components).
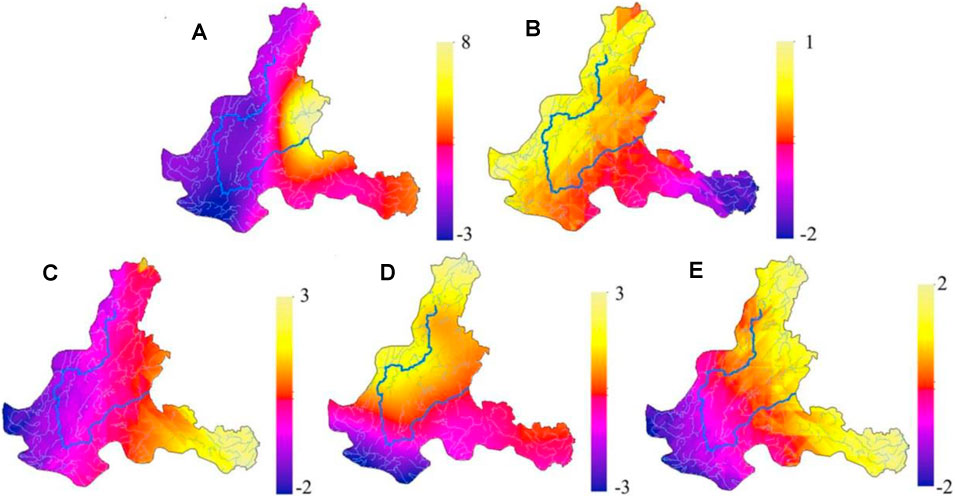
FIGURE 4. Spatial distribution of the first five principal components loadings (A: PC1 B: PC2 C: PC3 D: PC4 E: PC5).
According to the data in Table 3, the impacts of various indicators on the components differ, with a high load (>0.75) indicating that a significant correlation exists between an indicator and the correlation coefficient after rotation. The correlation coefficients of the principal components after rotation exhibit an identical confidence level of 95%.
According the data presented in Table 3 and displayed in Figure 3B, PC1, which explains 39.2% of the total variance, is associated with high loads for the 25th and 75th percentiles of the total precipitation in the spring, summer and autumn as well as for the 25th percentile of precipitation in the winter. The highest load of 0.927 obtained for the 25th percentile of the total precipitation in the summer suggests that seasonal precipitation is the main factor controlling the PC1. Spatially, Figure 4A shows that the PC1 is low in the west and high in the east of the basin, with corresponding least and maximum load values of –3 and 8. Owing to the dominant control of its 25th and 75th percentiles, the annual precipitation emerged as the principal factor controlling the PC2, which explains 16.27% of the total variance. The load range for the entire region varies from –2 to 1, with negative values in the east while other parts are characterized by positive values (Figure 4B). Therefore, the most important factors affecting the PC1 and PC2 are the annual precipitation and the 25th and 75th percentiles of the seasonal precipitation, and these highlight the importance of precipitation.
The high positive loadings for the PC3 along the south-eastern edges of the basin highlight the importance of the PCI variability in the precipitation pattern of the region (Figure 4C). The CVs for the winter and spring, which exhibit high positive loadings, are the main factors controlling the PC4. The contribution of the CV for autumn on the precipitation pattern of the region is defined by the PC5 (Figure 4E). These results indicate that the interannual and intra-annual variation of precipitation also influence the spatial pattern of precipitation in the basin.
Therefore, according to the results of the PCA, the integrated influence of the precipitation at each station and the interannual and intra-annual variation of precipitation account for the spatial pattern of precipitation in the Nanpan River Basin.
The PCA produced five PCs which explained 88% of the total variance in the precipitation, and the principal component scores for each station are presented in Table 4. Two homogeneous precipitation regions were then delineated in the Nanpan River Basin based on the hierarchical cluster analysis expressed in Eq. 4, as shown in Figure 5. The first region involves nine stations in the east of the basin (mainly east of longitude 104°E), and these are at elevations varying between 600 and 1485 m. The annual average precipitation values ranging between 990.42 and 1646.67 mm indicate that the entire region is characterized by high precipitation. Relatedly, the second region comprises 24 stations in the west of the basin (mainly west of longitude 104°E), which are at elevations ranging between 960 and 2060 m. The annual average precipitation values varying between 712.13 and 1005.64 mm are relatively lower than those for the first region, and these highlight the impact of the differences in precipitation on the delineation of zones.
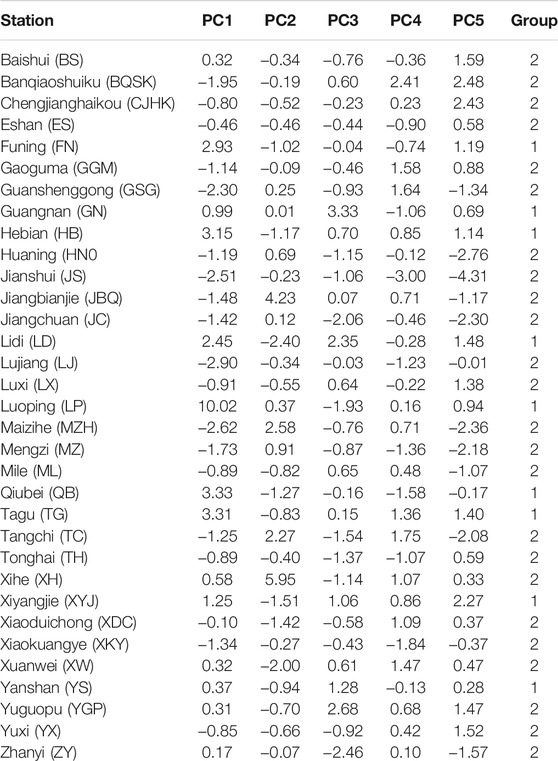
TABLE 4. Principal component score of rainfall station.
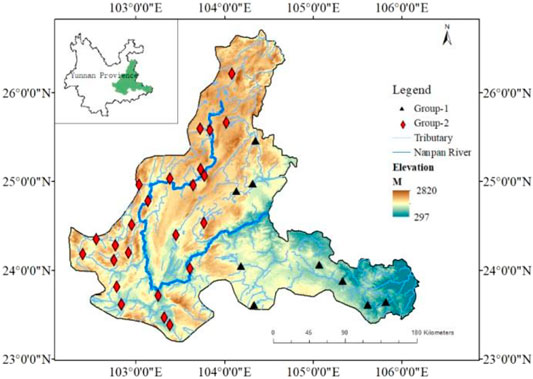
FIGURE 5. Identified the homogenous precipitation regions.
Among the 25th and 75th percentiles of the precipitation data for each season and the multiyear average precipitation, the 75th percentile of the total precipitation in the winter displays a difference of 2.23%, whereas other indicators exhibit differences greater than 19%, with a maximum of 36.73% (Table 5). Overall, the 25th and 75th percentiles of the total precipitation in the spring, summer and autumn as well as the 25th percentile of precipitation in the winter are the main factors controlling the PC1. Conversely, the 25th and 75th percentiles of the annual precipitation are the principal factors influencing the PC2.
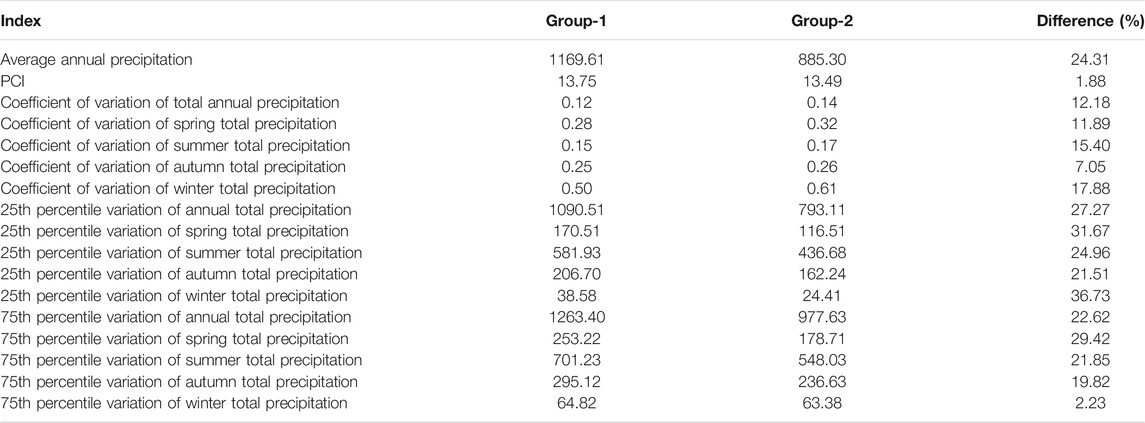
TABLE 5. Difference in precipitation index between two precipitation regions.
The relationships between the main factors controlling the PC1 and the elevation were also analysed and the results are presented in Table 6. Excluding the positive correlation between the data for the 25th percentile of the precipitation in autumn and the elevation, all other indicators display negative correlations. These results reflect the impact of the topographical characteristics including the elevation on the differences in precipitation. Therefore, the two homogeneous precipitation regions in the basin reflect differences in precipitation across the basin and the associated influences of the elevations.
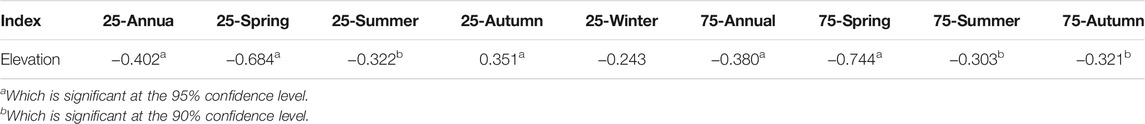
TABLE 6. The correlation between precipitation index and altitude.
4 Discussion
In the present study, monthly precipitation data collected in 33 stations in the Nanpan River Basin from 1956 to 2016 were used to compute spatial correlations between data for various stations. The PCA and cluster analyses were then integrated to highlight the characteristics of precipitation in the basin. According to the relationships between the Spearman’s rank correlation coefficient of the precipitation recorded at each station and the distances between the stations in the Nanpan River Basin, the strength of the spatial correlation increases as the time scale becomes finer. Based on the cluster analysis, the first homogeneous precipitation region is mainly to the east of longitude 104°E, and it is characterized by lower elevations and higher precipitation values relative to the second region. The second region, which is associated with higher elevations and lower precipitation values, is mainly to the west of longitude 104°E. These results are probably linked to the effects of the water vapour transport and weather systems on the precipitation in the basin.
First, precipitation mainly occurs in the Nanpan River Basin during the summer. Precipitation during the summer in the area originates mainly from water vapour transported by the South Asian monsoon (Webster and Song, 1992). This monsoon represents a coupled climate system (Webster et al., 1998) that is correlated with precipitation during the summer in the Northern Hemisphere (Jianping and Zeng, 2002), and this affects the amount of precipitation in the summer. According to Zheng and Huang. (2012), the influence of the South Asian monsoon on precipitation during the summer in Yunnan Province decreases from the east to the west. In the present study, the R values between the SASMI and the precipitation during the summer for the two homogeneous precipitation regions in the Nanpan River Basin are 0.382 and 0.359 (Table 7), and both values are significant at an identical confidence level of 90%. The higher R between precipitation and the SASMI in the first relative to the second region indicates that the South Asian monsoon exerts a stronger influence on precipitation in the east compared to the west of the basin. Alternatively, the influence of the South Asian monsoon on precipitation in the basin during the summer decreases from the east to the west. This finding is consistent with the conclusion of Zheng and Huang. (2012) that the influence of the South Asian monsoon on precipitation during the summer in Yunnan Province weakens from the east to the west.

TABLE 7. Correlation between summer precipitation and SASMI in different precipitation regions.
Secondly, in the winter, because of the influence of subtropical westerlies, the water vapour associated with precipitation in the Nanpan River Basin emanates primarily from the Bay of Bengal. This is then transported to the Yunnan Province mainly because of the activities in the South Branch Trough. However, the North Atlantic Oscillation (NAO) weakens the activities of the South Branch Trough, and thus, the wet flow into the Yunnan Province is partially hindered (Yun and Wei., 2014; Li et al., 2016). Therefore, in the present study, the Pearson’s correlations between the NAO index and precipitation during the winter in the two subregions of the Nanpan River Basin were examined, and the results are presented in Table 8. The first and second regions yielded correlation coefficients of 0.255 and 0.233, respectively, and that for the first was significant at a confidence level of 90%. To further highlight differences in the relationships between the precipitation during the winter and the NAO index for the two regions, the correlations for each station located between latitudes 23°–24°N (high density of stations) were analysed, and the results are presented in Table 9. Evidently, the correlations for stations in the first region are higher than those for stations in the second region. Based on an integration of these results and those in Figure 6, the correlation between precipitation in the winter and the NAO index increases with increasing longitude (R = 0.82). These results indicate that the influence of the NAO index on precipitation in the Nanpan River Basin changes with latitude. According to previous studies (Duan and Tao, 2012), water vapour is transported from the South Branch Trough to the Yunnan Province from the east to west and from the west to east. The transport of water vapour gradually wanes during the east-to-west movement, whereas during the west-to-east transport, the influence of the South Branch Trough on precipitation is weakened by the higher elevations in the second region. In addition, during the dry season (November–April), the KQSF, an important weather system affecting the Yunnan-Kweichow Plateau (Jong, 1949; Jong, 1950; Duan and Ying, 2002), occurs near longitude 104°E. In fact, this is an important weather phenomenon which occurs in SW China in the winter and spring (Cao et al., 2014; Tao and Cao., 2014). Based on the KQSF, the Nanpan River Basin can be partitioned into two precipitation regions, and the first, which is characterized by a relatively low topography, is in the rear area of the KQSF and to the east of longitude 104°E. The second region, which involves a higher topography, is in front of the KQSF and to the west of longitude 104°E. Therefore, as the KQSF moves westward, it gradually weakens (Zhang and Zhang, 2016), and this may be another factor that influenced our results.

TABLE 8. Correlation between winter precipitation and NAO Index in different regions.
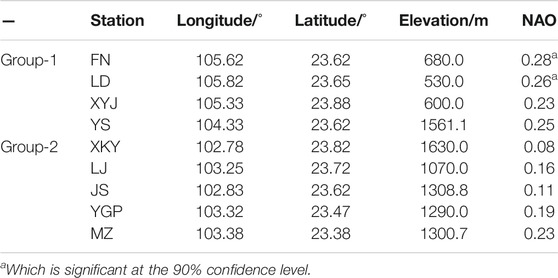
TABLE 9. Correlation between winter precipitation and NAO Index at rainfall station.
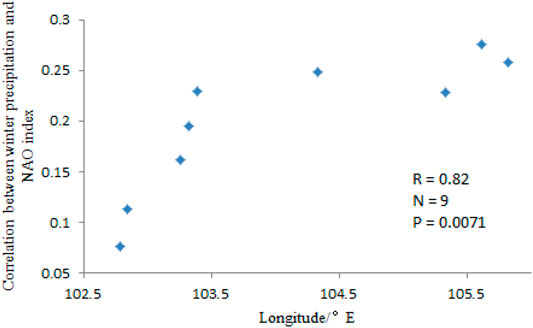
FIGURE 6. Relationship between longitude and R in 23°–24° N (R: Correlation between winter precipitation and NAO index).
5 Conclusion
The spatial correlation analysis between Spearman’s rank correlation coefficient of the precipitation at each station and the interstation distance showed that the R is the smallest at the annual scale, at -0.058, followed by the seasonal scale, with R values in spring, summer, autumn, and winter at −0.791, −0.713, −0.804, and −0.83, respectively, while the R is the largest at the monthly scale, at −0.924. Our results indicate that there is a spatial correlation in the precipitation in the Nanpan River Basin, which is stronger at finer time scales.
Through PCA, five principal components that explained 88.5% of the total variance were obtained, and the scores of the five principal components indicated that the precipitation at each station and the interannual and intra-annual variations in precipitation constituted the most prominent characteristics of precipitation in the basin.
Through cluster analysis, two homogeneous precipitation regions were identified. The first homogeneous precipitation region is mainly located east of 104°E, and the second region is mainly located west of 104°E. In summer, the two homogeneous precipitation regions are affected by the South Asian monsoon to different degrees, and the effect gradually weakens from east to west, resulting in more precipitation in the first homogeneous precipitation region than in the second region. In winter, under the influence of the NAO and South Branch trough, more precipitation occurred in the first homogeneous precipitation region than in the second region. In the dry season, near 104°E, the existence of the KQSF may also affect the results of this regional division. Therefore, under the above conditions, it is reasonable to divide the watershed into two homogeneous precipitation regions.
Data Availability Statement
The original contributions presented in the study are included in the article/Supplementary Material, further inquiries can be directed to the corresponding authors.
Author Contributions
XQ and LW contributed to the conception and design of the study, XL provides data, HY, KW and DF performed the statistical analysis. XQ wrote the first draft of the manuscript. All authors contributed to manuscript revision, read, and approved the submitted version.
Funding
This study was supported by the Science and Technology Project of Yunnan Province Education Department (No. 2020J0246, 2022J0341).
Conflict of Interest
The authors declare that the research was conducted in the absence of any commercial or financial relationships that could be construed as a potential conflict of interest.
Publisher’s Note
All claims expressed in this article are solely those of the authors and do not necessarily represent those of their affiliated organizations, or those of the publisher, the editors and the reviewers. Any product that may be evaluated in this article, or claim that may be made by its manufacturer, is not guaranteed or endorsed by the publisher.
Acknowledgments
We would like to thank Editage (www.editage.com) for English language editing, and greatly appreciate suggestions from anonymous referees for the improvement of our paper. Thanks for the data provided by Yunnan Hydrology and Water Resources Bureau. Thanks also to the editorial staff.
References
Bacchi, B., and Kottegoda, N. T. (1995). Identification and Calibration of Spatial Correlation Patterns of Rainfall. J. Hydrol. 165 (1-4), 311–348. doi:10.1016/0022-1694(94)02590-8
Berghuijs, W. R., Larsen, J. R., van Emmerik, T. H. M., Woods, R. A., et al. (2017). A Global Assessment of Runoff Sensitivity to Changes in Precipitation, Potential Evaporation, and Other Factors. Water Resour. Res. 53, 8475–8486. doi:10.1002/2017wr021593
Berndtsson, R., and Niemczynowicz, J. (1988). Spatial and Temporal Scales in Rainfall Analysis — Some Aspects and Future Perspectives. J. Hydrol. 100 (1-3), 293–313. doi:10.1016/0022-1694(88)90189-8
Cannon, A., Sobie, S. R., Murdock, Q. T., et al. (2015). Bias Correction of GCM Precipitation by Quantile Mapping: How Well Do Methods Preserve Changes in Quantiles and Extremes. J. Clim. 28 (17), 150722131126009. doi:10.1175/JCLI-D-14-00754.1
Cao, J., Yao, P., Wang, L., and Liu, K. (2014). Summer Rainfall Variability in Low-Latitude Highlands of China and Subtropical Indian Ocean Dipole. J. Clim. 27 (2), 880–892. doi:10.1175/jcli-d-13-00121.1
Chen, J., Deng, M., Xia, L., and Wang, H. (2017). Risk Assessment of Drought, Based on IDM-VFS in the Nanpan River Basin, Yunnan Province, China. Sustainability 9 (7), 1124. doi:10.3390/su9071124
Cooley, A., and Chang, H. (2017). Precipitation Intensity Trend Detection Using Hourly and Daily Observations in Portland, Oregon. Climate 5 (1), 10. doi:10.3390/cli5010010
Ding, Y., and Suo, M. (2009). The Structures and Evolutions of the Wintertime Southern Branch Trough in the Subtropical Westerlies. Chin. J. Atmos. Sciences(in Chinese) 33 (03), 425–442. doi:10.3878/j.issn.1006-9895.2009.03.03
Dinpashoh, Y., Fakheri-Fard, A., Moghaddam, M., Jahanbakhsh, S., Mirnia, M., et al. (2004). Selection of Variables for the Purpose of Regionalization of Iran's Precipitation Climate Using Multivariate Methods. J. Hydrol. 297 (1-4), 109–123. doi:10.1016/j.jhydrol.2004.04.009
Dou, X., and Qiyang, P. (2020). Impacts of LUCC and Climate Change on Runoff in the Nanpan River Basin Based on Scenario Analysis. J. Catastrophology(in Chinese) 35 (1), 84–89.
Duan, X., Tao, Y., Mei-Ling, X., Ya-Bin, L., Hong-Li, L., et al. (2012). Influence of South Branch Trough of Westerlies on Weather of Yunnan Province(in Chinese). Plateau Meteorology 31 (04), 1059–1065.
Duan, X., and Ying, L. I. (2002). The Structure of Kunming Quasi-Stationary Front. Plateau Meteorology (in Chinese) (2), 205–209. doi:10.3321/j.issn:1000-0534.2002.02.014
Fazel, N., and Berndtsson, R. (2018). Regionalization of Precipitation Characteristics in Iran’s Lake Urmia basin. Theor. Appl. Climatology 132 (1-2), 363–373. doi:10.1007/s00704-017-2090-0
Fischer, T., Gemmer, M., Liu, L., Su, B., et al. (2012). Change-points in Climate Extremes in the Zhujiang River Basin, South China, 1961–2007. Climatic Change 110 (3-4), 783–799. doi:10.1007/s10584-011-0123-8
Fischer, T., Gemmer, M., Liu, L., and Su, B. (2010). Trends in Monthly Temperature and Precipitation Extremes in the Zhujiang River Basin, South China (1961-2007). Adv. Clim. Change Res. 1 (2), 63–70. doi:10.3724/sp.j.1248.2010.00063
Forkman, F. J. (2005). Coefficients of Variation. Licentiate thesis. Uppsala: Swedish University of Agricultural Sciences.
Hajeer, I. (2012). Safaa I. Hajeer Vector Space Model: Comparison between Euclidean Distance & Cosine Measure on Arabic Documents. Int. J. Eng. Res. Appl. 2 (4), 280–286.
Hubert, J. L. (1972). A Note on the Restriction of Range for Pearson Product-Moment Correlation Coefficients. Educ. Psychol. Meas. 32 (3), 299–306. doi:10.1177/001316447203200315
Ilbay-Yupa, M., Lavado-Casimiro, W., Rau, P., Zubieta, R., Castillón, F., et al. (2021). Updating Regionalization of Precipitation in Ecuador. Theor. Appl. Climatology 143 (3-4), 1513–1528. doi:10.1007/s00704-020-03476-x
Immerzeel, W. W., van Beek, L. P., Konz, M., Shrestha, A. B., and Bierkens, M. F. (2012). Hydrological Response to Climate Change in a Glacierized Catchment in the Himalayas. Clim. Change 110 (3-4), 721–736. doi:10.1007/s10584-011-0143-4
Jianping, L., and Zeng, Q. (2002). A Unified Monsoon index. Geophys. Res. Lett. 29 (8), 1151–1154. doi:10.1029/2001GL013874
Jones, P. D., Jonsson, T., Wheeler, D., et al. (1997). Extension to the North Atlantic Oscillation Using Early Instrumental Pressure Observations from Gibraltar and South‐west Iceland. Int. J. Climatology 17, 1433–1450. doi:10.1002/(SICI)1097-0088(19971115)17:133.3.CO;2-G
Li, C., and Yang, H. (2019). Combinational Anomalies of Atmospheric Circulation System and Occurrences of Extreme Weather/Climate Events. Trans. Atmos. Sciences(in Chinese) 42 (03), 321–333. doi:10.13878/j.cnki.dqkxxb.20190302001
Li, C., Zhang, H., Singh, V. P., Fan, J., Wei, X., Yang, J., et al. (2020). Investigating Variations of Precipitation Concentration in the Transitional Zone between Qinling Mountains and Loess Plateau in China: Implications for Regional Impacts of AO and WPSH. PLOS ONE 15 (11), e0238709. doi:10.1371/journal.pone.0238709
Li, J., and Wang, M. (1987). The Analysis Ofplateauin Fluence on Regeneration of Southern Trough. Yunnan Meteorology(in Chinese) 4, 23–26.
Li, J., and Zeng, Q. (2003). A New Monsoon index and the Geographical Distribution of the Global Monsoons. Adv. Atmos. Sci. 20 (2), 299–302. doi:10.1007/s00376-003-0016-5
Li, Q., Yang, M., Wan, G., Wang, X., et al. (2016). Spatial and Temporal Precipitation Variability in the Source Region of the Yellow River. Environ. Earth Sci. 75 (7), 594.1–594.14. doi:10.1007/s12665-016-5583-8
Ma, S., Zhou, T., Dai, A., Han, Z., et al. (2015). Observed Changes in the Distributions of Daily Precipitation Frequency and Amount over China from 1960 to 2013. J. Clim. 28 (17), 6960–6978. doi:10.1175/jcli-d-15-0011.1
Modarres, R., and Sarhadi, A. (2011). Statistically-based Regionalization of Rainfall Climates of Iran. Glob. Planet. Change 75 (1-2), 67–75. doi:10.1016/j.gloplacha.2010.10.009
Richman, M. B. (1986). Rotation of Principal Components. J. Climatology 6, 293–335. doi:10.1002/joc.3370060305
Sarhadi, A., and Heydarizadeh, M. (2013). Regional Frequency Analysis and Spatial Pattern Characterization of Dry Spells in Iran. Int. J. Climatology 34 (3), 835–848. doi:10.1002/joc.3726
Szmidt, E., and Kacprzyk, J. (2010). “The Spearman Rank Correlation Coefficient between Intuitionistic Fuzzy Sets,” in 2010 5th IEEE International Conference Intelligent Systems, London, UK, 7-9 July 2010. IEEE. confproc
Tao, Y., and Cao, J. (2014). “A Cusp Catastrophe Model of Mid–long-term Landslide Evolution over Low Latitude Highlands of China,” in The 31st Annual Meeting of the Chinese Meteorological Society, Beijing, November 11, 2014, 1056–1080.
Uvo, C. B. (2003). Analysis and Regionalization of Northern European winter Precipitation Based on its Relationship with the North Atlantic Oscillation. Int. J. Climatol. 23 (10), 1185–1194. doi:10.1002/joc.930
Vu, T. M., Raghavan, S. V., Liong, S.-Y., and Mishra, A. K. (2018). Uncertainties of Gridded Precipitation Observations in Characterizing Spatio-Temporal Drought and Wetness over Vietnam. Int. J. Climatol 38 (4), 2067–2081. doi:10.1002/joc.5317
Webster, P. J., Magaña, V. O., Palmer, T. N., Shukla, J., Tomas, R. A., Yanai, M., et al. (1998). Monsoons: Processes, Predictability, and the Prospects for Prediction. J. Geophys. Res. 103 (C7), 14451–14510. doi:10.1029/97jc02719
Webster, P. J., and Song, Y. (1992). Monsoon and Enso: Selectively Interactive Systems. Quart.j.roy.meteor.soc 118 (507). doi:10.1002/qj.49711850705
Xu-Yu, M. O., and Zhang, Y. (2012). Analysis Of Spatial-Temporal Variation Of Precipitation In The Nanpan-Beipan River Basin. Yunnan Geogr. Environ. Research.
Yun, T., and Wei, H. (2014). Evolutive Features and its Causes of the Wintertime Precipitation in Yunnan Province. Plateau Meteorology(in Chinese) 33 (01), 130–139. doi:10.7522/j.issn.1000-0534.2012.00180
Zhang, J., and Zhang, W. (2016). Variation of Kunming Quasi-Stationary Front and its Effect Analysis in Winter during 1970-2009. Plateau Meteorology 2016 (5), 1000–0534. doi:10.7522/j.issn.1000-0534.2015.00042
Zhang, Q., Singh, V. P., Peng, J., Chen, Y. D., and Li, J. (2012). Spatial-temporal Changes of Precipitation Structure across the Pearl River basin, China. J. Hydrol. 440-441, 113–122. doi:10.1016/j.jhydrol.2012.03.037
Zhang, Q., Xu, C.-Y., Becker, S., Zhang, Z. X., Chen, Y. D., and Coulibaly, M. (2009). Trends and Abrupt Changes of Precipitation Maxima in the Pearl River basin, China. Atmos. Sci. Lett. 10 (2), 132–144. doi:10.1002/asl.221
Zheng, J., and Huang, W. (2012). “Precipitation Anomaly in Midsummer of Yunnan Province from 2009 to 2011 and the Influence of South Asian Summer Monsoon,” in 2011 Annual Conference of National Climate Center and climate research open laboratory of China Meteorological Administration. Beijing, October 4, 2012, 66–67.
Keywords: Nanpan River, spatial correlation, homogeneous precipitation region, South Asian monsoon, North Atlantic Oscillation, South branch trough
Citation: Qin X, Wang L, Li X, Yu H, Wang K and Fan D (2022) Regional Characteristics of Precipitation in the Nanpan River Basin, China. Front. Environ. Sci. 9:783515. doi: 10.3389/fenvs.2021.783515
Received: 26 September 2021; Accepted: 27 December 2021;
Published: 21 January 2022.
Edited by:
Ashish Sharma, University of Illinois at Urbana-Champaign, United StatesReviewed by:
Rajib Maity, Indian Institute of Technology Kharagpur, IndiaMD Wahiduzzaman, University of Tasmania, Australia
Copyright © 2022 Qin, Wang, Li, Yu, Wang and Fan. This is an open-access article distributed under the terms of the Creative Commons Attribution License (CC BY). The use, distribution or reproduction in other forums is permitted, provided the original author(s) and the copyright owner(s) are credited and that the original publication in this journal is cited, in accordance with accepted academic practice. No use, distribution or reproduction is permitted which does not comply with these terms.
*Correspondence: Xinlong Qin, 249766560@qq.com ; Long Wang, ynndwl@126.com