 Yu Huang
 Delong Zhao1,2,3*
94% of researchers rate our articles as excellent or good
Learn more about the work of our research integrity team to safeguard the quality of each article we publish.
Find out more
ORIGINAL RESEARCH article
Front. Environ. Sci., 12 November 2021
Sec. Atmosphere and Climate
Volume 9 - 2021 | https://doi.org/10.3389/fenvs.2021.783356
This article is part of the Research TopicAir Pollution Remote Sensing and the Subsequent Interactions with Ecology on Regional ScalesView all 31 articles
An aircraft platform, ground-based disdrometer, cloud radar, radiometer, and automatic station were combined to study a snowfall case (16:30–21:00 observed by ground cloud radar) on the Yangqing Mountains in Beijing. Comparing the variation of ice habit and number concentration at aircraft altitude (2.9–3.2 km) and ground, we discussed the ice growth mechanisms in the Beijing Mountains. Results indicated that the snowfall was steady but not strong with reflectivity less than 20dBZ, and cloud top altitude less than 4.5 km. The number concentrations for both liquid and ice crystals at aircraft altitude and ground were very similar, both dominated by small particles at diameters of 0.1–1.2 mm, and the proportion of mean number concentrations at small diameters both in the aircraft and on the ground was large, peaking at 44 L−1 mm−1 and 8826 L−1 mm−1 respectively, and decreased rapidly as the diameter increased. There was no mixed phase in clouds with little liquid water. Particles were relatively regular, and were transparent with dendritic and disk-hexagonal shapes. The ice crystals and snowflakes were mainly grown by the deposition and aggregation, rarely by the riming process, and no secondary ice formation was observed.
The microphysical characteristics of snowfall are affected by pollution (Shen et al., 2021; Zheng and Chen, 2021) and other factors, and the microphysical characteristics of snowflakes are important for microphysical parameterizations in numerical models and remote sensing retrieval (Hobbs et al., 1973; Cotton et al., 1982; Lin et al., 1983; Thompson et al., 2004; Cifelli et al., 2011; Morrison and Milbrandt, 2015; Guan et al., 2021; Chu et al., 2021). Most precipitation in mid and high latitudes is initiated by ice aggregation. Enhanced reflectivity near 0 °C in many precipitation clouds is due to large snowflakes and/or water-coated ice particles. Woods et al. (2008) demonstrated that more realistic empirical mass-diameter relationships and velocity-diameter relationships can change the mesoscale model simulation results significantly. Gang (2007) found that ice crystal habits and their representations are very important for calculations of radar backscattering cross sections.
Many scholars focused on the snow size distributions, which can reflect the details of snowfall microphysical processes. Alessandro and Elke (2010) used a single two-dimensional disdrometer (2-DVD) consisting of two PARSIVEL disdrometers to assess the snowflakes fall speed. They found that, unlike raindrop size distributions, snowflake size distributions were much more complex and harder to be parameterized. Brandes et al. (2007) fitted the relationship between the snow density and the particle median volume diameter, and revised the snow particle size distributions fitting Gamma parameters. Newman et al. (2009a, 2009b) used a Snowflake Video Imager-based PSD parameterization combined with the profiler of the snowflake perimeter to investigate the aggregation at different temperatures, levels of humidity, and wind conditions.
Much of the research on snow size distributions were based on measurements from ground-based or airborne probes. Yuter et al. (2006) observed the particle distribution and velocity by the PARSIVEL to identify the snow phase. Masaaki et al. (2013) identified the types of solid hydrometeors according to the measurements of its size and fall speed data. Airborne probes can detect ice particles at high altitudes directly, which is beneficial for the study of snowfall microphysical characteristics. Through well-designed spectra flight plans, Lo and Passarelli (1982) made it possible to study the ice particle spectra in detail. Woods et al. (2007) analyzed the snow size spectra collected by aircrafts and improved correlations between the size spectrum parameters and temperatures. Based on aircraft observations, Lawson et al. (2017) found that the drop-freezing secondary ice production mechanism was operating in cumulus updraft cores. Geerts et al. (2015) observed 16 snowfall cases in Wyoming by the aircraft and analyzed the snowfall growth, transmission, and deposition processes. They summarized the dynamic processes of the three types of airflows over the mountains and analyzed the characteristics of each type. They also summarized the three conceptual models of each flow regime. Saleeby et al. (2011) analyzed the in-situ observation data and concluded that the cloud microphysical parameters in cold clouds were related to raindrop number concentrations and ice crystal number concentrations, as well as the final falling velocities of raindrops. Chang et al. (2019) reported the cloud microphysical properties over the Tibetan Plateau based on aircraft data, and summarized the size distributions of cloud drops and ice microphysics characteristics. The above studies are only based on ground or aircraft observations, and cannot obtain the complete vertical snowfall microphysics characteristics.
Beijing is surrounded by mountains on three sides and the southeast plain, and has its own unique climatic characteristics. The Yanqing Mountains are located in the northern mountainous area of Beijing, with an altitude of 2199 m. The snowfall cloud there has typical winter terrain cloud characteristics. In this paper, we combined ground-based and onboard instruments to observe the formation and development of snowflakes in a snowfall case that occurred in the Beijing Yanqing Mountains, compared the variations of ice habit as well as size distributions from high altitudes with those from ground station, and discussed the snowfall mechanisms in the Beijing Mountains. This is the first study to combine high-altitude aircraft and ground measurements of snow ice crystals in the Beijing area, and will help better understanding of snow structure characteristics, improving our knowledge of the characteristics of snowfall in Beijing’s mountainous areas and providing basic theories for artificial snow enhancement, which will increase the amount of snowfall in mountainous areas, restore the ecology, and increase the water storage capacity of inland rivers.
The aircraft measurements were conducted from 15:46 to 17:30 on Jan 27, 2021, when a light snowfall case took place in Beijing. The flight track of the scientific aircraft King Air 350 ER and observational region terrain are shown in Figure 1. The aircraft flew over the Beijing Yanqing mountain and close to the Yanjiaping station, with an altitude of 2900–3200 m at 16:30–17:05 (tracks of the aircraft are shown with the orange segment of the colored line).

FIGURE 1. Terrain of observational region, tracks of aircraft (colored lines).
The instrument (including ground station and aircraft) information used in this article is listed in Table 1. The King Air 350 ER aircraft with cloud microphysical probes was used to conduct measurements. It can detect meteorological conditions and the macro and micro characteristics of clouds and precipitation. Aircraft Integrated Meteorological Measurement System (AIMMS- PMS) can obtain correct ambient temperature, humidity, pressure, horizontal wind speed and direction, vertical wind speed, and other information. Through the GPS module, it can also get the aircraft’s geographic location and flight altitude information. The Fast Cloud Droplet Probe (FCDP) measures particle size distributions and concentrations (Lawson et al., 2017). The instrument can sample cloud particles from 1–50 µm with a resolution of about 3 µm. It is capable of sizing particles with velocities from 10–200 m/ s. The liquid water content (LWC) (unit: g m−3) is derived by
where
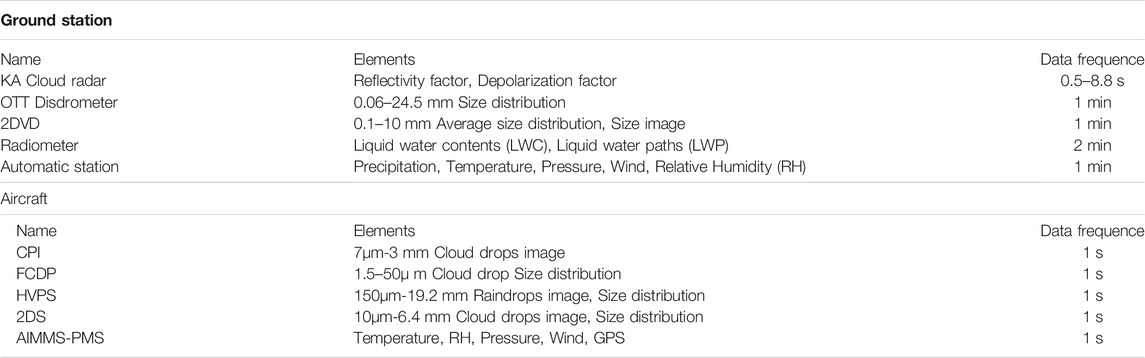
TABLE 1. Instrument parameters.
The Three-View Cloud Particle Imager (3V-CPI) measures the size, shape, and concentration of water drops and ice particles in clouds (Lawson et al., 2001). The probe is a combination of three imaging instruments. Two of them comprise a 2D-S (Two-Dimensional Stereo hydrometeor spectrometer), in which two high-resolution (about 9 µm resolutions) 2D probes image particles as they pass through laser beams that are orthogonal to each other (Lawson et al., 2017). If particles also lie in the intersection of the sensitive areas of two beams, they are seen by both 2D probes. In that case, the third instrument, a Cloud Particle Imager (CPI), is triggered to take a high-resolution picture, via a briefly illuminated high-resolution imaging array (Lawson et al., 2001; Lawson et al., 2015). The probe is particularly suited for imaging such crystals, but also provides good detection of other hydrometeors including large cloud droplets, drizzle and small rain drops, as well as other precipitation particles. The High Volume Precipitation Spectrometer (HVPS) measures the size, shape, and concentration of water droplets and ice crystals (Woods et al., 2018). The HVPS consists of a source laser that produces a sheet of light that is roughly 19.2 mm × 162 mm in size and passes between two windows located on the inboard sides of the optical arms. Particle fragmentation is the biggest error source of cloud particle spectrum probes in aircraft observation, and it has great influence on measured particle number concentration and particle size distribution. The IAT (interarrival time) algorithm is usually used to correct cloud particle spectrum probe data (Field et al., 2003; Field et al., 2006; Korolev and Field, 2015). This is because broken particles tend to appear in groups, and the arrival interval between them is often much smaller than that of intact particles, resulting in the bimodal distribution of IAT. In this research, the threshold of IAT was set to eliminate the errors of FCDP, 2DS, and HVPS data caused by particle fragmentation. The method of the identification about the ice and liquid phase particles from 2DS and HVPS is as below:
The raw images from optical array probe (2DS,HVPS) are analyzed by circularity of particles(C) to discriminate liquid and ice particles. The definition of circularity(C) is based on the perimeter around the edge of the particle (P) and the total area of the particle(A), in which the perfect circle has a circularity of 1, and the other shapes have larger circularities (Crosier et al., 2010). In the practical observations, the circularity of measured particles may be less than 1 due to the discretization of images into pixels and only a small number of pixels being contained in the image.
In this research, particles with an area smaller than 20 pixels are classified as small particles, and those with an area greater than 20 pixels are classified as round (0.9 ≤ C < 1.2) and irregular (C ≥ 1.2) shapes according to the value of circularity(C). The small particles and round particles are usually liquid particles, and the irregular particles are ice particles.
The mountain station (Yanjiaping station) (115.73°N, 40.52°E; 1344 m asl) is in the Yanqing mountains, which are located in the northwest of Beijing. The instruments in the mountain station include an automatic station, a cloud radar, a radiometer, an OTT Particle Size Velocity (Parsivel2; P2) disdrometer, and a two-dimensional video disdrometer (2DVD) (Table 1).
The millimeter wave cloud radar is in Ka band with a velocity resolution of 0.1 m/s and reflectivity factor accuracy < 1dB. It can effectively penetrate the cloud layer and obtain the echo information and movement status inside the cloud in real time, including parameters such as reflectivity factor, velocity, spectral width, linear depolarization ratio, and power spectrum (Zhong. et al., 2011). In this paper, the cloud radar was operated in zenith mode for continuous observation, and sampled every 0.6s to observe cloud structures and phase change information. The specifics of the cloud radar are shown in Table 2.
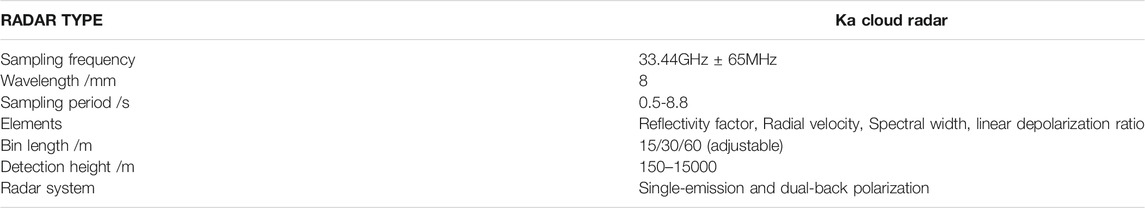
TABLE 2. Cloud radar performances parameters
Radiometer data were sampled by a Radiometrics 12-channel (TP WVP-3000) microwave radiometer. It observes the water vapor band from 22 to 30 GHz and the oxygen band from 51 to 59 GHz, and can obtain 58 layers’ vertical profile of temperature, water vapor, relative humidity, and liquid water from the ground to 10 km altitude with a time resolution of 2 min (Hewison, 2007). In this article, it was used to provide the vertical distribution of water vapor conditions at Yanjiaping station.
The disdrometer data used in this paper were collected from an OTT Particle Size Velocity (PARSIVEL2) disdrometer. The laser system is used to observe the variation of particle number concentrations, particle velocities, and spectrum. The sampling interval is 1min and measurement area is 180 × 30 mm with particle diameter range 0.2–5 mm for liquid precipitation, and 0.2–25 mm for solid precipitation with particle velocity range 0.2–20 m/ s (Tokay. et al., 2014). It has 32 diameter levels and 32 velocity levels. In this paper, data were corrected with the method of Battaglia.et al. (2010). The quality control also includes: (1) for particles with a diameter <0.3 mm, the first and second diameters were deleted; (2) When the particles were in ice phase, the particle density correction formula was used:
The snowfall cloud system moved from the west to the east, and the main influenced system was the Yellow River cyclone. Guided by vorticity advection in front of the high-altitude trough and warm and cold advection, a near-surface cyclone gradually strengthened and moved eastward and northward seen from Figure 2. The snow clouds were located in the front of the cyclone. Warm-humid airflow from the southwest in front of the trough was the main source of water vapor in this snow case.
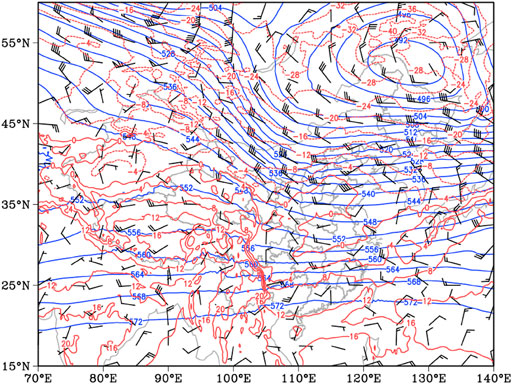
FIGURE 2. 0800 BJT (Beijing time) Jan 27, 2021 850 hpa synoptic situation.
The snowfall period was about 15:00–21:00 BJT on 27 January. Snowfall was relatively weak and mainly occurred in Beijing’s northwest mountains. Figure 3 shows the observations from the automatic weather station at the Yanjiaping Station. As shown in Figure 3A, when the snowfall continued in 16:00–20:00 BJT on 27 January, the cumulative snowfall reached the light snow level (0.4 mm), and the maximum snowfall time was 17:00–19:00, with an hourly average snowfall of 0.2 mm/ h. With the beginning of the snowfall, the ground temperature dropped from -5°C to -12°C, while the relative humidity (RH) rose from 40 to 85%. When the RH decreased, the snowfall gradually stopped.
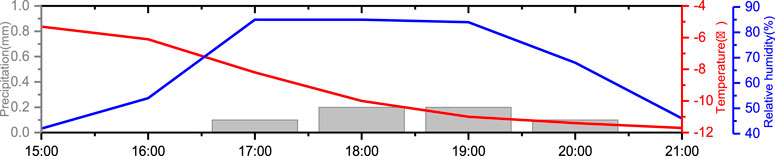
FIGURE 3. Meteorological elements at Yanjiaping station from 1500 BJT to 2100 BJT Jan 27, 2021 [gray column: precipitation (units: mm); red line: temperature (units: °C); blue line: relative humidity (units: %)]
Figure 4 shows radar reflectivity observed by the Ka cloud radar at Yanjiapin station. The snowfall reflectivity factor was relatively weak. The cloud top was low overall (<4.5 km) and passed the station from west to east. As can be seen from Figure 4, the snow grounded the station at 16:30 27 Jan and the reflectivity factor above the station was weak with the maximum <15dBZ.
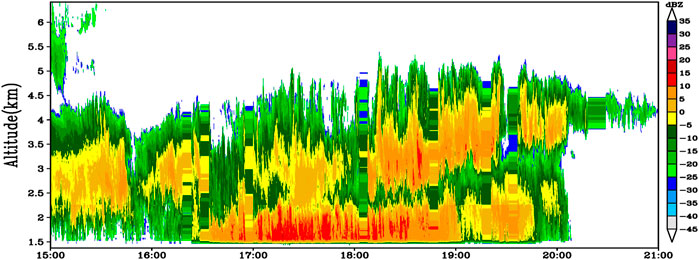
FIGURE 4. Evolution of reflectivity factor (units: dBZ) observed by cloud radar from 1500 BJT to 2100 BJT Jan 27, 2021.
Wind barbs were observed by the wind profiler radar at Yanjiapin station (Figure 5). Figure 5 showed that the wind was mainly westerly above 3 km, and wind direction rotated with heights below 3 km during the snowfall period (blue box). When the wind direction turned westerly, the snowfall was over.
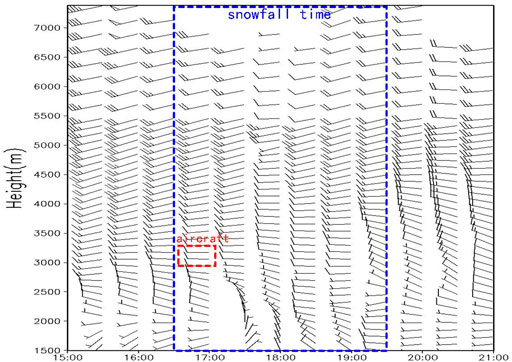
FIGURE 5. Wind barbs observed by the wind profiler radar from 1500 BJT to 2100 BJT on Jan 27, 2021 (blue box: snowfall time, red box: aircraft close to Yanjiaping time at aircraft altitude).
When an airplane flew over the Beijing Yanqing Mountains, located within 10 km from the west to east of Yanjiaping station (16:30–17:05), the aircraft altitude was 2900–3200 m (red box in Figure 5) with westerly wind.
The radiometer (Figure 6) observed that the liquid water content (LWC) increased during the entire snowfall process (16:30–19:30, black box in Figure 6), and there were two peaks which appeared at the beginning of the snowfall and at the end of snowfall, respectively. But the LWC was very low with the maximum value only 0.018 g m−3 that occurred at 19:15 at an altitude of 3–4 km. The liquid water integral path (LWP) showed the same evolution trend of LWC. The maximum was 0.05 mm at 19:15. Water vapor was also increased during the entire snowfall process. At the beginning of the snowfall, the water vapor increased rapidly below 2km, with the maximum (2.4 g m−3 at 1.9 km) occurring at 17:05, corresponding to the first peak of LWC. The max value (0.49 cm) of precipitable water vapor (PWV) also appeared at this moment. With snowfall going on, the water vapor consumed and gradually decreased. The water vapor dropped to 0.3 cm at the second peak of LWC (19:08), and continued to decrease less than 0.2 cm after snowfall ended.
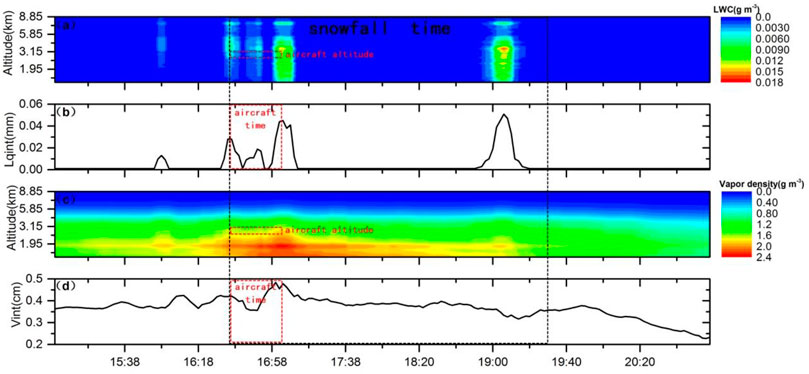
FIGURE 6. (A) LWC (g m−3), (B) LWP (mm), (C) Vapor density (g m−3), and (D) PWV (cm) observed by Radiometer from 1500 BJT to 2100 BJT Jan 27, 2021 (black box: snowfall time, red box: aircraft close to Yanjiaping time at aircraft altitude).
When the airplane was near Yanjiaping station (16:30–17:05), LWC (observed by Radiometer) at aircraft altitude (2900–3200 m, red box in Figure 6) was 0.005–0.015 g m−3, and water vapor was 0.8–1.8 g m−3. The observations above show that in this case, the whole cloud was extremely dry, and contained very little liquid water.
Figure 7A; Figure 7B showed the reflectivity factor and linear depolarization ratio (LDR) observed by the Ka cloud radar at Yanjiaping station during the airplane flight over the Yanqing mountain area located within 10 km from the west to east of the Yanjiaping station (16:30–17:05 on 27 Jan). As can be seen in Figure 7A, the snowfall at Yanjiaping station started at 16:30, the cloud top gradually rose up (from 2.5 to 4 km), and the strong reflectivity factor (close to 15 dBZ) appeared in the altitude<2 km. However, the snow development was relatively weak. The maximum reflectivity factor was about 20dBZ with the cloud top (defined as reflectivity factor > −15 dbz and span more than 3 bin (1bin = 50 m)) < 4 km. The reflectivity factor was about 0-10dBZ at the aircraft flight altitude (2.9–3.2 km).
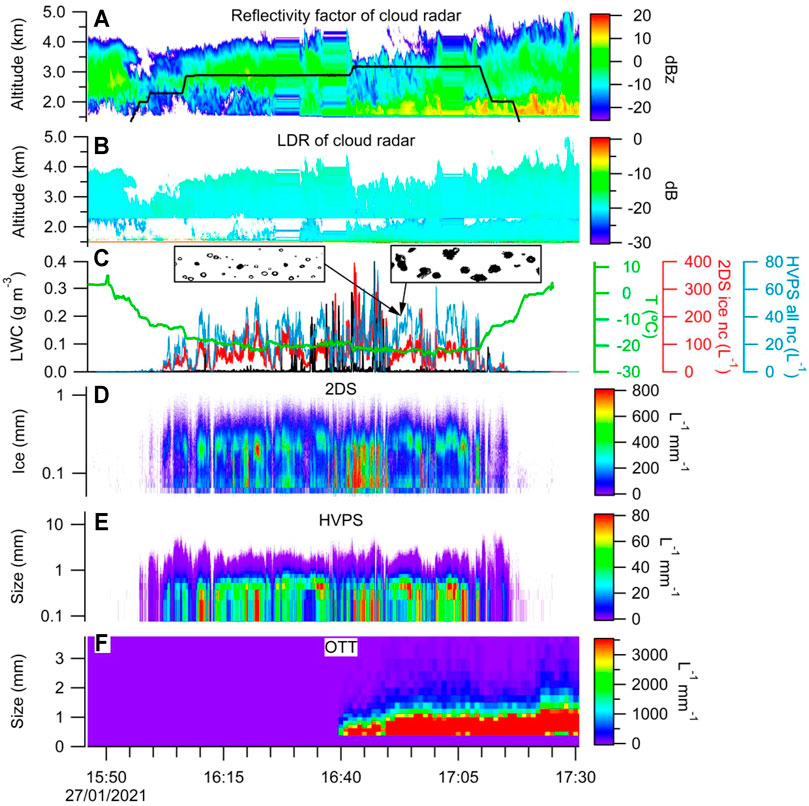
FIGURE 7. (A) Reflectivity factor (dBZ) (the black line is aircraft altitude), (B) LDR (dB) observed by Ka cloud radar, (C) LWC (g m−3) (black line) and Temperature (°C) (green line) by FCDP, Ice number concentration (L−1) (red lines) by 2DS, all particle number concentration (L−1) (blue lines) by HVPS, 2DS images (Bar graph above c) (D)Ice size distribution (L−1mm−1) by 2DS, (E)Particle size distribution (L−1mm−1) by HVPS, (F) Particle size distribution (L−1mm−1) by OTT from 1630 BJT to 1705 BJT Jan 27, 2021.
The LDR observed by the cloud radar can reflect the non-spherical particle scattering power differences between the parallel polarization component and the vertical polarization component in the backscattering (Neiman et al., 2014; Matthew et al., 2014). The LDR reflects the difference determined by the particle shape, size, spatial orientation, and particle phase. For example, the larger the diameter of snowflakes with the same spatial orientation (horizontal orientation) in radar sampling volume, the larger the LDR value is. If there exists mixed phase in cloud, the LDR value will reflect a jump increase (>10dB) (Chen et al., 2018). In Figure 7B, the LDR value during the flight period was steady in the range of -22 to -10dB, without a jump increase. The previous observation results showed that the low LWC indicates that there was no mixed phase in snowfall at this stage, and there may present many solid crystals in the cloud (Neiman et al., 2014).
Figure 7C showed the LWC and temperature observed by the onboard FCDP when the airplane flew over the Yanqing mountain area (16:30–17:05). From 16:30–16:50, the airplane carried out round-trip detection over Yanjiaping station. LWC average value from Radiometer and from FCDP was at the same order of magnitude. The average value from Radiometer at aircraft altitude (2.9–3.2 km) during 16:30–17:05 was 0.01437 g m−3and LWC average value from FCDP was 0.01357 g m−3at the same period. Snowfall on the ground at Yanjiaping started at this moment (16:30). The temperature was-18°C ∼ -23°C. The LWC increased (basically closed to zero at other times), but the value was low (∼0.01–0.18 g m−3). The maximum LWC was about 0.4 g m−3, which coincided with that observed by the radiometer (0.005–0.015 g m−3) at aircraft altitude (2900–3200 m), demonstrating that the cloud was dry and cold at the airplane altitude (2.9–3.2 km).
The ice size distribution observed by the onboard 2DS probe (Figure 7D) showed that at the airplane altitude (2.9–3.2 km, −18°C ∼ −23°C) the diameter of ice particles was mainly concentrated at the range of 0.1–0.8 mm. The max value of the ice number concentration (INC) was 800 L−1mm−1 with the diameter at 0.08–0.6 mm. The max value of the INC appeared at 16:40–16:50 when the airplane was over Yanjiapin, which corresponded to the moment when the LWC increased. This shows that the ice content in clouds above Yanjiaping was higher than clouds at other regions.
It can be seen from Figure 7E that the particle (including ice crystals, snowflakes, and raindrops) size distribution observed by the HVPS on the aircraft at 2.9–3.2 km (−18°C ∼ -23°C) during this period was dominated by small particles. There were almost no particles with a diameter larger than 3 mm. Most particle diameters were 0.1–1 mm with the number concentration 30–70 L−1mm−1. Correspondingly, the max number concentration value (80 L−1mm−1) were also in the period of 16:40–16:50 with a smaller diameter range (about 0.1–0.9 mm). At 16:40–16:50 when the LWC increased, the concentration of ice and large particles showed a significant increase, which verified that the LWC had a greater impact on the growth of ice crystals, and the rimming process was the main reason for the growth of the ice crystals. But the LWC over Yanjiapin was low overall, which resulted in the number concentration of large particles being lower than expected, and the particle growth rate being slow. The growth mechanism of ice crystals over Yanjiaping was relatively simple, mainly by collision-coalescence and deposition.
At the same stage, the particles’ size distribution on the ground (−8°C) observed by OTT (Figure 7F) showed that the particles were also mainly small, with the largest particle diameter <3 mm. The max number concentration of particles was 3500 L−1 mm−1 with the diameter <1 mm. The high number concentration appeared after 16:40, with snowfall appearing on the ground, and the snowfall start time corresponded well with the moment when LWC and INC increased by aircraft observation. The number concentration and size of the particles observed on the ground were not large at high altitudes, particle growth was not dramatic, and, due to the lack of the LWC, the particles grew only by deposition and aggregation.
All the above results indicated that when the airplane carried out round-trip detection over Yanjiaping station (16:30–16:50), the snowfall was beginning. The LWC increased, and the particles’ number concentration at high altitude (2.9–3.2 km) and on the ground both increased. The LWC occupies an important position in the formation and growth of snow. However, because the LWC was insufficient in this case, riming or secondary ice forming process influence was small, ice grew by deposition and aggregation mainly, and the main phase was dry snow (Geerts et al., 2015)
Figure 8 showed the average number concentration measured by the aircraft and on the ground in this period (16:30–17:05). Normalization process was made to display their respective proportions. The right images are particle images.
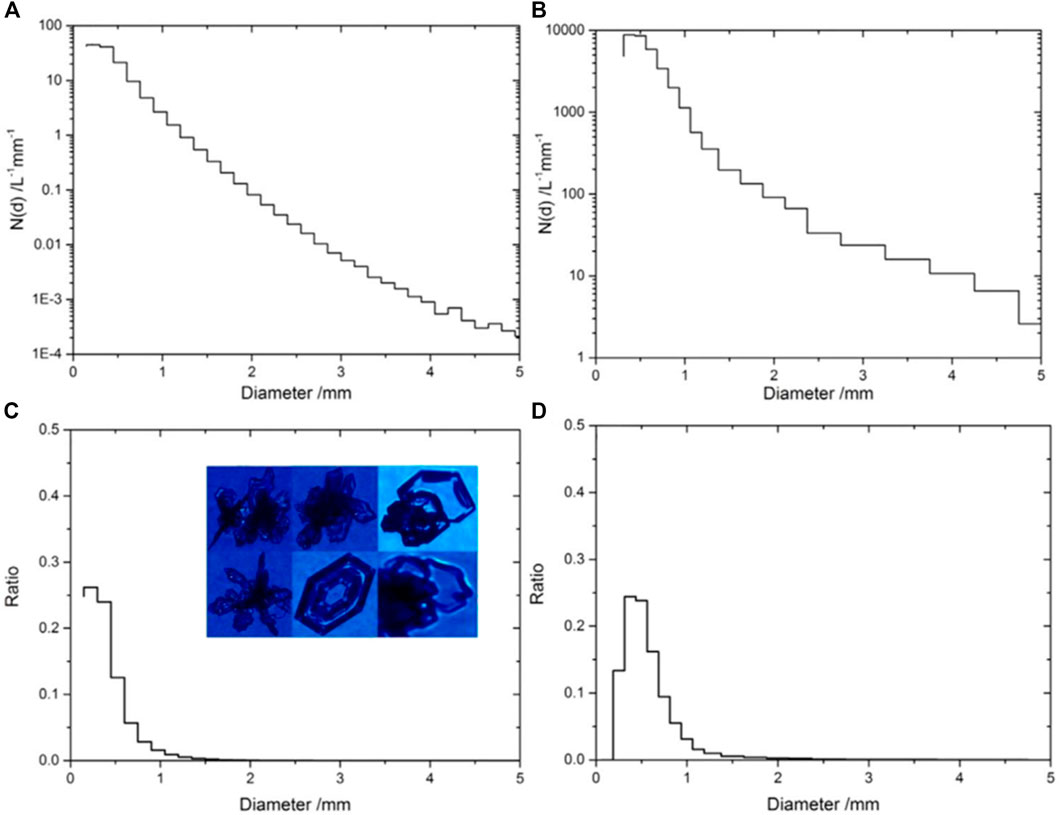
FIGURE 8. Average number concentration observed by (A) aircraft, (B) OTT disdrometer; Normalization size spectra observed by (C) aircraft (right are particle images by CPI), (D) OTT disdrometer from 1630 BJT to 1705 BJT 27 Jan 2021.
The average number concentration (observed by HVPS in aircraft) from the in-situ observation (Figure 8A) showed that the particles were mainly concentrated in the diameter range of 0.15–0.9 mm, which accounted for 96% in total (Figure 8C). The maximum value of the number concentration was 44 L−1 mm−1 at 0.3 mm, which accounted for 26%. With the increasing of the diameter, the number concentration decreased rapidly. The number concentration of particles larger than 1 mm was 2.7 L−1 mm−1 (accounted for 1.6%), and the particle number concentration of 2 mm diameter was only 0.08 L−1 mm−1 (accounted for 0.05%). The particle number concentration of diameter>3 mm decreased close to zero. Compared with other snowfall research results (Woods et al., 2008), the spectra were narrow, and the ratio of number concentration decreased when the diameter was large, with only one peak in small size (about at 0.2–0.3 mm); the particle size was small overall, and basically had no large snowflakes (2.5–10 mm). The number concentration of large-size ice crystals was relatively low, indicating that the formation and growth mechanism of ice crystals was relatively single, and the growth rate was slow.
The images from CPI (Figure 8C right) showed that there were mainly relatively regular particles, and the shapes of ice particles were plate-like and star features at 2.9–3.2 km (-18°C ∼ −23°C). This is consistent with the results of previous studies (Taylor et al., 2016; Hou et al., 2014). As we know, the shape of ice crystals is affected by environmental temperature, humidity or supersaturation. Temperature is the main factor controlling the basic shape of ice crystals; although supersaturation cannot change the basic shape of ice crystals, it will greatly affect its growth rate and secondary characteristics developing (Taylor et al., 2016). Transparent, regular crystals with dendritic and disk-hexagonal forming ice shape indicated the cloud in that altitude was relatively dry, and there was basically no rimming process (Hou et al., 2014; Chang et al., 2019).
The average number concentration (observed by OTT) on the ground (Figure 8B) illustrated that the main particles were concentrated in the diameter range of 0.3–1.2mm, which accounted for 97% in total (Figure 8D), with the maximum value of 8826 L−1mm−1 in 0.45 mm which accounted for 25%. The particle number concentration also decreased rapidly with the diameter increasing. But the rate of decrease was slightly different from that observed by the aircraft. When the diameter was 1.0mm, the number concentration was 1130 L−1 mm−1 (accounted for 3.1%); the number concentration in 2 mm was 91 L−1 mm−1 (accounted for 0.2%), the number concentration in 3 mm was 23 L−1 mm−1 (accounted for 0.06%), and the number of particles with a diameter> 4 mm was decreased close to zero. The spectra on the ground were also narrow, with only one peak at small scale, but the peak was located at 0.5 mm, and the average number concentration decreased when the scale increased, which was slower than that in high altitude. All the above results demonstrated that, in the range of <1 mm, the scale of particles in high altitude was smaller (<0.3 mm) than that on ground (mainly concentrated around 0.5 mm). The particle size increase shown in the ground spectra was attributed to the aggregation process in falling down, but the scale increase was not obvious, and the number concentration was not high.
Comparing the observation from the aircraft and on the ground, it can be seen that the trend of number concentrations and size distributions was basically the same, and both in Gamma distribution. The number concentration decreased rapidly when size increased, but the number concentration from the in-situ observation at small sizes was much lower than that on the ground. The proportion of small particles from the in-situ observation was higher than that on the ground, and lower for the large side. The proportion of number concentration with diameter <0.5 mm was 75% for the in-situ observation, and was 62% on the ground. The proportion of number concentration with diameter 0.5–1 mm was 21% from the in-situ observation and was 34% on the ground. The proportion of number concentration with diameter >1 mm was 3.8% from the in-situ observation and was 7.3% on the ground. The ice fell down and grew by deposition and aggregation, so the diameter became larger and the number concentration increased. However, the LWC were insufficient, riming growing was rare, and there was basically no agglutination or clustering process in this case. Moreover, the increase ratio of particles’ number concentrations on the ground was slower than expected, and the particle shape was regular, indicating that there was no secondary ice forming process. As a result, particles on the ground were not enlarged significantly. The conclusion above was based on the combined reasonable analysis of the ground and the aircraft observation. Whether it is the real snowfall formation mechanism is still uncertain, and needs further verification, and the causes of ice crystals’ characteristics also need to be further studied.
In this paper, we used onboard probes, ground-based disdrometer combined with the cloud radar, a radiometer, and an automatic station together to study a snowfall case in the Beijing Yanqing mountains from 16:30 to 17:05 on Jan 27, 2021. We demonstrated the microphysical characteristics and compared the variations in the particle size distribution at 2.9–3.2 km and ground level. The results showed that:
1) This case was a slight snowfall. The cumulative snowfall was 0.4 mm, and the max reflectivity factor was lower than 20dBZ. The cloud top was lower than 4.5 km. The wind direction was changed from southerly to westerly below 2.5 km, and dominated by westerly at aircraft altitude.
2) Airborne probes combined with the ground observation can obtain the detailed microphysical characteristics of snowfall. The number concentration of HVPS at the aircraft altitude and ground level was similar and increased at the same time after snow began. The snowfall was dominated by small particles with diameters of 0.15–1.2 mm at both aircraft altitude and ground level. The proportion of number concentrations of these small particles was very high, with the max number concentration 44 L−1 mm−1 and 8826 L−1 mm−1 respectively. But the number concentration of particles decreased rapidly with diameter increasing. It is notable that the number concentration of small particles at aircraft altitude was much lower than that on the ground.
3) Both onboard and ground-based observations showed that there was no mixed phase in clouds, and the LWC was very low in this snowfall case. Many particles were relatively regular, and were transparent with dendritic and disk-hexagonal form. The ice crystals and snowflakes mainly grew up by the deposition and aggregation, seldom by the riming process, and there was rarely the secondary ice forming process.
4) The results in this paper can offer a better understanding of the snowfall mechanism in the Beijing Mountains, and provide a reference for the choice of physical schemes in numerical simulations. This article only analyzes one snowfall process. As the next plan, we will analyze more snowfall cases to obtain typical structures and characteristics of snowfall in this region.
The raw data supporting the conclusions of this article will be made available by the authors, without undue reservation.
YH and DZ contributed to conception and design of the study. YH organized the database. YD performed the aircraft analysis. YH wrote the first draft of the manuscript. YH wrote sections of the manuscript. All authors contributed to manuscript revision, read, and approved the submitted version.
This work was supported by the National Key R and D Program of China (2016YFA0601704) and National Natural Science Foundation of China(Grants 41805112, 42075084).
The authors declare that the research was conducted in the absence of any commercial or financial relationships that could be construed as a potential conflict of interest.
All claims expressed in this article are solely those of the authors and do not necessarily represent those of their affiliated organizations, or those of the publisher, the editors and the reviewers. Any product that may be evaluated in this article, or claim that may be made by its manufacturer, is not guaranteed or endorsed by the publisher.
Alessandro, B., and Elke, R. (2010). PARSIVEL Snow Observations: a Critical Assessment. J. Atmos. Oceanic Technol. 27, 333–344. doi:10.1175/2009JTECHA1332.1
Battaglia, A., Rustemeier, E., Tokay, A., Blahak, U., and Simmer, C. (2010). PARSIVEL Snow Observations: A Critical Assessment. J. Atmos. Oceanic Technol. 27 (2), 333–344. doi:10.1175/2009jtecha1332.1
Brandes, E. A., Ikeda, K., Zhang, G., Schönhuber, M., and Rasmussen, R. M. (2007). A Statistical and Physical Description of Hydrometeor Distributions in Colorado Snowstorms Using a Video Disdrometer. J.Appl.Meteor.Climatol 46, 634–650. doi:10.1175/jam2489.1
Chang, Y., Guo, X., Tang, J., and Lu, G. Aircraft Measurement Campaign on Summer Cloud Microphysical Properties over the Tibetan Plateau. Sci. Rep. 2019, 9:4912. doi:10.1038/s41598-019-41514-5
Chen, Y. C., Jin, Y. L., and Ding, D. P. (2018). Preliminary Analysis on the Application of Millimeter Wave Cloud Radar in Snow Observation. Chin. J. Atmos. Sci. 42 (1), 134–149. doi:10.3878/j.issn.1006-9895.1705.17121
Chu, D., Shen, H. F., and Guan, X. B. (2021). Long Time-Series NDVI Reconstruction in Cloud-Prone Regions via Spatio-Temporal Tensor Completion. Remote Sensing Environ., 264. doi:10.1016/j.rse.2021.112632
Cifelli, R., Chandrasekar, V., Lim, S., Kennedy, P. C., Wang, Y., and Rutledge, S. A. (2011). A New Dual-Polarization Radar Rainfall Algorithm: Application in Colorado Precipitation Events. J. Atmos. Oceanic Technol. 28, 352–364. doi:10.1175/2010jtecha1488.1
Cotton, W. R., Stephens, M. A., and Nehrkorn, T. (1982). The Colorado State University Three-Dimensional Cloud/mesoscale Model. Part II: An Ice Phase Parameterization. J.Rech. Atmos. 16, 295–319.
Crosier, J., Bower, K. N., and Choularton, T. W. (2010). Observations of Ice Multiplication in a Weakly Convective Cell Embedded in Supercooled Mid-level Stratus. Atmos. Chem. Phys. 11 (1), 257–273. doi:10.5194/acp-11-257-2011
Field, P. R., Wood, R., and Brown, P. R. A. (2003). Ice Particle Interarrival Times Measured with a Fast FSSP. J. Atmos. Oceanic Techn. 20 (20), 249–261. doi:10.1175/1520-0426(2003)020<0249:ipitmw>2.0.co;2
Field, P. R., Heymsfield, A. J., and Bansemer, A. (2006). Shattering and Particle Interarrival Times Measured by Optical Array Probes in Ice Clouds. J. Atmos. Oceanic Techn. 23 (10), 1357–1371. doi:10.1175/jtech1922.1
Fraser, A. B., Easter, R. C., and Hobbs, P. V. (1973). A Theoretical Study of the Flow of Air and Fallout of Solid Precipitation over Mountainous Terrain: Part I. Airflow Model. J. Atmos. Sci. 30, 801–812. doi:10.1175/1520-0469(1973)030<0801:atsotf>2.0.co;2
Hobbs, P. V., Easter, R. C., and Fraser, A. B. (1973). A Theoretical Study of the Flow of Air and Fallout of Solid Precipitation Over Mountainous Terrain: Part I. Airflow Model. Journal of the Atmospheric Sciences 30 (5), 813–823.
Geerts, B., Yang, Y., and Rasmussen, R. (2015). Snow Growth and Transport Patterns in Orographic Storms as Estimated from Airborne Vertical-Plane Dual-Doppler Radar Data. Monthly Weather Review 143 (2), 644–655. doi:10.1175/mwr-d-14-00199.1
Guan, X. B., Chen, J. M*, and Shen, H. F. (2021). A Modified Two-Leaf Light Use Efficiency Model for Improving the Simulation of GPP Using a Radiation Scalar. Agric. For. Meteorology, 307. doi:10.1016/j.agrformet.2021.108546
Hewison, T. J. (2007). 1D-VAR Retrieval of Temperature and Humidity Profiles from a Ground-Based Microwave Radiometer. IEEE Trans. Geosci. Remote Sensing 45 (7), 2163–2168. doi:10.1109/tgrs.2007.898091
Hou, T., Lei, H., Hu, Z., and Zhou, J. (2014). Aircraft Observations of Ice Particle Properties in Stratiform Precipitating Clouds. Adv. Meteorology 2014, 1–12. doi:10.1155/2014/206352
Korolev, A., and Field, P. R. (2015). Assessment of the Performance of the Inter-arrival Time Algorithm to Identify Ice Shattering Artifacts in Cloud Particle Probe Measurements. Atmos. Meas. Tech. 8 (2), 761–777. doi:10.5194/amt-8-761-2015
Lawson, P., Gurganus, C., Woods, S., and Bruintjes, R. (2017). Aircraft Observations of Cumulus Microphysics Ranging from the Tropics to Midlatitudes: Implications for a "New" Secondary Ice Process. J. Atmos. Sci. 74 (9), 2899–2920. doi:10.1175/jas-d-17-0033.1
Lawson, R. P., Baker, B. A., and Schmitt, C. G. (2001). An Overview of Microphysical Properties of Arctic Stratus Clouds Observed during FIRE. ACE. J. Geophys. Res. 106 (D1414), 989–1015. doi:10.1029/2000jd900789
Lawson, R. P., Woods, S., and Morrison, H. (2015). The Microphysics of Ice and Precipitation Development in Tropical Cumulus Clouds. Journal of the Atmospheric Sciences 72 (6), 150310071420004.
Lin, Y.-L., Farley, R. D., and Orville, H. D. (1983). Bulk Parameterization of the Snow Field in a Cloud Model. J. Clim. Appl. Meteorol. 22, 1065–1092. doi:10.1175/1520-0450(1983)022<1065:bpotsf>2.0.co;2
Lo, K. K., and Passarelli, R. E. (1982). The Growth of Snow in Winter Storms:. An Airborne Observational Study. J. Atmos. Sci. 39 (4), 697–706. doi:10.1175/1520-0469(1982)039<0697:tgosiw>2.0.co;2
Masaaki, I., Hiroki, M., and Sento, N. (2013). A New Method for Identifying the Main Type of Solid Hydrometeors Contributing to Snowfall from Measured Size Fall Speed Relationship. J. Meteorol. Soc. Jpn. 91 (3), 747–762. doi:10.2151/jmsj.2013-602
Matthew, R., Steven, A., and Roy, M. (2014). High-Resolution Polarimetric Radar Observations of Snow-Generating Cells. J.Appl.Meteor.Climatol. 53, 1636–1658. doi:10.1175/JAMC-D-13-0312.1
Morrison, H., and Milbrandt, J. A. (2015). Parameterization of Cloud Microphysics Based on the Prediction of Bulk Ice Particle Properties. Part I: Scheme Description and Idealized Tests. J.Atmos. Sci. 72, 287–311. doi:10.1175/jas-d-14-0065.1
Neiman, P. J., Gottas, D. J., White, A. B., Schick, L. J., and Ralph, F. M. (2014). The Use of Snow-Level Observations Derived from Vertically Profiling Radars to Assess Hydrometeorological Characteristics and Forecasts over Washington's Green River Basin. J. Hydrometeorology 15, 2522–2541. doi:10.1175/jhm-d-14-0019.1
Newman, A. J., Kucera, P. A., and Bliven, L. F. (2009a). Presenting the Snowflake Video Imager (SVI)flake Video Imager (SVI). J. Atmos. Oceanic Technol. 26, 167–179. doi:10.1175/2008jtecha1148.1
Newman, A. J., Kucera, P. A., Williams, C. R., and Bliven, L. F. (2009b). Snowflake Size Spectra Retrieved from a UHF Vertical Profiler. J. Atmos. Oceanic Technol. 26, 180–199. doi:10.1175/2008jtecha1105.1
Saleeby, S. M., Cotton, W. R., and Fuller, J. D. (2011). The Cumulative Impact of Cloud Droplet Nucleating Aerosols on Orographic Snowfall in Colorado. J.Appl.Meteor.Climatol 50, 604–625. doi:10.1175/2010jamc2594.1
Shen, L. J., Honglei, W., and Bin, Z. (2021). Impact of Urbanization on Air Quality in the Yangtze River Delta during the COVID-19 Lockdown in China. J. Clean. Prod. 296 (2021), 126561. doi:10.1016/j.jclepro.2021.126561
Taylor, J. W., Choularton, T. W., Blyth, A. M., Liu, Z., Bower, K. N., Crosier, J., et al. (2016). Observations of Cloud Microphysics and Ice Formation during COPE. Atmos. Chem. Phys. 16, 799–826. doi:10.5194/acp-16-799-2016
Thompson, G., Rasmueesn, R. M., and Manning, K. (2004). Explicit Forecasts of winter Precipitation Using an Improved Bulk Microphysics Scheme. Part I: Description and Sensitivity Analysis. Mon. Wea. Rev. 132, 519–542. doi:10.1175/2008MWR2387.1
Tokay, A., Wolff, D. B., and Petersen, W. A. (2014). Evaluation of the New Version of the Laser-Optical Disdrometer, OTT Parsivel2. J. Atmos. Oceanic Techn. 31 (6), 1276–1288. doi:10.1175/jtech-d-13-00174.1
Woods, C. P., Stoelinga, M. T., and Locatelli, J. D. (2008). Size Spectra of Snow Particles Measured in Wintertime Precipitation in the Pacific Northwest. J.Atmos. Sci. 65, 189–205. doi:10.1175/2007jas2243.1
Woods, C. P., Stoelinga, M. T., and Locatelli, J. D. (2007). The IMPROVE-1 Storm of 1-2 February 2001. Part III: Sensitivity of a Mesoscale Model Simulation to the Representation of Snow Particle Types and Testing of a Bulk Microphysical Scheme with Snow Habit Prediction. J.Atmos. Sci. 64, 3927–3948. doi:10.1175/2007jas2239.1
Woods, S., Lawson, R. P., Jensen, E., Bui, T. P., Thornberry, T., Rollins, A., et al. (2018). Microphysical Properties of Tropical Tropopause Layer Cirrus. J. Geophys. Res. Atmos. 123, 6053–6069. doi:10.1029/2017JD028068
Yuter, S. E., Kingsmill, D. E., Nance, L. B., and Löffler-Mang, M. (2006). Observations of Precipitation Size and Fall Speed Characteristics within Coexisting Rain and Wet Snow. J.Appl.Meteor. Climatol. 45, 1450–1464. doi:10.1175/jam2406.1
Zheng, S., and Chen, J. H. (2021). Observational Evidence of Lightning‐Generated Ultrafine Aerosols. Geophys. Res. Lett. 48–14. e2021GL093771. doi:10.1029/2020gl091881
Keywords: Beijing mountains snowfall, ground-based disdrometer, aircraft platform, vertical structure, cComprehensive observation
Citation: Huang Y, Zhao D, Du Y, Chen Y, Zhang L, Li X and Jing Y (2021) Vertical Structure of a Snowfall Event Based on Observations From the Aircraft and Mountain Station in Beijing. Front. Environ. Sci. 9:783356. doi: 10.3389/fenvs.2021.783356
Received: 26 September 2021; Accepted: 15 October 2021;
Published: 12 November 2021.
Edited by:
Junke Zhang, Southwest Jiaotong University, ChinaReviewed by:
Dawei Hu, The University of Manchester, United KingdomCopyright © 2021 Huang, Zhao, Du, Chen, Zhang, Li and Jing. This is an open-access article distributed under the terms of the Creative Commons Attribution License (CC BY). The use, distribution or reproduction in other forums is permitted, provided the original author(s) and the copyright owner(s) are credited and that the original publication in this journal is cited, in accordance with accepted academic practice. No use, distribution or reproduction is permitted which does not comply with these terms.
*Correspondence: Delong Zhao, emhhb2RlbG9uZ0Biai5jbWEuZ292LmNu; Yuanmou Du, eXVhbm1vdWR1MjRAMTYzLmNvbQ==
Disclaimer: All claims expressed in this article are solely those of the authors and do not necessarily represent those of their affiliated organizations, or those of the publisher, the editors and the reviewers. Any product that may be evaluated in this article or claim that may be made by its manufacturer is not guaranteed or endorsed by the publisher.
Research integrity at Frontiers
Learn more about the work of our research integrity team to safeguard the quality of each article we publish.