 Xu-Meng Dong
 Shuo-Nan Ma
 Hai-Jun Wang
 Yuan-Yuan Li2
94% of researchers rate our articles as excellent or good
Learn more about the work of our research integrity team to safeguard the quality of each article we publish.
Find out more
ORIGINAL RESEARCH article
Front. Environ. Sci., 17 January 2022
Sec. Freshwater Science
Volume 9 - 2021 | https://doi.org/10.3389/fenvs.2021.782701
This article is part of the Research TopicThe Effects of Benthic-Pelagic Coupling on Shallow Lake Ecosystems: Implications for Lake ManagementView all 8 articles
Increasing concentrations of dissolved organic carbon (DOC) have been observed in coastal ecosystems worldwide over the past decade, and tight coupling of the carbon (C) and phosphorus (P) biogeochemical cycle has been recognized in aquatic ecosystems. However, there is still no consensus regarding the potential effects of DOC loading on sediment P release. In a 2-month mesocosm experiment, we tested the effects of DOC enrichment on sediment P release in six glass aquariums. Two treatments were set: Control (without sodium acetate (Na(CH3COO)) addition) and Na(CH3COO) addition (equivalent to 5 mg C L−1). The results showed the following: 1) DOC loading stimulated sediment P mobilization and release, as indicated by increases in the labile P recorded for 7-cm-deep sediment using diffusive gradients in thin films, the flux of P across the sediment–water interface, and the total P concentrations in the overlying water; and 2) stimulated alkaline phosphatase activity, increased P-solubilizing bacteria proportion, and decreased dissolved oxygen concentration were likely the primary mechanisms behind the DOC-stimulated sediment P mobilization and release. These results provide insight into the promotion of sediment P release induced by C addition. Further studies investigating the quantitative relationships between DOC loadings and P release are needed to fully elucidate the coupled roles of C and P, especially those based on large-scale field investigations with broader C forms and loadings.
Dissolved organic carbon (DOC) is the most active carbon pool in marine ecosystems. Notably, there has been a massive rise in DOC loading in many coastal and marginal oceans (Sawicka et al., 2021; Huntington and Wieczorek, 2021). For example, the flux of DOC from the rivers to the China Seas increased from 4.3 Tg C year−1 in 2006 to 5.4 Tg C year−1 in 2016 (Liu et al., 2020). DOC enrichment, which is well-known to augment oxygen depletion, ocean acidification, and CO2 emissions, may also alter phosphorus (P) dynamics (Bauer et al., 2013; Deininger and Frigstad, 2019; Gnanadesikan et al., 2019; Jiao et al., 2021). Although a tight coupling of the C and P biogeochemical cycle has been identified in aquatic ecosystems (Anderson, 2018), results generated to date have been preliminary, and there is no consensus on the conclusions. For instance, P release was found to increase (Khoshmanesh et al., 1999; Anderson, 2018), decrease (Stutter et al., 2020), or be unaffected (Diana et al., 2013) after the input of DOC. These conflicting results suggest that there is considerable uncertainty regarding the impact of DOC loading on sediment P release. Thus, there remains a need to more clearly elucidate the responses of sediment P cycling to increasing DOC loading and clarify the seemingly conflicting conclusions about the trends in P release responses to C loading.
The East China Sea (ECS) is a hotspot for carbon burial that receives high DOC influxes of up to 4.8 × 10¹² g C year−1 from the Yangtze River (Kim et al., 2020). Thus, it is an ideal area for studying C–P interactions. DOC entering coastal water may affect P cycling by altering dissolved oxygen (DO) and microbial activities (Kaijser et al., 2021). For example, the decomposition of organic matter (OM; rich in C) is an oxygen-consuming process that creates low DO conditions, which could potentially favor sediment P release (Li et al., 2016). It has been reported that bacteria invest the added C in the production of alkaline phosphatase (AP), which may contribute to the mineralization of organic P and subsequently induce P release (Anderson, 2018). Additionally, field surveys conducted in 11 streams by Logue et al. (2004) suggested that organic C content was related to the abundance of bacteria, which directly affected the P-solubilizing efficiencies of enzymes (Chhabra et al., 2013).
Therefore, we hypothesized that DOC enrichment may result in coastal sediment P mobilization and release by 1) consuming DO and creating anaerobic conditions; 2) increasing AP activity (APA); and 3) reshaping the bacterial composition to one more effective at using P. To investigate this, we conducted a 2-month mesocosm experiment investigating DOC addition (60 L, holding sediment and seawater). Acetate, which is a typical end product resulting from the fermentation of more complex organic compounds (Khoshmanesh et al., 1999), was selected to represent DOC in this study.
The experiment (Aug. 14 to Oct. 8, 2020) was conducted in 6 glass aquaria (45 cm × 30 cm × 45 cm), using seawater and sediment from Xiangshan Bay of ECS (N 29°35´28.55″, E 121°54´54.55″). Sediment (TNSed, 0.66 ± 0.04 mg g−1 dw; TPSed, 0.59 ± 0.00 mg g−1 dw; OMSed, 32.37 ± 2.68 mg g−1 dw) was collected from a depth of 0–10 cm below the water–sediment interface and subsequently mixed and added to the 6 aquaria to obtain a sediment layer of 10 cm. The remaining 35 cm was filled with well-mixed seawater (TN, 0.5 mg L−1; TP, 0.04 mg L−1; salinity, 23.4‰) using an immersion pump. Extra seawater was stored synchronously in black tanks to compensate for the water loss during the experiment due to evaporation and sampling. The experiment was run in the glasshouse with a light intensity of 1,528–2,094 lux and an air temperature of 26°C–32°C. Circulating water pumps (power, 15 W) were used to simulate the natural mixing regime according to the method by Ma et al. (2021).
Two treatments with three replicates were established: Control without sodium acetate [Na(CH3COO)] addition (coded as Control) and Na(CH3COO) addition treatment (+Carbon, equivalent to 5 mg C L−1). DOC < 5 mg L−1 is one of the threshold parameters for evaluating aquatic ecosystem quality in the US National Lakes Assessment (NLA) program (NLA, 2012). The first Na(CH3COO) addition (0.75 g) was carried out on day 3 (Aug. 16) to obtain the target C concentration. The Na(CH3COO) was dissolved in water from the aquarium before being injected evenly into the middle water layers by a sprayer (0.5 L). To maintain the target level of C concentration, C source was further added once a week on day 11 (Aug. 24), day 18 (Aug. 31), day 25 (Sep. 7), day 33 (Sep. 15), day 39 (Sep. 21), day 46 (Sep. 28), and day 52 (Oct. 4). Total doses of 1.7 g of Na(CH3COO) were applied in +Carbon treatment. The amount of C needed (F, mg) was calculated based on the difference between the target concentrations and the mean measured concentrations of the three replicates in each treatment before C addition:
where T is the target C concentration (mg L−1), M is the mean measured C concentration of three replicates (mg L−1), and V is the volume of aquarium seawater (L).
Water temperature (WT), DO, redox potential (Eh), and pH at middle water depth were measured 7 times (1–2 weeks’ interval) with a Horiba (U-52, Kyoto, Japan). Water samples were taken 7 times at the middle water layer (1–2 weeks’ interval) at three randomly chosen locations within each aquarium using a 0.5-L syringe. In total, 0.5 L of well-mixed water was collected for chemical and biological analyses. All the chemical parameters were determined according to standard methods (Administration of Quality Supervision, Inspection and Quarantine (AQSIQ), 2007). Chl a and APA in the water samples were determined by applying the method of Ma et al. (2018), in which total APA (APATot) was separated into algal APA (APAAlg) and bacterial APA (APABac).
Labile-P distribution (termed as easily changeable or mobile P fractions, including phosphate and forms of P loosely adsorbed to sediment solids) in sediment profiles was determined using Zr-oxide diffusive gradients in thin films (DGT-labile P). Zr-oxide DGT probes (Easysensor Co. Ltd, Nanjing, China) assembled with standard DGT holders were inserted through the sediment–water interface (SWI) on day 1 (pre-C addition, Aug. 14) and day 56 (post-C addition, Oct. 8) by hand. The probes were forced 10 cm into the sediment and kept 4 cm above the water surface. After 24 h, the probes were retrieved and brought to the laboratory for analyses. Further details on the data processing are given by Ding et al. (2015). The flux of P (Flux-P) across the SWI was calculated as follows:
where Fw and Fs are the fluxes of P from the overlying water to the SWI and from the sediment to the SWI, respectively. F is the flux across the SWI. (δCDGT/δχw)(χ= 0) and (δCDGT/δχw)(χ= 0) are the DGT-labile P concentration gradients (i.e., the slopes) in the overlying water and sediment, respectively. φ is porosity in sediment and was estimated at 0.9 in the top 5-mm layer. Dw and Ds are the diffusion coefficients of H2PO4− in water and sediment, respectively. Ds was calculated from the diffusion coefficient of H2PO4− in water using φ3 for φ ≥ 0.7 (Ding et al., 2015).
The top 5-cm sediment pH (pHSed) was measured with a soil pH meter (pH400 and pH600, USA). Sediment samples of the top 5 cm from three random locations in each aquarium were collected twice on day 1 (Aug. 14) and day 56 (Oct. 8) using a core sampler (XDB0204, New Landmark, Beijing, China). The sediment samples were mixed and partitioned into three subsamples: one was stored at −80°C for total microbial DNA extractions and bacterial community composition analyses; the second was partially air-dried and passed through a 2-mm sieve for total nitrogen (TNSed), total phosphorus (TPSed), and organic matter (OMSed) analyses; and the third was stored at 4°C for analyses of chlorophyll a of benthic algae (Chl aBen) within 24 h. TNSed, TPSed, and OMSed were measured following the standard methods (Lu, 1999). Chl aBen was analyzed according to Boer et al. (2009).
DNA in water and sediment was extracted using the FastDNA spin kit for soil (Q-BIOgene, Carlsbad, CA, USA). The genomic DNA concentration and purity were measured using an Eppendorf Biophotometer plus (Eppendorf, Hamburg, Germany). The bacterial community composition was assessed by sequencing the V3–V4 region of the 16S rRNA gene using the PCR primers 338F (5′-ACTCCTACGGGAGGCAGCA-3′) and 806R (5′-GGACTACHVGGGTWTCTAAT-3′). High-throughput sequencing was carried out on the Illumina MiSeq platform (BioMarker Technologies Co. Ltd, Chuangyeyuan, China). The results were processed according to established methods (Han et al., 2019).
Origin 9.0 and SPSS 20 software were used for data processing, and the results were expressed as means and standard errors. Repeated-measures ANOVA was used for statistical comparisons, and statistical significance was accepted at p < 0.05.
The initial conditions before C addition were comparable. After C addition, total carbon concentration (TC) was significantly higher in the +Carbon treatment than the Control (p < 0.001) (Figure 1A). Similarly, the total inorganic carbon (TIC) levels were significantly higher in the +Carbon treatment than in the Control (p < 0.001). However, no significant difference in total organic carbon (TOC) was observed between treatments (p = 0.06), indicating a rapid conversion of TOC to TIC (Figures 1B,C).
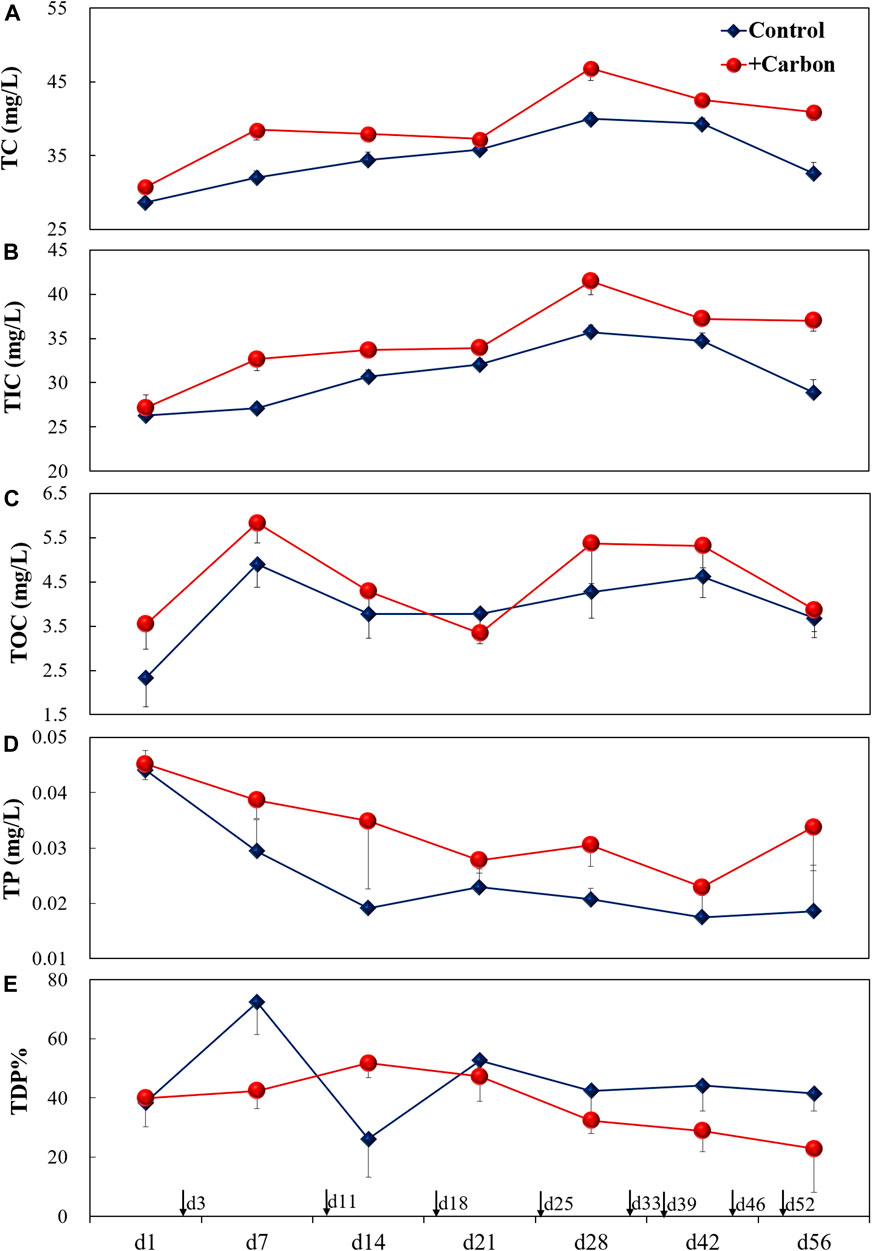
FIGURE 1. Changes (mean ± SE) in TC (A), TIC (B), TOC (C), TP (D), and TDP% (E) for various treatments during the experiment. Single-headed arrows indicate the time of carbon addition. TC, total carbon (mg L−1); TIC, total inorganic carbon (mg L−1); TOC, total organic carbon (mg L−1); TP, total phosphorus (mg L−1); TDP%, total dissolved phosphorus contribution to TP; Control, control treatment without carbon addition; +Carbon, carbon addition treatment (equivalent to 5 mg C L−1).
After C addition, TP was significantly higher in the +Carbon treatment than the Control (p = 0.03) (Figure 1D). TDP% did not differ significantly between treatments (p = 0.06), although it tended to be decreased in the +Carbon treatment (Figure 1E). For DGT-labile P in 7-cm-deep sediment, there were notable increases after C addition relative to the initial condition in the +Carbon treatment (p = 0.01), while minor increases were observed after C addition in the Control (p = 0.22) (Figure 2). The DGT-labile P values recorded for overlying water 3 cm above the sediment decreased clearly after C addition in both the Control (p < 0.001) and +Carbon treatments (p < 0.001) (Figure 2). In terms of Flux-P across the SWI, no obvious difference appeared between pre-C (0.01 μg cm2 s−1) and post-C addition (0.01 μg cm2 s−1) for the Control, while a noticeable increase from 0.01 to 0.02 μg cm2 s−1 was traced for + Carbon treatment (Figure 2).
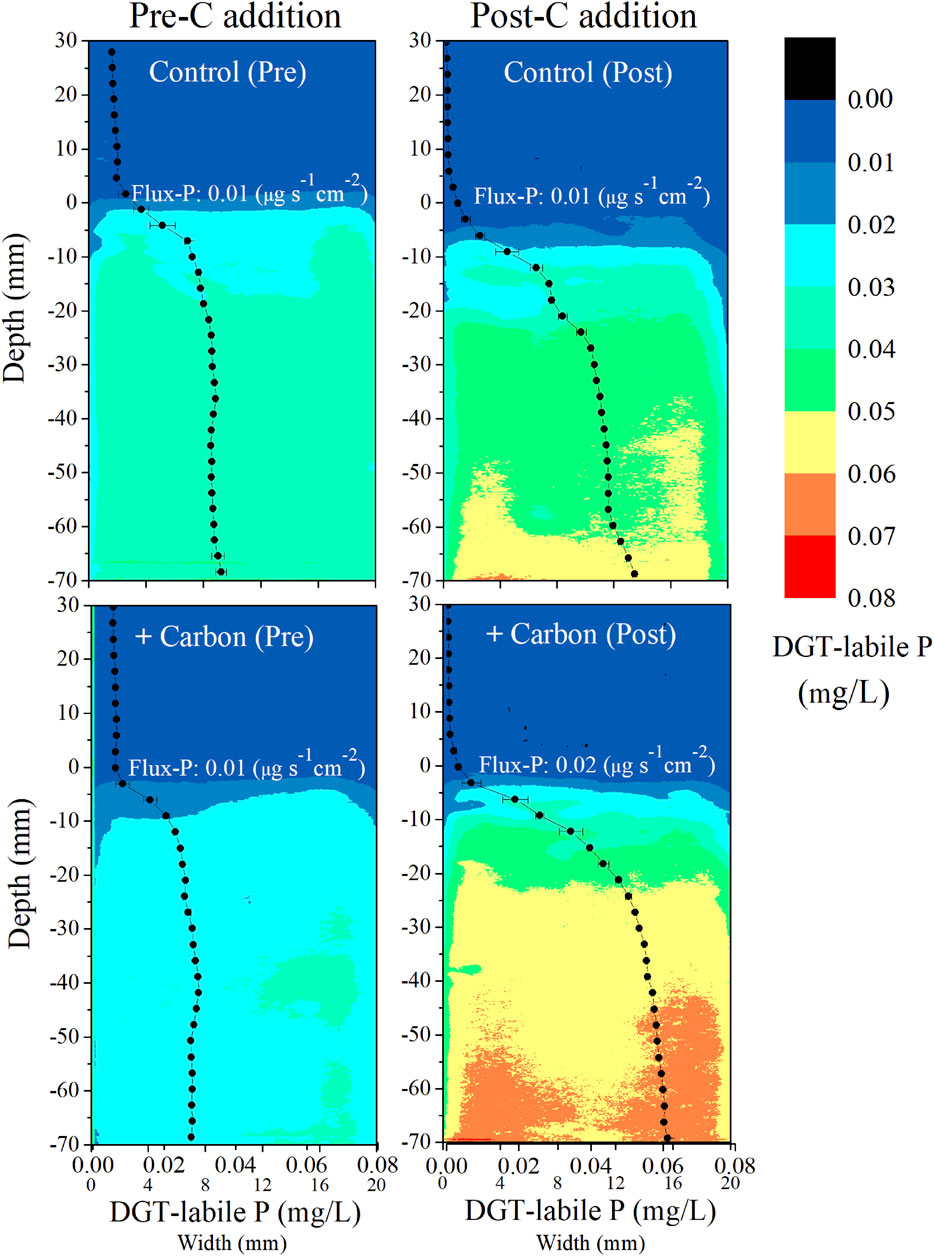
FIGURE 2. Two-dimensional distribution images of DGT-labile phosphorus concentration (the mean values of three replicates) at a spatial resolution of 0.45 mm in sediment and overlying water profiles before (day 1, coded as pre-C addition) and after C addition (day 56, post-C addition). The location of the sediment–water interface is represented by zero. The black solid dots on the image represent the mean value of DGT-labile phosphorus at the same depth. The values of Flux-P represent the flux of phosphorus across the sediment–water interface (the negative and positive values represent the flux to the sediment and water, respectively).
DO was significantly lower in the +Carbon treatment than in the Control (p = 0.006) (Figure 3A). Similarly, the Eh levels were significantly lower in the +Carbon treatment than in the Control (p = 0.006) (Figure 3B). No significant difference was found between treatments for pH (p = 0.06), although it tended to be higher with C addition (Figure 3C).
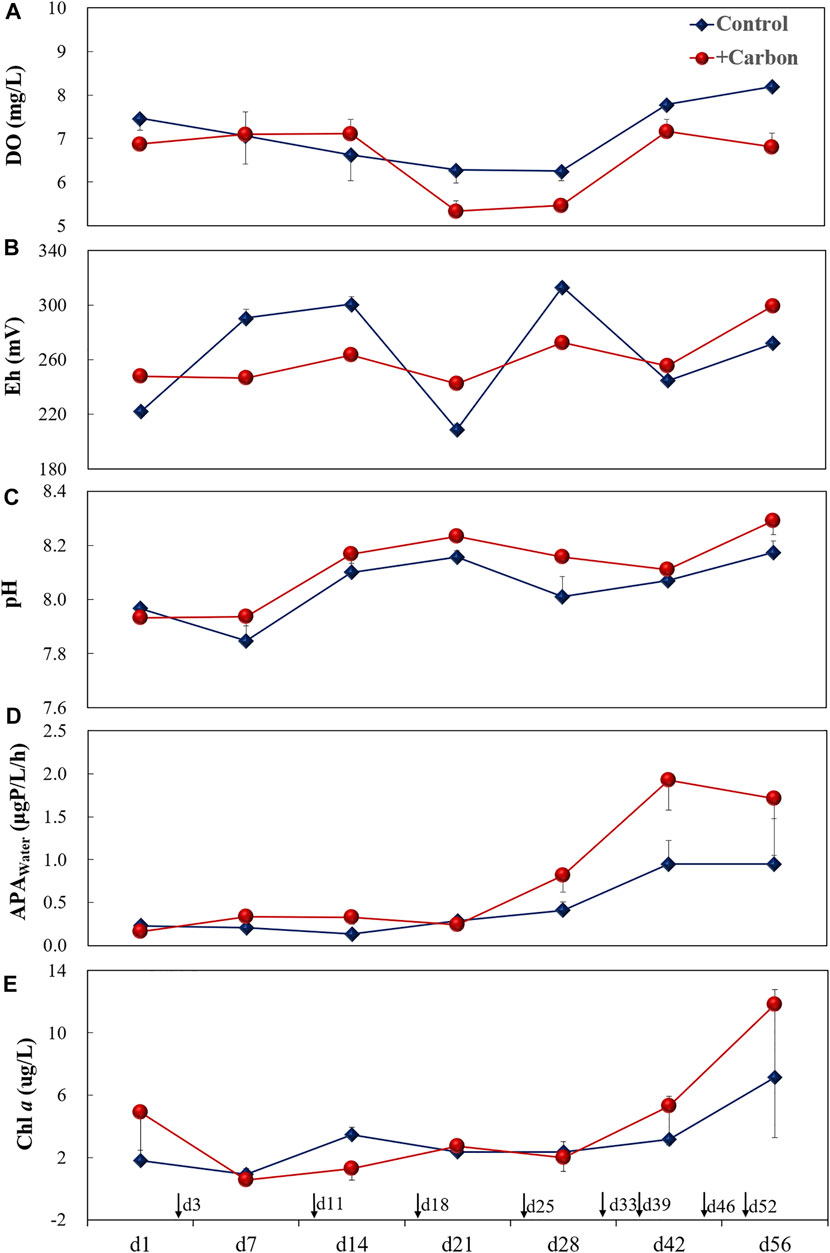
FIGURE 3. Changes (mean ± SE) in DO (A), Eh (B), pH (C), APATot (D), and Chl a (E) for the various treatments during the experiment. Single-headed arrows indicate the time of carbon addition. DO, dissolved oxygen (mg L−1); Eh, redox potential (mV); APATot, total alkaline phosphatase activity in water (µg P L−1 h−1); Chl a, phytoplankton chlorophyll a (µg L−1); Control, control treatment without carbon addition; +Carbon, carbon addition treatment (equivalent to 5 mg C L−1).
APATot tended to increase with C addition and reached its peak (1.9 μg P L−1 h−1), although there was no statistical difference between treatments (p = 0.07) (Figure 3D). There was no significant difference in Chl a between treatments (p = 0.70), although Chl a tended to be higher in the +Carbon treatment (on average 1.65 times higher than the Control) (Figure 3E). No significant differences in APAAlg, APABac, and DOSWI were observed between before or after C addition (p = 0.06–0.88), although the values tended to be higher (APAAlg and APABac) or lower (DOSWI) in the +Carbon treatment (Figures 4A–C). pHSed was significantly lower in the +Carbon group than the Control after C addition (p < 0.001) (Figure 4D).
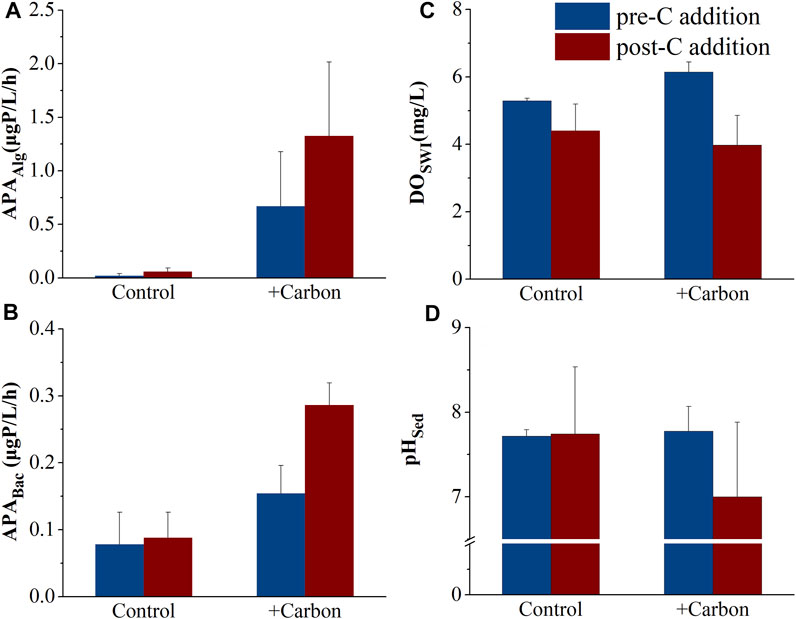
FIGURE 4. Changes (mean ± SE) in APAAlg (A), APABac (B), DOSWI (C), and pHSed (D) in the various treatments before (day 1, coded as pre-C addition) and after carbon addition (day 56, post-C addition). APAAlg, alkaline phosphatase activity of algae fraction (µg P L−1 h−1); APABac, alkaline phosphatase activity of bacterial fraction (µg P L−1 h−1); DOSWI, dissolved oxygen concentration (mg L−1) at the sediment–water interface; pHSed, pH of sediment.
The most abundant classes of the bacteria in water were Oxyphotobacteria (22%–43%), Alphaproteobacteria (17%–31%), Gammaproteobacteria (9%–18%), Bacteroidia (7%–12%), and Acidimicrobiia (0.7%–15%) (Figure 5A). At the genus level, 7%–30% of the bacteria in water were unculturable (Figure 5A), while 45%–59% were classified as “others” (<1% in relative abundance). The most abundant genera of bacteria shifted from Cyanobium (22%) to Leptolyngbya (14%) after C addition (Figure 5B).
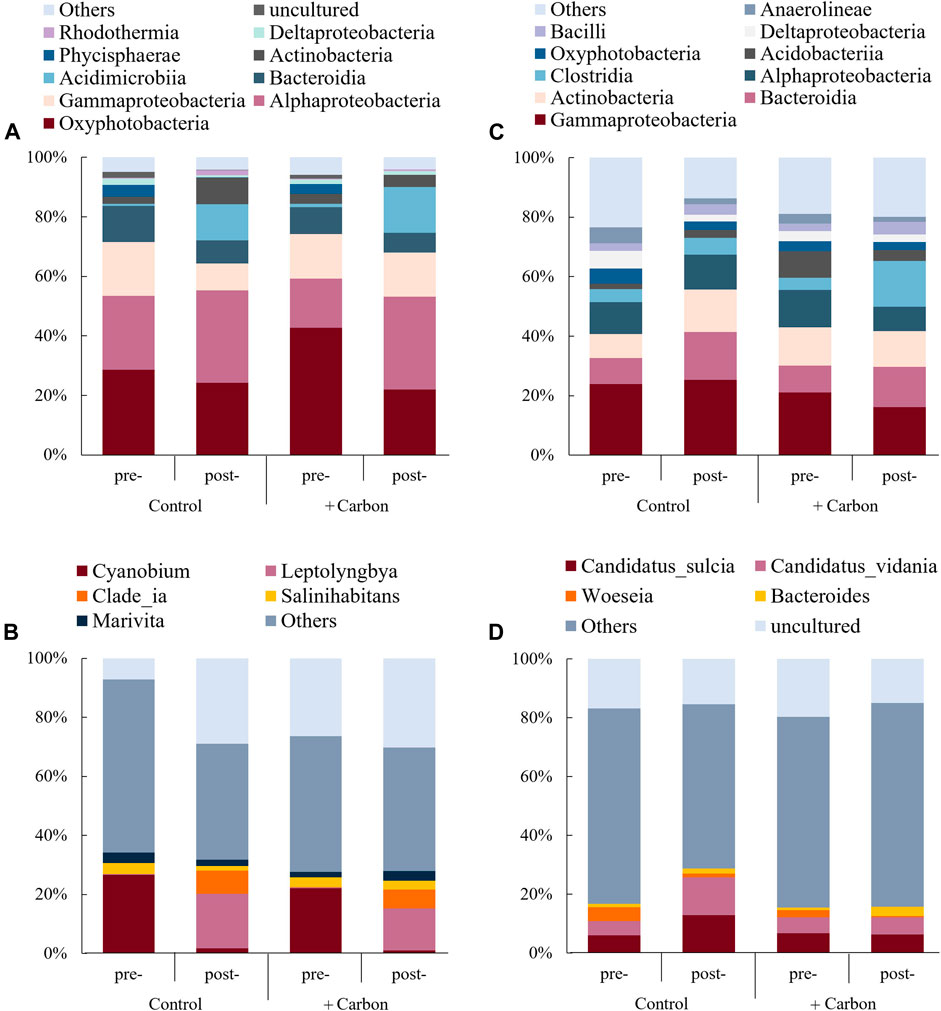
FIGURE 5. The relative abundance of the top 10 classified bacterial classes (A) and genera (B) in overlying water, and bacterial classes (C) and genera (D) in sediment for the various treatments before (day 1, coded as pre-C addition) and after carbon addition (day 56, post-C addition). Only the classes and genera with relative abundance higher than 1% in at least one sample were included for analysis. The abundance is presented in terms of an average percentage of the four replicates, classified by the RDP Classifier at a confidence threshold of 97%. “Other” refers to the sum of the unclassified sequences in each sample.
The most abundant classes of bacteria in sediment were Gammaproteobacteria (16%–25%), Bacteroidia (9%–16%), Actinobacteria (8%–14%), Alphaproteobacteria (8%–13%), and Clostridia (4%–15%) (Figure 5C). At the genus level, three distinct genera (with a relative abundance >1% in at least one sample) were detected before C addition, Candidatus sulcia sp. (6.7%), Candidatus vidania sp. (5.4%), and Woeseia sp. (2.5%). After C addition, C. sulcia sp. (6.3%), C. vidania sp. (5.9%), and Bacteroides sp. (3.2%) were detected. A noticeable increase in abundance of 2.3% was observed from pre- to post-C addition for Bacteroides sp. (increased by 2.3% in +Carbon) (Figure 5D).
In our 2-month mesocosm experiment with carbon addition, significant P increases were found in the +Carbon treatment compared with that in the Control. Significant and minor increases in DGT-labile P values were observed in the +Carbon and Control treatment, respectively. Additionally, obvious increases in Flux-P across the SWI during post- compared with pre-C addition were traced for the +Carbon treatments. The combined changes in TP, DGT-labile P, and Flux-P supported our hypothesis that DOC loading can stimulate P mobilization and release from sediment. This C-induced P release may be a result of 1) decreased DO; 2) elevated APA; and 3) increased proportion of P-solubilizing bacteria.
It is well known that a significant release of P can occur from sediments under anoxic conditions (Nürnberg, 1995; Wang et al., 2008; Ma et al., 2018). For example, augmented P release was recorded when the DO concentration at medium water depth decreased from 9.2 to 6.6 mg L−1 in a mesocosm study (Ma et al., 2018). In our study, DO in the middle water decreased from 7.1 to 5.3 mg L−1 after C addition, which may have contributed to the observed increase in sediment P release. DOC compounds can be adsorbed via the complexation of carboxylic functional groups to metals (such as Fe3+ and Al3+); therefore, they compete with the adsorption of phosphates (Filius et al., 2003; Li et al., 2021), which may be one of the reasons for the observed increase in DGT-labile P.
In contrast to abiotic factors, biotic factors play critical roles in P cycling, especially for algae and bacteria (Qian et al., 2011; Rashid et al., 2016). In our study, C-induced algal growth stimulated the assimilation of DIP from the surrounding water (as suggested by the decrease of DIP% from 40 to 23%), which might then trigger P deficiency of further growth of algae. As a result, algae upregulated APA (from 0.06 to 1.3 μg P L−1 h−1), which accelerated organic P decomposition accompanied by P release. Additionally, the proportion of Bacteroides sp. in sediment increased from 0.9 to 3.2% in the +Carbon treatment. Members of this genus have been identified as P-solubilizing bacteria (Wexler, 2007), which may contribute to P mobilization and release from sediment. Moreover, the increase in P-solubilizing bacteria implied that the bacterial assemblage tended to more effectively use P under C enrichment conditions, which was in line with the stoichiometric theory (Sterner and Elser, 2002; Stutter et al., 2020).
In summary, Na(CH3COO) loading was found to stimulate sediment P release, which was consistent with previous DOC addition tests conducted in bottles (<5 L) (Khoshmanesh et al., 1999; Liptzin and Silver, 2009; Lehtoranta et al., 2015; Anderson, 2018) as well as field investigations (Li et al., 2016), but differed from studies that showed that glucose-C enrichment had no effect or an uptake effect on sediment P (Khoshmanesh et al., 1999; Stutter et al., 2020). For example, in a large-scale field investigation covering 29 subtropical shallow lakes (n = 116), Li et al. (2016) found that TOC can stimulate P release by accelerating anaerobic status formation and extracellular enzymes production. A recent field survey conducted in 4 seawater ponds (n = 27) also stated a significant positive correlation between TOC and TP (R2 = 0.75, p < 0.001) (Dong, unpublished data). In contrast, P uptake or no changes were observed in microcosm glucose-C addition experiments conducted in the River Dee, in Scotland (8 mg C L−1) and the Monash University Research Wetland (100 mg C L−1) (Khoshmanesh et al., 1999; Stutter et al., 2020). These conflicting observations may be attributed to the different forms of C used. For example, bacteria may store some P as polyphosphate (poly-P) when acetate is available. This poly-P is then subsequently released, especially under anaerobic conditions. In contrast, P only tends to be used for cell growth under glucose enrichment conditions, which may increase P uptake (Khoshmanesh et al., 1999; Khoshmanesh et al., 2002). The higher number of bacteria and P retention observed in glucose treatments (8.9 × 10⁵ cells mg−1 dry wt) than in acetate treatments (5.3 × 10⁵ cells mg−1 dry wt) at the same C dose may also support the abovementioned point (Khoshmanesh et al., 1999). Overall, the influences of C on sediment P cycling have been linked to the C forms, which indicates that future studies should involve mixtures or gradients of C forms comprising a diverse array of complex simple-to-macromolecules. Considering the gap between artificial and natural coastal ecosystems, our study may not reveal the whole processes of DOC affecting sediment P release. Therefore, further larger-scale field experiments are needed to fully clarify the role of C in the P cycle.
The combined increases of total P concentrations in overlying water, DGT-labile P in sediment, and Flux-P across the SWI suggested that DOC loading may promote sediment P mobilization and release. Stimulated APA, increased P-solubilizing bacteria proportion, and decreased DO are likely to be the primary mechanisms underlying the promotion effect of carbon loading on sediment P release. The integrated analysis of this and previous C addition experiments suggested that the influences of DOC on sediment P cycling may depend on its forms, exhibiting P release when C occurred as acetate, while P uptake when C occurred as glucose.
The datasets presented in this study can be found in online repositories. The names of the repository/repositories and accession number(s) can be found below: SRA, PRJNA778116.
S-NM designed the research. S-NM, X-MD, and Y-YL conducted the research. X-MD performed data analyses and prepared the original draft of the paper. S-NM conducted revisions of the drafts that improved the paper.
The research was supported by the National Natural Science Foundation of China (Grant No. 42107399), Zhejiang Basic Public Welfare Research Program (Grant No. LQ21C030005), and Ningbo Public Welfare Science and Technology Program (Grant No. 2021S060).
The authors declare that the research was conducted in the absence of any commercial or financial relationships that could be construed as a potential conflict of interest.
All claims expressed in this article are solely those of the authors and do not necessarily represent those of their affiliated organizations, or those of the publisher, the editors, and the reviewers. Any product that may be evaluated in this article, or claim that may be made by its manufacturer, is not guaranteed or endorsed by the publisher.
We thank Liwen Bianji, Edanz Group China (www.liwenbianji.cn/ac), for editing the English text of a draft of this manuscript.
Anderson, O. R. (2018). Evidence for Coupling of the Carbon and Phosphorus Biogeochemical Cycles in Freshwater Microbial Communities. Front. Mar. Sci. 5, 20. doi:10.3389/fmars.2018.00020
Administration of Quality Supervision, Inspection and Quarantine (AQSIQ) (2007). The Specification for marine monitoring of China-part 4: seawater analysis (GB 17378.4e2007). Beijing: General administration of quality supervision, inspection and quarantine, 61–70.
Bauer, J. E., Cai, W.-J., Raymond, P. A., Bianchi, T. S., Hopkinson, C. S., and Regnier, P. A. G. (2013). The Changing Carbon Cycle of the Coastal Ocean. Nature 504, 61–70. doi:10.1038/nature12857
Böer, S. I., Arnosti, C., van Beusekom, J. E. E., and Boetius, A. (2009). Temporal Variations in Microbial Activities and Carbon Turnover in Subtidal sandy Sediments. Biogeosciences 6, 1149–1165. doi:10.5194/bg-6-1149-2009
Chhabra, S., Brazil, D., Morrissey, J., Burke, J., O’Gara, F., and Dowling, D. N. (2013). Fertilization Management Affects the Alkaline Phosphatase Bacterial Community in Barley Rhizosphere Soil. Biol. Fertil. Soils. 49 (1), 31–39. doi:10.1007/s00374-012-0693-2
Deininger, A., and Frigstad, H. (2019). Reevaluating the Role of Organic Matter Sources for Coastal Eutrophication, Oligotrophication, and Ecosystem Health. Front. Mar. Sci. 6, 210. doi:10.3389/fmars.2019.00210
Ding, S., Han, C., Wang, Y., Yao, L., Wang, Y., Xu, D., et al. (2015). In Situ, High-Resolution Imaging of Labile Phosphorus in Sediments of a Large Eutrophic lake. Water Res. 74, 100–109. doi:10.1016/j.watres.2015.02.008
Filius, J. D., Meeussen, J. C. L., Lumsdon, D. G., Hiemstra, T., and Van Riemsdijk, W. H. (2003). Modeling the Binding of Fulvic Acid by Goethite: the Speciation of Adsorbed FA Molecules. Geochimica et Cosmochimica Acta 67, 1463–1474. doi:10.1016/S0016-7037(02)01042-6
Gnanadesikan, A., Kim, G. E., and Pradal, M. A. S. (2019). Impact of Colored Dissolved Materials on the Annual Cycle of Sea Surface Temperature: Potential Implications for Extreme Ocean Temperatures. Geophys. Res. Lett. 46, 861–869. doi:10.1029/2018GL080695
Han, L., Wang, Z., Li, N., Wang, Y., Feng, J., and Zhang, X. (2019). Bacillus Amyloliquefaciens B1408 Suppresses fusarium Wilt in Cucumber by Regulating the Rhizosphere Microbial Community. Appl. Soil Ecol. 136, 55–66. doi:10.1016/j.apsoil.2018.12.011
Huntington, T. G., and Wieczorek, M. E. (2021). An Increase in the Slope of the Concentration-Discharge Relation for Total Organic Carbon in Major Rivers in new England, 1973 to 2019. Sci. Total Environ. 778, 146149. doi:10.1016/j.scitotenv.2021.146149
Jiao, N., Liu, J., Edwards, B., Lv, Z., Cai, R., Liu, Y., et al. (2021). Correcting a Major Error in Assessing Organic Carbon Pollution in Natural Waters. Sci. Adv. 7, 7318. doi:10.1126/sciadv.abc7318
Kaijser, W., Lorenz, A. W., Birk, S., and Hering, D. (2021). The Interplay of Nutrients, Dissolved Inorganic Carbon and Algae in Determining Macrophyte Occurrences in Rivers. Sci. Total Environ. 781 (28), 146728. doi:10.1016/j.scitotenv.2021.146728
Khoshmanesh, A., Hart, B. T., Duncan, A., and Beckett, R. (1999). Biotic Uptake and Release of Phosphorus by a Wetland Sediment. Environ. Technology 20 (1), 85–91. doi:10.1080/09593332008616796
Khoshmanesh, A., Hart, B. T., Duncan, A., and Beckett, R. (2002). Luxury Uptake of Phosphorus by Sediment Bacteria. Water Res. 36 (3), 774–778. doi:10.1016/S0043-1354(01)00272-X
Kim, J., Kim, T.-H., Park, S. R., Lee, H. J., and Kim, J. K. (2020). Factors Controlling the Distributions of Dissolved Organic Matter in the east China Sea during Summer. Sci. Rep. 10 (1), 11854. doi:10.1038/s41598-020-68863-w
Lehtoranta, J., Ekholm, P., Wahlström, S., Tallberg, P., and Uusitalo, R. (2015). Labile Organic Carbon Regulates Phosphorus Release from Eroded Soil Transported into Anaerobic Coastal Systems. Ambio 44 (Suppl. 2), 263–273. doi:10.1007/s13280-014-0620-x
Li, H., Song, C.-L., Cao, X.-Y., and Zhou, Y.-Y. (2016). The Phosphorus Release Pathways and Their Mechanisms Driven by Organic Carbon and Nitrogen in Sediments of Eutrophic Shallow Lakes. Sci. Total Environ. 572, 280–288. doi:10.1016/j.scitotenv.2016.07.221
Li, X., Xie, Q., Kuang, Y., and Wu, D. (2021). Coupled Influence of pH and Dissolved Organic Carbon on the Immobilization of Phosphorus by Lanthanum-Modified Zeolite. Chemosphere 274, 129958. doi:10.1016/j.chemosphere.2021.129958
Liptzin, D., and Silver, W. L. (2009). Effects of Carbon Additions on Iron Reduction and Phosphorus Availability in a Humid Tropical forest Soil. Soil Biol. Biochem. 41 (8), 1696–1702. doi:10.1016/j.soilbio.2009.05.013
Liu, D., Bai, Y., He, X., Chen, C.-T. A., Huang, T.-H., Pan, D., et al. (2020). Changes in Riverine Organic Carbon Input to the Ocean from mainland China over the Past 60 Years. Environ. Int. 134, 105258. doi:10.1016/j.envint.2019.105258
Logue, J. B., Robinson, C. T., Meier, C., and Der Meer, J. R. V. (2004). Relationship between Sediment Organic Matter, Bacteria Composition, and the Ecosystem Metabolism of alpine Streams. Limnol. Oceanogr. 49 (6), 2001–2010. doi:10.4319/lo.2004.49.6.2001
Lu, R. K. (1999). Analytical Methods of Soil and Agro-Chemistry. Beijing, China: Agricultural Science and Technology Press.
Ma, S.-N., Wang, H.-J., Wang, H.-Z., Zhang, M., Li, Y., Bian, S.-J., et al. (20212021). Effects of Nitrate on Phosphorus Release from lake Sediments. Water Res. 194, 116894. doi:10.1016/j.watres.2021.116894
Ma, S. N., Wang, H. J., Wang, H. Z., Li, Y., Liu, M., Liang, X. M., et al. (2018). High Ammonium Loading Can Increase Alkaline Phosphatase Activity and Promote Sediment Phosphorus Release: a Two-Month Mesocosm experiment. Water Res. 145, 388–397. doi:10.1016/j.watres.2018.08.043
NLA (2012). National Lakes Assessment 2012: A Collaborative Survey of Lakes in the United States. Washington, DC: U.S. Environmental Protection Agency.
Nürnberg, G. K. (1995). Quantifying Anoxia in Lakes. Limnol. Oceanogr. 40 (6), 1100–1111. doi:10.4319/lo.1995.40.6.1100
Oviedo-Vargas, D., Royer, T. V., and Johnson, L. T. (2013). Dissolved Organic Carbon Manipulation Reveals Coupled Cycling of Carbon, Nitrogen, and Phosphorus in a Nitrogen-Rich Stream. Limnol. Oceanogr. 58 (4), 1196–1206. doi:10.4319/lo.2013.58.4.1196
Qian, Y., Liang, X., Chen, Y., Lou, L., Cui, X., Tang, J., et al. (2011). Significance of Biological Effects on Phosphorus Transformation Processes at the Water-Sediment Interface under Different Environmental Conditions. Ecol. Eng. 37 (6), 816–825. doi:10.1016/j.ecoleng.2010.12.005
Rashid, M. I., Mujawar, L. H., Shahzad, T., Almeelbi, T., Ismail, I. M. I., and Oves, M. (2016). Bacteria and Fungi Can Contribute to Nutrients Bioavailability and Aggregate Formation in Degraded Soils. Microbiol. Res. 183, 26–41. doi:10.1016/j.micres.2015.11.007
Sawicka, K., Clark, J. M., Vanguelova, E., Monteith, D. T., and Wade, A. J. (2021). Spatial Properties Affecting the Sensitivity of Soil Water Dissolved Organic Carbon Long-Term Median Concentrations and Trends. Sci. Total Environ. 780 (Part B), 146670. doi:10.1016/j.scitotenv.2021.146670
Sterner, R. W., and Elser, J. J. (2002). Ecological Stoichiometry: The Biology of Elements from Molecules to the Biosphere. the United Kingdom, New Jersey: Princeton University Press, 08540.
Stutter, M., Graeber, D., and Weigelhofer, G. (2020). Available Dissolved Organic Carbon Alters Uptake and Recycling of Phosphorus and Nitrogen from River Sediments. Water 12 (12), 3321. doi:10.3390/w12123321
Wang, S., Jin, X., Bu, Q., Jiao, L., and Wu, F. (2008). Effects of Dissolved Oxygen Supply Level on Phosphorus Release from lake Sediments. Colloids Surf. A: Physicochemical Eng. Aspects 316 (1-3), 245–252. doi:10.1016/j.colsurfa.2007.09.007
Keywords: carbon enrichment, phosphorus cycling, phosphorus-solubilizing bacteria, dissolved oxygen, alkaline phosphatase
Citation: Dong X-M, Ma S-N, Wang H-J, Li Y-Y, Li Y and Xu J-L (2022) Dissolved Organic Carbon Loading Stimulates Sediment Phosphorus Mobilization and Release: Preliminary Evidence From Xiangshan Port, East China Sea. Front. Environ. Sci. 9:782701. doi: 10.3389/fenvs.2021.782701
Received: 24 September 2021; Accepted: 29 November 2021;
Published: 17 January 2022.
Edited by:
Zhengwen Liu, Jinan University, ChinaReviewed by:
Dominik Zak, Aarhus University, DenmarkCopyright © 2022 Dong, Ma, Wang, Li, Li and Xu. This is an open-access article distributed under the terms of the Creative Commons Attribution License (CC BY). The use, distribution or reproduction in other forums is permitted, provided the original author(s) and the copyright owner(s) are credited and that the original publication in this journal is cited, in accordance with accepted academic practice. No use, distribution or reproduction is permitted which does not comply with these terms.
*Correspondence: Shuo-Nan Ma, bWFzaHVvbmFuQG5idS5lZHUuY24=; Ji-Lin Xu, eHVqaWxpbkBuYnUuZWR1LmNu
Disclaimer: All claims expressed in this article are solely those of the authors and do not necessarily represent those of their affiliated organizations, or those of the publisher, the editors and the reviewers. Any product that may be evaluated in this article or claim that may be made by its manufacturer is not guaranteed or endorsed by the publisher.
Research integrity at Frontiers
Learn more about the work of our research integrity team to safeguard the quality of each article we publish.