- 1Center for Eco-Environmental Research, Nanjing Hydraulic Research Institute, Nanjing, China
- 2State Key Laboratory of Hydraulics and Mountain River Engineering, Sichuan University, Chengdu, China
- 3Postdoctoral Programme, Guangdong Research Institute of Water Resources and Hydropower, Guangzhou, China
- 4State Key Laboratory of Water Resources and Hydropower Engineering Science, Wuhan University, Wuhan, China
Quantitative predictions of total dissolved gas (TDG) super-saturation are essential for developing operation schemes for high dams. Most TDG generation prediction models have various shortcomings that affect the accuracy of TDG super-saturation estimation, such as oversimplification of influencing factors and uncertainty in parameter values. In this study, the TDG generation process was divided into three parts, gas-liquid mass transfer process in the stilling phase, dilution resulting from the water jet plunging into the stilling phase, and outflow of TDG–super-saturated water from the stilling phase, while considering the water body and bubbles in the stilling phase as a whole. The residence time of the water in the stilling phase (Tr) was introduced to estimate mass transfer time, along with dimensional analysis methods. The properties of TDG generation were evaluated experimentally under varying Tr values. Based on the theoretical analysis and experimental results, a basic water renewal model was proposed and was validated using experimental data. Furthermore, prediction results of this model were compared with those of a classical empirical model and mechanical model based on observed data from a field survey at Xiluodu Dam. The results show that the relative errors between the predicted and experimental measurements were all less than 5%, indicating that the developed prediction model has a good performance. Compared with the mechanism model, the developed model could reduce the standard error (SE), normalized mean error (NME), and error of maximum (REMAX) by 60, 96, and 15%, respectively. Meanwhile, the developed model could reduce the SE, NME, REMAX by 17.4, 36, and 23%, respectively, compared with the empirical model. Considering all the error indexes, it can be concluded that the prediction performance of the water renewal model is the best among the three models. The proposed model was also more generically versatile than the existing models. Prediction results of water regeneration model for TDG could aid the drafting of governing strategies to minimize the risk of super-saturated TDG.
Introduction
High dams serve as energy-storage pools for economic and social development and provide watershed reserves against uncertainties associated with climate change (Hunt et al., 2020). However, the development of hydropower energy has raised various ecological and environmental concerns (Palmer and Ruhi, 2019; Chen et al., 2020). For the safe operation of hydropower dams, water is often released over the spillways, which leads to total dissolved gas (TDG) super-saturation (Pulg et al., 2016; Pleizier et al., 2020). TDG supersaturation refers to the phenomenon when the concentration of TDG in water is greater than the solubility at ambient temperature and atmospheric pressure. TDG contains nitrogen, oxygen, carbon dioxide and rare gases, with the former two being the main components. Existing research results show that, under standard atmospheric pressure, the theoretical saturated concentration of O2 and N2 corresponding to water temperature of 20.4°C is 9.02 mg/L and 14.92 mg/L respectively. The theoretical saturated concentration of O2 and N2 corresponding to water temperature of 21.2°C is 8.88 mg/L and 14.72 mg/L. The difference of the theoretical saturated concentration of each gas in water is 1.6 and 1.4%, respectively (Colt, 2012).
TDG super-saturation induces gas bubble disease in fish, thereby adversely impacting the local riverine eco-environment (Wang et al., 2020; Shen et al., 2021). Fish exposure to TDG supersaturated water can cause foam trauma and death-related injuries (Weitkamp and Katz, 1980). In addition, the pathological changes caused by gas bubble trauma can cause a variety of physiological injuries to fish, including abnormal behavior and unbalanced swimming performance (Wang et al., 2017; Yuan et al., 2017). Migratory fish with reduced swimming capacity are vulnerable to predator attack and can be difficult to find food or migrate across dams when exposed to TDG supersaturation (Wang et al., 2018). Many dams with a height exceeding 200 m have been constructed (Witt et al., 2017) due to increasing demand for hydropower, often resulting in TDG saturation and increased rates of fish mortality. Thus, it is necessary to develop effective models to predict TDG saturation to better protect riverine ecosystems threatened by high dams.
At present, empirical, numerical, and mechanical models are widely used to predict TDG saturation. Among these models, the empirical model uses the discharge rate as the key parameter for regression analyses of monitoring results (Anderson et al., 1998). However, the empirical model does not incorporate the effects of other important parameters, such as downstream water depth. Therefore, changes in power generation flow can affect the generation of TDG, resulting in prediction bias. Numerical models are important methods used to study the process leading to TDG super-saturation (Politano et al., 2017). Wang et al. (2019) established a two-phase flow model that utilized the volume of fluid method to simulate TDG generation in the stilling phase at McNary Dam, with gas bubble size calculated using the bubble number density equation. However, application of the two-phase flow model has been limited by the lack of systematic research on the mechanism of bubble mass transfer and bubble size distribution. As such, further research is needed to improve the accuracy of the model (Politano et al., 2004). Mechanical models were proposed to predict the progression to TDG super-saturation on the basic theory of gas-liquid mass transfer and the process of gas-liquid flow over dam spillways. These models were well established in previous studies for dams with medium and low head in bottom-flow dissipation (Roesner et al., 1972; Geldert et al., 1998). Major parameters of mechanical models include saturated dissolved oxygen concentration, average hydrostatic pressure of the stilling phase, dissolved nitrogen concentration, spillway width, stilling phase length, water temperature, and local atmospheric pressure (Johnson and King, 1975; Hibbs and Guliver, 1997). With the increasing construction of high dams (i.e., ≥200 m), trajectory bucket-type energy dissipation became the primary energy-dissipation method, and the process of TDG super-saturation also changed. Therefore, models for predicting TDG super-saturation at high dams are needed. According to summarized data from analyses of the physical process by which gas dissolves in the stilling phase, Li et al. (2009) proposed a model for predicting TDG levels based on the water depth of the outlet and stilling phase. However, their model does not consider the effective depth reached by gas bubbles or the mass transfer time of bubbles in the stilling phase.
Although numerous studies have examined TDG super-saturation predictive models, methods for evaluating bubble distribution and mass transfer time in stilling phases are underdeveloped. Of the above-mentioned three types of predictive models, the mechanical model is superior, by taking into account modeling parameters such as bubble size, bubble distribution, and bubble mass transfer time. However, mechanical model prediction results tend to be inaccurate due to the lack of a two-phase flow mechanism (Li et al., 2009).
In this study, the residence time of the water in the stilling phase was introduced to characterize the effects of drainage flow and bubble mass transfer time on the development of TDG super-saturation. A theoretical analysis was carried out to establish the fundamental water renewal model in combination with a TDG generation experiment to propose a TDG super-saturation model. The developed water renewal model was trained with the residence time of the water in the stilling phase. The capability of the model was evaluated in field observations conducted downstream of the Xiluodu Dam (a high dam >285 m) constructed on the Jinsha River (i.e., the upper course of the Yangtze in China). Comparisons were made with two other typical models to demonstrate the predictive ability of the developed model.
Materials and Methods
TDG Super-Saturation Prediction Model–Basic Theory
During the spilling period, gas is carried into the stilling phase by the plunging jet of water, leading to a higher concentration of TDG than the solubility under ambient temperature and atmospheric pressure, commonly known as TDG supersaturation. The theoretical saturation concentration of TDG is mainly influenced by water temperature and bubble pressure. The higher the water temperature, the lower the TDG saturation solubility, and there is an exponential relationship between the water temperature and the mass transfer coefficient. The saturation solubility of TDG also varies at different water pressures: the higher the water pressure, the higher the saturation solubility. Specifically, each 1.00 m increase in head increased the saturation solubility by 10% compared to the saturation solubility at atmospheric pressure (Qu et al., 2011a). Theoretically, TDG saturation of water is affected primarily by the air gas concentration when water temperature and pressure are constant (Schierholz et al., 2006).
Due to uncertainty regarding the size, distribution, and trajectory of bubbles, predictions of TDG saturation based on the mass transfer process are generally biased. For a higher prediction accuracy, therefore, the water body and bubbles in the stilling phase were considered as a whole. The TDG generation process could then be divided into three parts: variation in TDG saturation during the process of flowing through air, the gas super-saturation process in the stilling phase, and the process of rapid release at the stilling phase exit. Meanwhile, the gas-liquid mass transfer process in the stilling phase occurs at the bubble and water interface. Thus, when the level of water downstream of the dam and the spilling flow rate are approximately regarded as constants, the TDG saturation in the spilling basin will equilibrate dynamically and reach the steady-state TDG saturation (Css, %). Based on the theory of mass balance, the mass transfer process of TDG generation in the spilling basin can be described by Eq. 1.
where V is the volume of the stilling phase (m3); Qs is the spilling flow rate (m3/s); kLab and kSas are the mass transfer rate coefficients for the bubble and water surfaces, respectively (s−1); Cs* is the bubble liquid-phase equilibrium TDG saturation (%); Csat is the saturation concentration of TDG in water at local atmospheric pressure and temperature, usually set as 100%; C is the actual water TDG saturation (%); and Cu is the TDG saturation of the plunging water jet (%).
Eq. 1 can be simplified as
If the numerator and denominator on the right side of Eq. 2 are divided by Qs, the Css as a function of the residence time of the water in the stilling phase can be expressed by Eq. 3
where Tr is the residence time of the water in the stilling phase (s), Tr = V/Qs.
Previous research found that bubbles are the principal mediators of gas transfer (Demoyer et al., 2003). In addition, mass transfer at the water surface is negligible when compared to transfer at bubble surfaces due to the much slower transfer efficiency. The mass transfer coefficient ka (s−1) can be introduced to substitute the mass transfer rate coefficient for the bubble surfaces, thus simplifying Eq. 3 to
The mass transfer coefficient is primarily related to liquid properties, water temperature, air content, water pressure, and mass transfer time. Air content is relatively high during the process of TDG super-saturation, and pressure and bubble retention time are key factors in this process. Thus, the mass transfer coefficient can be expressed by
where ρ is the density (kg/m3); η is the dynamic viscosity (Pa·s); and h is the water depth of the stilling phase (m).
According to the dimensional analysis method and π-theorem, the equation for the mass transfer coefficient based on Tr can be written as
where ν is the kinematic viscosity (m2/s), ν = η/ρ.
The mass transfer coefficient can then be rearranged as follows:
Examination of the Effect of Tr on the TDG Super-Saturation Process
The experimental setup included an air compressor, air inlet pipe, water inlet pipe, water outlet pipe, rotor flowmeters, pressure gauge, pressure reducing valve, pressure regulating valve, bubble diffuser, and pressure tank (Figure 1). At the beginning of the experiment, tap water and air were injected into a 0.30-m diameter × 1.13-m deep cylindrical pressure tank, and the flow rate was controlled using the rotor flowmeters. An air compressor was used to force air to dissolve in the water by increasing the pressure within the pressure tank, thereby generating super-saturated TDG water. In order to ensure the water body to fully contact with the bubbles, a 0.18-m diameter circular, flat, titanium alloy bubble diffuser was installed at 0.10 m from the bottom of the tank. The pressure regulating valve was installed between the air compressor and the pressure tank to ensure a steady airflow rate. The TDG saturation detector (Hydrolab DS5X Water Quality Multiprobes; Hach Company, United States) was attached to the inside wall of the tank to automatically record the TDG saturation and temperature of the water in real-time. TDG saturation was measured using the TDG pressure probe, which had a measurement range of 400–1,300 mm Hg and accuracy of ±0.1%. The temperature probe measurement range was −5 to 50°C, with an accuracy of ±0.1°C. The pressure inside the tank was measured using the water pressure probe, which had a measurement range of 0–50 m and an accuracy of ±0.1 m.
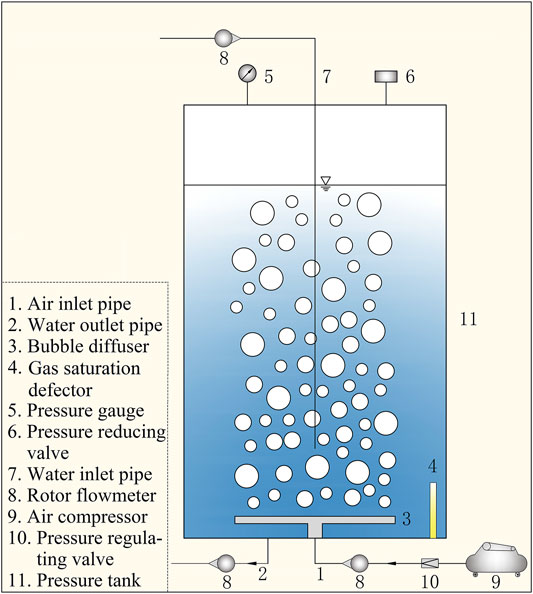
FIGURE 1. Schematic illustration of the experimental setup for generating super-saturated TDG water.
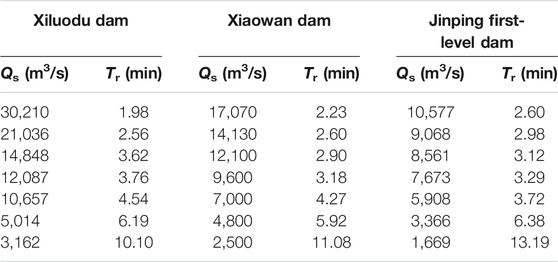
To match the residence time of the water in the stilling phase under experimental conditions with the Tr of the dams, the water body renewal time of the stilling phase was determined at Xiluodu Dam, Xiaowan Dam, and Jinping first-level Dam. They are all typical super-large hydropower stations in China. Jinping first-level Dam (height: 305 m) and Xiluodu Dam (height: 285.5 m) are in the Jinsha River. Xiaowan Dam (height: 292 m) locates in Lancang River. The 3 dams can provide comprehensive data sets of dam Tr. The results are shown in Table 1. In typical projects, the residence time of the water in the stilling phase varies greatly under different discharge rates, ranging from 2 to 13 min. To determine the airflow rate (Qa) in the subsequent experiments, the steady-state TDG saturation was compared at Qa values of 60, 180, 300, 600, and 900 L/h. These analyses indicated that the mass transfer process tended to remain stable at Qa of 900 L/h. Therefore, the following experiments were carried out at a Qa of 900 L/h. Experimental scenarios were designed with a water volume (V) of 30, 40, 50, or 60 L and a flow rate (Qs) ranging from 180 to 750 L/h. A scenario without water renewal was examined as a control. The mass transfer coefficient was calculated for each of the scenarios using Eq. 8.
The mass transfer rate, E, was introduced to evaluate the variation in TDG saturation:
where CD is the TDG saturation of the outflow (%); CU is the TDG saturation of the inflow (%); and Cs* is the theoretical TDG saturation at the pressure and temperature within the tank (%), determine the value by checking the table (Colt, 2012).
Field Monitoring of TDG Super-Saturation and Data Processing
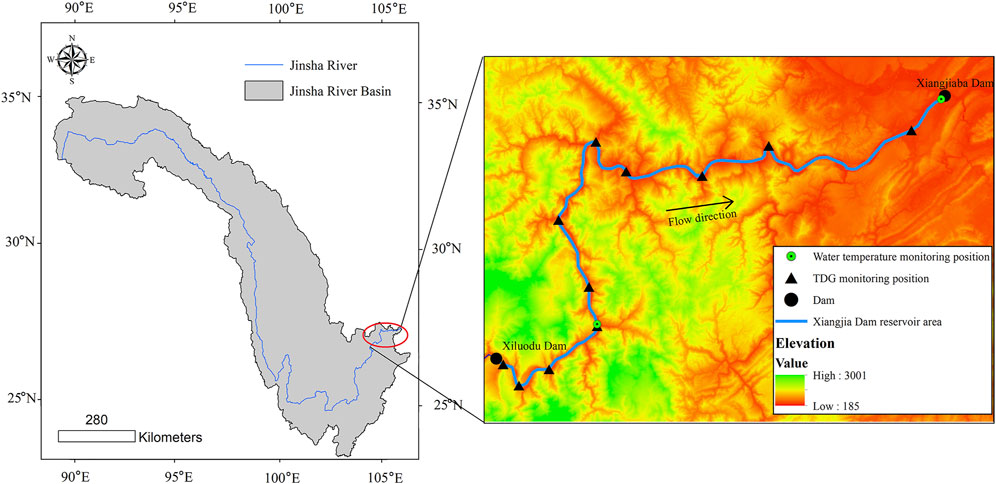
TDG field observations were conducted 3.0 km downstream of the Xiluodu Dam at 0,800 h and 1,400 h from June 23 to July 6, 2017. TDG saturation and water temperature were measured using a Hydrolab DS5. During the monitoring period, the water temperature below the Xiluodu dam varied in the range of 20.4–21.2°C, with corresponding changes in the theoretical saturated dissolved concentration of each gas in the water column. The atmospheric pressure was set to 724 mm Hg, and the TDG probe monitoring frequency and duration were set to 1 and 30 min, respectively. TDG saturation of the flow in the stilling phase was calculated using Eq. 14 based on the measured results because the TDG saturation at the monitoring point (CM; Figure 2) represented the mixing of the spill flow and tail water.
where CM is the TDG saturation at the monitoring point (%); Cs and Cp represent the TDG saturation of the flow in the stilling phase and the power flow, respectively (%); and Qs and Qp represent the spilling flow rate and power flow rate, respectively (m3/s).
Using the above inputs, a TDG generation prediction model using a multiple linear regression method (Eqs 4, 8) was proposed for Xiluodu Dam. During the field observation period, data regarding the flow rate and water level downstream of the Xiluodu Dam were obtained from the China Three Gorges Corporation.
Comparison of Models for Predicting TDG Super-Saturation
The empirical model (Eq. 11) (Anderson et al., 1998) and mechanical model (Eqs 12, 13) (MaQian, 2016) were compared with the developed estimation model using field observation data. The empirical model was developed based on the spilling flow rate. However, the mechanical model was developed based on gas transfer theories.
Empirical model:
Mechanical model:
where ΔP is the average pressure in the stilling phase, which consists of static pressure and hydrodynamic pressure (m); P0 is the local atmospheric pressure (m); tR is the retention time of aerated water in the stilling phase (s); hk is the water depth in the stilling phase (m); g is acceleration due to gravity (m2/s); l0 is the horizontal distance between the downstream toe of the dam and the impact point of the jet (m); l is the length of the stilling phase (m); and a, b, and c are dimensionless constants that can be fitted from field observation results, the results were a = 154.02, b = −34.15, and c = −2.76 × 10⁻⁴.
Model Evaluation Index
The standard error (SE), Normalized mean error (NME), Mean multiplicative error (MME), Nash-Sutcliffe efficiency coefficient (NSE), and coefficient of determination (R2) were used to evaluate the performance of the predictive equations (Jha et al., 2010; Disley et al., 2015). Because the maximum TDG saturation level represents the most serious threat to the habitat, the error of maximum TDG saturation level (REMAX) was evaluated for each model. The errors were determined using the following equations:
where CP and CM denote the predicted and measured TDG saturation levels (%); CPMAX and CMMAX are the maximum predicted and measured TDG saturation levels (%); N represents the number of values; and i is the time step.
Results
TDG Super-Saturation Experimental Results
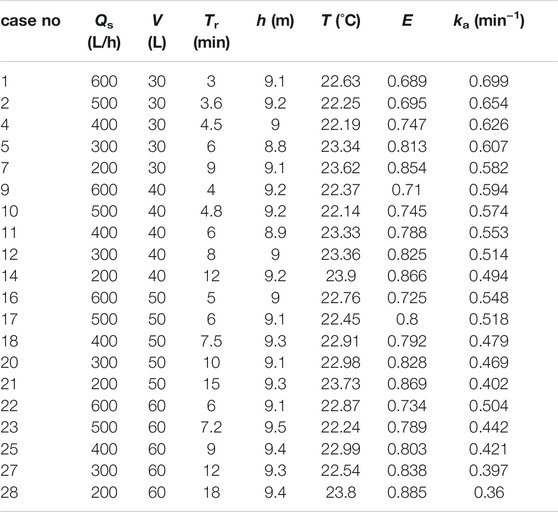
The dynamics of the mass transfer rate at different Tr are summarized in Figures 3A–D. The mass transfer rate increased with increasing Tr and eventually stabilized. In the absence of water renewal, the mass transfer rate gradually approached a value of 1.0 (the theoretical saturation state). In contrast, under steady-state conditions, the mass transfer rate was <1.0 with water renewal, and the TDG saturation was lower than the theoretical saturation state. A comparison of different scenarios (Table 2) revealed that the mass transfer rate in the steady-state increased with increasing Tr. In addition, the experimentally derived mass transfer coefficients were calculated and plotted against Tr (Figure 4). These data showed that the mass transfer coefficient decreased with increasing Tr.
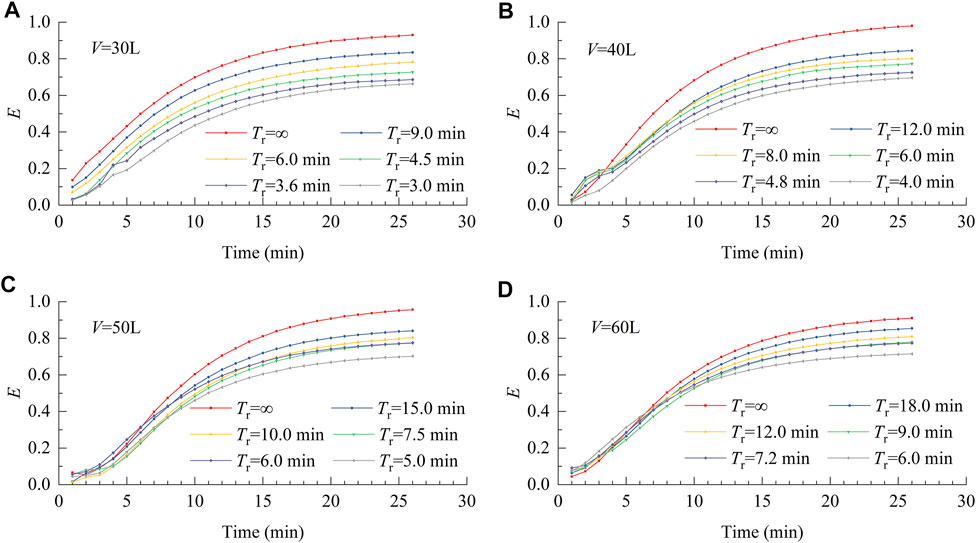
FIGURE 3. (A) Effect of water renewal time on mass transfer rat. (B) Effect of water renewal time on mass transfer rate. (C). Effect of water renewal time on mass transfer rate. (D). Effect of water renewal time on mass transfer rate.
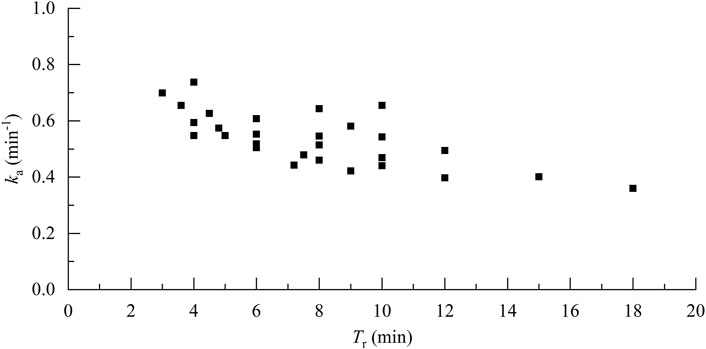
FIGURE 4. Relationship between water renewal time and mass transfer coefficient (Experimental condition).
tBased on the established basic form of the mass transfer coefficient equation (Eq. 8), a nonlinear regression analysis of the mass transfer coefficient, pressure head and Tr (Table 2) for each working condition was performed to obtain the mass transfer coefficient equation under the experimental condition (Eq. 20), with a minimum correlation R2 = 0.87.
Predictive Ability of the Developed Model in Experimental Condition
The mass transfer coefficient equation (Eq. 20) was coupled with the stable-state TDG super-saturation prediction equation (Eq. 4) to establish the model for predicting TDG super-saturation under experimental conditions. Figure 5 and Table 3 show a comparison of calculated and measured TDG super-saturation values under various experimental conditions. The comparison showed that the Relative Error (RE)between the calculated and measured values was <5%. In addition, the Root Mean Squared Error (RMSE), R2, and NSE values of 1.21%, 0.94, and 0.94, respectively, indicated that the developed water renewal model exhibits good performance in predicting TDG super-saturation generated by water under experimental conditions.
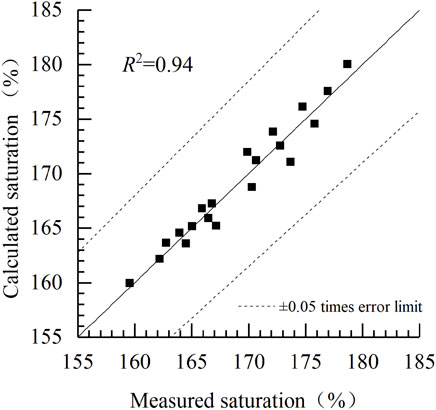
FIGURE 5. Comparison between measured and calculated saturation values of the water renewal model under experimental conditions.
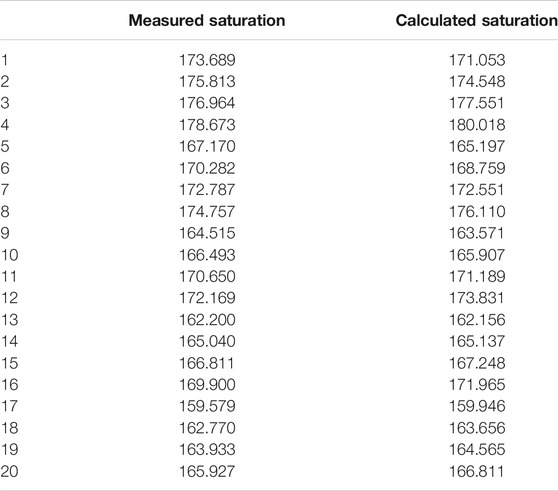
TABLE 3. Measured and calculated saturation values of the water renewal model under experimental conditions.
Predictive Ability of Various Models Under Observed Conditions
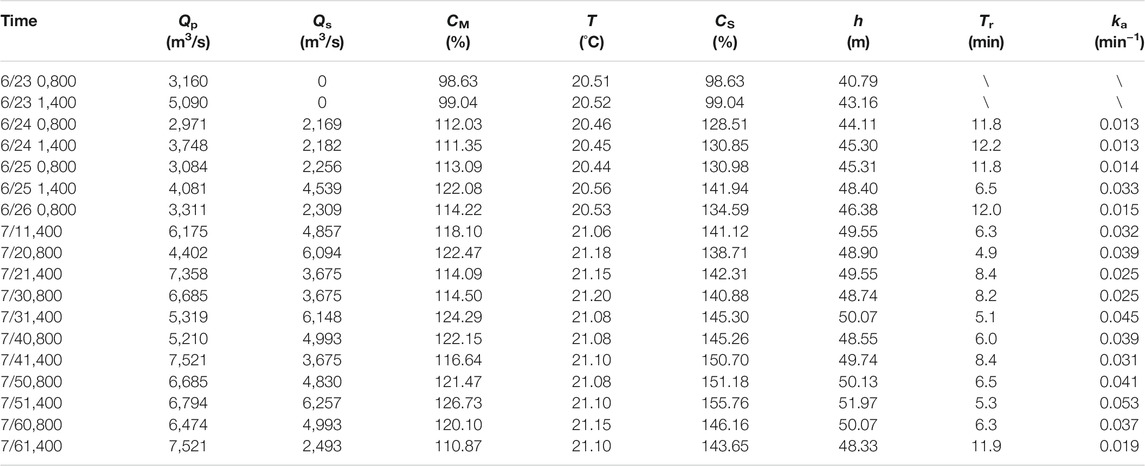
Results of monitoring TDG saturation levels at the Xiluodu Dam are listed in Table 4. The TDG saturation at the monitoring point during the observation period was generally >100%. The TDG saturation reached a maximum of 126.73% at 1,400 h on July 5 and a minimum of 98.63% at 0,800 h on June 23. According to Eq. 11, the TDG saturation at the monitoring point was transferred to the TDG saturation in the stilling phase under the dam. Data indicated that the maximum TDG saturation in the stilling phase reached 155.76% at 1,400 h on July 5, and the minimum TDG saturation in the basin reached 98.63% at 0,800 h on June 23.
To analyze the effect of the water renewal model in the engineering practice, this section generates the measured values of each parameter based on the saturation of the near zone below the Xiluodu hydropower station dam, and establishes the fitting equation for the mass transfer coefficient of the near zone below the Xiluodu dam. The water renewal model (Eq. 4) is used to calculate the mass transfer coefficient ka corresponding to each monitoring condition, and the relationship between the mass transfer coefficient ka and the Tr is shown in Figure 6. The mass transfer coefficient ka and the related parameters under each monitoring condition are shown in Table 4. Based on the basic form of the established mass transfer coefficient equation (Eq. 8), a nonlinear regression analysis of the calculated mass transfer coefficient ka, pressure head (water depth of the stilling phase) and Tr (Table 4) was conducted to obtain the expression of the mass transfer coefficient equation in the stilling phase of Xiluodu Hydropower Station (Eq. 21), with a minimum correlation R2 = 0.82.
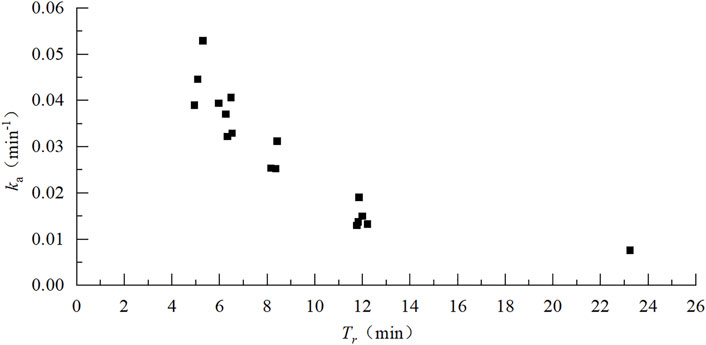
FIGURE 6. Relationship between water renewal time and mass transfer coefficient (Observed conditions).
By coupling the established Eq. 21 with Eq. 4, a model for predicting TDG super-saturation at Xiluodu Dam was obtained, and this model was designated the “water renewal model for Xiluodu Dam.”
TDG super-saturation values estimated based on field data using the empirical model, mechanical model, and water renewal model developed in this study are shown in Figure 7. The error of the mechanism model was larger than that of the other two models due to larger calculation results. The SE (1.81), NME (0.16), MME (1.00), and REMAX (2.26) values were the lowest, and the NSE (0.90) and R2 (0.93) values were the highest for the water renewal model in Table 5, indicating that the performance of the water renewal model is superior to that of the other models.
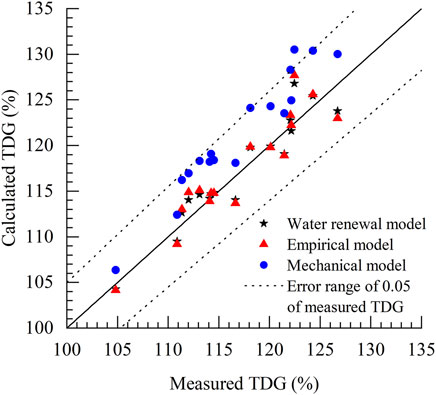
FIGURE 7. Comparison between estimated TDG saturation levels determined using the three models based on field observations.
Discussion
In this study, a water renewal model was developed based on the theory of gas-liquid mass transfer and the process of gas-liquid flow during dam spilling. The primary parameters of the model are the mass transfer coefficient (Tr), TDG saturation of the plunging jet, and theoretical TDG saturation of water in the stilling phase. Among these parameters, the theoretical TDG saturation of water in the stilling phase was mainly determined by the pressure of the flow on the gas bubbles. The increased pressure leads to a higher theoretical TDG saturation and greater difference from the actual value, thus promoting TDG super-saturation (Qu et al., 2011b). TDG saturation was also affected by the saturation level of the plunging jet and outflow in the dynamic balance state. The TDG saturation of the water in the stilling phase can be diluted by the TDG saturation level of the plunging jet. However, a shorter Tr means greater turbulence, which promotes the gas-liquid mass transfer process (Lu et al., 2019). Both experimental and field monitoring results indicated a negative correlation between the Tr and mass transfer coefficient. Therefore, the steady-state TDG saturation level was determined based on the joint effect of the mass transfer coefficient and Tr.
Since the 19th century, a large number of theoretical and experimental studies have been carried out to investigate the interphase mass transfer processes. Classical models such as the two-film model and the penetration model were consequently proposed. The two-film model (Whitman, 1923), assumes that the mass transfer process is a steady-state process, and the mass transfer coefficient is proportional to the primary diffusion coefficient. Although the model is simple to calculate, the liquid film thickness values are difficult to obtain accurately. Higbie, (1935) proposed the interphase mass transfer process as a non-stationary process, and a theory of surface renewal on the basis of which a penetration model was developed. Compared to the two-film model, the penetration model has a time-dependent mass transfer parameter that can be used to describe non-stationary mass transfer processes. However, the mass transfer coefficients predicted by penetration model differ significantly from some practical industrial applications, thus limiting the scope of application (Ding, 2015). Compared to previous mass transfer models, the introduction of a mass transfer coefficient model with Tr as a parameter (Eq. 8) is more convenient in terms of obtaining parameters such as time and has a wider application range.
Both the empirical and mechanical models have been widely used for estimating TDG levels. Comparing and analyzing the predictive ability and errors of the models, as shown in Figure 7, revealed that the water renewal model performed better than the empirical model performs. This is because the empirical model only considers the effect of Qs and does not incorporate h (water depth). However, previous studies have shown that h is also an important factor that affects TDG super-saturation (Steven and Schneider, 1997), because an increase in h promotes the mass transfer process. There is a linear correlation between h and the outflow rate, Q (the sum of Qp and Qs), and h exhibits an increasing trend with Qp. During the spilling period, Qp is not constant, and h would vary accordingly. Thus, predicting TDG super-saturation using the empirical model would introduce certain errors. In addition to discharge, the water renewal model exhibits improved prediction accuracy because it incorporates the stilling phase water depth. Therefore, the updated water renewal model is superior to the empirical model.
As shown in Figure 7, the predictive performance of the water renewal model was also superior to that of the mechanism model, and its calculated value was closer to the actual value, whereas the calculated value of the mechanism model was greater than the measured value. The mechanism model is typically used in conjunction with physical model experiments, which use tracers (i.e., colored paper, foam paper, and plastic fish drift) as bubbles. The retention time of each tracer in the stilling phase is calculated using mathematical statistics methods, and the bubble retention time regression equation is obtained. As a large number of bubbles escape from the water surface in the stilling phase, the mass transfer process therein stops, and thus, the obtained retention time equation would generate a larger value for the calculated mass transfer time. As a result, values predicted using the mechanism model are greater than the measured values. Compared with mechanistic models, the developed model applies the parameter of Tr to characterize the bubble mass transfer time and replaces the independent individual mass transfer process of bubbles with the whole mass transfer process, thus overcoming the problem of uncertainty in estimates of the mass transfer time of single bubbles. The process of dam discharge mass transfer is further simplified, and the accuracy of predictions of TDG saturation under the dam is improved.
The water renewal model was developed under the assumption of fixed boundary conditions during the spilling period. The water in the stilling phase was regarded as a whole, and the mass transfer process primarily occurs in the flow within the stilling phase. Therefore, the model is most suitable for dams that employ ski-jump energy dissipation. The applicability of the water renewal model to other spilling patterns, such as tunnel spillway dissipation, needs future validations because the flow has an uncertain mass transfer area after the water leaves the tunnel, and the Tr, therefore, cannot be determined. Despite the good performance of the water renewal model in predicting TDG saturation of the flow in the stilling phase at Xiluodu Dam, the model ignores the effect of the hydrodynamic pressure of the flow, which could promote the process of TDG super-saturation. Ignoring this effect could lead to underestimation of TDG saturation predictions, especially under conditions of high spilling flow rate. Thus, a parameter accounting for the influence of hydrodynamic pressure on TDG super-saturation could be included in future revisions of the model to further improve its performance. Overall, the model developed in this study appears to be a valid alternative for estimating TDG super-saturation levels. This study provides a scientific basis for evaluating the threat of TDG super-saturation to fish and could aid in the development of measures governing dam operations.
Conclusion
In this study, a model was developed for estimating TDG saturation via theoretical analyses and physical measurements of TDG levels. The performance of the developed model was evaluated in comparison with two other representative models. The developed model overcame the problem of uncertainty in estimations of the mass transfer time of single bubbles. The prediction error of the developed model was minimal compared with the empirical model and mechanism model, indicating that the developed model optimizes the mass transfer process of dam outflow water and the accuracy of TDG saturation predictions for downstream areas near the dam.
Data Availability Statement
Publicly available datasets were analyzed in this study. This data can be found here: https://pan.baidu.com/s/1EdVhzgWb5Q7AEt7Pl6RlqA password: 0000.
Author Contributions
YP and CZ: Conceptualization, Data curation, Writing – original draft, Validation. YL, WZ, FM, KM, and SY: Conceptualization, Supervision, Writing-review and editing, Formal analysis. QC: Conceptualization, Writing - review and editing, Supervision.
Funding
This work is supported by the National Nature Science Foundation of China (92047303) and (51879165).
Conflict of Interest
The authors declare that the research was conducted in the absence of any commercial or financial relationships that could be construed as a potential conflict of interest.
Publisher’s Note
All claims expressed in this article are solely those of the authors and do not necessarily represent those of their affiliated organizations, or those of the publisher, the editors and the reviewers. Any product that may be evaluated in this article, orclaim that may be made by its manufacturer, is not guaranteed or endorsed by the publisher.
Acknowledgments
We would like to thank the China Three Gorges Corporation for providing the flow rate and water level downstream of the Xiluodu Dam during the field observation period. We also thank the reviewers whose suggestions improved this manuscript.
References
Anderson, J., Hayes, J., Shaw, P., and Zable, R. (1998). Columbia River Salmon Passage Model: Theory and Calibration and Validation. Washington D.C.: Columbia Basin Research.
Chen, Q., Shi, W., Huisman, J., Maberly, S. C., Zhang, J., Yu, J., et al. (2020). Hydropower Reservoirs on the Upper Mekong River Modify Nutrient Bioavailability Downstream. Nat. Sci. Rev. 7 (9), 1449–1457. doi:10.1093/nsr/nwaa026
Colt, J. (2012). Dissolved Gas Concentration in Water Computation as Functions of Temperature, Salinity and Pressure. Seattle, WA: Northwest Fisheries Science Center.
Demoyer, C. D., Schierholz, E. L., Gulliver, J. S., and Wilhelms, S. C. (2003). Impact of Bubble and Free Surface Oxygen Transfer on Diffused Aeration Systems. Water Res. 37 (8), 1890–1904. doi:10.1016/s0043-1354(02)00566-3
Ding, Y. (2015). Study on Gas-Liquid Interface Mass Transfer Mechanism under the Condition of Turbulence. Hunan, China: Xiangtan University.
Disley, T., Gharabaghi, B., Mahboubi, A. A., and McBean, E. A. (2015). Predictive Equation for Longitudinal Dispersion Coefficient. Hydrol. Process. 29 (2), 161–172. doi:10.1002/hyp.10139
Geldert, D. A., Gulliver, J. S., and Wilhelms, S. C. (1998). Modeling Dissolved Gas Supersaturation below Spillway Plunge Pools. J. Hydraulic Eng. 124 (5), 513–521. doi:10.1061/(asce)0733-9429(1998)124:5(513)
Hibbs, D. E., and Gulliver, J. S. (1997). Prediction of Effective Saturation Concentration at Spillway Plunge Pools. J. Hydraulic Eng. 123 (11), 940–949. doi:10.1061/(asce)0733-9429(1997)123:11(940)
Higbie, R. (1935). The Rate of Absorption of a Pure Gas into a Still Liquid during Short Periods of Exposure. Trans. Inst. Chem. Eng. 31, 365–389.
Hunt, J. D., Byers, E., Wada, Y., Parkinson, S., Gernaat, D. E. H. J., Langan, S., et al. (2020). Global Resource Potential of Seasonal Pumped Hydropower Storage for Energy and Water Storage. Nat. Commun. 11 (1), 947–948. doi:10.1038/s41467-020-14555-y
Jha, R., Ojha, C. S. P., and Bhatia, K. K. S. (2010). Refinement of Predictive Reaeration Equations for a Typical Indian River. Hydrol. Proc. 15, 1047–1060. doi:10.1002/hyp.177
Johnson, P. L., and King, D. L. (1975). Prediction of Dissolved Gas Transfer at Hydraulic Structures. New York: Reaeration Res.ASCE.
Li, R., Li, J., Li, K., Deng, Y., and Feng, J. (2009). Prediction for Supersaturated Total Dissolved Gas in High-Dam Hydropower Projects. Sci. China Ser. E-technol. Sci. 52 (12), 3661–3667. doi:10.1007/s11431-009-0337-4
Lu, J., Li, R., Ma, Q., Feng, J., Xu, W., Zhang, F., et al. (2019). Model for Total Dissolved Gas Supersaturation from Plunging Jets in High Dams. J. Hydraul. Eng. 145 (1), 04018082. doi:10.1061/(asce)hy.1943-7900.0001550
Ma, Q. (2016). Ecological Scheduling Study of Terrace Power Stations Based on the Effect of Supersaturated Total Dissolved Gas on Fish. Chengdu: Sichuan University.
Palmer, M., and Ruhi, A. (2019). Linkages between Flow Regime, Biota, and Ecosystem Processes: Implications for River Restoration[J]. Science 365 (6459), eaaw2087. doi:10.1126/science.aaw2087
Pleizier, N. K., Nelson, C., Cooke, S. J., and Brauner, C. J. (2020). Understanding Gas Bubble Trauma in an Era of Hydropower Expansion: How Do Fish Compensate at Depth? Can. J. Fish. Aquat. Sci. 77 (3), 556–563. doi:10.1139/cjfas-2019-0243
Politano, M., Carrica, P., Turan, C., and Weber, L. (2004). Prediction of the Total Dissolved Gas Downstream of Spillways Using a Two-phase Flow Model. World Water Environ. Resour. Congress, 110. doi:10.1061/40737(2004)310
Politano, M., Castro, A., and Hadjerioua, B. (2017). Modeling Total Dissolved Gas for Optimal Operation of Multireservoir Systems. J. Hydraul. Engin. 143 (6), 1–12. doi:10.1061/(asce)hy.1943-7900.0001287
Pulg, U., Vollset, K. W., Velle, G., and Stranzl, S. (2016). First Observations of Saturopeaking: Characteristics and Implications. Sci. Total Environ. 573 (23), 1615–1621. doi:10.1016/j.scitotenv.2016.09.143
Qu, L., Li, R., Li, J., Li, K. F., and Deng, Y. (2011a). Field Observation of Total Dissolved Gas Supersaturation of High-Dams. Sci. China Technol. Sci. 54 (01), 156–162. doi:10.1007/s11431-010-4217-8
Qu, L., Li, R., Li, J., Li, K. F., and Wang, L. (2011b). Experimental Study on Total Dissolved Gas Supersaturation in Water. Water Sci. Engin. 4 (4), 396–404. doi:10.3882/j.issn.1674-2370.2011.04.004
Roesner, L. A., Orlob, G. T., and Norton, W. R. (1972). A Nitrogen Gas (N2) Model for the Lower Columbia River System Walnut. Creek. CA: Water Resources Engineers.
Schierholz, E. L., Gulliver, J. S., Wilhelms, S. C., and Henneman, H. E. (2006). Gas Transfer from Air Diffusers. Water Res. 40 (5), 1018–1026. doi:10.1016/j.watres.2005.12.033
Shen, X., Hodges, B. R., Li, R., Li, Z., Fan, J. L., Cui, N. B., et al. (2021). Factors Influencing Distribution Characteristics of Total Dissolved Gas Supersaturation at Confluences. Water Resour. Res., e2020WR028760. doi:10.1029/2020wr028760
Steven, C. W., and Schneider, M. L. (1997). Total Dissolved Gas in the Near-Field Tailwater of Ice Harbor Dam. Int. Assoc. Hydraul. Res. 123 (5), 513–517.
Wang, Y., An, R., Li, Y., and Li, K. (2017). Swimming Performance of Rock Carp Procypris Rabaudi and Prenant's Schizothoracin Schizothorax Prenanti Acclimated to Total Dissolved Gas Supersaturated Water. North Am. J. Fish. Management 37, 1183–1190. doi:10.1080/02755947.2017.1353558
Wang, Y., Li, Y., An, R., and Li, K. (2018). Effects of Total Dissolved Gas Supersaturation on the Swimming Performance of Two Endemic Fish Species in the Upper Yangtze River. Sci. Rep. 8, 1–9. doi:10.1038/s41598-018-28360-7
Wang, Y., Liang, R., Li, K., and Li, R. (2020). Tolerance and Avoidance Mechanisms of the Rare and Endemic Fish of the Upper Yangtze River to Total Dissolved Gas Supersaturation by Hydropower Stations. River Res. Applic 36 (7), 993–1003. doi:10.1002/rra.3677
Wang, Y., Politano, M., and Weber, L. (2019). Spillway Jet Regime and Total Dissolved Gas Prediction with a Multiphase Flow Model. J. Hydraulic Res. 57 (1), 26–38. doi:10.1080/00221686.2018.1428231
Weitkamp, D. E., and Katz, M. (1980). A Review of Dissolved Gas Supersaturation Literature. Trans. Am. Fish. Soc. 109, 659–702. doi:10.1577/1548-8659(1980)109<659:arodgs>2.0.co;2
Whitman, W. G. (1923). A Preliminary Experimental Confirmation of the Two-Film Theory of Gas Absorption. Chem. Mater. Eng. 29 (4), 146–148. doi:10.1016/0017-9310(62)90032-7
Witt, A., Magee, T., Stewart, K., Hadjerioua, B., Neumann, D., Zagona, E., et al. (2017). Development and Implementation of an Optimization Model for Hydropower and Total Dissolved Gas in the Mid-Columbia River System. J. Water Resour. Plan. Manage. 143 (10), 04017063 04017061–04017063 04017015. doi:10.1061/(asce)wr.1943-5452.0000827
Yuan, Y., Yuan, Q., Wang, Y., An, R., and Li, K. (2017). Acute and Chronic Lethality of Total Dissolved Gas Supersaturated Water on Leptobotia Elongata. Adv. Eng. Sci. 49, 56–61. doi:10.15961/j.jsuese.201600739
Nomenclature
V Volume of the stilling phase (m3)
Qs Spilling flow rate (m3/s) Spilling flow rate (m3/s)
kLab Mass transfer rate coefficients for the bubble (s−1)
kSas Mass transfer rate coefficients for the water surfaces(s−1)
C Actual water TDG saturation (%)
Cs* Saturation concentration of TDG in water at local atmospheric pressure (%)
CD TDG saturation of the outflow (%)
CU TDG saturation of the inflow (%)
Cs TDG saturation of the flow in the stilling phase(%)
Cp Power flow, respectively (%)
CM Measured TDG saturation levels (%)
CPMAX Maximum predicted TDG saturation levels (%)
CMMAX Maximum measured TDG saturation levels (%)
g Acceleration due to gravity (m2/s)
h Water depth of the stilling phase (m)
hk Water depth in the stilling phase (m)
i Time step
ka Mass transfer coefficient (s−1)
l Length of the stilling phase (m)
l0 Horizontal distance between the downstream toe of the dam and the impact point of the jet (m)
N Number of values
P0 Local atmospheric pressure (m)
Qs Spilling flow rate (m3/s) Spilling flow rate (m3/s)
Qp Power flow rate (m3/s)
Tr Residence time of the water in the stilling phase (s)
tR Retention time of aerated water in the stilling phase (s)
ρ Density (kg/m3)
η Dynamic viscosity (Pa·s)
ν Kinematic viscosity (m2/s)
ΔP Average pressure in the stilling phase (m)
Keywords: super-saturation, generation, predictive model, total dissolved gas, the residence time of the water in the stilling phase
Citation: Peng Y, Lin Y, Zeng C, Zha W, Mao F, Chen Q, Mo K and Yao S (2022) Improved Model for Predicting Total Dissolved Gas Generation With the Residence Time of the Water in the Stilling Phase. Front. Environ. Sci. 9:770187. doi: 10.3389/fenvs.2021.770187
Received: 03 September 2021; Accepted: 08 December 2021;
Published: 04 January 2022.
Edited by:
Taylor Maavara, Yale University, United StatesReviewed by:
Jeyaraj Antony Johnson, Wildlife Institute of India, IndiaSiddharth Chatterjee, SUNY College of Environmental Science and Forestry, United States
Copyright © 2022 Peng, Lin, Zeng, Zha, Mao, Chen, Mo and Yao. This is an open-access article distributed under the terms of the Creative Commons Attribution License (CC BY). The use, distribution or reproduction in other forums is permitted, provided the original author(s) and the copyright owner(s) are credited and that the original publication in this journal is cited, in accordance with accepted academic practice. No use, distribution or reproduction is permitted which does not comply with these terms.
*Correspondence: Qiuwen Chen, cXdjaGVuQG5ocmkuY24=
†These authors have contributed equally to this work and share first authorship
 Yiyun Peng
 Yuqing Lin1
 Qiuwen Chen