 Bosi Sheng1
 Haolin Wang1
 Wenbin Sun1Haiyan Li2Liya Chao1
 Jiayi Cheng1Gangzhen Qian3
 Boyin Huang4
 Qingxiang Li1*†
- 1Key Laboratory of Tropical Atmosphere-Ocean System, School of Atmospheric Sciences, Sun Yat-sen University, Ministry of Education, Zhuhai, China
- 2College of Science, China Agricultural University, Beijing, China
- 3Industrial Engineering and Operations Research, College of Engineering, University of California, Berkeley, Berkeley, CA, United States
- 4National Centers for Environmental Information, NOAA, Asheville, NC, United States
Based on the newly released China Merged Surface Temperature (China-MST) dataset, we diagnose the leading mode of covariation between surface temperature and the summer precipitation in Eastern China (EC). A possible connection between the surface temperature in East Asia and EC summer precipitation since the last century (1901–2016) is analyzed. Results indicate that there exists a remarkable meridional dipole pattern of surface temperature, defined as the meridional temperature difference index (MTDI). Meanwhile, there is a tripolar pattern of summer precipitation, which coincides with the first principal component of summer precipitation in EC. Further analyses show that when the MTDI is high in summer, an anomalous anticyclonic/cyclonic circulation is in East Asia’s mid/low latitude. The water vapor is down in the Yangtze and Huaihe River basins, and the ascending motion is weak, resulting in reduced precipitation over this region. At the same time, more water vapor and intensified ascending motion in North and South China tend to produce more summer precipitation. The opposite situations are found when the MTDI is low. Moreover, the MTDI closely relates with the Pacific Decadal Oscillation and the Atlantic Multidecadal Oscillation at interdecadal and multi-decadal scales. These results have been substantiated in the application of information flow analysis, a recently developed method in physics for the inference of causality between dynamical events.
Introduction
As China’s north, south, east, and west regions span more extensive, complex terrain, climate diversity. As a result, the distribution of annual precipitation is not uniform, with significant temporal and regional characteristics. In terms of time and region, the rainfall is mainly concentrated in Eastern China (EC) in summer, and the precipitation is relatively large. It can cause all kinds of disasters, such as floods, landslides, and droughts (Kwon et al., 2007; Ding et al., 2008; Liu et al., 2012). Previous studies showed two dominant meridional modes of summer precipitation in EC during 1951–2004. One is the meridional tripolar pattern, with more precipitation over the middle and lower reaches of the Yangtze River but less precipitation over South and North China, and the other is the meridional dipole pattern, which is usually referred to as the “southern flooding and northern drought” pattern (Ding et al., 2008; Huang et al., 2011; Zheng et al., 2016).
Temperature and precipitation are the two most essential elements to characterize climate anomalies. Domestic and international studies on the relationship between temperature and precipitation are divided into two main categories. The first category focuses on the characteristics and effects of temperature and precipitation variability, which indirectly reveals their relationship. The studies range from global (Schultz and Halpert, 1993; Sun et al., 2014), European (Beniston and Tol, 1998), Mediterranean (Erol and Randhir, 2012), to China (Huang et al., 2019; Cao et al., 2020) and northwest China (Shi et al., 2007). The results show that temperature and precipitation have been predominantly increasing on a larger global scale since the second half of the 20th century (Sun et al., 2014). In some areas, the temperature is increasing, but precipitation is decreasing, which causes problems such as increasing total drought area (Zhang et al., 2010; Huang et al., 2019) and decreasing potential productivity of climate (Cao et al., 2020). The second category starts directly from the relationship between temperature and precipitation. The study area covers global, Central Asia (Zhang et al., 2010; Huang et al., 2019), southwestern Australia, China (Yang et al., 2006). The relationship was also classified as warm-dry, warm-wet, cold-dry, cold-wet, consistent change, and antisymmetric change. The results show that the global and Central Asian climates show warm-wet changes (Dilinuer and Li, 2018). The overall trend in southwestern Australia is warm and dry (Hallett C. S. et al., 2018). For the arid and semi-arid regions of China, there is a warm-wet trend in the last decade (Wang et al., 2016). The climates of Xinjiang (Yao et al., 2018), Qinghai (Han et al., 2017) transitioned from warm-dry, cold-dry to warm-wet, respectively. As for EC, scholars generally agree that the temperature and precipitation fields have significant antisymmetric changes, which are most significant in the middle and lower reaches of the Yangtze River and southern China (Zheng et al., 2019). However, due to the lack of data, such as short time records or sparse spatial coverage, most above studies have only analyzed the anomalies after the 1950s or 1960s. The relationship between temperature and precipitation before the 1950s has rarely been analyzed, it is not clear whether the relationship between temperature and precipitation in eastern China has changed or has been stable from before the 1950s to the present. Therefore, this study uses newly developed global surface temperature data to focus on the synergistic relationship between temperature and precipitation in eastern China on a centennial scale.
The remainder of the paper is arranged as follows: Data and Methods introduces the data and analysis methods used in this study. In The Definition of Meridional Temperature Difference Index and its Multi-Scale Variations, the meridional temperature difference index (MTDI) over East Asia is defined by PCA and SVD analysis. Multi-scale variation characteristics of MTDI were studied using EEMD method. In The Inter-Annual Correlation and its Physical Mechanism, the relationship between MTDI and EC summer precipitation and its possible physical mechanism are studied by composite analysis. The Correlation in Interdecadal and Above Scales and the Causal Inference discusses the phase relationship between the MTDI, summer precipitation, and climate indices on the interdecadal and multi-decadal scales. The causal relationship between MTDI and climate index is analyzed by information flow. Finally, the summary is presented in Conclusion.
Data and Methods
Data
The surface temperature data is derived from the China Merged Surface Temperature (China-MST) dataset from 1901 to 2016 (Yun et al., 2019). This dataset [the current version is China-MST-Interim (Sun et al., 2021)] is based on a merge of surface air temperature data from China-Land Surface Air Temperature (C-LSAT) (Xu et al., 2018) and SST data from Extended Reconstructed Sea Surface Temperature version 5 (ERSST.v5) (Huang et al., 2017) released by the National Oceanic and Atmospheric Administration/National Centers for Environmental Information (NOAA/NCEI). Compared with the existing similar datasets (Gulev et al., 2021), China-MST has the same accuracy and a similar global surface temperature change trend (Li Q. et al., 2020). Besides, China-MST has certain advantages in trend detection in the last 2 decades (Li et al., 2021). Due to the low resolution of the land surface temperature data (5 ° × 5 °), the Thin Plate Spline method (Hutchinson, 1991) has been used in the early stage to interpolate the data to a resolution of 0.5° × 0.5°. The comparative evaluation shows that the interpolation reflects well trend characteristics of temperature change at a higher resolution (Cheng et al., 2020).
The precipitation data is obtained from the global terrestrial rainfall dataset developed by the Global Precipitation Climatology Centre (GPCC) (Becker et al., 2013). This paper uses the full_data_Monthly_v2018 from GPCC, a monthly precipitation dataset with a spatial resolution of 0.5° × 0.5° and a time range of 1901–2016 (June, July, and August; JJA).
The circulation data are from the Fifth Generation of ECMWF Atmospheric Reanalysis of the global climate (ERA5) (Hersbach et al., 2020). The spatial resolution of ERA5 is 0.25° × 0.25°, and the time range is 1950–2016 (JJA). We use monthly averaged 500 and 850 hPa pressure level data, including zonal winds, meridional winds, geopotential heights, specific humidity.
The Pacific Decadal Oscillation (PDO) index is defined as the leading principal component of detrended monthly SST anomalies in the North Pacific Ocean. Details of this index can be found in Zhang et al. (1997) and Mantua et al. (1997). The Atlantic Multidecadal Oscillation (AMO) index for both observations and model simulations is defined as the area-weighted average of the SST (JJA) over the North Atlantic (0°−65°N, 0°−80°W), but the global mean SST is removed based on the suggestion of previous study (Trenberth and Shea, 2006). For the above monthly SST, ERSST.v5 (JJA) data is used in this paper.
Methods
Brief Introduction
We used the singular value decomposition (SVD) to analyze large-scale relationships between MTDI and summer precipitation in EC for the 116 years from 1901 to 2016. We first detrend the data before the SVD is applied to remove any effect that the trend may have on the results. For more details on the SVD and its application, please refer to Bretherton et al. (1992) and Wallace et al. (1992).
Ensemble Empirical Mode Decomposition (EEMD) is a noise-assisted signal processing method based on EMD (Wu and Huang, 2004; 2009). Wu and Huang (2009) used the uniform distribution of the white noise spectrum to add the decomposed signal to the white noise background with the consistent time-frequency spatial distribution. Therefore, the signals of different timescales can be automatically distributed to the appropriate reference scale, and the problem of end effect and modal aliasing in EMD can be resolved. The unique characteristics and capabilities of EEMD are very useful in the analysis of nonlinear and non-stationary time series, especially in climate change studies (Qin et al., 2012; Ji et al., 2014; Zhang et al., 2016; Qian et al., 2021). In this paper, EEMD method was used to decompose MTDI and the main modes of summer precipitation in EC into different time scales, and further study the relationship on different time scales.
Other statistical methods, like principal component analysis (PCA) (Lorenz, 1956; North et al., 1982), correlation analysis, composite analysis, and Information flow analysis (Liang, 2016) are also adopted in this paper, and the significance test uses the student’s t-test. To obtain the interdecadal scale and multi-decadal scale components of meteorological elements, we use the Lanczos low-pass filter method (Duchon, 1979). Linear trends are removed first from all the data.
Information Flow
Usually, we use time-lagged correlation analysis to determine the causal relationship between two-time series. However, it is well known that correlation does not carry the needed directedness or asymmetry and hence does not necessarily imply causality. In the last decade, it has been realized that causality is essentially rooted in information flow, a truly physical concept that can be formulated rigorously from first principles (Liang, 2016). This formula has been applied successfully to the investigation of many real-world problems in a variety of disciplines such as neuroscience, finance, atmosphere-ocean science, etc. For series
Where
The Definition of Meridional Temperature Difference Index and its Multi-Scale Variations
The SVD of Surface Air Temperature With Summer Precipitation in Eastern China
Figure 1 shows the first PCA mode of summer precipitation in EC from 1901 to 2016, with a variance contribution of 17.37%. It shows that the spatial pattern of the first mode shows a +−+ distribution pattern from north to south in EC, with positive/negative/positive extreme centers in the North China, Yangtze and Huaihe River basins, and South China, respectively. The corresponding time coefficients show significant interannual variability, while there are apparent interdecadal variations.
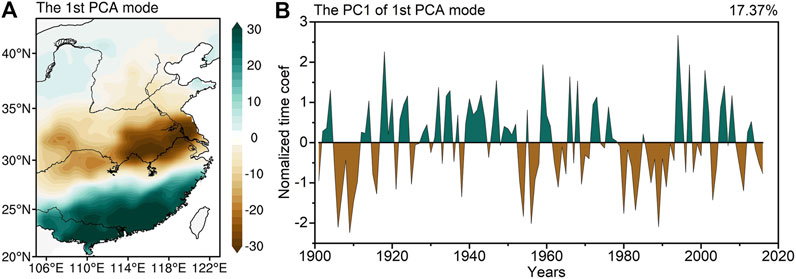
FIGURE 1. (A) The first PCA mode and (B) principal components of the first (PC1) of the JJA precipitation of 1901–2016 in EC. The percentage of total variance explained by the mode is 17.37%.
In the SVD analysis, the left field is the normalized surface temperature anomalies, and the right field is the normalized summer precipitation anomalies in EC (Figure 2). Results show that the first pair of SVD modes explains 41.13% of the total covariance. It is significantly larger than and separated from other SVD modes. Thereby, analyses will be focused on the first pair of SVD modes in the following sections. As shown in Figure 2A, the first SVD pattern of the surface temperature in East Asia shows a clear meridional dipole pattern, and the accompanying synoptic precipitation field shows a tripolar distribution (Figure 2C). The correlation coefficient (CC) between the time series of China-MST (Figure 2B) and GPCC (Figure 2D) is 0.66, which is significant at the 99% confidence level, suggesting that the meridional temperature dipole pattern is closely associated with the summer precipitation in EC. When the meridional temperature dipole pattern is in a positive phase with above-normal temperature in the north and below-normal temperature in the south, summer precipitation tends to be abundant in South and North China and deficient in the Yangtze and Huaihe River basins.
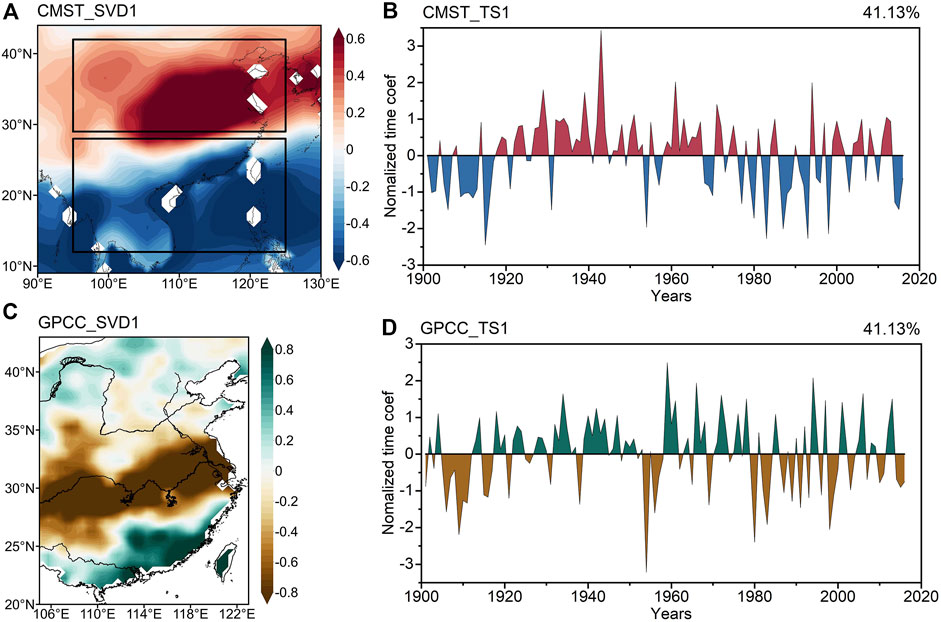
FIGURE 2. First leading modes of SVD for (A) JJA precipitation in EC, (C) summer surface temperature for the period of 1901–2016, and normalized time series of first SVD modes (B, D). The percentage of total variance explained by the mode is 41.13%.
To further confirm the SVD results, we define the normalized time series of temperature anomaly differences between north (East-central China) and south (South China, Southeast Asia and the neighboring marine areas) as MTDI (denoted by above and below black rectangle boxes in Figure 2A). The CC between the MTDI (Figure 3A) and China-MST_TS1 (Figure 2B) is 0.95, which is significant at the 99% confidence level, indicating that the meridional temperature dipole pattern is robust in observational temperature data. Meanwhile, the CC between the PC1 (Figure 1B) of the JJA precipitation in EC and the GPCC_TS1 (Figure 2D) is 0.85 (significant at the 99% confidence level). Moreover, the MTDI and GPCC PC1 are significantly correlated with the CC of 0.58. Hereafter, these two indices are used for further analyses.
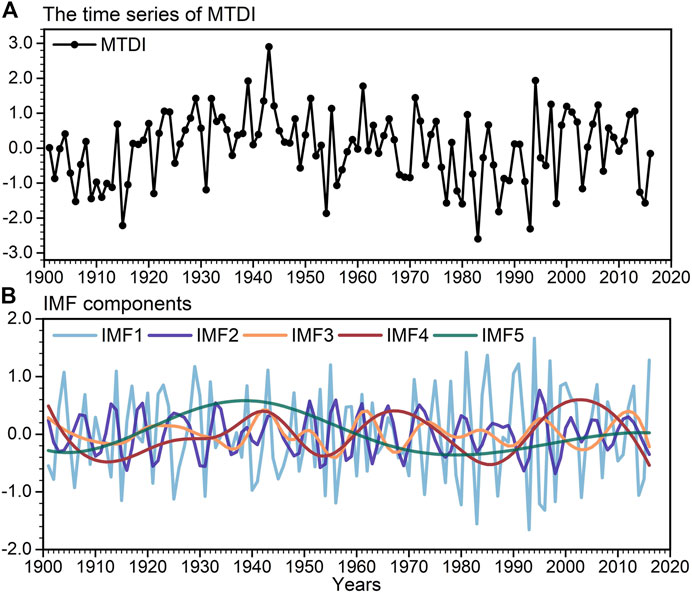
FIGURE 3. (A) Time series of Meridional temperature difference index (MTDI) for 1901–2016. (B) IMF components of the MTDI during 1901–2016 based on EEMD decomposition.
EEMD of Meridional Temperature Difference Index and its Variations
To further study the variation of MTDI, the EEMD method is used to analyze the MTDI characteristics in multiple timescales (Figure 3). Figure 3B shows that components from IMF1 to IMF5 contain high to low-frequency signals. The summer MTDI varies at multiple timescales in the past 116 years. To quantify the timescale and its contribution of each IMF, we calculated the average period of each IMF component and the variance contribution rate between each IMF and the original time series (Table 1). The MTDI in summer has three types of variations: 1) The interannual variation is represented by IMF1 and IMF2. The IMF1 has an average period of 2–3 years and the most significant variance contribution rate (62%). Its amplitude is stable in most years, passing the significance test at the level of 95% (Figure 4). The second IMF2 has an average period of 5–6 years and a variance contribution rate of 12%. Therefore, we can conclude that MTDI mainly exists an interannual variation of quasi 2–3 years (IMF1). 2) The interdecadal variation is represented by IMF3 and IMF4. IMF3 and IM4 have an average period of quasi 13 and 36 years, and their variance contribution rates are 4 and 11%, respectively. The quasi 36 years cycle of IMF4 characterization passed the significance test at the level of 95%. Therefore, MTDI mainly exists an interdecadal variation of quasi 36 years (IMF4). 3) The multi-decadal variability is represented by IMF5. IMF5 represents a multi-decadal change cycle with an average period of quasi 72 years, passing the significance under 95% reliability, and its variance contribution rate reaches 10%. Therefore, MTDI mainly exists a multi-decadal variation of quasi 72 years (IMF5).
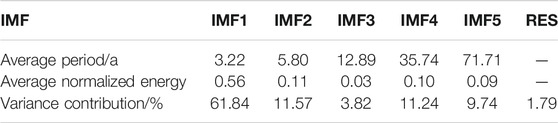
TABLE 1. Mean cycle, average normalized energy, and variance contribution rates of IMF components of MTDI for 1901–2016 based on EEMD decomposition.
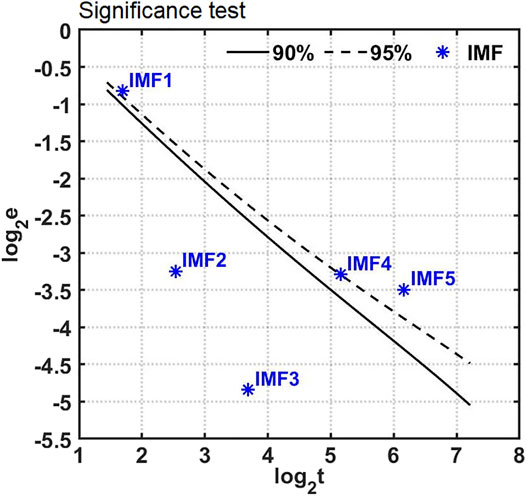
FIGURE 4. The significance test of IMF components of the MTDI during 1901–2016 based on EEMD decomposition (e and t are normalized power spectral energy and average period, respectively).
The Inter-Annual Correlation and its Physical Mechanism
Previous studies have demonstrated that the variation of precipitation is always accompanied by atmospheric circulation variability (Zhu et al., 2011; Xu et al., 2015). Therefore, this section focuses on the characteristics of changes in the corresponding circulation field when MTDI changes to investigate the possible physical mechanisms linking MTDI and summer precipitation in EC. In this study, 10 high anomaly years (1951, 1955, 1961, 1971, 1994, 1997, 2000, 2001, 2006, and 2013) and low anomaly years (1954, 1977, 1979, 1980, 1983, 1987, 1993, 1998, 2014, and 2015) of the MTDI were extracted. Figures 5, 6 show the composites of the anomalous geopotential height (500 hPa), wind field (850 hPa), water vapor flux and moisture flux divergence (500 hPa).
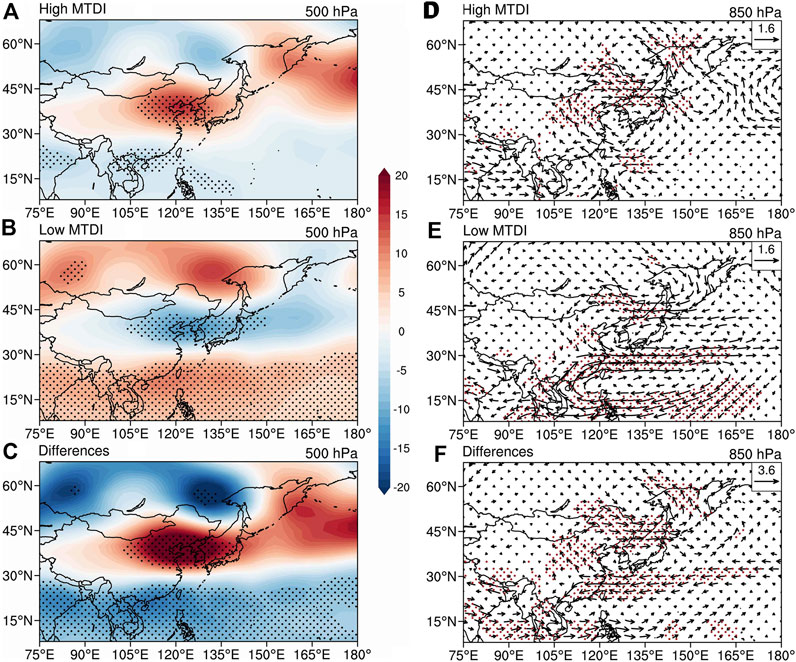
FIGURE 5. Composites of JJA geopotential height anomalies (shading; gpm) at 500 hPa levels in (A) high MTDI years, (B) low MTDI years and (C) their differences during 1950–2016. Composites of JJA wind anomalies (vector; m s−1) at 850 hPa levels in (D) high MTDI years, (E) low MTDI years and (F) their differences during 1950–2016 (The letter A stands for anticyclone and C stands for cyclone). The dotted area refers to the place where the student’s t-test exceeds the 95% significance level.
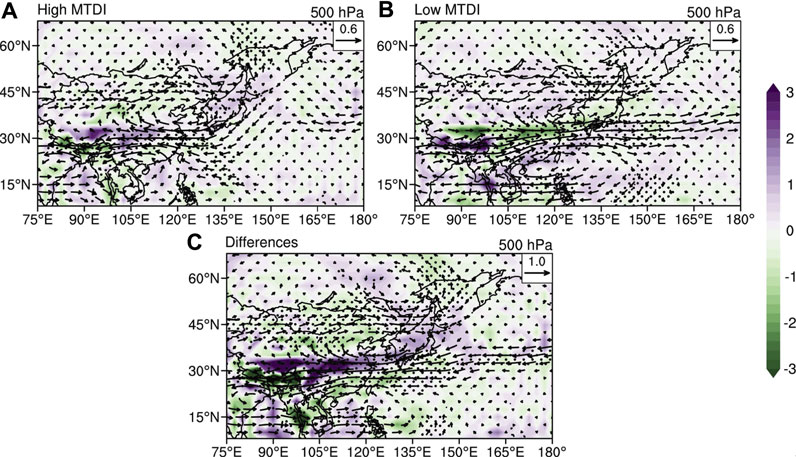
FIGURE 6. Composites of JJA water vapor flux (vector; kg m−1 s−1 hpa−1) and moisture flux divergence (shading; 10–6 kg m−2 s−1 hpa−1) at 500 hPa levels in (A) high MTDI years, (B) low MTDI years and (C) their differences during 1950–2016. The dotted area refers to the place where the student’s t-test exceeds the 95% significance level.
In the high MTDI years, the anomalies from low latitudes to high latitudes constitute a tripolar pattern of negative/positive/negative geopotential height in the middle troposphere (Figure 5A). Negative or low geopotential anomalies are found in the South China Sea, the Philippines, and the Sea of Okhotsk. The anomalies of the atmospheric circulation must adapt to the anomalous geopotential heights. The spatial pattern of anomalous circulation from the south to the north of East Asia, that is, two anomalous anticyclones appear in the northwestern Pacific. The anticyclone near 45°N and 180°W is more robust, and the anticyclone (35°N, 125°E) southwest of Japan relatively weak. Additionally, there is an anomalous cyclone (25°N, 120°E) center over the South China Sea (Figure 5D). They are corresponding to positive and negative anomalies of geopotential height in Figure 5A. Therefore, the anomalous northeasterly winds from the western Pacific prevail in South China, controlled by the anomalous cyclone. In North China, the anomalous southeasterly winds (30–45°N, 120°E) from the western Pacific are relatively strong, which is favorable to bring warm and abundant water vapor to North China. The distribution of 500 hPa water vapor flux and moisture flux divergence will be discussed to further reveal the water vapor transport (Figure 6A). There is a significant water vapor flux from the south in EC north of 30°N, which means that water vapor from the Bay of Bengal, and the South China Sea and the Northwest Pacific can be transported to North China all the time in summer. And most of North China and South China have negative moisture flux divergence, indicating that there is water vapor convergence here, leading to increased precipitation. The positive moisture flux divergence in the Yangtze and Huaihe River basins shows water vapor divergence in this area, leading to less precipitation and drought. In the low MTDI years, the circulation situation is opposite.
The difference figure shows that the tripolar pattern is more significant (Figure 5C). Positive and negative geopotential heights correspond to obvious anticyclone and cyclone (Figure 5F). All levels of these anomalies were statistically significant with 95% confidence. This distribution pattern is similar to the East Asia/Pacific (EAP) teleconnection pattern pointed out by Huang and Sun (1992). The EAP teleconnection pattern is a vital circulation pattern affecting summer droughts and floods in the Jianghuai basin of China. Figure 6C indicates that the water vapor flux to the north of the Jianghuai basin in high MTDI years is more significant than those in low MTDI years. More water vapor is transported to North China in the high MTDI years than in the low MTDI years. Moreover, the intensity of moisture flux divergence in the Yangtze and Huaihe River basins is more vital than in the low MTDI years. In comparison, water vapor convergence in South and North China is more vital than in the low MTDI years. Therefore, in terms of water vapor transport, the water vapor in the Yangtze and Huaihe River basins is low and the ascending motion is weak in the high MTDI years, which is not conducive to precipitation. At the same time, South and North China have more water vapor and the ascending motion is strong, which is conducive to precipitation.
The Correlation in Interdecadal and Above Scales and the Causal Inference
The Phase Relationship Between MTDI, Summer Precipitation, and Climate Indices
To further investigate the relationship between MTDI and summer precipitation in EC at different time scales, we extracted interdecadal and multi-decadal components of GPCC PC1 using the EEMD method.
Figure 7 shows the CCs between MTDI and GPCC PC1, and between MTDI and PDO on the interdecadal scales. The CC between the variations of MTDI and GPCC PC1 is 0.70. MTDI is positively correlated (0.69) with the 15-years low-pass filtered PDO index from 1901 to 1960. That is, when the PDO is in positive phase, North China corresponds to the period of high temperature and heavy rainfall, while the Yangtze and Huaihe River basins correspond to the period of high temperature and little rainfall and drought, and South China correspond to the period of low temperature and heavy rainfall; and vice versa. However, it’s negatively correlated (−0.65) from 1961 to 2016, which is consistent with Ding et al. (2018). When the PDO is in positive phase, North China corresponds to low temperature and less rain, while the Yangtze and Huaihe River basins corresponds to low temperature and much rain, and South China corresponds to high temperature and little rain and drought period; and vice versa. Besides, the CC is 0.84 between the variations of MTDI and GPCC PC1 on the multi-decadal scales, and 0.97 between MTDI and the 40-years low-pass filtered AMO index (Figure 8). That is, when the PDO is in positive phase, North China corresponds to the period of high temperature and heavy rainfall, while the Yangtze and Huaihe River basins corresponds to the period of high temperature and little rainfall and drought, and South China corresponds to the period of low temperature and heavy rainfall; and vice versa. All pass the 99% significance test.
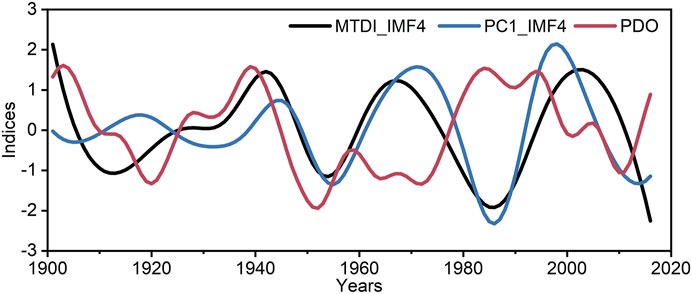
FIGURE 7. Time series of MTDI, GPCC PC1 and the 15-years low-pass filtered PDO index in the interdecadal scales for 1901–2016.
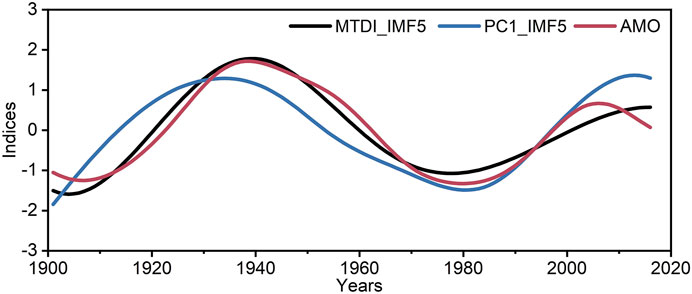
FIGURE 8. Time series of MTDI, GPCC PC1 and the 40-years low-pass filtered AMO index in the multi-decadal scales for 1901–2016.
The Causal Inference Between MTDI and Climate Indices
To further investigate the correlation and causal inference between climate indices and the meridional temperature difference in East Asia. In this paper, the two-way information transfer between the climate index and the meridional temperature difference in East Asia from 1901 to 2016 is calculated using the information flow method. The results are shown in Table 2. Where T1→2 represents the information transfer from climate indices to MTDI and T2→1 represents the information transfer from MTDI to climate indices.
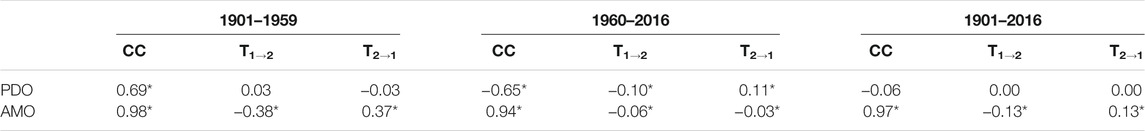
TABLE 2. Correlation coefficients and information flow between PDO and MTDI on the interdecadal scale and between AMO and MTDI on the multi-decadal scale (* Represents passing the significance test with a 95% confidence level).
On the interdecadal scale, PDO and MTDI have a two-way causal relationship from 1901 to 1959, although this causal relationship is asymmetric. In particular, the PDO phenomenon does not stabilize MTDI, while MTDI makes the PDO phenomenon less uncertain. In other words, for PDO, MTDI is the source of uncertainty, and the causality of MTDI on PDO is expressed as the propagation of uncertainty from the former to the latter. However, it did not pass the 95% significance test. PDO and MTDI had opposite effects in 1960–2016 and passed the 95% significance test. On the multi-decadal scale, the MTDI phenomenon does not stabilize AMO, while AMO makes the MTDI phenomenon less uncertain. In other words, for MTDI, AMO is the source of uncertainty, and the causality of AMO on MTDI is expressed as the propagation of uncertainty from the former to the latter. All pass the 95% significance test. In this paper, the causal relationship is found through statistical methods, and the influencing mechanism will be studied in the future.
Conclusion
Based on the newly released China-MST, we diagnose the leading mode of covariation between surface temperature and the summer precipitation in EC. A possible connection between the surface temperature in East Asia and EC summer precipitation during 1901–2016 is analyzed. Results indicate that there exists a remarkable meridional dipole pattern of surface temperature, defined as the MTDI. The multi-time scale analysis shows that MTDI has significant quasi 2–3°years, quasi 36°years, and quasi 72°years change cycles.
Firstly, the spatial pattern of the CCs between MTDI and summer precipitation is similar to the first PCA mode of the summer precipitation in EC, indicating that MTDI is an important indicator reflecting the change of summer precipitation in EC. Secondly, the CC between the MTDI and the PC1 is significant at the 99% level. The composite analysis shows that when MTDI is high, precipitation is higher than average in most of South China and North China and lower than average in the Yangtze River and Huaihe River Basins. When MTDI is low, precipitation is higher than average in the Yangtze River and Huaihe River Basins and lower than average in most of South and North China. In the high MTDI years, there are anticyclone anomalies in Japan and cyclonic anomalies in the South China Sea and the western Pacific. The WPSH position is eastward, and the southerly wind is strong in EC, which is conducive to water vapor transport to the north of China. The water vapor in the Yangtze and Huaihe River basins is low, and the upward movement of airflow is weak, resulting in low precipitation. In South China and North China, there is more water vapor and stronger upward airflow, resulting in more precipitation. In the low MTDI years, the circulation distribution pattern is the opposite. The water vapor in South China and North China is low, and the upward movement of airflow is weak, resulting in low precipitation. In the Yangtze and Huaihe River basins, there is more water vapor and stronger upward airflow, resulting in more precipitation.
On the interdecadal and multi-decadal scales, MTDI and PC1 have significant correlations with climate mode indices such as the PDO index and AMO index. There is a clear bidirectional information transfer between MTDI and PDO or between MTDI and AMO, indicating that they are mutually important influencing factors. In fact, there have been some studies on the changes of PDO in the context of global warming (Li S. et al., 2020), they conclude that it is less predictable under the greenhouse warming. Different from the PDO, MTDI proposed in this paper always has a stable positive relationship with main modes of summer precipitation in EC during all the period of 1901–2016. while the correlation between the PDO and the precipitation has a reversal around the middle of the 20th century. Therefore, it is of great significance to study the variation of a meridional temperature gradient to understand and predict the interdecadal variation of precipitation in EC.
Data Availability Statement
The raw data supporting the conclusion of this article will be made available by the authors, without undue reservation.
Author Contributions
QL designed the study, contributed to the idea, and revised manuscript writing. BS and HW contributed to the data analysis and manuscript writing. WS, HL, LC, JC, and GQ contributed to the data analysis. BH contributed to the manuscript review.
Funding
This study is supported by the National Key R&D Program of China (Grant: 2017YFC1502301; 2018YFC1507705) and the Natural Science Foundation of China (Grant: 41975105).
Conflict of Interest
The authors declare that the research was conducted in the absence of any commercial or financial relationships that could be construed as a potential conflict of interest.
Publisher’s Note
All claims expressed in this article are solely those of the authors and do not necessarily represent those of their affiliated organizations, or those of the publisher, the editors and the reviewers. Any product that may be evaluated in this article, or claim that may be made by its manufacturer, is not guaranteed or endorsed by the publisher.
Acknowledgments
The authors thank the editor and reviewers for their constructive suggestions/comments in the initial reviews.
References
Becker, A., Finger, P., Meyer-Christoffer, A., Rudolf, B., Schamm, K., Schneider, U., et al. (2013). A Description of the Global Land-Surface Precipitation Data Products of the Global Precipitation Climatology Centre with Sample Applications Including Centennial (Trend) Analysis from 1901-present. Earth Syst. Sci. Data 5 (1), 71–99. doi:10.5194/essd-5-71-2013
Beniston, M., and Tol, R. S. J. (1998). The Potential Impacts of Climate Change on Europe. Energ. Environ. 9, 365–381. doi:10.1177/0958305X9800900403
Bretherton, C. S., Smith, C., and Wallace, J. M. (1992). An Intercomparison of Methods for Finding Coupled Patterns in Climate Data. J. Clim. 5, 541–560. doi:10.1175/1520-0442(1992)005<0541:aiomff>2.0.co;2
Cao, D., Zhang, J.-H., Yan, H., Xun, L., Yang, S., Yun, B., et al. (2020). Regional Assessment of Climate Potential Productivity of Terrestrial Ecosystems and its Responses to Climate Change over China from 1980-2018. IEEE Access PP, 1. doi:10.1109/access.2019.2963458
Cheng, J., Li, Q., Chao, L., Maity, S., Huang, B., and Jones, P. (2020). Development of High Resolution and Homogenized Gridded Land Surface Air Temperature Data: A Case Study over Pan-East Asia. Front. Environ. Sci. 8, 588570. doi:10.3389/fenvs.2020.588570
Dilinuer, T., and Li, D. (2018). Characteristics of the Dry/wet Climate Change in Central Asia in Recent 115 Years. J. Arid Meteorology 36 (2), 185–195. doi:10.11755/j.issn.1006-7639(2018)-02-0185
Ding, Y., Si, D., and Liu, Y. (2018). On the Characteristics, Driving Forces and Inter-decadal Variability of the East Asian Summer Monsoon. Chin. J. Atmos. Sci. (in Chinese) 42 (3), 533–558. doi:10.3878/j.issn.1006-9895.1712.17261
Ding, Y., Wang, Z., and Sun, Y. (2008). Inter‐decadal Variation of the Summer Precipitation in East China and its Association with Decreasing Asian Summer monsoon.Part I: Observed Evidences. Int. J. Climatol. 28 (9), 1139–1161. doi:10.1002/joc.1615
Duchon, C. E. (1979). Lanczos Filtering in One and Two Dimensions. J. Appl. Meteorol. 18 (8), 1016–1022. doi:10.1175/1520-0450(1979)018<1016:lfioat>2.0.co;2
Erol, A., and Randhir, T. (2012). Climatic Change Impacts on the Ecohydrology of Mediterranean Watersheds. Climatic Change 114. doi:10.1007/s10584-012-0406-8
Gulev, S. K., Thorne, P. W., Ahn, F. J. D., Domingues, C. M., Gerland, S., Gong, D., et al. (2021). "Changing State of the Climate System", In: Climate Change 2021: The Physical Science Basis. Contribution of Working Group I to the Sixth Assessment Report of the Intergovernmental Panel on Climate Change. (eds.) V. MassonDelmotte, P. Zhai, A. Pirani, S. L. Connors, C. Péan, S. Bergeret al. (Cambridge University Press).
Hallett, C. S., Hobday, A. J., Tweedley, J. R., Thompson, P. A., McMahon, K., and Valesini, F. J. (2018). Observed and Predicted Impacts of Climate Change on the Estuaries of South-Western Australia, a Mediterranean Climate Region. Reg. Environ. Change 18 (5), 1357–1373. doi:10.1007/s10113-017-1264-8
Han, H., Ma, M., and Ma, S. (2017). Vegetation Change and its Driving Climatic Factors in Qinghai Province in Recent 30 Years. Arid Zone Res. 34 (5), 1164–1174. doi:10.13866/j.azr.2017.05.27
Hersbach, H., Bell, B., Berrisford, P., Hirahara, S., Horányi, A., Muñoz‐Sabater, J., et al. (2020). The ERA5 Global Reanalysis. Q.J.R. Meteorol. Soc. 146 (730), 1999–2049. doi:10.1002/qj.3803
Huang, B., Thorne, P. W., Banzon, V. F., Boyer, T., Chepurin, G., Lawrimore, J. H., et al. (2017). Extended Reconstructed Sea Surface Temperature, Version 5 (ERSSTv5): Upgrades, Validations, and Intercomparisons. J. Clim. 30 (20), 8179–8205. doi:10.1175/JCLI-D-16-0836.1
Huang, J., Ma, J., Guan, X., Li, Y., and He, Y. (2019). Progress in Semi-arid Climate Change Studies in China. Adv. Atmos. Sci. 36, 922–937. doi:10.1007/s00376-018-8200-9
Huang, R. H., Jilong, C., and Yong, L. (2011). Interdecadal Variation of the Leading Modes of Summertime Precipitation Anomalies over Eastern China and its Association with Water Vapor Transport over East Asia. Chin. J. Atmos. Sci. 35, 589–606. doi:10.3878/j.issn.1006-9895.2011.04.01
Huang, R., and Sun, F. (1992). Impacts of the Tropical Western Pacific on the East Asian Summer Monsoon. J. Meteorol. Soc. Jpn. 70 (1B), 243–256. doi:10.2151/jmsj1965.70.1b_243
Hutchinson, M. F. (1991). The Application of Thin Plate Smoothing Splines to Continent-wide Data Assimilation. Bur. Meteorology Res. Rep. 27, 104–113.
Ji, F., Wu, Z., Huang, J., and Chassignet, E. P. (2014). Evolution of Land Surface Air Temperature Trend. Nat. Clim Change 4 (6), 462–466. doi:10.1038/nclimate2223
Kwon, M., Jhun, J.-G., and Ha, K.-J. (2007). Decadal Change in East Asian Summer Monsoon Circulation in the Mid-1990s. Geophys. Res. Lett. 34 (21), L21706. doi:10.1029/2007GL031977
Li, Q., Sun, W., Huang, B., Dong, W., Wang, X., Zhai, P., et al. (2020a). Consistency of Global Warming Trends Strengthened since 1880s. Sci. Bull. 65 (20), 1709–1712. doi:10.1016/j.scib.2020.06.009
Li, Q., Sun, W., Yun, X., Huang, B., Dong, W., Wang, X. L., et al. (2021). An Updated Evaluation of the Global Mean Land Surface Air Temperature and Surface Temperature Trends Based on CLSAT and CMST. Clim. Dyn. 56, 635–650. doi:10.1007/s00382-020-05502-0
Li, S., Wu, L., Yang, Y., Geng, T., Cai, W., Gan, B., et al. (2020b). The Pacific Decadal Oscillation Less Predictable under Greenhouse Warming. Nat. Clim. Chang. 10 (1), 30–34. doi:10.1038/s41558-019-0663-x
Liang, X. S. (2016). Information Flow and Causality as Rigorous Notions Ab Initio. Phys. Rev. E 94, 052201. doi:10.1103/PhysRevE.94.052201
Liang, X. S. (2014). Unraveling the Cause-Effect Relation between Time Series. Phys. Rev. E Stat. Nonlin Soft Matter Phys. 90, 052150. doi:10.1103/PhysRevE.90.052150
Liu, J., Li, B., Zhou, T., Zeng, X., and Feng, L. (2012). The Extreme Summer Precipitation over East China during 1982-2007 Simulated by the LASG/IAP Regional Climate Model. Atmos. Oceanic Sci. Lett. 5 (1), 62–67. doi:10.1080/16742834.2012.11446966
Lorenz, E. (1956). Empirical Orthogonal Functions and Statistical Weather Prediction. Stat. Forecast. 1. doi:10.1134/S1028334X06060377
Mantua, N. J., Hare, S. R., Zhang, Y., Wallace, J. M., and Francis, R. C. (1997). A Pacific Interdecadal Climate Oscillation with Impacts on Salmon Production. Bull. Amer. Meteorol. Soc. 78 (6), 1069–1079. doi:10.1175/1520-0477(1997)078<1069:apicow>2.0.co;2
North, G., Bell, T., Cahalan, R., and Moeng, F. (1982). Sampling Errors in the Estimation of Empirical Orthogonal Functions. Monthly Weather Rev. 110 (7), 699–706. doi:10.1175/1520-0493(1982)110<0699:seiteo>2.0.co;2
Qian, G., Li, Q., Li, C., Li, H., Wang, X. L., Dong, W., et al. (2021). A Novel Statistical Decomposition of the Historical Change in Global Mean Surface Temperature. Environ. Res. Lett. 16 (5), 054057. doi:10.1088/1748-9326/abea34
Qin, Z., Zou, X., and Weng, F. (2012). Comparison between Linear and Nonlinear Trends in NOAA-15 AMSU-A Brightness Temperatures during 1998–2010. Clim. Dyn. 39 (7), 1763–1779. doi:10.1007/s00382-012-1296-1
Schultz, P. A., and Halpert, M. S. (1993). Global Correlation of Temperature, NDVI and Precipitation. Adv. Space Res. 13 (5), 277–280. doi:10.1016/0273-1177(93)90559-T
Shi, Y., Shen, Y., Kang, E., Li, D., Ding, Y., Zhang, G., et al. (2007). Recent and Future Climate Change in Northwest China. Climatic Change 80, 379–393. doi:10.1007/s10584-006-9121-7
Sun, Q., Kong, D., Miao, C., Duan, Q., Yang, T., Ye, A., et al. (2014). Variations in Global Temperature and Precipitation for the Period of 1948 to 2010. Environ. Monit. Assess. 186 (9), 5663–5679. doi:10.1007/s10661-014-3811-9
Sun, W., Li, Q., Huang, B., Cheng, J., Song, Z., Li, H., et al. (2021). The Assessment of Global Surface Temperature Change from 1850s: The C-LSAT2.0 Ensemble and the CMST-Interim Datasets. Adv. Atmos. Sci. 38 (5), 875–888. doi:10.1007/s00376-021-1012-3
Trenberth, K. E., and Shea, D. J. (2006). Atlantic Hurricanes and Natural Variability in 2005. Geophys. Res. Lett. 33 (12), L12704. doi:10.1029/2006GL026894
Wallace, J. M., Smith, C., and Bretherton, C. S. (1992). Singular Value Decomposition of Wintertime Sea Surface Temperature and 500-mb Height Anomalies. J. Clim. 5, 561–576. doi:10.1175/1520-0442(1992)005<0561:svdows>2.0.co;2
Wang, H., Liu, G., Li, Z., Ye, X., Wang, M., and Gong, L. (2016). Impacts of Climate Change on Net Primary Productivity in Arid and Semiarid Regions of China. Chin. Geogr. Sci. 26 (1), 35–47. doi:10.1007/s11769-015-0762-1
Wu, Z., and Huang, N. E. (2004). A Study of the Characteristics of white Noise Using the Empirical Mode Decomposition Method. Proc. R. Soc. Lond. A. 460 (2046), 1597–1611. doi:10.1098/rspa.2003.1221
Wu, Z., and Huang, N. E. (2009). Ensemble Empirical Mode Decomposition: a Noise-Assisted Data Analysis Method. Adv. Adapt. Data Anal. 01 (01), 1–41. doi:10.1142/S1793536909000047
Xu, W., Li, Q., Jones, P., Wang, X. L., Trewin, B., Yang, S., et al. (2018). A New Integrated and Homogenized Global Monthly Land Surface Air Temperature Dataset for the Period since 1900. Clim. Dyn. 50 (7), 2513–2536. doi:10.1007/s00382-017-3755-1
Xu, Z., Fan, K., and HuiJun, W. (2015). Decadal Variation of Summer Precipitation over China and Associated Atmospheric Circulation after the Late 1990s. J. Clim. 28, 150310071401001. doi:10.1175/JCLI-D-14-00464.1
Yang, M., Yao, T., Wang, H., and Gou, X. (2006). Correlation between Precipitation and Temperature Variations in the Past 300 Years Recorded in Guliya Ice Core, China. Ann. Glaciol. 43, 137–141. doi:10.3189/172756406781812384
Yao, J., Zhao, Y., and Yu, X. (2018). Spatial-temporal Variation and Impacts of Drought in Xinjiang (Northwest China) during 1961-2015. PeerJ 6, e4926. doi:10.7717/peerj.4926
Yun, X., Huang, B., Cheng, J., Xu, W., Qiao, S., and Li, Q. (2019). A New Merge of Global Surface Temperature Datasets since the Start of the 20th century. Earth Syst. Sci. Data 11 (4), 1629–1643. doi:10.5194/essd-11-1629-2019
Zhang Da-Quan, D. Q., Zhang Lu, L., Yang Jie, J., and Feng Guo-Lin, G. L. (2010). The Impact of Temperature and Precipitation Variation on Drought in China in Last 50 Years. wlxb 59, 655–663. doi:10.7498/aps.59.655
Zhang, Y., Wallace, J. M., and Battisti, D. S. (1997). ENSO-like Interdecadal Variability: 1900-93. J. Clim. 10 (5), 1004–1020. doi:10.1175/1520-0442(1997)010<1004:eliv>2.0.co;2
Zhang, Z. Y., Wong, M. S., and Nichol, J. (2016). Global Trends of Aerosol Optical Thickness Using the Ensemble Empirical Mode Decomposition Method. Int. J. Climatol. 36 (13), 4358–4372. doi:10.1002/joc.4637
Zheng, J., Li, L., Zheng, J., and Zheng, F. (2019). Joint EOF Analysis of Summer Precipitation and Temperature in Eastern China. Guangdong Meteorology 41 (2), 9–14. doi:10.3969/j.issn.1007-6190.2019.02.003
Zheng, J., Wu, M., Hao, Z., and Zhang, X. (2016). Spatial Pattern of Decadal Variation of Summer Precipitation in Eastern China: Comparison of Observation and CESM Control Simulation. Geographical Res. 35, 14–24. doi:10.11821/dlyj201601002
Keywords: meridional temperature difference index, summer precipitation, eastern China, ensemble empirical mode decomposition, information flow analysis
Citation: Sheng B, Wang H, Sun W, Li H, Chao L, Cheng J, Qian G, Huang B and Li Q (2021) Meridional Temperature Difference Over Pan-East Asia and its Relationship With Precipitation in Century Scales. Front. Environ. Sci. 9:769439. doi: 10.3389/fenvs.2021.769439
Received: 02 September 2021; Accepted: 18 October 2021;
Published: 28 October 2021.
Edited by:
Yang Gao, Ocean University of China, ChinaReviewed by:
Shixuan Zhang, Pacific Northwest National Laboratory (DOE), United StatesJiumeng Liu, Harbin Institute of Technology, China
Futing Wu, Hohai University, China
Copyright © 2021 Sheng, Wang, Sun, Li, Chao, Cheng, Qian, Huang and Li. This is an open-access article distributed under the terms of the Creative Commons Attribution License (CC BY). The use, distribution or reproduction in other forums is permitted, provided the original author(s) and the copyright owner(s) are credited and that the original publication in this journal is cited, in accordance with accepted academic practice. No use, distribution or reproduction is permitted which does not comply with these terms.
*Correspondence: Qingxiang Li, bGlxaW5neDVAbWFpbC5zeXN1LmVkdS5jbg==
†Qingxiang Li, Southern Marine Science and Engineering Guangdong Laboratory (Zhuhai), Zhuhai, China