 Yu Zhang
 Xiufeng Wu1*
 Shiqiang Wu
 Jiangyu Dai
 Lei Yu
 Wanyun Xue
- 1State Key Laboratory of Hydrology-Water Resources and Hydraulic Engineering, Nanjing Hydraulic Research Institute, Nanjing, China
- 2China Energy Investment Corporation Science and Technology Research Institute Co.,Ltd., Nanjing, China
Climate change and human activities are having increasing impacts on the global water cycle, particularly on streamflow. Current methods for quantifying these impacts are numerous and have their merits and limitations. There is a lack of a guide to help researchers select one or more appropriate methods for attribution analysis. In this study, hydrological modeling, statistical analysis, and conceptual approaches were used jointly to develop a methodological options framework consisting of three modules, to guide researchers in selecting appropriate methods and assessing climatic and anthropogenic contributions to streamflow changes. To evaluate its effectiveness, a case study in the Upper Yangtze River Basin (UYRB) of China was conducted. The results suggest that the SWAT-based method is the best approach to quantify the influences of climate change and human activities on streamflow in the UYRB. The comprehensive assessment indicates that climate change is the dominant cause of streamflow changes in the UYRB, and the contribution of climate change, indirect human activities, and direct human activities to streamflow changes is about 7:1:2. The proposed framework is efficient and valuable in assisting researchers to find appropriate methods for attribution analysis of streamflow changes, which can help to understand the water cycle in changing environments.
Introduction
Streamflow is one of the most important elements of the hydrological cycle and is key to understanding hydrological processes at various spatial and temporal scales under changing environments (Penny et al., 2020; Jiang et al., 2021; Porter et al., 2021; Wright et al., 2021). However, streamflow has been significantly altered by the combined effects of climate change and human activities (Liu et al., 2019; Yasarer et al., 2020; Zeng et al., 2021). Changes in two important climatic variables, precipitation, and potential evapotranspiration, jointly influence the spatial and temporal distribution patterns of water resources (Borgwardt et al., 2020). The sixth assessment report of the IPCC (Intergovernmental Panel on Climate Change) notes that global mean precipitation and evaporation increase with global warming (high confidence). This will undoubtedly accelerate the change in streamflow. Human activities, including land use/land cover changes, water consumption, urbanization, and dam construction, have also altered hydrological processes in many areas (Zhao et al., 2012; Jardim et al., 2020). It is worth noting that streamflow changes may have a significant impact on water use patterns in different sectors such as agriculture, domestic, industry, environment, and hydropower generation (Zhang et al., 2021b). Therefore, it is important to clarify streamflow changes and their drivers for water resources management under the changing environment.
The existing common methods used to quantitatively estimate the impacts of climate change and human activities on streamflow can be grouped into three categories: hydrological modeling, statistical analysis, and conceptual approaches (Wang, 2014; Dey and Mishra, 2017). The hydrological modeling method is based on various hydrological models, such as SWAT (Soil and Water Assessment Tool) model, GBHM (Geomorphology-Based Hydrological Model), and VIC (Variable Infiltration Capacity) model, to simulate the runoff process in a watershed and then analyze the influences of climate change and human activities on streamflow (Dey and Mishra, 2017; Hajihosseini et al., 2020). For instance, Zhang et al. (2021a) employed SWAT to evaluate the impacts of climate change and human activities on streamflow changes in the Upstream Yangtze River. The results showed that the main contributions to runoff change are 70% from climate change and 30% from human influence. However, the uncertainty introduced by the parameter estimations, structure, and input data of the model may lead to inaccurate results.
Statistical analysis methods are based on the observed streamflow and meteorological factors, and the contributions of meteorological factors to streamflow changes are calculated by statistical analysis, which requires a certain length of the observations series, and usually the longer the series, the better the results are obtained (Wang, 2014; Dey and Mishra, 2017). The common methods include multiple regression models and climate elasticity models, which have been widely applied in many case studies (Miao et al., 2011; Li et al., 2014). For instance, Zhang et al. (2020) used the simple linear regression method and sensitivity indicator method to separate impacts of climate variabilities and human activities on streamflow changes in a typical semi-arid basin (Guanting River Basin in China). Nevertheless, these methods have certain limitations. For example, multiple regression models cannot capture the nonlinear characteristics of streamflow changes, and climate elasticity models cannot quantify the effects of extreme hydroclimatic variability and human activities on streamflow changes.
The conceptual approaches mainly include those based on the Budyko framework and those based on the Tomer Schilling framework. The former uses estimated precipitation and potential evapotranspiration elasticity to assess the impact of climate change on streamflow changes, which has certain physical mechanisms, while the calculation is relatively simple and convenient, and is widely used (Li et al., 2020; Todhunter et al., 2020; Wang et al., 2020). For example, Liu et al. (2021) used the Budyko framework for attribution analysis of global runoff changes and found that other factors than precipitation and potential evaporation are the most significant drivers to global streamflow changes based on observed data. Tomer and Schilling (2009) proposed a conceptual approach that can distinguish the relative contributions of climate change and human activities to the streamflow changes based on a 25-years experiment in a small watershed, namely the Tomer Schilling framework. This method can only distinguish the relative contribution of climate change and human activities, and requires more data on precipitation and actual evapotranspiration (Wang, 2014). Also, Renner et al. (2012) noted that the method does not adhere to the water and energy limits. Thus, this method is not as widely used as the former.
As mentioned above, each method has its merits and limitations. Therefore, it is more valuable to combine and compare the results of multiple methods than a single method. At present, few studies have sorted out and integrated these methods and analyzed and identified the attribution of streamflow changes in the form of a framework. For instance, Wang (2014) compared currently-used methods to analyze the attribution of streamflow changes, assess assumptions and issues of the methods and provided a framework for gauged watersheds. However, the framework is limited to watersheds with negligible groundwater loss, and there is no application case. Also, Zhang et al. (2020) proposed a comprehensive assessment framework, including six Budyko-framework-based methods, hydrological simulation, sensitivity indicator method, and empirical statistics, to separate impacts of climate variability and human activity on streamflow. The difference between the ten attribution methods varied between 5 and 12% in their study, which showed that the multi-method framework can effectively avoid overestimation/underestimation and quantitative uncertainty. However, some of the methods involved in the framework may be inappropriate for some basins, which may easily lead to inaccurate evaluation. Moreover, the methods for attribution analysis of streamflow changes have some criteria and assumptions, which undoubtedly limit their generality (Dey and Mishra, 2017). Therefore, it is crucial to choose a suitable method for attribution analysis of streamflow changes.
Therefore, the main aim of this study is to propose a methodological options framework based on hydrological modeling, statistical analysis, and conceptual approach, which is to guide researchers in selecting appropriate methods and comprehensively assessing the impacts of climate change and human activities on streamflow. Specifically, the framework includes three modules: data preparation (Module Ⅰ), streamflow changes analysis and key driver identification (Module Ⅱ), and attribution analysis method selection and comprehensive assessment (Module Ⅲ). Also, the Upper Yangtze River Basin (UYRB) of China was taken as a case study to confirm the effectiveness of the proposed framework. The rest of this paper is organized as follows. Methodology clarifies the details of methods, including the proposed framework, fundamental techniques, and critical criteria and assumptions. Case Study provides the details of the case study. Results shows the results of the streamflow changes and their attribution analysis. Discussion discusses the results of the three methods and the implications of the proposed framework. Finally, Conclusion presents the conclusions of this study, summarizing the results of the comprehensive analysis and significance of the framework.
Methodology
Overview of the Framework
In this study, we proposed a framework for methodological options to assess climatic and anthropogenic influences on streamflow (Figure 1), which is mainly composed of three modules: (Ⅰ) data preparation, (Ⅱ) streamflow change analysis and key driver identification, and (Ⅲ) attribution analysis method selection and comprehensive assessment.
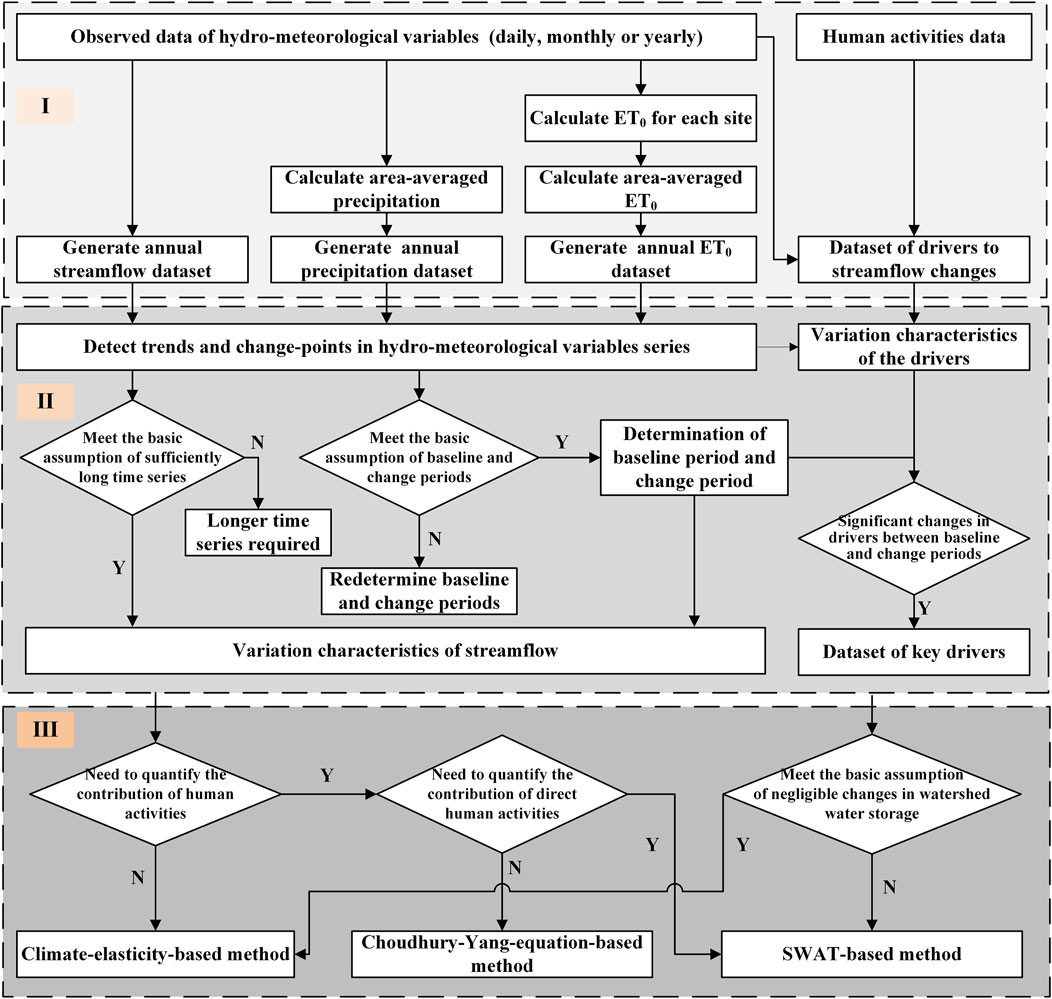
FIGURE 1. Flowchart of the framework for methodological options to assess climatic and anthropogenic influences on streamflow.
Data Preparation
First, hydro-meteorological data of the study area were collected. Reference evapotranspiration (ET0) is calculated for each meteorological station by the Penman-Monteith equation recommended by FAO (Food and Agriculture Organization), and the area-averaged precipitation and ET0 are calculated. The streamflow dataset, precipitation dataset, and ET0 dataset of the study area are constructed. At the same time, data on human activities were also collected and combined with data on meteorological elements to form a dataset regarding the drivers of streamflow changes.
Streamflow Change Analysis and Key Driver Identification
First, based on the dataset of streamflow, precipitation and ET0 generated in Module I, time series analysis methods were used to clarify the trends in streamflow and other water cycle elements in the study area, and check whether the streamflow changes have a major abrupt change point, and whether the critical assumption of “time series is long enough” is satisfied, if not, it is considered that a longer time series is needed to assess climatic and anthropogenic influences on streamflow, but if it is satisfied, the steps continue. Second, the study period is divided into base period and change period according to the main abrupt change point of streamflow. Trends in streamflow, precipitation, ET0 before the abrupt change point are tested to check whether the critical assumption of “base period and change period” is met, if not, the abrupt change point is considered to be lagging behind and needs to be re-divided into base and change periods, if it is met, two sub-periods are determined and the basin streamflow changes in the two sub-periods are calculated. Third, the drivers are analyzed for significant changes between the base and change periods, and the drivers with significant changes are selected to form the key driver set.
Attribution Analysis Method Selection and Comprehensive Assessment
In this study, the SWAT-based method, climate-elasticity-based method and Choudhury-Yang-equation-based method were selected as representatives of the hydrological modeling methods, conceptual methods and statistical methods, respectively. First, based on the research needs and identified key drivers, it is determined whether quantitative assessment of anthropogenic contributions is required; if not, then the climate-elasticity-based method is sufficient, and if so, then the Choudhury-Yang-equation-based or SWAT-based method is selected. Second, to determine whether the quantitative assessment for contributions of direct human activities is needed, if not, the Choudhury-Yang equation-based method is satisfied, if needed, the SWAT-based method is selected. Third, to determine whether the study basin satisfies the assumption of “negligible change in water storage”, if not, the SWAT-based method is selected, and if so, the climate-elasticity-based method and Choudhury-Yang-equation based can be used.
Basic Methods
Time Series Analysis Methods
In this framework, time series analysis was used to detect the temporal trends and abrupt changes in hydro-meteorological series. Since different statistical methods may produce different results, four time series analysis methods were selected in this study, i.e., the Mann-Kendall test (Mann, 1945; Kendall, 1975), the Spearman’s Rho test (Lehmann, 1975), the Pettitt’s test (Pettitt, 1979), the sequential clustering method (Dubes and Jain, 1980). The non-parametric Mann-Kendall test is highly recommended by the WMO (World Meteorological Organization) and widely used to detect monotonic trends in long-term hydro-meteorological variations. The Spearman’s Rho test is a quick and simple test to determine whether correlation exists between two sub-series in the same series of observations. Both the Mann-Kendall test and the Spearman’s Rho test are used to identify trends in hydro-meteorological series and evaluate the significance of the trends. The non-parametric Pettitt’s test, same as the Mann-Kendall test, is a rank-based and distribution-free test. It is used to identify the occurrence of an abrupt change point in hydro-meteorological series. The sequential clustering method is used to detect the abrupt change point as a reconfirmation for Pettitt’s test in this study.
Attribution Analysis Methods
Generally, the study period is divided into two sub-periods based on historical streamflow changes, i.e., baseline period and change period. The baseline period is affected by the changing environment to a negligible extent, and streamflow is in a natural or quasi-natural state. The streamflow during the change period, on the other hand, is affected by climate change and human activities, and undergoes significant changes under the influence. Based on this, the principles of the currently used attribution analysis methods can be summarized as follows:
where
Equations 1–3 are the general ideas of attribution analysis methods, which are realized in different ways in different methods. The climate-elasticity-based method, Choudhury-Yang-equation-based method and SWAT-based method are used in this study to further clarify the implementation of the basic ideas of attribution analysis.
1) Climate-elasticity-based method
The climate elasticity model (Schaake, 1990) is a classical approach that was originally proposed to estimate the effect of only one driver (i.e., precipitation) on streamflow, and the model can be expressed as:
where
After this, a two-parameter model incorporating precipitation and temperature (Fu et al., 2007) was proposed and can be expressed as:
where
Later, more meteorological factors were introduced and climate elasticity models with more parameters were established (Yang and Yang, 2011). After fitting the elasticity coefficients based on long series of observations, the contribution of each meteorological factor can be estimated. It can be seen that the more complete and longer the long series of observations of streamflow and each meteorological factor, the better the fitting effect and the more accurate the attribution analysis results.
2) Choudhury-Yang-equation-based method
The Budyko hypothesis (Budyko, 1974) can be expressed as the following equation:
where E is the average annual actual evapotranspiration for a basin; P is the average annual precipitation;
The function F(·) in Eq. 6 is considered to have a general expression, and many scholars have proposed formulas without parameters, with one parameter or with two parameters. Among them, the Choudhury-Yang equation (Yang et al., 2008) is able to describe the interactions between climate, hydrology and watershed with the following expression:
where n is a parameter related to the land surface. Using
For a closed watershed, the change in the multi-year average water storage can be neglected, and the long-term water balance can be expressed as:
The streamflow can be written as a function of precipitation (P), potential evapotranspiration (
Further the streamflow change can be written in the following differential form:
where
Finally, the contributions of drivers to streamflow change are estimated as follows:
where
3) SWAT-based method
SWAT (Arnold et al., 1998) is a widely used, physically based distributed hydrological model for simulating surface streamflow, groundwater discharge, evapotranspiration, soil water content (Zhang et al., 2021a). It and has been certified as an effective tool for evaluating water resources at a wide range of scales. A two-driver example is given to clarify the implementation of the basic ideas of attribution analysis in the SWAT-based method.
The driving factors are first identified as climate change and human activities, which are expressed as C and H respectively, while the model inputs are abbreviated as C and H. The streamflow output of the model is written as a function of C and H. Then the streamflow change can be expressed in the form of Eq. 1 as:
where
Contributions of climate change and human activities to streamflow change can be expressed in the form of Eqs 2, 3 as
where
Critical Criteria and Assumptions
Baseline Period and Change Period
The assumption that “the study period can be divided into a baseline period and a change period” is used in all the above three methods. It assumes streamflow is in a natural or quasi-natural state during the baseline period and undergoes significant changes during the change period because of the influence of climate change and human activities. Determining the baseline period and change period is the first step in attribution analysis. The time series analysis was used to detect the abrupt change point of the streamflow series, and the sub-period before the abrupt change point is recognized as the baseline period, and the sub-period after the abrupt change point is recognized as the change period. Commonly used methods include double cumulative curve, Pettitt test, Mann-Kendall test, sliding t-test, ordered clustering, etc. Two problems may arise when using the abrupt change point in streamflow to divide the base period and the change:
1) The abrupt change point in streamflow is later than the cut-off point between the baseline period and the change period. This occurs because human activities and climate change have opposite effects on the increase or decrease in streamflow between the cut-off point and the abrupt change, which cancel each other out at a certain statistical confidence level. From the general knowledge of water cycle, there should be no obvious trend of streamflow, precipitation and potential evapotranspiration in the natural period of a basin. Therefore, the accuracy of the baseline period determination is verified by detecting the trend of streamflow, precipitation and potential evapotranspiration in the baseline period.
2) For sufficiently long streamflow series, the time series analysis sometimes detects multiple abrupt change points, which are then divided into two cases: (a) Several abrupt change points with relatively low confidence level are detected after a major one. In this case, only the main abrupt change point is selected. (b) Multiple abrupt change points are scattered over the study period and it is difficult to determine which is the major one. In this case, the abrupt change points near the beginning and end of the study period are not included in the reliable points because the uncertainty is too large. The remaining points are filtered out one by one according to the streamflow changes or precipitation and potential evapotranspiration changes during sub-periods to find the major abrupt change point.
Impacts of Human Activities
At the watershed scale, human activities can be grouped into two categories: 1) human activities that directly affect streamflow (direct human activities), such as off-channel water use, damming, reservoir storage and discharge, and other activities that act directly on streamflow and have an immediate impact on streamflow once they are implemented. Direct human activities can increase or decrease streamflow, and for a single activity, the effect on streamflow is obvious and can be measured directly. However, as watersheds become larger and river systems increase, direct human activities will become more complex and difficult to observe comprehensively. 2) Human activities that indirectly affect streamflow (indirect human activities), such as land use change, soil and water conservation, urbanization, etc. The impact of an individual indirect human activity on the increase or decrease of streamflow is not obvious for a short duration, and usually needs to be accumulated for a certain period to produce a measurable impact. As the watershed grows larger, the impact of indirect human activities is instead more easily estimated with the help of remote sensing and other technical means.
The climate-elasticity-based method is only able to calculate the contribution of climate change to streamflow change. If the streamflow change minus climatic contribution is attributed to anthropogenic contribution, then the anthropogenic contribution contains an error term, and it is not able to distinguish between contributions of direct and indirect human activities. The Choudhury-Yang-equation-based method attributes streamflow changes exclusively to precipitation, potential evapotranspiration and land surface coefficient, i.e., to climate change and indirect human activities. The SWAT model allows for reservoirs and water extraction points in addition to inputs such as climate, soil, and land use. Therefore, the SWAT-based method is able to assess the effects of climate change, indirect human activities and direct human activities on streamflow. When the method is applied to a large watershed, the direct human activities are always too complex, so streamflow change minus contributions of climate change and indirect human activities is attributed to the effects of direct human activities, but an error term is included.
Length of Time Series
All three methods implicitly assume the length of the time series. That is, it is assumed that “the time series of streamflow is long enough”. 1) The time series is long enough to include natural or quasi-natural period and periods of change, and to include natural and changing characteristics of streamflow. 2) It is long enough to distinguish between gradual and abrupt changes in streamflow, to detect the points of abrupt change, and to identify changes in climatic elements. 3) It is sufficient to reflect the impact of indirect human activities on streamflow. In practice, for a watershed where streamflow is influenced by changing environment, a streamflow series is considered long enough for attribution analysis if it can be detected with significant trend changes and abrupt change points. Therefore, analyzing the characteristics of streamflow changes, detecting the abrupt change points, and analyzing the characteristics of driver changes are also tests of the assumption that the time series length is sufficiently long. In addition, as far as the attribution analysis method is concerned, the time series length is long enough to facilitate the establishment of a mapping relationship between driving factors and streamflow, thus making the attribution analysis more accurate.
Changes in Watershed Water Storage
The Choudhury-Yang-equation-based method uses a simplified water balance equation for a watershed (Eq (8). The simplified water balance equation is based on the assumption that “the change in the multi-year average water storage in a closed watershed is negligible”. However, if there is a significant decrease in streamflow and an increase in water storage in a study basin, attribution analysis under this assumption tends to exaggerate the contribution of climate change and underestimate the impact of human activities, while other cases may also produce biased attribution results. The climate-elasticity-based method aims to establish statistical relationships between streamflow and drivers. The watershed water storage is difficult to measure directly, so the climate-elasticity-based method is not able to take into account changes in water storage. As the SWAT model takes into account the watershed water storage and deep groundwater loss, the SWAT-based method can estimate the influence of changes in watershed water storage.
Case Study
Study Area
The Upper Yangtze River Basin (UYRB) was selected as a case study area to quantify the contributions of climate change and human activities to its streamflow changes and confirm the effectiveness of the proposed framework. The Yangtze River is the longest river in Asia and the third-longest river in the world. The average annual streamflow of the Yangtze River is 996 km3, making up 36% of the total streamflow in China, and the hydropower generation accounts for about 40% of the national total. The UYRB is located in the region between 90 and 112°E and 23 and 35°N, with a total area of 1 million km2 (Figure 2). The UYRB is the streamflow formation area and hydropower storage area of the Yangtze River, accounting for 45% of basin water resources and 90% of basin hydropower resources (with a developable installed capacity of about 20 × 108 kW). It has a mean annual temperature of 16.8°C, mean annual precipitation of 1,130 mm. However, measured streamflow in most regions of the UYRB has been decreasing heavily in recent years, which greatly impacts economic development, social stability, and ecological security (Zhang et al., 2018). Therefore, it is necessary to conduct an attribution analysis of the streamflow changes in the basin.
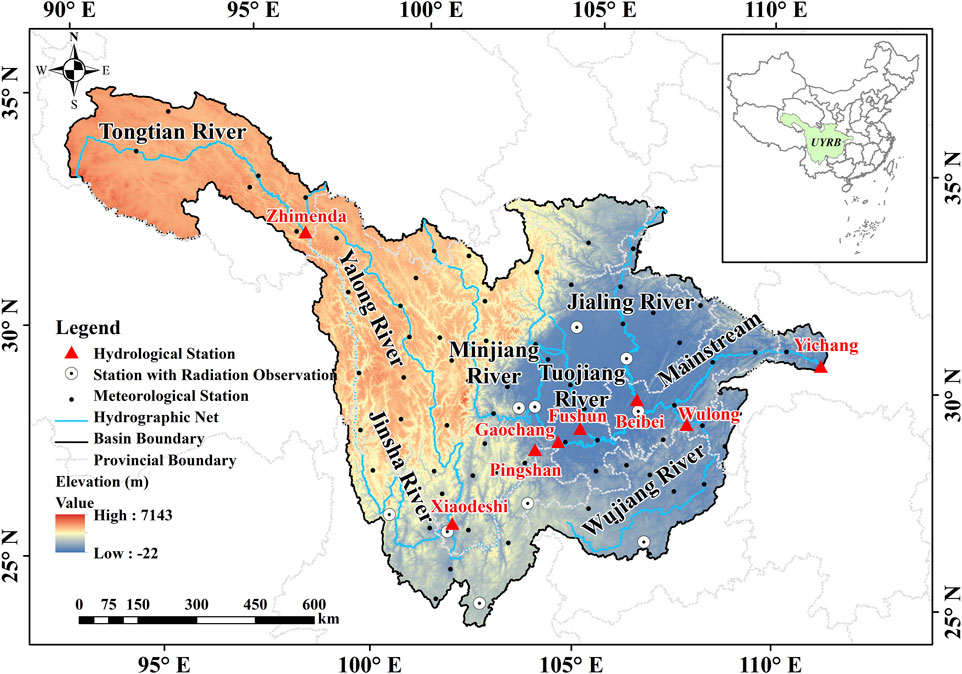
FIGURE 2. Map of the UYRB.
Data Processing (Module Ⅰ)
Daily streamflow series (1951–2013) from hydrological stations located at the mainstream and important tributaries (Figure 2) were collected from the China Annual Hydrological Reports. Meteorological data were collected from the National Meteorological Information Centre of China (NMIC), including daily observations of precipitation, air temperatures, relative humidity, wind speed, and sunshine duration for the period from 1951 to 2013. The topography is represented using the digital elevation model (DEM) with a spatial resolution of 90 m, which was obtained from the Consultative Group on International Agricultural Research (CGIAR) Consortium for Spatial Information (CGIAR-CSI) (http://srtm.csi.cgiar.org). Geological characteristics data includes land use/cover data and soil type data. Land use/cover maps with a scale of 1: 100000 for 1980, 1990, 1995, 2000, 2005, 2010, and 2013 were collected from the Data Center for Resources and Environmental Sciences, Chinese Academy of Sciences (RESDC) (http://www.resdc.cn). ET0 was calculated for each meteorological station by the FAO Penman-Monteith equation. The solar radiation was calculated using the Angstrom formula (Wang et al., 2021), in which the Angstrom coefficients were estimated by the measured radiation within the UYRB (Figure 2). The area-averaged precipitation and ET0 were further calculated. The streamflow dataset, precipitation dataset, and ET0 dataset of the UYRB were constructed and combined with data on human activities to form a dataset on the drivers of streamflow changes. At this point the data preparation in Module Ⅰ is complete.
Results
Long-Term Trend and Change in Streamflow (Module II)
Yichang station is the control station for the entire UYRB. Streamflow series observed in the Yichang station reflects the general characteristics of streamflow changes in the UYRB. The observed annual streamflow series of Yichang station is shown in Figure 3. It is clear that streamflow in the UYRB decreased by a rate of −0.77 km3 per year during 1951–2013. The long-term trend in streamflow and its significance were identified by the Mann-Kendall test and the Spearman’s Rho test. Results obtained from the two methods are consistent, revealing a significant downward trend (at the 95% confidence level) in streamflow in the UYRB during the study period. A more detailed description and analysis of the spatio-temporal variability of streamflow can be found in our previous study (Zhang et al., 2021a).
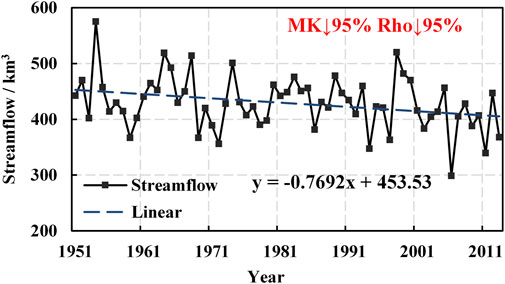
FIGURE 3. Annual streamflow series observed in Yichang station (Note: ↓ represents decreasing trend; 95% represents a confidence level of 95%).
The change point in streamflow series was identified by the Pettitt’s test and the sequential clustering method. Both methods show that the abrupt change point of observed annual streamflow series at Yichang station occurred in 1993at 95% confidence level. More detailed results and analysis of the abrupt change can also be found in our previous study (Zhang et al., 2021a). According to the change point in streamflow series, the study period can be divided into two sub-periods (i.e., 1951–1993 and 1994–2013).
For baseline period determination, the changes of streamflow, precipitation and ET0 during 1951–1993 were detected by Mann-Kendall test. The results indicate that there are no obvious changes in streamflow, precipitation or ET0 series during the first sub-period (Table 1). Therefore, the basic assumption of “baseline period and change period” is valid. The sub-period 1951–1993 is confirmed as the baseline period and the sub-period 1994–2013 is determined as the change period.
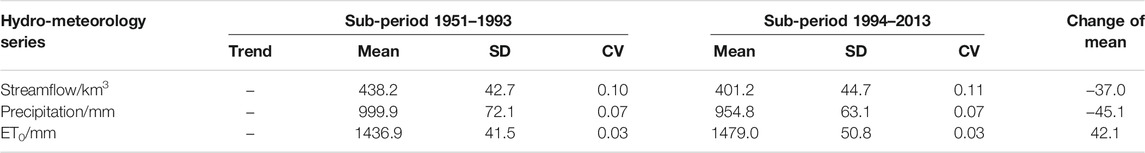
TABLE 1. Characteristics of the streamflow, precipitation and ET0 series in the UYRB before and after change point (Note: – represents a confidence level lower than 80%).
Meanwhile, the mean value, standard deviation (SD) and coefficient of variation (CV) of the hydro-meteorology series in the baseline and change periods were separately calculated and listed in Table 1. Compared with the baseline period, the average annual streamflow in the change period decreased by 8.4%. A statistically significant difference can be found between the mean values of the annual streamflow for the two periods at the 95% confidence level, while the difference between the SD or CV is not statistically significant. Differences at the 95% confidence level are also found between the means of the precipitation and ET0 series for the two periods. No statistically significant differences are found between the SD and CV of the precipitation and ET0 series for the two periods. At this point in the analysis, it can be concluded that the hydro-meteorology series of the UYRB from 1951 to 2013 meets the two basic assumptions of “baseline period and change period” and “sufficient length of time series”. In this case study, the SWAT-based method, climate-elasticity-based method and Choudhury-Yang-equation-based method are all applicable.
Driving Factors Identification (Module II)
Precipitation, evapotranspiration and streamflow are the basic elements of the water cycle. Precipitation is the water income item and evapotranspiration is the output item. Actual evapotranspiration is influenced by available water (i.e., precipitation, land surface conditions) on the one hand, and available energy (i.e., potential evapotranspiration) on the other. The potential evapotranspiration is mainly influenced by meteorological factors such as maximum temperature (Tmax), minimum temperature (Tmin), wind speed (WS), relative humidity (RH), sunshine hour (SH). In addition, streamflow is also influenced by indirect human activities such as land use/cover change (LUCC) and direct human activities. Therefore, P, Tmax, Tmin, RH, SH, WS, and LUCC data were initially selected to form the drivers of streamflow changes in Module Ⅰ. It is noted that the direct human activities in the UYRB are too complex to collect detailed information. In this case study, the contribution of direct human activities was estimated by subtracting the contribution of other drivers from the total streamflow change.
In order to identify the key driving factors of streamflow change in the drivers dataset in Module Ⅰ. The mean value of each meteorological factor in baseline period and change period were calculated and listed in Table 2. The t-test was used to detect differences of meteorological factors for the two periods. Differences at 99% confidence level are found between the mean values of P, Tmax, Tmin, WS, and RH for the two periods. Difference is not obvious in SH. Therefore, P, Tmax, Tmin, WS, and RH were selected as the meteorological driving factors. During the study period, land use/cover in the UYRB underwent obvious changes. As an indirect human activity, LUCC was also selected as a driver. Detailed description of LUCC can be found in our previous study (Zhang et al., 2021a).
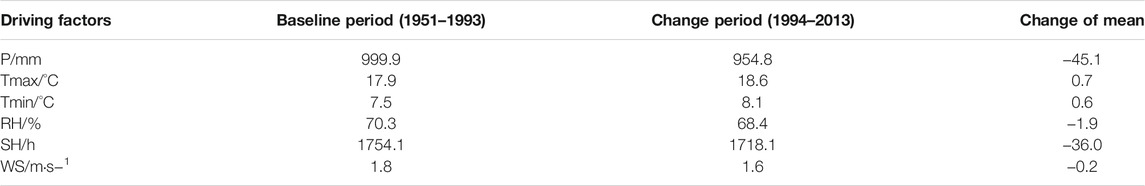
TABLE 2. Mean values of the meteorological factors in the UYRB for baseline period and change period.
Climatic and Anthropogenic Contributions to Streamflow Change (Module III)
Based on the judgments in Module III, it is clear that the SWAT-based method is the best method for assessing climatic and anthropogenic influences on streamflow in the UYRB, because it is capable of assessing the effects of climate change, indirect human activities and direct human activities on streamflow. The climate-elasticity-based method is the second-best choice, which does not distinguish between direct and indirect human activities. In this case study, the parameter n was not collected and needed to be estimated, so the Choudhury-Yang-equation-based method is the worst option. In this section, the SWAT-based method was selected, supplemented by the other two methods, to conduct a comprehensive attribution analysis. For the purpose of comparison between the three methods, streamflow changes were attributed to climate change, direct human activities, and indirect human activities.
1) SWAT-based method
According to the general steps of the method, the contributions of climate change (
where
The contributions of climate change, LUCC and direct human activities are listed in Table 3. The results suggest that the main contributions to streamflow change are from climatic variabilities (69%), LUCC (10%) and direct human activities (21%). Climate change appears to be the main cause of streamflow change with a contribution of -25.5 km3.
2) Climate-elasticity-based method
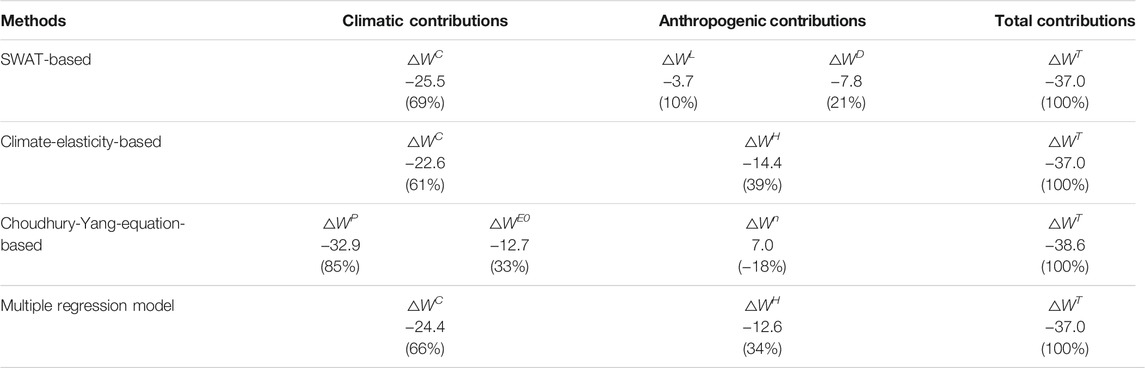
TABLE 3. Climatic and anthropogenic contributions to streamflow changes.
A multi-parameter climate elasticity model was developed with the key driving factors as follows:
where
The contributions of climate change and human activities to streamflow were listed in Table 3. The climatic contribution is −22.6 km3. The contribution of climate change and human activities to streamflow change is about 7:3.
3) Choudhury-Yang-equation-based method
The elasticity coefficients of precipitation, potential evapotranspiration and land surface parameter were first calculated according to the steps:
Discussion
Through the analysis in Climatic and Anthropogenic Contributions to Streamflow Change (Module III), the results based on the SWAT-based method and climate-elasticity-based method are relatively close, and the contribution of climate change and human activities to the streamflow changes are 7 : 3 and 6 : 4, respectively; where the contribution of climate change is −25.5 and −22.6 km3, respectively. However, the contribution of climate change based on the Choudhury-Yang-equation-based method is -45.6 km3, which is significantly larger than the above two methods. The possible reason for this is that n is calculated from precipitation and evapotranspiration.
Here, we used a multiple regression model, the most direct method for attribution analysis of streamflow changes under changing environment, to further verify the contribution of P and E0 (climate factors) to streamflow changes. The specific expressions are as follows:
where R, P and
Based on the precipitation, potential evapotranspiration and streamflow data for the baseline period (1951–1993), the values of a, b and c are 0.426, 0.128, and 128.961 (at the 95% confidence level), respectively, with a correlation coefficient of 0.803. The results of calculating the attribution analysis in the UYRB are shown in Table 3. It can be seen that: the contribution of climate change is −24.4 km3, and the contribution ratio of climate change and human activities to streamflow changes is 6.6 : 3.4, which is close to the results of the SWAT-based method and climate-elasticity-based method. Therefore, comprehensive analysis shows that climate change is the dominant driver of streamflow changes in the UYRB, and the contribution ratio of climate change, indirect human activities, and direct human activities to streamflow changes is about 7 : 1 : 2.
In general, the proposed framework was applied to assess climatic and anthropogenic influences on streamflow changes in the UYRB in this study, indicating that the dominant factor of streamflow changes in the basin from 1951 to 2013 was climate change, which is consistent with previous studies (Lu et al., 2019; Ye et al., 2020; Shao et al., 2021). For example, Wang and Xia (2015) employed water balance model to assess the impacts of climate change and human activities on streamflow changes in the UYRB, finding that 71.43% of streamflow decrease was due to climate change in the basin since 1993. Similarly, Ahmed et al. (2020) noted that climate change played a controlling role in streamflow changes in the UYRB. Recently, Shao et al. (2021) used the water balance equation, double mass curve, and linear regression analysis to quantify the contributions of climate change and anthropogenic activities to streamflow changes in the Jialing River (a main tributary of the upper Yangtze River) during 1960–2017. The results show that climate change had led to a significant reduction in annual streamflow (82.2%).
Different methods of attribution analysis have their own characteristics, limitations, critical criteria and assumptions, which in turn cause large variability and uncertainty in calculation results (Zhang et al., 2020). This is consistent with the findings of this study that the attribution results based on the Choudhury-Yang-equation-based method are significantly different from both the SWAT-based method and climate-elasticity-based method. This further emphasizes the importance of selecting an appropriate methodology to help properly assess the contribution of climate change and human activities to streamflow changes. Therefore, the proposed framework is valuable and effective in helping researchers to select the appropriate method, reduce the uncertainty introduced by the method, and avoid the misperceptions that may result from inappropriate methods. Indeed, the framework has some limitations, which need further research. We chose only one commonly used method as the most representative for the three categories of methods (i.e., hydrological modeling, statistical analysis, and conceptual approaches). However, the calculation results of different methods in the same category may not be consistent. For instance, Zhang et al. (2020) used six Budyko framework-based methods to estimate the contributions of climate change and human activities to streamflow changes. The results showed that the uncertainty between these methods is about 5–7%.
Conclusion
This study aims to provide guidance for the selection of appropriate methods to quantify the climatic and anthropogenic influences on streamflow. Therefore, a method selection framework for attribution analysis was developed using the SWAT-based method, climate-elasticity-based method, and Choudhury-Yang-equation-based method jointly. The proposed framework consists of three modules, namely data preparation (Module Ⅰ), streamflow changes analysis and key driver identification (Module Ⅱ), and attribution analysis method selection and comprehensive assessment (Module Ⅲ). To evaluate its effectiveness, a case study in the UYRB was conducted. Under the framework, a significantly decreasing trend and changes were detected in observed annual streamflow in the UYRB. The study period was divided into a baseline period (1951–1993) and a change period (1994–2013) based on proposed criteria and assumptions. Subsequently, statistical indicators indicated that precipitation, maximum temperature, minimum temperature, wind speed, relative humidity, and LUCC are key drivers of streamflow changes in the UYRB. The analysis in Module Ⅲ indicates that the SWAT-based method is the best approach to assess climatic and anthropogenic influences on streamflow in the UYRB, and the climate-elasticity-based method and Choudhury-Yang-equation-based method are also applicable. The comprehensive attribution analysis suggests that climate change is the dominant cause of streamflow changes in the UYRB, and the contribution of climate change, indirect human activities, and direct human activities to streamflow changes is about 7:1:2. Overall, the proposed framework is efficient and valuable in assisting researchers to find appropriate methods for attribution analysis of streamflow changes under changing environments.
Data Availability Statement
The original contributions presented in the study are included in the article/supplementary material, further inquiries can be directed to the corresponding authors.
Author Contributions
All authors listed have made a substantial, direct, and intellectual contribution to the work and approved it for publication.
Funding
This work was supported by the National Key R&D Program of China (Grant No. 2018YFE0206200); the Project funded by China Postdoctoral Science Foundation (Grant No. 2019M661884); the Natural Science Foundation of Jiangsu Province, China (Grant No. BK20200160); the Special Research Fund of Nanjing Hydraulic Research Institute (Grant No. Y120006).
Conflict of Interest
CX was employed by the China Energy Investment Corporation Science and Technology Research Institute Co., Ltd
The remaining authors declare that the research was conducted in the absence of any commercial or financial relationships that could be construed as a potential conflict of interest.
The reviewer CS declared a shared affiliation, with no collaboration, with one of the authors, LY, to the handling editor at the time of the review.
Publisher’s Note
All claims expressed in this article are solely those of the authors and do not necessarily represent those of their affiliated organizations, or those of the publisher, the editors and the reviewers. Any product that may be evaluated in this article, or claim that may be made by its manufacturer, is not guaranteed or endorsed by the publisher.
References
Arnold, J. G., Srinivasan, R., Muttiah, R. S., and Williams, J. R. (1998). Large Area Hydrologic Modeling and Assessment Part I: Model Development. J. Am. Water Resour. Assoc 34, 73–89. doi:10.1111/j.1752-1688.1998.tb05961.x
Borgwardt, F., Unfer, G., Auer, S., Waldner, K., El-Matbouli, M., and Bechter, T. (2020). Direct and Indirect Climate Change Impacts on Brown Trout in Central Europe: How Thermal Regimes Reinforce Physiological Stress and Support the Emergence of Diseases. Front. Environ. Sci. 8. doi:10.3389/fenvs.2020.00059
Dey, P., and Mishra, A. (2017). Separating the Impacts of Climate Change and Human Activities on Streamflow: A Review of Methodologies and Critical Assumptions. J. Hydrol. 548, 278–290. doi:10.1016/j.jhydrol.2017.03.014
Dubes, R., and Jain, A. K. (1980). Clustering Methodologies in Exploratory Data Analysis. Adv. Comput. 19, 113–228. doi:10.1016/S0065-2458(08)60034-0
Fu, G., Charles, S. P., and Chiew, F. H. S. (2007). A Two-Parameter Climate Elasticity of Streamflow index to Assess Climate Change Effects on Annual Streamflow. Water Resour. Res. 43 (11), W11419. doi:10.1029/2007WR005890
Hajihosseini, M., Hajihosseini, H., Morid, S., Delavar, M., and Booij, M. J. (2020). Impacts of Land Use Changes and Climate Variability on Transboundary Hirmand River Using SWAT. J. Water Clim. Change 11 (4), 1695–1711. doi:10.2166/wcc.2019.100
Jardim, P. F., Melo, M. M. M., Ribeiro, L. d. C., Collischonn, W., and Paz, A. R. d. (2020). A Modeling Assessment of Large-Scale Hydrologic Alteration in South American Pantanal Due to Upstream Dam Operation. Front. Environ. Sci. 8, 567450. doi:10.3389/fenvs.2020.567450
Jiang, S., Zhou, L., Ren, L., Wang, M., Xu, C.-Y., Yuan, F., et al. (2021). Development of a Comprehensive Framework for Quantifying the Impacts of Climate Change and Human Activities on River Hydrological Health Variation. J. Hydrol. 600, 126566. doi:10.1016/j.jhydrol.2021.126566
Li, B., Su, H., Chen, F., Li, H., Zhang, R., Tian, J., et al. (2014). Separation of the Impact of Climate Change and Human Activity on Streamflow in the Upper and Middle Reaches of the Taoer River, Northeastern China. Theor. Appl. Climatol 118 (1-2), 271–283. doi:10.1007/s00704-013-1032-8
Li, H., Shi, C., Zhang, Y., Ning, T., Sun, P., Liu, X., et al. (2020). Using the Budyko Hypothesis for Detecting and Attributing Changes in Runoff to Climate and Vegetation Change in the Soft sandstone Area of the Middle Yellow River basin, China. Sci. Total Environ. 703, 135588. doi:10.1016/j.scitotenv.2019.135588
Liu, J., You, Y., Zhang, Q., and Gu, X. (2021). Attribution of Streamflow Changes across the globe Based on the Budyko Framework. Sci. Total Environ. 794, 148662. doi:10.1016/j.scitotenv.2021.148662
Liu, X., Liu, W., Yang, H., Tang, Q., Flörke, M., Masaki, Y., et al. (2019). Multimodel Assessments of Human and Climate Impacts on Mean Annual Streamflow in China. Hydrol. Earth Syst. Sci. 23 (3), 1245–1261. doi:10.5194/hess-23-1245-2019
Lu, C.-h., Dong, X.-y., Tang, J.-l., and Liu, G.-c. (2019). Spatio-temporal Trends and Causes of Variations in Runoff and Sediment Load of the Jinsha River in China. J. Mt. Sci. 16 (10), 2361–2378. doi:10.1007/s11629-018-5330-6
Mann, H. B. (1945). Nonparametric Tests against Trend. Econometrica 13, 245–259. doi:10.2307/1907187
Miao, C., Yang, L., Liu, B., Gao, Y., and Li, S. (2011). Streamflow Changes and its Influencing Factors in the Mainstream of the Songhua River basin, Northeast China over the Past 50 Years. Environ. Earth Sci. 63 (3), 489–499. doi:10.1007/s12665-010-0717-x
Penny, G., Srinivasan, V., Apoorva, R., Jeremiah, K., Peschel, J., Young, S., et al. (2020). A Process‐based Approach to Attribution of Historical Streamflow Decline in a Data‐scarce and Human‐dominated Watershed. Hydrological Process. 34 (8), 1981–1995. doi:10.1002/hyp.13707
Pettitt, A. N. (1979). A Non-parametric Approach to the Change-point Problem. Appl. Stat. 28 (2), 126–135. doi:10.2307/2346729
Porter, M. E., Hill, M. C., Harris, T., Brookfield, A., and Li, X. (2021). The DiscoverFramework Freeware Toolkit for Multivariate Spatio-Temporal Environmental Data Visualization and Evaluation. Environ. Model. Softw. 143, 105104. doi:10.1016/j.envsoft.2021.105104
Renner, M., Seppelt, R., and Bernhofer, C. (2012). Evaluation of Water-Energy Balance Frameworks to Predict the Sensitivity of Streamflow to Climate Change. Hydrol. Earth Syst. Sci. 16 (5), 1419–1433. doi:10.5194/hess-16-1419-2012
Schaake, J. C. (1990). “From Climate to Flow,” in Climate Change and U.S.Water Resources. Editor P. E. Waggoner (New York: JohnWiley), 177–206.
Shao, Y., He, Y., Mu, X., Zhao, G., Gao, P., and Sun, W. (2021). Contributions of Climate Change and Human Activities to Runoff and Sediment Discharge Reductions in the Jialing River, a Main Tributary of the Upper Yangtze River, China. Theor. Appl. Climatol 145 (3-4), 1437–1450. doi:10.1007/s00704-021-03682-1
Todhunter, P. E., Jackson, C. C., and Mahmood, T. H. (2020). Streamflow Partitioning Using the Budyko Framework in a Northern Glaciated Watershed under Drought to Deluge Conditions. J. Hydrol. 591, 125569. doi:10.1016/j.jhydrol.2020.125569
Tomer, M. D., and Schilling, K. E. (2009). A Simple Approach to Distinguish Land-Use and Climate-Change Effects on Watershed Hydrology. J. Hydrol. 376 (1-2), 24–33. doi:10.1016/j.jhydrol.2009.07.029
Wang, M., Zhang, Y., Lu, Y., Gong, X., and Gao, L. (2021). Detection and Attribution of Reference Evapotranspiration Change (1951-2020) in the Upper Yangtze River Basin of China. J. Water Clim. Change, jwc2021011. doi:10.2166/wcc.2021.011
Wang, W., Zhang, Y., and Tang, Q. (2020). Impact Assessment of Climate Change and Human Activities on Streamflow Signatures in the Yellow River Basin Using the Budyko Hypothesis and Derived Differential Equation. J. Hydrol. 591, 125460. doi:10.1016/j.jhydrol.2020.125460
Wang, X. (2014). Advances in Separating Effects of Climate Variability and Human Activity on Stream Discharge: An Overview. Adv. Water Resour. 71, 209–218. doi:10.1016/j.advwatres.2014.06.007
Wright, M. S. P., Santelmann, M. V., Vaché, K. B., and Hulse, D. W. (2021). Modeling the Impact of Development Policies and Climate on Suburban Watershed Hydrology Near Portland, Oregon. Landscape Urban Plann. 214, 104133. doi:10.1016/j.lurbplan.2021.104133
Yang, H., and Yang, D. (2011). Derivation of Climate Elasticity of Runoff to Assess the Effects of Climate Change on Annual Runoff. Water Resour. Res. 47, W07526. doi:10.1029/2010WR009287
Yang, H., Yang, D., Lei, Z., and Sun, F. (2008). New Analytical Derivation of the Mean Annual Water-Energy Balance Equation. Water Resour. Res. 44, W034103. doi:10.1029/2007WR006135
Yasarer, L. M. W., Taylor, J. M., Rigby, J. R., and Locke, M. A. (2020). Trends in Land Use, Irrigation, and Streamflow Alteration in the Mississippi River Alluvial Plain. Front. Environ. Sci. 8, 66. doi:10.3389/fenvs.2020.00066
Ye, X., Zhang, Z., Xu, C.-Y., and Liu, J. (2020). Attribution Analysis on Regional Differentiation of Water Resources Variation in the Yangtze River Basin under the Context of Global Warming. Water 12 (6), 1809. doi:10.3390/w12061809
Zeng, X., Schnier, S., and Cai, X. (2021). A Data-Driven Analysis of Frequent Patterns and Variable Importance for Streamflow Trend Attribution. Adv. Water Resour. 147, 103799. doi:10.1016/j.advwatres.2020.103799
Zhang, K., Ruben, G. B., Li, X., Li, Z., Yu, Z., Xia, J., et al. (2020). A Comprehensive Assessment Framework for Quantifying Climatic and Anthropogenic Contributions to Streamflow Changes: A Case Study in a Typical Semi-arid North China basin. Environ. Model. Softw. 128, 104704. doi:10.1016/j.envsoft.2020.104704
Zhang, Y., Wang, M., Chen, J., Zhong, P.-a., Wu, X., and Wu, S. (2021a). Multiscale Attribution Analysis for Assessing Effects of Changing Environment on Runoff: Case Study of the Upstream Yangtze River in China. J. Water Clim. Change 12 (2), 627–646. doi:10.2166/wcc.2020.155
Zhang, Y., Yu, L., Wu, S., Wu, X., Dai, J., Xue, W., et al. (2021b). A Framework for Adaptive Control of Multi-Reservoir Systems under Changing Environment. J. Clean. Prod. 316, 128304. doi:10.1016/j.jclepro.2021.128304
Zhang, Y., Zhong, P.-a., Wang, M., Xu, B., and Chen, J. (2018). Changes Identification of the Three Gorges Reservoir Inflow and the Driving Factors Quantification. Quat. Int. 475, 28–41. doi:10.1016/j.quaint.2016.02.064
Keywords: attribution analysis, climate change, human activities, streamflow changes, Upper Yangtze River Basin
Citation: Zhang Y, Wu X, Wu S, Dai J, Yu L, Xue W, Wang F, Gao A and Xue C (2021) A Framework for Methodological Options to Assess Climatic and Anthropogenic Influences on Streamflow. Front. Environ. Sci. 9:765227. doi: 10.3389/fenvs.2021.765227
Received: 26 August 2021; Accepted: 15 September 2021;
Published: 29 October 2021.
Edited by:
Huiyu Dong, Research Center for Eco-environmental Sciences (CAS), ChinaCopyright © 2021 Zhang, Wu, Wu, Dai, Yu, Xue, Wang, Gao and Xue. This is an open-access article distributed under the terms of the Creative Commons Attribution License (CC BY). The use, distribution or reproduction in other forums is permitted, provided the original author(s) and the copyright owner(s) are credited and that the original publication in this journal is cited, in accordance with accepted academic practice. No use, distribution or reproduction is permitted which does not comply with these terms.
*Correspondence: Xiufeng Wu, eGZ3dUBuaHJpLmNu; Shiqiang Wu, c3F3dUBuaHJpLmNu; Jiangyu Dai, anlkYWlAbmhyaS5jbg==; Lei Yu, eXVsZWkwNDA1QGZveG1haWwuY29t