
94% of researchers rate our articles as excellent or good
Learn more about the work of our research integrity team to safeguard the quality of each article we publish.
Find out more
ORIGINAL RESEARCH article
Front. Environ. Sci., 01 December 2021
Sec. Soil Processes
Volume 9 - 2021 | https://doi.org/10.3389/fenvs.2021.764489
This article is part of the Research TopicSoil-Plant-Microbe Interactions: An Innovative Approach Towards Improving Soil Health and Plant GrowthView all 26 articles
 Sanjeev Kumar1*
 Shiva Dhar2
 Sharmistha Barthakur3
 Mahendra Vikram Singh Rajawat4
 S. A. Kochewad5
 Sudhir Kumar6Dileep Kumar7L. R. Meena8
Potassium fertilization is often ignored by assuming alluvial soils have sufficient K reserves in the North West Plain Zone of India under cereal-based cropping systems. There is scanty information on the impact of integrated K fertilization on soil enzymes, nutrients availability, microbial population, and wheat yield cultivated in the corn–wheat cropping system. The current study exhibits that treatment (T7) applied with a dose of 90 kg K ha−1 [30 kg K by farmyard manure (FYM) and 60 kg K by muriate of potash (MOP)] significantly enhances the various microbial populations from 48.00 to 123.10% and 39.00 to 124.00%, soil enzymatic activities from 70.31 to 180.00% and 102.42 to 175.68%, and available nutrients from 2.43 to 8.44% and 14.79 to 22.87% for the first and second years of wheat cultivation, respectively. It also improved various yield parameters (12.39–41.71% and 18.24–41.14%) during both the consecutive years of cultivation. Statistical analyses revealed that the treatments (T4, T5, and T7) applied with integrated fertilization of wheat cultivation through FYM and MOP were more promising for improving soil enzymatic activities (11.59–57.22%), microbial populations (5.14–15.70%), available nutrients in soil (7.60–16.54%), and crop yield (1.06–5.85%) during the second year of cultivation as compared to the first year of cultivation. This study might be helpful to reclaim soil health and reduce chemical fertilizers used in agricultural lands.
Soil is home to different kinds of microbes and enzymes. The activities and functions of these microbes and soil enzymes are dependent on soil pH, soil temperature, soil organic matter, cropping system, crop management factors, soil amendments, and conditioners. Soil microbial population and enzymatic activities are a key driving force that helps in degeneration and management of exogenic plant material and anthropogenic depositions, conversion of organic matter, and progression and conservation of the soil structure (Canarutto et al., 1995; Bandick and Dick, 1999). The function of the secondary trophic levels mainly relies on the energy prevalent through primary organic matter decomposer soils. Subsequently, this functional process contributes a significant role in the cycling of nutrients and favor to plant life (Clarholm and Rosengren-Brinck, 1995; Balota et al., 2003). The enzymatic activities and soil microbial populations preserve soil health and fertility by imparting alterations through their biochemical procedures (Nannipieri et al., 2003; Okore et al., 2012).
In India, post green revolution, intensive agriculture replaced subsistence farming. New cropping systems and farming systems were tested and have evolved across the country. In these cropping systems, rice–wheat systems and corn–wheat systems occupy a major part. Wheat is generally cultivated in the winter season due to its climatic requirements. Wheat is the essential cereal crop that fulfils the feed, food, fodder, and industrial needs globally. It is often cultivated in the alluvial soils of northwestern India (Luan et al., 2016). The corn–wheat cropping is extremely rigorous concerning about the removal of nutrients from the soil.
Under an intensive cropping system, farmers are utilizing especially nitrogen (N) and phosphorus (P) fertilizer in an uncontrolled and imbalanced manner, which results in creating a negative potassium (K) nutrient balance in the soil. High removal of K by the crop compared to the amount of K applied in the soil by farmers, and an imbalanced application of the NPK fertilizer leads to a huge amount of K excavation and insufficiency in soils and crops (Yousaf et al., 2017; Li et al., 2019). The input–output proportions of K in India showed negative K proportions (in 10,000 tonnes) among most of the states such as Haryana (−346), Uttar Pradesh (−931), and Punjab (−577). They also reported that less application of K contributes to nutrient excavation from the soil, which leads to depletion of soil fertility and may significantly limit crop yields in the future (Dutta et al., 2013; Dwevedi et al., 2017; Rajawat et al., 2020). Farmyard manure (FYM) is a decomposed mixture of dung, urine, litter, and leftover materials from roughages and fodder fed to animals. A well-decomposed FYM contains 0.5–1.5% N, 0.2–0.4% P2O5, and 0.5–1.0% K2O. FYM is a good source of organic carbon, which activates the biotic life of the soil flora and fauna. Ghoshal and Singh (1995) found an increase in soil microbial biomass carbon, nitrogen, and phosphorous in the soil applied with FYM. Using long-term experiments, Kaur and Benipal (2006) reported an increase in different forms of K when FYM was applied in the soil. A study was carried out by collecting surface soil (depth 0–15 cm) and foliar samples of various crops such as cotton, sugarcane, wheat, and rice crops intensively grown by farmers in the fields of India during 2004 and 2005 and reported widespread deficiency K in the soils and crops (Singh and Bansal, 2009). Similarly, based on the Soil Health Card database derived from eight districts of different agroclimatic zones of India, most of the districts' average plant-available K status (kg K2O ha−1) was medium to low in their K status (Patra et al., 2017).
Potassium is the most crucial macronutrient for plant development and crop yield. Many crops take up a substantial quantity of K through their roots from the soil (Steingrobe and Claassen, 2000). Potassium contributes a vital role for antagonistic and synergistic interactions with other nutrients (Dibb and Thompson, 1985). Potassium amends root development, increases tolerance to drought, increases nutrient assimilation and translocation, produces starch and protein–enriched grain, and decreases crop lodging and diseases (Dobermann, 2001; Polara et al., 2009; Nejad et al., 2010).
The current study was carried out to understand the influence of integrated K fertilization through FYM and muriate of potash (MOP) on soil microbial populations (bacterial population, K-solubilizing bacteria, P-solubilizing bacteria, actinomycetes, and cellulose-degrading bacteria), soil enzyme activities (dehydrogenase, fluorescein diacetate (FDA), β-glucosidase, and acid and alkaline phosphatase), available nutrients (nitrogen, phosphorus, and potassium), and yield parameters of wheat crop (grain, straw, and biological) in farm field condition under the corn–wheat cropping system. This study might be beneficial to contribute to soil reclamation and improve crop productivity with low input cost value for sustainable agriculture.
The field trials were performed in wheat during the winter season and in corn during the rainy season in the first and second years at the farm field of ICAR-Indian Agricultural Research Institute, New Delhi (India) (28.35 N, 77.12 E). During the cultivation period in the first and second years of corn cultivation, the maximum and minimum temperatures ranged between 38.5°C and 19.8°C, and 38.2°C and 22.0°C, respectively. In the first year, the daily maximum and minimum temperatures during the period of wheat cultivation were 35.4 C and 2.0°C, whereas in the second year, these were 0 and 39.0°C, respectively. The wheat crop encountered 65.6 mm of rainfall, having 11 rainy days in the first year, and 40.8 mm of rainfall, having 4 rainy days in the second year.
The soils from experimental fields were characterized as sandy loam, and the characteristics are as follows: EC, 0.43 ± 0.02 dS m−1; pH, 8.0 ± 0.2; available N, 173.30 ± 8.45 kg ha−1; available K, 261.00 ± 12.40 kg ha−1; organic carbon, 0.40 ± 0.03% (w/w); and available P, 13.80 ± 0.72 kg ha−1. The field study was performed at fixed sites in a randomized block design in triplicates and seven treatments. Different treatments designed for corn (C) during the rainy season and wheat (W) during the winter season are given in Table 1. Recommended doses of nitrogen (120 kg N ha−1) and phosphorus (26 kg P ha−1) were used for wheat by introducing chemical fertilizers—urea and diammonium phosphate, respectively. The full dose of potassium (K) and phosphorus (P) was employed as basal, whereas nitrogen (50 kg N ha−1) was employed as basal, and the rest 100 kg N ha−1 was employed in equal split doses after 30 and 60 days of sowing (Nejad et al., 2010). FYM and MOP were employed as the sources of K. The recommended dose for wheat was applied—120 kg N ha−1 and 26 kg P ha−1 through urea and diammonium phosphate (DAP), respectively. FYM was examined for N, P, and K content that showed 5.46 ± 0.13 g N kg−1, 4.32 ± 0.09 g P kg−1, and 5.51 ± 0.17 g K kg−1 for the first year and 6.34 ± 0.17 g N kg−1, 4.23 ± 0.07 g P kg−1, and 4.43 ± 0.11 g K kg−1 for the second year in field, respectively, where FYM was applied as a source of fertilizer. The quantity of N, P, and K employed by urea, DAP, and FYM was maintained among treatments for maintaining the recommended doses of N, P, and K according to the designed experiments. The final quantity of N, P, and K was introduced in the field during corn and wheat crop cultivation, as mentioned in Table 1. The corn hybrid variety “PEHM2” (CM137 × CM138) was selected for the present study and sown with a seed rate of 20 kg seed ha−1 and spacing at 60 × 20 cm maintained. The wheat variety “HD 2967” was used in this study with a seed rate of 100 kg seed per hactare and maintained the spacing at 22.50 × 5.00 cm. The wheat variety “HD 2967” tolerant to rust, with a moderate level of tolerance to the Ug99 race of stem rust, was used for the present study.
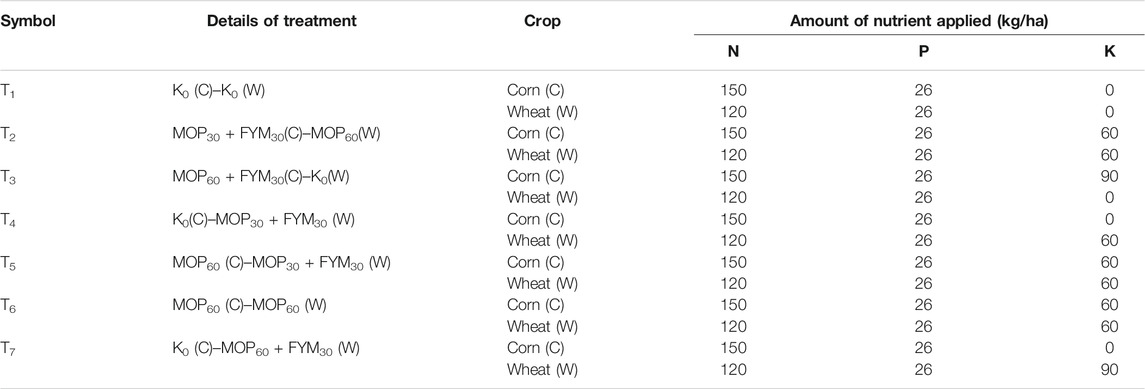
TABLE 1. Experimental design of different treatments using FYM for integrated potassium fertilization under the corn–wheat cropping system.
The soil samples were collected from the rhizospheric regions of the root at crop maturity to examine the influence of integrated potassium application on microbial populations and enzymatic activities. The microbial population count was performed through serial dilution followed by spreading on respective agar plates. We analyzed the total bacterial population, P-solubilizing bacteria, actinomycetes, K-solubilizing bacteria, and cellulose-degrading bacteria using nutrient agar, Pikovskaya agar, Kenknight and Munaier's agar, Aleksandrov medium, and carboxymethyl cellulose agar media, respectively.
FDA and dehydrogenase activities were performed by following the method of Green et al. (2006) and Klein et al. (1971), respectively. We analyzed the alkaline and acid phosphatase activities using the standard spectrophotometric method (Tabatabai and Bremner, 1969). The β-glucosidase activity was analyzed using the standard spectrophotometric method (Eivazi and Tabatabai, 1988).
Soil samples were collected from each plot of the experimental field, mixed, air dried, sieved, and analyzed for the amount of available N using the alkaline KMnO4 method (Subbaiah, 1956), 0.5 N sodium-bicarbonate– extractable P (Olsen, 1954), and 1.0 N Ammonium Acetate-extractable K (Jackson, 1973).
Wheat harvesting was done manually in an area of 4.5 m2 from the center point of each plot. The dry weight of grains and stems was calculated individually. The straw and grain yield were analyzed by calculating the weight of the dried plant and further converted into tons per hectare.
The cumulative response of integrated K fertilization on soil health and wheat yield was estimated by the analysis of interactions among the various parameters (microbial population count, soil enzymatic activities, nutrients availability, and yield of wheat) and treatments studied. The statistical analysis was carried out using the data for each year separately and also analyzing the overall effect of integrated K-fertilization by using the data of both years of wheat cultivation.
The obtained results were analyzed by employing the analysis of variance (ANOVA) technique for randomized block design (Gomez and Gomez, 1984). The least significant difference among the triplicates at p ≤ 0.05 probability was calculated and shown as error bars. The principal component analysis and scatter plot matrix were performed through Origin Pro 9.0 software, OriginLab Corporation, United States. The heat map for the expression of various activities among treatments was prepared through Graphpad Prism 7.0 software, San Diego, California.
The maximum bacterial population count was recorded as 1.03 × 10⁸ and 1.15 × 10⁸ cfu g soil−1 in treatment T7 during the first and second years of cultivation, respectively. Treatments T4 (0.99 × 10⁸ cfu g soil−1) and T5 (0.95 × 10⁶ cfu g soil−1) were recorded on a par with each other and had a higher bacterial population count than the other treatments during the first year of cultivation. Treatment T1 was recorded the least for the bacterial population count in the first (0.48 × 10⁸ cfu g soil−1) and second (0.52 × 10⁸ cfu g soil−1) years of cultivation; while in the second year of cultivation, treatment T5 was recorded as the second most promising treatment for the bacterial population count (1.0 × 10⁸ cfu g soil−1), followed by T4 (0.94 × 10⁸ cfu g soil−1), T2 (0.86 × 10⁸ cfu g soil−1), and T6 (0.79 × 10⁸ cfu g soil−1). In this study, the bacterial population count was significantly improved through integrated fertilization of K in the combination of MOP and FYM among the treatments T4 (106.25 and 80.80%), T5 (97.92 and 92.30%), and T7 (114.58 and 121.20%) as compared to treatment T1 during the first and second years of wheat cultivation, respectively (Figure 1A).
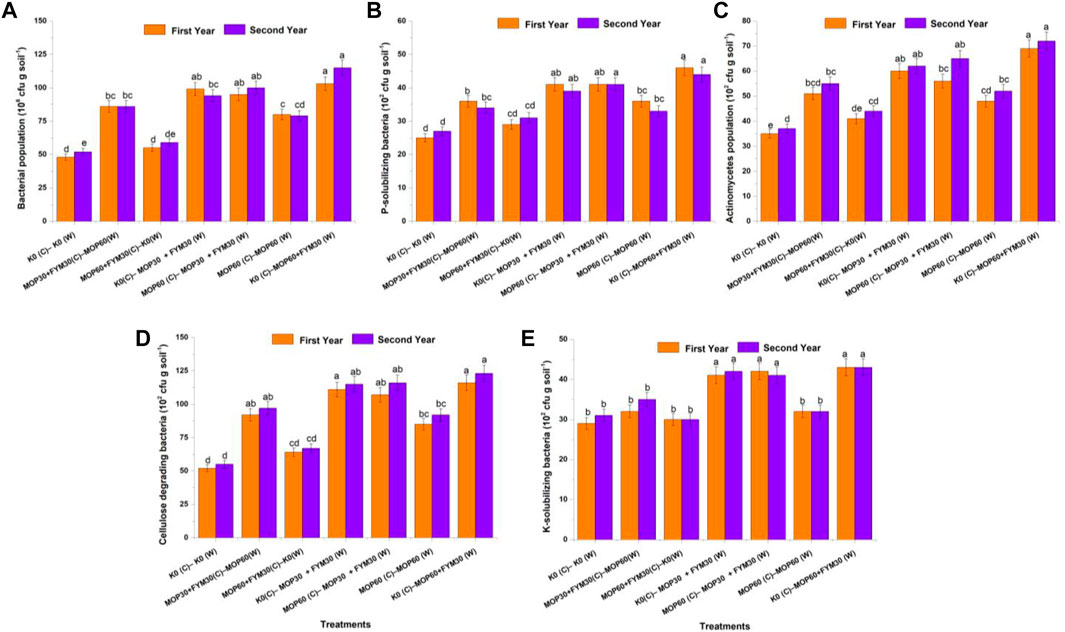
FIGURE 1. Effect of integrated K application on microbial population count among treatments: bacterial population (A); P-solubilizing bacteria (B); actinomycetes (C); cellulose-degrading bacteria (D); and K-solubilizing bacteria (E).
The population of P-solubilizing bacteria was recorded as the highest (0.46 × 10⁴ and 0.44 × 10⁴ cfu g soil−1) in treatment T7 during the first and second years of cultivation, respectively; while treatments T4 (0.41 × 10⁴ and 0.39 × 10⁴ cfu g soil−1) and T5 (0.41 × 10⁴ and 0.41 × 10⁴ cfu g soil−1) were recorded on a par with each other during the first and second years of cultivation and improved the colonization of P-solubilizing bacteria in rhizospheric soil in comparison to other treatments, respectively. The least P-solubilizing bacterial count was recorded in treatment T1 during the first (0.25 × 10⁴ cfu g soil−1) and second (0.27 × 10⁴ cfu g soil−1) years of cultivation. Treatments T4 (0.41 × 10⁴ and 0.39 × 10⁴ cfu g soil−1) and T5 (0.41 × 10⁴ and 0.41 × 10⁴ cfu g soil−1) were jointly the second most effective treatment for improving P-solubilizing bacterial count followed by T6 (0.36 × 10⁴ and 0.33 × 10⁴ cfu g soil−1) and T2 (0.36 × 10⁴ and 0.34 × 10⁴ cfu g soil−1) during both the years of wheat cultivation, respectively. In this study, the P-solubilizing bacterial count was significantly improved through integrated fertilization of K in the combination of MOP and FYM among treatments T4 (64.00 and 44.00%), T5 (64.00 and 52.00%), and T7 (84.00 and 63.00%) as compared to treatment T1 during the first and second years of wheat cultivation, respectively (Figure 1B).
The population count of actinomycetes was recorded maximum (0.69 × 10⁴ and 0.72 × 10⁴ cfu g soil−1) in treatment T7 during the first and second years of cultivation, respectively. In the first year of wheat cultivation, treatment T4 (0.60 × 10⁴ cfu g soil−1) was recorded as the second most effective as compared to T1 (0.60 × 10⁴ cfu g soil−1), followed by T5 (0.56 × 10⁴ cfu g soil−1), T2 (0.51 × 10⁴ cfu g soil−1), and T6 (0.48 × 10⁴ cfu g soil−1); while in the second year of cultivation, treatments T4 (0.62 × 10⁴ cfu g soil−1) and T5 (0.65 × 10⁴ cfu g soil−1) were recorded on a par with each other and had no significant differences. The least actinomycetes population was recorded in treatment T1 (0.35 × 10⁴ and 0.37 × 10⁴ cfu g soil−1) in the first and second years of cultivation, respectively. In this study, the population count of actinomycetes was significantly improved through integrated fertilization of K in the combination of MOP and FYM among the treatments T4 (71.43 and 67.60%), T5 (60.0 and 75.70%), and T7 (97.14 and 94.60%) as compared to treatment T1 during the first and second years of wheat cultivation, respectively (Figure 1C).
In the first year of wheat cultivation, the population of cellulose-degrading bacteria was recorded the maximum in treatment T7 (1.16 × 10⁴ cfu g soil−1) and T4 (1.11 × 10⁴ cfu g soil−1) followed by T5 (1.07 × 10⁴ cfu g soil−1), T2 (0.92 × 10⁴ cfu g soil−1), and T6 (0.85 × 10⁴ cfu g soil−1); while during the second year of cultivation, treatment T7 was recorded as the maximum population of cellulose-degrading bacteria (1.23 × 10⁴ cfu g soil−1). The population of cellulose-degrading bacteria in treatments T4 (1.15 × 10⁴ cfu g soil−1) and T5 (1.16 × 10⁴ cfu g soil−1) was on a par with each other. The least population of cellulose-degrading bacteria was recorded in treatment T1 (0.52 × 10⁴ and 0.55 × 10⁴ cfu g soil−1, respectively) during the first and second years of wheat cultivation. In this study, the population count of cellulose-degrading bacteria was significantly increased through integrated fertilization of K in the combination of MOP and FYM among treatments T4 (113.50 and 109.10%), T5 (105.80 and 110.90%), and T7 (123.10 and 123.60%) as compared to treatment T1 during the first and second years of wheat cultivation, respectively (Figure 1D).
The highest population of K-solubilizing bacteria was recorded in treatments T7 (0.43 × 10⁴ cfu g soil−1 for each), T4 (0.41 × 10⁴ and 0.42 × 10⁴ cfu g soil−1), and T5 (0.42 × 10⁴ and 0.41 × 10⁴ cfu g soil−1) during the first and second years of wheat cultivation, respectively. The least population of K-solubilizing bacteria was recorded in treatments T1 (0.29 × 10⁴ cfu g soil−1) and T3 (0.30 × 10⁴ cfu g soil−1) during the first and second years of cultivation, respectively. In this study, the population count of K-solubilizing bacteria was significantly increased through integrated fertilization of K in the combination of MOP and FYM among treatments T4 (41 and 35%), T5 (45 and 32%), and T7 (48 and 39%) as compared to treatment T1 during the first and second years of wheat cultivation, respectively (Figure 1E).
The soil dehydrogenase activity was recorded the maximum in treatment T7 (142.0 ± 7.1 and 167.0 ± 8.35 μg TPF g soil−1 d−1), followed by T4 (128.0 ± 6.4 and 152.0 ± 7.6 μg TPF g soil−1 d−1) and T5 (129.0 ± 6.45 and 152.0 ± 7.6 μg TPF g soil−1 d−1) during the first and second years of cultivation, respectively. The least dehydrogenase activity was recorded in treatments T1 (65.0 ± 3.25 and 72.0 ± 3.6 μg TPF g soil−1 d−1) and T3 (75.0 ± 3.75 and 83.0 ± 4.15 μg TPF g soil−1 d−1) during the first and second years of cultivation, respectively. In this study, dehydrogenase activity was significantly improved through integrated fertilization of K in the combination of MOP and FYM among treatments T4 (96.92 and 111.11%), T5 (98.46 and 111.11%), and T7 (118.46 and 131.94%) as compared to treatment T1 during the first and second years of cultivation, respectively (Figure 2A).
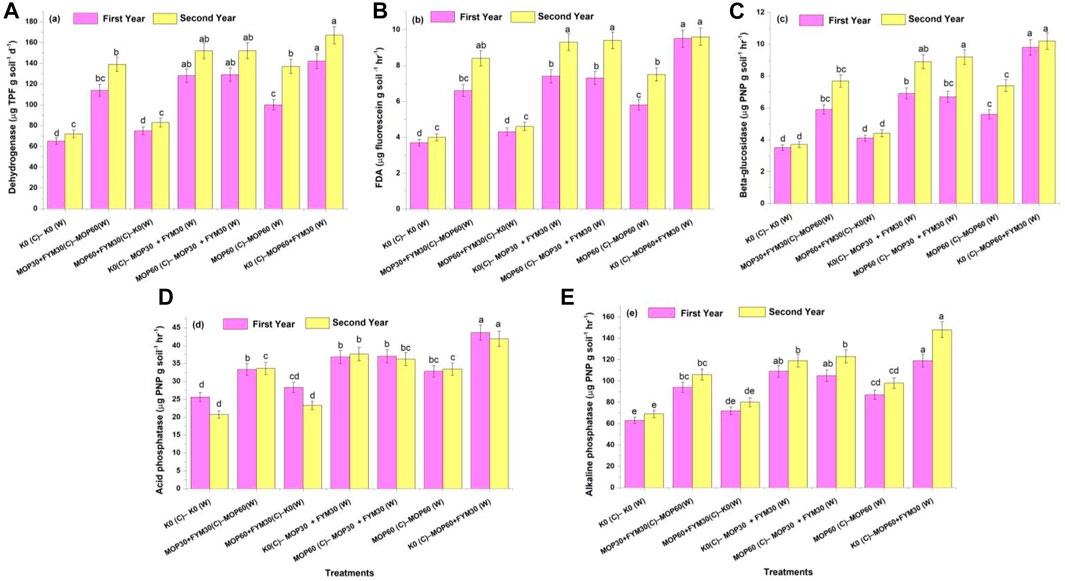
FIGURE 2. Effect of integrated K application on soil enzymatic activities among treatments: dehydrogenase activity (A); FDA activity (B); beta-glucosidase activity (C); acid phosphatase activity (E); and alkaline phosphatase activity (E).
The soil FDA activity was recorded the maximum in treatment T7 (9.5 ± 0.48 μg fluorescein g soil−1 h−1) followed by T4 (7.4 ± 0.37 μg fluorescein g soil−1 h−1), T5 (7.3 ± 0.36 μg fluorescein g soil−1 h−1), and T2 (6.6 ± 0.33 μg fluorescein g soil−1 h−1) during the first year of wheat cultivation. Treatment T7 (9.6 ± 0.48 μg fluorescein g soil−1 h−1), T5 (9.4 ± 0.47 μg fluorescein g soil−1 h−1), and T4 (9.3 ± 0.46 μg fluorescein g soil−1 h−1) were recorded for the maximum FDA activity during the second year of wheat cultivation. In this study, the FDA activity was significantly increased through integrated fertilization of K in the combination of MOP and FYM among treatments T4 (100.00 and 132.50%), T5 (97.30 and 135.00%), and T7 (156.76 and 140.00%) as compared to treatment T1 during the first and second years of cultivation, respectively (Figure 2B).
The β-glucosidase activity was recorded the maximum in treatment T7 (9.8 ± 0.49 and 10.2 ± 0.51 µg PNP g soil−1 h−1), followed by T5 (6.7 ± 0.34 and 9.2 ± 0.46 µg PNP g soil−1 h−1), T4 (6.9 ± 0.35 and 8.9 ± 0.45 µg PNP g soil−1 h−1), and T2 (5.9 ± 0.30 and 7.7 ± 0.39 µg PNP g soil−1 h−1) during the first and second years of wheat cultivation, respectively. In this study, the β-glucosidase activity was significantly increased through integrated fertilization of K in the combination of MOP and FYM among the treatments T4 (97.14 and 140.54%), T5 (91.43 and 148.65%), and T7 (180.00 and 175.68%) as compared to treatment T1 during the first and second years of cultivation, respectively (Figure 2C).
The acid phosphatase activity was recorded the maximum in treatment T7 (43.6 ± 2.18 and 41.9 ± 2.10 µg PNP g soil−1 h−1), followed by T4 (36.8 ± 1.84 and 37.6 ± 1.88 µg PNP g soil−1 h−1), T5 (37.0 ± 1.85 and 36.2 ± 1.81 µg PNP g soil−1 h−1), T2 (33.3 ± 1.68 and 33.6 ± 1.66 µg PNP g soil−1 h−1), and T6 (32.8 ± 1.67 and 33.4 ± 1.64 µg PNP g soil−1 h−1) during the first and second years of wheat cultivation, respectively. The ANOVA showed that the acid phosphatase activity was significantly increased through integrated fertilization of K in the combination of MOP and FYM among treatments T4 (43.75 and 81.64%), T5 (44.53 and 74.88%), and T7 (70.31 and 102.42%) as compared to treatment T1 during the first and second years of cultivation, respectively (Figure 2D).
The alkaline phosphatase activity was recorded the maximum in treatment T7 (119.0 ± 5.95 and 148.0 ± 7.40 µg PNP g soil−1 h−1), followed by T5 (105.0 ± 5.25 and 123.0 ± 6.15 µg PNP g soil−1 h−1), T4 (109.0 ± 5.45 and 119.0 ± 5.95 µg PNP g soil−1 h−1), T2 (94.0 ± 4.7 and 106.0 ± 5.3 µg PNP g soil−1 h−1), and T6 (87.0 ± 4.35 and 98.0 ± 4.9 µg PNP g soil−1 h−1) during the first and second years of wheat cultivation, respectively. In this study, the alkaline phosphatase activity was significantly increased through integrated fertilization of K in the combination of MOP and FYM among the treatments T4 (73.02 and 72.46%), T5 (66.67 and 78.26%), and T7 (88.89 and 114.49%) as compared to treatment T1 during the first and second years of cultivation, respectively (Figure 2E).
During the first year of wheat cultivation, the availability of nitrogen through integrated fertilization of K among treatments T2 (177.90 ± 8.90 kg N ha−1), T3 (175.20 ± 8.76 kg N ha−1), T4 (174.30 ± 8.72 kg N ha−1), and T5 (175.40 ± 8.8.77 kg N ha−1) was recorded higher than treatment T1 (163.50 ± 8.18 kg N ha−1) and had no significant differences with each other. But, treatment T7 (167.50 ± 8.38 kg N ha−1) had no significant increment of available N compared to treatment T1. During the second year of wheat cultivation, a similar trend for enhancement of available N was recorded among the treatments and enhanced availability of N in treatment T7 (173.60 ± 8.68 kg N ha−1) compared to T1 (151.20 ± 7.56 kg N ha−1). In this study, we observed that the enhancement of available N was significantly higher during the second year of cultivation than in the first year of cultivation. The amount of available nitrogen declined in the second year compared to the first year of wheat cultivation. In this study, available N was significantly increased through integrated fertilization of K in the combination of MOP and FYM among treatments T4 (6.60 and 17.79%), T5 (7.24 and 19.20%), and T7 (2.43 and 14.79%) as compared to treatment T1 during the first and second years of cultivation, respectively (Figure 3A).
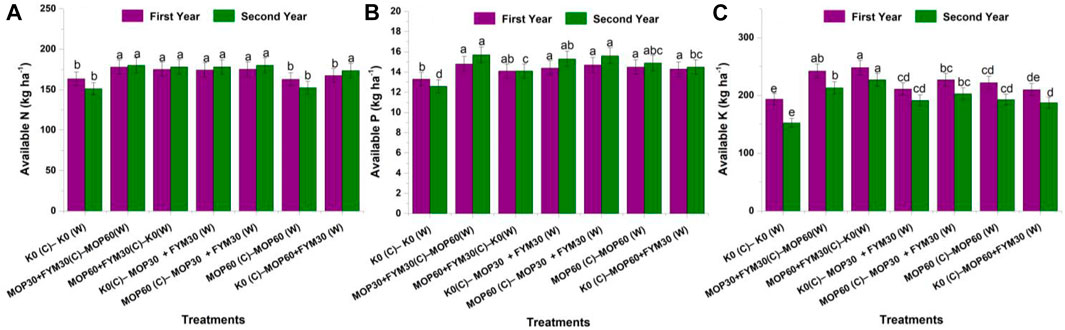
FIGURE 3. Effect of integrated K application on nutrients availability in soil among treatments: available N (A), available P (B), and available K (C).
The amount of available P in soil was recorded the maximum in treatment T2 (14.80 ± 0.74 kg P ha−1), followed by treatment T5 (14.70 ± 0.73 kg P ha−1), T4 (14.40 ± 0.72 kg P ha−1), T6 (14.50 ± 0.72 kg P ha−1), and T7 (14.30 ± 0.71 kg P ha−1) during the first year of wheat cultivation. But there was no significance with each other. Integrated fertilization in the combination of MOP and FYM (T4, T5, and T7) showed a significant difference compared to treatment T1 (13.30 ± 0.67 kg P ha−1). Besides, during the second year of wheat cultivation, the highest amount of available phosphorus was recorded in treatment T2 (15.70 ± 0.78 kg P ha−1), followed by treatments T5 (15.60 ± 0.78 kg P ha−1), T4 (15.30 ± 0.76 kg P ha−1), T6 (14.90 ± 0.74 kg P ha−1), and T7 (14.50 ± 0.72 kg P ha−1). In the current study, the amount of available phosphorus declined in the second year compared to the first year of wheat cultivation. But we observed that the enhancement of available phosphorus was significantly higher during the second year of cultivation than in the first year of cultivation. In this study, available phosphorus was significantly increased through integrated fertilization of K in the combination of MOP and FYM among treatments T4 (8.79 and 21.75%), T5 (10.80 and 23.87%), and T7 (7.79 and 15.38%) as compared to treatment T1 during the first and second years of cultivation, respectively (Figure 3B).
Available K in soil was recorded the maximum in treatment T3 (248.30 ± 12.42 kg K ha−1), followed by treatment T2 (242.30 ± 12.12 kg K ha−1), T5 (227.10 ± 11.36 kg K ha−1), T6 (222.00 ± 11.10 kg K ha−1), and T7 (210.00 ± 10.50 kg K ha−1) during the first year of wheat cultivation. During the second year of wheat cultivation, the available K was recorded significantly the highest in treatment T3 (227.00 ± 11.35 kg K ha−1), followed by treatment T2 (213.00 ± 10.65 kg K ha−1), T5 (202.90 ± 10.15 kg K ha−1), and T4 (191.40 ± 9.57 kg K ha−1). Treatments T4 and T6 did not show significant differences from each other. In the current study, the amount of available K declined in the second year compared to the first year of wheat cultivation. But we observed that the enhancement of available K was significantly higher during the second year of cultivation than in the first year of cultivation. In this study, available K was significantly increased through integrated fertilization of K in the combination of MOP and FYM among treatments T4 (9.02 and 25.56%), T5 (17.23 and 33.06%), and T7 (8.44 and 22.87%) as compared to treatment T1 during the first and second years of cultivation, respectively (Figure 3C).
The grain yield of wheat was recorded the maximum in treatment T7 (5.39 ± 0.27 and 5.49 ± 0.27 t ha−1), followed by T5 (5.05 ± 0.25 and 5.16 ± 0.26 t ha−1), T4 (5.15 ± 0.26 and 5.25 ± 0.26 t ha−1), and T2 (4.94 ± 0.25 and 5.05 ± 0.25 t ha−1) during the first and second years of wheat cultivation, respectively. But in the first and second years of wheat cultivation, treatments T5, T4, and T2 did not show significant differences with each other. The least grain yield of wheat was recorded in treatment T1 (5.39 ± 0.27 and 5.39 ± 0.27 t ha−1) during both years of cultivation. Among the treatments, the grain yield of wheat was higher in the second year of cultivation than in the first year of cultivation. In this study, the grain yield of wheat was significantly increased through integrated fertilization of K in the combination of MOP and FYM among treatments T4 (35.48 and 35.05%), T5 (32.94 and 32.76%), and T7 (41.71 and 41.14%) as compared to treatment T1 during the first and second years of cultivation, respectively (Figure 4A).
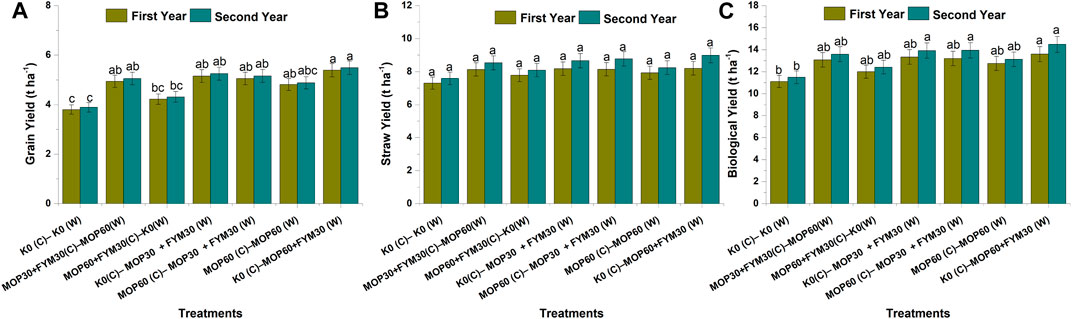
FIGURE 4. Effect of integrated K application on various yield parameters among treatments: grain yield (A), straw yield (B), and biological yield (C).
The straw yield of wheat was recorded the maximum in treatment T7 (8.20 ± 0.41 and 8.98 ± 0.45 t ha−1), followed by T5 (8.14 ± 0.41 and 8.77 ± 0.44 t ha−1), T4 (8.18 ± 0.41 and 8.66 ± 0.43 t ha−1), and T2 (8.13 ± 0.41 and 8.53 ± 0.43 t ha−1) during the first and second years of wheat cultivation, respectively. But in the first and second years of wheat cultivation, there was no significant difference with each other among the treatments. Low straw yield of wheat was recorded in treatment T1 (7.30 ± 0.37 and 7.59 ± 0.38 t ha−1) during both years of cultivation. Among the treatments, the straw yield of wheat was higher in the second year of cultivation than in the first year of cultivation. In this study, the straw yield of wheat was significantly increased through integrated fertilization of K in the combination of MOP and FYM among treatments T4 (12.09 and 14.05%), T5 (11.57 and 15.51%), and T7 (12.39 and 18.24%) as compared to treatment T1 during the first and second years of cultivation, respectively (Figure 4B).
The biological yield of wheat was recorded the maximum in treatment T7 (13.59 ± 0.68 t ha−1), followed by T5 (13.19 ± 0.66 t ha−1), T4 (13.33 ± 0.67 t ha−1), and T2 (13.07 ± 0.65 t ha−1) during the first year of cultivation. But, treatments T5, T4, T2, and T6 did not show significant differences with each other. Besides, the biological yield of wheat during the second year of cultivation was recorded the maximum in treatment T7 (14.47 ± 0.72 t ha−1), followed by T5 (13.93 ± 0.70 t ha−1), T4 (13.91 ± 0.70 t ha−1), and T2 (13.58 ± 0.68 t ha−1). Although treatments T7, T5, and T4 did not show significant differences with each other. The least biological yield of wheat was recorded in treatment T1 during both years of cultivation. Among the treatments, the biological yield of wheat was higher in the second year of cultivation than in the first year of cultivation. In this study, the biological yield of wheat was significantly increased through integrated fertilization of K in the combination of MOP and FYM among the treatments T4 (13.33 and 21.16%), T5 (13.19 and 21.35%), and T7 (13.59 and 26.00%) as compared to treatment T1 during the first and second years of cultivation, respectively (Figure 4C).
The response of integrated K fertilization among the treatments and various parameters were analyzed through the principal component analysis and scatter plot matrix. The statistical analysis showed that data for the first year of cultivation possess two significant principal components, PC1 and PC2. Among them, PC1 showed a 97.80% level of variance and was more effective than PC2 that showed a 2.05% level of variance (Figure 5A). In the biplot graph, treatments were grouped into two clusters. The grouping among treatments strictly showed that the treatments (T7, T4, and T5) employed with FYM (cluster I) and treatments (T1, T2, T3, and T6) employed without FYM (cluster II) were found as separate clusters in the first year of wheat cultivation. The details of both clusters are: cluster I [K0(C)–MOP30 + FYM30 (W), MOP60 (C)–MOP30 + FYM30 (W), and K0 (C)–MOP60 + FYM30 (W)] and cluster II [K0 (C)–K0 (W), MOP30 + FYM30(C)–MOP60(W), MOP60 + FYM30(C)–K0(W), and MOP60 (C)–MOP60 (W)]. Although, cluster I was positively correlated with PC1 and negatively correlated with PC2, cluster II was positively correlated with both the principal components PC1 and PC2. However, various parameters were grouped into four clusters. The details of the obtained clusters are: cluster I (available N and available K); cluster II (alkaline phosphatase, dehydrogenase, bacterial population, and cellulose-degrading bacteria); cluster III (actinomycetes); and cluster IV (acid phosphatase, K-solubilizing bacteria, phosphate-solubilizing bacteria, beta-glucosidase, FDA, available phosphorus, grain yield, straw yield, and biological yield). Cluster I and cluster II were positively correlated with PC1, while cluster I showed a positive correlation with PC2 and cluster II was negatively correlated with PC2. Cluster III showed a negative correlation with both PC1 and PC2. Cluster IV showed a negative correlation with PC1 and a positive correlation with PC2. Moreover, integrated fertilization of K through FYM along with MOP contributed to significantly improve the available K, available N, alkaline phosphatase, bacterial population, dehydrogenase activity, and population of cellulose-degrading bacteria (Figure 5A). The scatter plot matrix for the first year of cultivation showed that the treatments applied with FYM along with MOP (T7, T4, and T5) and the various parameters (microbial population count, soil enzymatic activities, available nutrients in soil, and yield of wheat) showed strict regression coefficient (r2) > 0.98. Based on the response on various parameters, the regression coefficient between the treatments applied with MOP and FYM were 0.99 (T7 and T4), 0.98 (T7 and T5), and 0.99 (T4 and T5), while the regression coefficient (r2) among the treatments applied without MOP and FYM varied from 0.83 to 0.98. Moreover, the regression coefficients (r2) among the treatments applied with MOP only were less than treatments used with MOP and FYM (Figure 5B). The integrated K-fertilization through MOP and FYM showed significant improvement among various parameters (microbial population count, soil enzymatic activities, available nutrients in soil, and wheat yield). The scatter plot matrix analysis revealed that integrated K fertilization applied with MOP and FYM was more promising to improve soil health and agricultural productivity than fertilization through MOP only or without MOP and FYM.
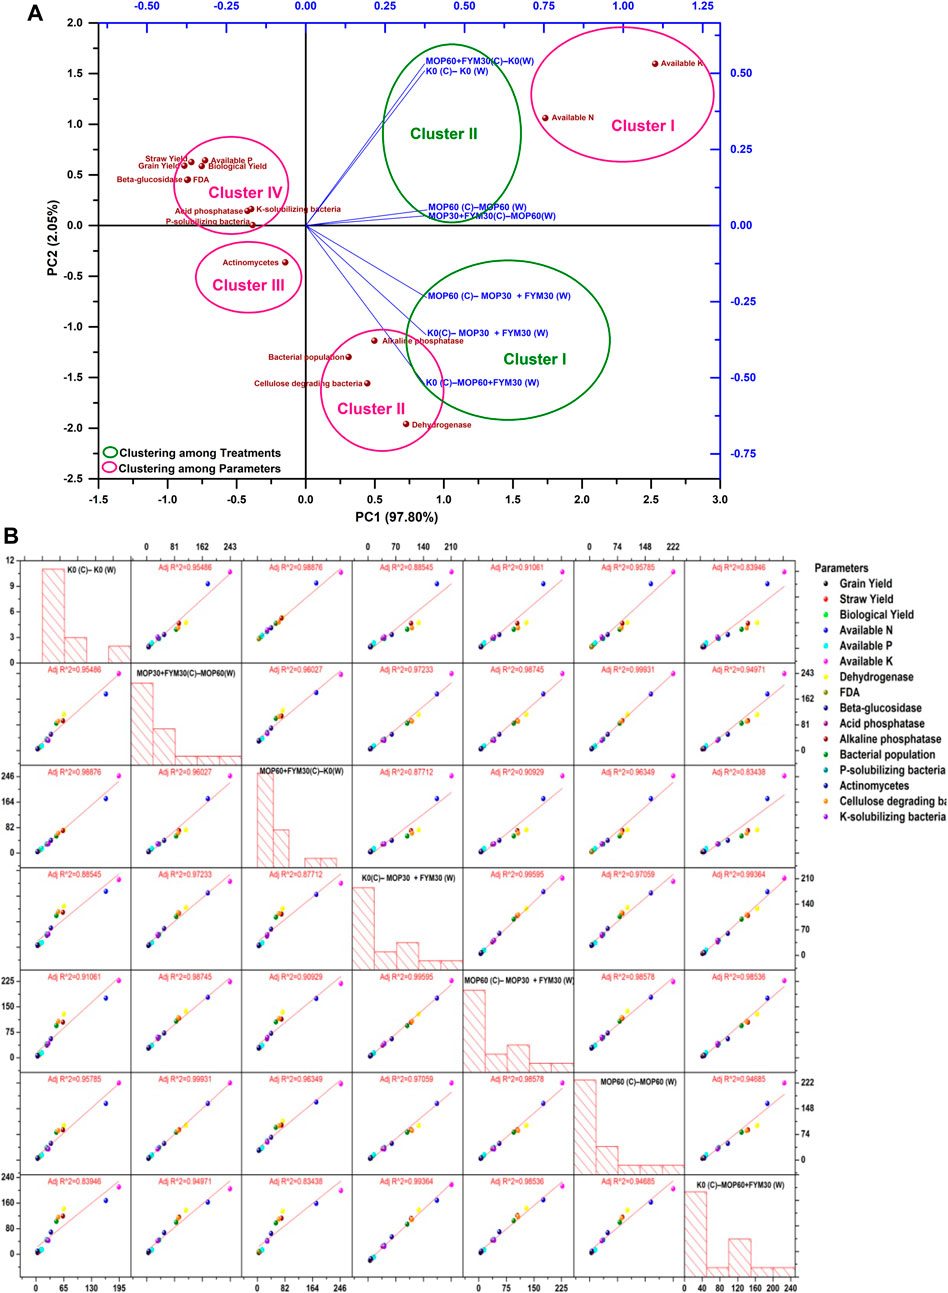
FIGURE 5. (A) Principal component analysis among various parameters and treatments in the first year of wheat cultivation. (B) Scatter plot matrix and regression analysis among various parameters and treatments in the first year of wheat cultivation.
The effect of integrated K fertilization among the treatments and various parameters was further analyzed for the second year of cultivation through the principal component analysis and scatter plot matrix. The statistical analysis showed that there were two significant principal components, PC1 and PC2. PC1 showed a 97.20% level of variance and was more significant than PC2 that showed a 2.46% level of variance (Figure 6A). In the biplot graph, treatments were grouped into two clusters. The grouping among treatments strictly showed that the treatments employed with FYM except for treatment T6 (cluster I) and treatments employed without FYM (cluster II) were found as separate clusters. The details of the clusters are: cluster I [MOP60 (C)–MOP60 (W), K0(C)–MOP30 + FYM30 (W), MOP60 (C)–MOP30 + FYM30 (W), and K0 (C)–MOP60 + FYM30 (W)] and cluster II [K0 (C)–K0 (W), MOP30 + FYM30(C)–MOP60(W), and MOP60 + FYM30(C)–K0(W)]. Cluster I was positively correlated with PC1 and negatively correlated with PC2. Besides, cluster II was positively correlated with both principal components PC1 and PC2. However, various parameters were grouped into four clusters. The details of the obtained clusters are: cluster I (available K and available N), cluster II (alkaline phosphatase, dehydrogenase, bacterial population, and cellulose-degrading bacteria), cluster III (actinomycetes and acid phosphatase), and cluster IV (K-solubilizing bacteria, phosphate-solubilizing bacteria, β-glucosidase, FDA, available phosphorus, grain yield, straw yield, and biological yield). Both cluster I and cluster II were positively correlated with PC1, while cluster I showed a positive correlation with both PC2 and cluster II showed a negative correlation with PC2. Cluster III showed a negative correlation with both PC1 and PC2. Cluster IV showed a negative correlation with PC1 and a positive correlation with PC2. Moreover, integrated fertilization of K through FYM along with MOP in the second year of wheat cultivation also significantly improved the available K, available N, alkaline phosphatase, bacterial population, dehydrogenase activity, and population of cellulose-degrading bacteria (Figure 6A). The scatter plot matrix for the second year of cultivation showed that the treatments applied with FYM along with MOP (T7, T4, and T5) and the various parameters (microbial population count, soil enzymatic activities, available nutrients in soil, and yield parameters of wheat) also exhibited strict regression coefficient (r2) > 0.98 similar to the first year of cultivation (Figure 6B). Based on the response on various parameters, the regression coefficient (r2) for the second year of cultivation between the treatments applied with MOP and FYM were 0.98 (T7 and T4), 0.98 (T7 and T5), and 0.99 (T4 and T5), while the regression coefficient (r2) among the treatments applied without MOP and FYM varied from 0.77 to 0.98. Moreover, the regression coefficient (r2) between the treatments applied with MOP only was less than that between treatments used with MOP and FYM (Figure 6B). The integrated K fertilization through MOP and FYM showed significant improvement among various parameters (microbial population count, soil enzymatic activities, available nutrients in soil, and yield parameters of wheat). The scatter plot matrix analysis revealed that integrated K fertilization applied with MOP and FYM was also prominent in the second year of wheat cultivation and contributed to reclaim biological activities and productivity of soil compared to fertilization through MOP only or without MOP and FYM.
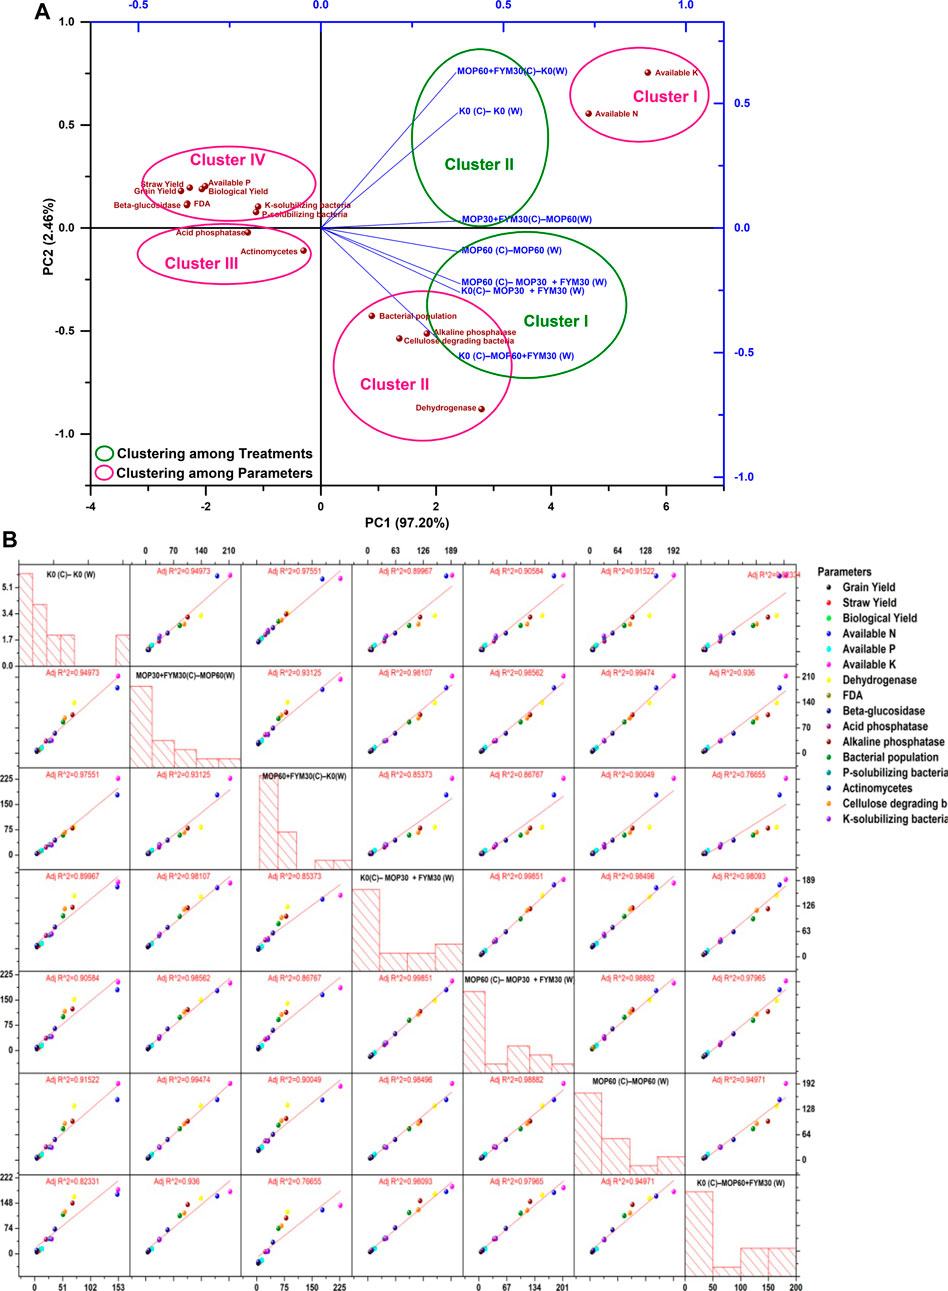
FIGURE 6. (A) Principal component analysis among various parameters and treatments in the second year of wheat cultivation. (B) Scatter plot matrix and regression analysis among various parameters and treatments in the second year of wheat cultivation.
Moreover, the integrated fertilization of K through MOP and FYM showed that the cultivation of wheat crop in the consecutive two years recorded an enhancement in soil enzymatic activities (11.59–57.22%), microbial populations (5.14–15.70%), available nutrients in the soil (7.60–16.54%), and crop yield (1.06–5.85%) during the second year of cultivation as compared to the first year of cultivation. In the second year of cultivation, the bacterial population count (6.57% by T7), actinomycetes population (15.70% by T5), and cellulose-degrading bacteria (5.14% by T5 and 0.56% by T7) were enhanced. The enzymatic activities were also enhanced, such as dehydrogenase (14.19% by T4, 12.65% by T5, and 13.48% by T7), FDA (32.50% by T4 and 37.70% by T5), β-glucosidase (43.40% by T4 and 57.22% by T5), acid phosphatase (37.89% by T4, 30.35% by T5, and 32.10% by T7), and alkaline phosphatase (11.59% by T4 and 25.60% by T5). Moreover, improved accessibility of nutrients in the soil (11.19% by T4, 11.97% by T5, and 12.37% by T7 for available N; 12.96% by T4, 13.07% by T5, and 7.60% by T7 for available P; 16.54% by T4, 15.82% by T5, and 14.53% by T7 for available K) was recorded (Figure 7).
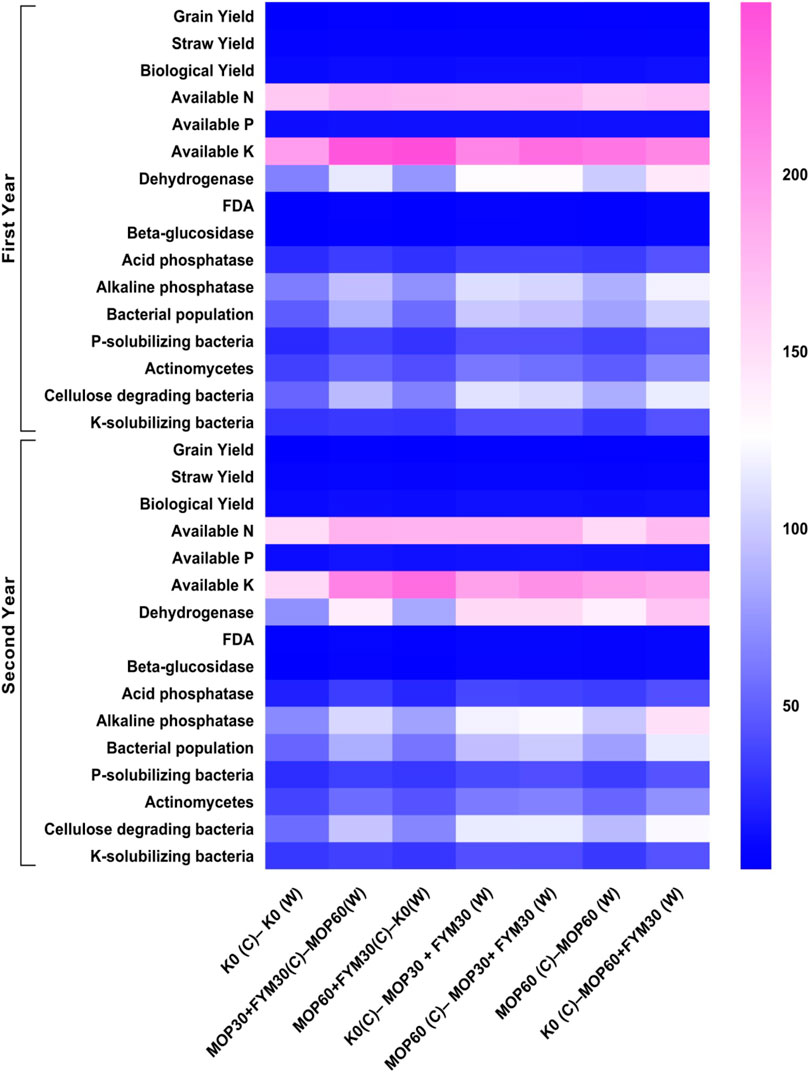
FIGURE 7. Expression pattern of various soil biological activities, available nutrients, microbial population, and yield of wheat for consecutive two years.
Microorganisms possess a high surface: volume ratio, because of which they exhibit intimate relationships with their native environments. A variation in microbial functioning in the soil is conceived as an index of soil reclamation and transient alterations to different perturbations (Pankhurst et al., 1995; Ezeokoli et al., 2020). In the present study, a significant enhancement of microbial communities like bacterial population, P-solubilizing bacteria, actinomycetes, K-solubilizing bacteria, and cellulose-degrading bacteria during the first and second years of wheat cultivation were found among treatments (T4, T5, and T7) employed with integrated K fertilization through FYM and MOP in comparison to treatments employed with K via MOP only and without K treatment (Figure 1). Among these, treatment T7 employed with 90 kg K ha−1 recorded the highest microbial population count for bacterial population (1.03 × 10⁸ and 1.15 × 10⁸ cfu g soil−1), P-solubilizing bacteria (0.46 × 10⁴ and 0.44 × 10⁴ cfu g soil−1), actinomycetes (0.69 × 10⁴ and 0.72 × 10⁴ cfu g soil−1), cellulose-degrading bacteria (1.16 × 10⁴ and 1.23 × 10⁴ cfu g soil−1), and K-solubilizing bacteria (0.43 × 10⁴ cfu g soil−1 each) during both years of cultivation. In comparison to chemical fertilizers, integrated fertilization of K showed the most prominent response on microbial activities and biomass. Firstly, the integrated fertilization of K furnished abounding organic matter for the growth and development of living soil microbial communities. Secondly, integrated fertilization of K showed a beneficial response for improving the growth of plant roots, which also imparted soil organic matter for microorganisms (Gong et al., 2009; Enebe and Babalola, 2020; Wu et al., 2020; Zhu et al., 2020).
Various enzymes in the soil contribute a significant role. Dehydrogenase activity is regarded the most prominent index of microbial activities, which occurs in viable cells only and indicates the sum of oxidative activities mediated by soil microfauna (Nannipieri et al., 1990). The dehydrogenase activity was increased due to integrated K management treatments, as dehydrogenase activity is influenced by the amount of organic matter included in the soils (Pancholy and Rice, 1973; Meena and Rao, 2021). Thus, integrated K fertilization practices that have FYM with the easily decomposable component for supplying K possess a more substantial influence on soil microorganisms' metabolic activity leading to an enhancement in the dehydrogenase activity in the soil. In this study, dehydrogenase activity was recorded the highest in treatment T7 (142.0 ± 7.1 and 167.0 ± 8.35 μg TPF g soil−1 d−1) followed by T5 (128.0 ± 6.4 and 152.0 ± 7.6 μg TPF g soil−1 d−1), and T4 (129.0 ± 6.45 and 152.0 ± 7.6 μg TPF g soil−1 d−1), while poor dehydrogenase activity was observed in treatment (T1) that did not use K fertilization, which is consistent with the earlier studies (Liu et al., 2010; Heidari et al., 2016).
Those enzymes which act to hydrolyze anhydrides and esters of phosphoric acid are broadly classified as phosphatases. Phosphatases are crucial as they are involved in the conversion of organic P to available P (Lee Taylor and Sinsabaugh, 2015) for plant uptake. In this study, the treatments applied with integrated fertilization of K had significantly affected alkaline and acid phosphatase activities. The alkaline and acid phosphatase activities were found lower in control (T1) and showed significantly increased activities arranged from 43.75 to 114.49% among the treatments applied with integrated fertilization of K through FYM and MOP or MOP alone during both the years. Earlier reports showed that acid and alkaline phosphatase activities had been enhanced through both inorganic and integrated fertilization (Mandal et al., 2007; Garg and Bahl, 2008; Heidari et al., 2016). K application led to better crop productivity and higher root biomass development in preceding corn crop (Kumar et al., 2018) which was the reason for increased activity of alkaline and acid phosphatase enzymes in the soil, whereas under integrated K management treatments, application of FYM was responsible for enhanced diverse phosphate-solubilizing bacterial activity.
β-glucosidase is one of the enzymes that contributed to the degradation of biomass and is considered as an early indicator of variations in soil characteristics (Ekenler and Tabatabai, 2003). The fluorescein diacetate [3′,6′-diacetyl fluorescein (FDA)] assay is generally utilized to examine hydrolytic enzymatic activities of soil microbial communities (e.g., fungi and bacteria) (Alkorta et al., 2003; Liu et al., 2007). In the present study, the integrated fertilization of K showed enhanced β-glucosidase activity (9.8 ± 0.49 and 10.2 ± 0.51 µg PNP g soil−1 h−1) and FDA (9.5 ± 0.48 and 9.6 ± 0.48 μg fluorescein g soil−1 h−1) by treatment T7 activity in comparison to treatments (T2, T3, and T6) employed with K by MOP only or by treatment T1 used without K during both years of cultivation (Figure 2). The increase in β-glucosidase and FDA activities through integrated fertilization of K was found because of high accessibility of easily decomposable organic components or organic carbon through introduced FYM for the metabolism, development, and growth of soil microorganisms (Gopinath et al., 2008; Gong et al., 2009; Burns et al., 2013; Heidari et al., 2016). Higher β-glucosidase and FDA activities recorded in treatments employed with K by MOP alone confirmed previous findings (Rani et al., 2014; Singh et al., 2015; Heidari et al., 2016).
Accessibility of N, P, and K nutrients reduced after wheat harvest (Figure 3). The regular mining of various nutrients through crops reduces available nutrients irrespective of applied nutrients (Johri and Yadav, 2006; Ramamurthy et al., 2009). In the present study, the treatment used with integrated K-fertilization recorded enhancement in the availability of different nutrients that ranged from 2.43 to 22.87%, which is the property of FYM to supply organically bound nutrients such as N and P in a slow manner (Diacono and Montemurro, 2011; Choudhary and Sureshky, 2013). The addition of FYM in integrated K management treatments increases the process of weathering in nutrient-bearing minerals, which aids the dissolution of insoluble minerals and makes plant nutrients available. Furthermore, FYM slowly adds available C in the soil, which acts as an energy source to favor highly diverse microbial communities with different functional properties, which supports dissolution and nutrients availability to crop plants (Wolf and Wagner, 2005; Heidari et al., 2016).
In the present study, the treatments employed with integrated fertilization of K exhibited substantial enhancement in wheat yield up to 12.39–41.71% and 18.24–41.14% in the first and second years of cultivation, respectively (Figure 4). The maximum yield was found in treatment T7 employed with 90 kg K ha−1 (30 kg K by FYM and 60 kg K by MOP) in wheat. The utilization of 90 kg K ha−1 enhanced the availability of K in the soil. The available K is essential to several plant metabolic pathways that include photosynthesis in plants, photosynthates translocation to different plant parts, synthesis of protein, and plant enzymes activation (IPNI, 1998). Among treatments, integrated K fertilization through FYM supplies nitrogen, phosphorus, and potassium along with micronutrients in readily available forms to the crop plants by the process of bio-decomposition, which helps in achieving higher yields. A study on integrated K fertilization through FYM and MOP showed an important enhancement in yield compared to 100% NPK and 100% NP fertilizers because of the high abundance of macro- and micronutrients (Kumar et al., 2015). Various levels of FYM and NPK, either single or in combinations, exhibited a vital influence on wheat yield (Rehman et al., 2008). Moreover, the enhanced K fertilization showed a prominent rise in wheat yield and growth (Mehdi et al., 2001).
The strict positive relationship exhibited that enzymatic activities and microbial population count contributed an important role in improving the yield (Figure 5A and Figure 6A). Moreover, the integrated fertilization of K in the combination of FYM and MOP showed more effectiveness among the treatments in comparison to MOP or FYM only. The treatments also showed distinct relationships with each other based on the regression analysis of various parameters (Figure 5B and Figure 6B). By the release of nutrients, the activity of microbes and enzymes assists in biomass transformations. The enhancement in microbial activities indirectly exhibited an enhancement in microbial biomass that acted as a low but reliable source for these nutrients.
This study revealed that integrated fertilization of FYM showed a significant role to improve soil health and yield of crops. Integrated fertilization through FYM modulates microbial population and soil enzymatic activities that enhance the availability of nutrients (N, P, and K) and yield parameters. The high availability of nutrients in the soil helps plants for their growth and development. Thus, the consecutive use of integrated fertilization of K through FYM and MOP exhibited the most promising impact on soil biological activities and yield of wheat, followed by the reduction in the use of chemical fertilizers. Less chemical fertilizers introduced in agricultural lands may benefit farmers economically and enhance soil health or soil fertility. Thus, the use of FYM as an alternate to K fertilization could be helpful to reclaim soil fertility and farmers' economy.
The original contributions presented in the study are included in the article/Supplementary Material; further inquiries can be directed to the corresponding author.
SK contributed to investigation, conceptualization, formal analysis, methodology, validation, and writing—original draft; SD contributed to supervision, validation, and writing—review and editing; SB contributed to data curation and writing—review and editing; MR contributed to visualization, validation, and writing—review and editing; SAK contributed to formal analysis and validation; SuK supported in writing—review and editing; DK supported in visualization; and LM contributed to formal analysis and data curation.
The authors declare that the research was conducted in the absence of any commercial or financial relationships that could be construed as a potential conflict of interest.
All claims expressed in this article are solely those of the authors and do not necessarily represent those of their affiliated organizations, or those of the publisher, the editors, and the reviewers. Any product that may be evaluated in this article, or claim that may be made by its manufacturer, is not guaranteed or endorsed by the publisher.
The authors are thankful to Dr. K. Annapurna and Dr. Surender Singh for providing lab facilities to conduct the microbiological parameters of the present study in their research laboratories. The authors also show their gratitude towards the Indian Council of Agriculture Research, New Delhi, and ICAR-Indian Agricultural Research Institute, New Delhi, in providing financial support and other required facilities.
Alkorta, I., Aizpurua, A., Riga, P., Albizu, I., Amézaga, I., and Garbisu, C. (2003). Soil Enzyme Activities as Biological Indicators of Soil Health. Rev. Environ. Health 18 (1), 65–73. doi:10.1515/reveh.2003.18.1.65
Balota, E. L., Colozzi-Filho, A., Andrade, D. S., and Dick, R. P. (2003). Microbial Biomass in Soils under Different Tillage and Crop Rotation Systems. Biol. Fertil. Soils 38 (1), 15–20. doi:10.1007/s00374-003-0590-9
Bandick, A. K., and Dick, R. P. (1999). Field Management Effects on Soil Enzyme Activities. Soil Biol. Biochem. 31 (11), 1471–1479. doi:10.1016/s0038-0717(99)00051-6
Burns, R. G., DeForest, J. L., Marxsen, J., Sinsabaugh, R. L., Stromberger, M. E., Wallenstein, M. D., et al. (2013). Soil Enzymes in a Changing Environment: Current Knowledge and Future Directions. Soil Biol. Biochem. 58, 216–234. doi:10.1016/j.soilbio.2012.11.009
Canarutto, S., Cervelli, S., Mazzoncini, M., and Perna, A. (1995). The Effect of Reduction of Inputs on Phosphatase Activity, Organic Carbon Content and Water Stability index in a Corn Cultivated Soil. Fresen Environ. Bull. 4, 291–296.
Choudhary, V., and Sureshky, K. P. (2013). Maize Production, Economics, and Soil Productivity under Different Organic Source of Nutrients in Eastern Himalayan Region, India. Int. J. Plant Prod. 7 (2), 167–186.
Clarholm, M., and Rosengren-Brinck, U. (1995). Phosphorus and Nitrogen Fertilization of a Norway spruce forest-effects on Needle Concentrations and Acid Phosphatase Activity in the Humus Layer. Plant Soil 175 (2), 239–249. doi:10.1007/bf00011360
Diacono, M., and Montemurro, F. (2011). “Long-term Effects of Organic Amendments on Soil Fertility,” in Sustainable Agriculture (Springer), Vol. 2, 761–786. doi:10.1007/978-94-007-0394-0_34
Dibb, D., and Thompson, W. (1985). “Interaction of Potassium with Other Nutrients,” in Potassium in Agriculture. Editors Munson (Madison, WI: American Society of Agronomy), 515–533.
Dobermann, A. R. (2001). Crop Potassium Nutrition–Implications for Fertilizer Recommendations. Agron. Hort. -Faculty Publications 357, 1–19.
Dutta, S., Majumdar, K., Khurana, H., Sulewski, G., Govil, V., Satyanarayana, T., et al. (2013). Mapping Potassium Budgets across Different States of India. Better Crops-South Asia 7, 28–31.
Dwevedi, A., Kumar, P., Kumar, P., Kumar, Y., Sharma, Y. K., and Kayastha, A. M. (2017). “Soil Sensors: Detailed Insight into Research Updates, Significance, and Future Prospects,” in New Pesticides and Soil Sensors. Editor A. M. Grumezescu (Academic Press: Elsevier), 561–594. doi:10.1016/b978-0-12-804299-1.00016-3
Eivazi, F., and Tabatabai, M. A. (1988). Glucosidases and Galactosidases in Soils. Soil Biol. Biochem. 20 (5), 601–606. doi:10.1016/0038-0717(88)90141-1
Ekenler, M., and Tabatabai, M. A. (2003). Effects of Liming and Tillage Systems on Microbial Biomass and Glycosidases in Soils. Biol. Fertil. Soils 39 (1), 51–61. doi:10.1007/s00374-003-0664-8
Enebe, M. C., and Babalola, O. O. (2020). Effects of Inorganic and Organic Treatments on the Microbial Community of maize Rhizosphere by a Shotgun Metagenomics Approach. Ann. Microbiol. 70 (1), 49. doi:10.1186/s13213-020-01591-8
Ezeokoli, O. T., Bezuidenhout, C. C., Maboeta, M. S., Khasa, D. P., and Adeleke, R. A. (2020). Structural and Functional Differentiation of Bacterial Communities in post-coal Mining Reclamation Soils of South Africa: Bioindicators of Soil Ecosystem Restoration. Sci. Rep. 10 (1), 1759. doi:10.1038/s41598-020-58576-5
Garg, S., and Bahl, G. S. (2008). Phosphorus Availability to maize as Influenced by Organic Manures and Fertilizer P Associated Phosphatase Activity in Soils. Bioresour. Techn. 99 (13), 5773–5777. doi:10.1016/j.biortech.2007.10.063
Ghoshal, N., and Singh, K. P. (1995). Effects of Farmyard Manure and Inorganic Fertilizer on the Dynamics of Soil Microbial Biomass in a Tropical Dryland Agroecosystem. Biol. Fert. Soils 19 (2), 231–238. doi:10.1007/bf00336165
Gomez, K. A., and Gomez, A. A. (1984). Statistical Procedures for Agricultural Research. Brisbane: John Wiley & Sons.
Gong, W., Yan, X., Wang, J., Hu, T., and Gong, Y. (2009). Long-term Manure and Fertilizer Effects on Soil Organic Matter Fractions and Microbes under a Wheat–maize Cropping System in Northern China. Geoderma 149 (3-4), 318–324. doi:10.1016/j.geoderma.2008.12.010
Gopinath, K. A., Saha, S., Mina, B. L., Pande, H., Kundu, S., and Gupta, H. S. (2008). Influence of Organic Amendments on Growth, Yield and Quality of Wheat and on Soil Properties during Transition to Organic Production. Nutr. Cycl. Agroecosyst. 82 (1), 51–60. doi:10.1007/s10705-008-9168-0
Green, V. S., Stott, D. E., and Diack, M. (2006). Assay for Fluorescein Diacetate Hydrolytic Activity: Optimization for Soil Samples. Soil Biol. Biochem. 38 (4), 693–701. doi:10.1016/j.soilbio.2005.06.020
Heidari, G., Mohammadi, K., and Sohrabi, Y. (2016). Responses of Soil Microbial Biomass and Enzyme Activities to Tillage and Fertilization Systems in Soybean (Glycine max L.) Production. Front. Plant Sci. 7, 1730. doi:10.3389/fpls.2016.01730
Johri, B., and Yadav, J. (2006). Low and Declining Crop Response to Fertilizers. New Delhi, India: National Academy of Agricultural Sciences. Policy Paper, 35.
Kaur, N., and Benipal, D. (2006). Effect of Crop Residue and Farmyard Manure on K Forms on Soils of Long Term Fertility experiment. Ind. J. Crop Sci. 1 (1and2), 161–164.
Klein, D. A., Loh, T. C., and Goulding, R. L. (1971). A Rapid Procedure to Evaluate the Dehydrogenase Activity of Soils Low in Organic Matter. Soil Biol. Biochem. 3 (4), 385–387. doi:10.1016/0038-0717(71)90049-6
Kumar, S., Dhar, S., Kumar, A., and Kumar, D. (2015). Yield and Nutrient Uptake of maize (Zea mays)-wheat (Triticum aestivum) Cropping System as Influenced by Integrated Potassium Management. Ind. J. Agron. 60 (4), 511–515.
Kumar, S., Dhar, S., Barthakur, S., Kumar, S., Mondal, B., Kumar, D., et al. (2018). Integrated K Management Exhibit a Key Role in Potassium Uptake Transporter (ZmKUP) Expression to Improve Growth and Yield of Corn. Int. J. Curr. Microbiol. App Sci. 7 (12), 1867–1887. doi:10.20546/ijcmas.2018.712.218
Lee Taylor, D., and Sinsabaugh, R. L. (2015). The Soil Fungi. Soil Microbiol. Ecol. Biochem. 4, 77–109. doi:10.1016/b978-0-12-415955-6.00004-9
Li, Z., Zhang, R., Xia, S., Wang, L., Liu, C., Zhang, R., et al. (2019). Interactions between N, P and K Fertilizers Affect the Environment and the Yield and Quality of Satsumas. Glob. Ecol. Conservation 19, e00663. doi:10.1016/j.gecco.2019.e00663
Liu, B., Tu, C., Hu, S., Gumpertz, M., and Ristaino, J. B. (2007). Effect of Organic, Sustainable, and Conventional Management Strategies in Grower fields on Soil Physical, Chemical, and Biological Factors and the Incidence of Southern Blight. Appl. Soil Ecol. 37 (3), 202–214. doi:10.1016/j.apsoil.2007.06.007
Liu, E., Yan, C., Mei, X., He, W., Bing, S. H., Ding, L., et al. (2010). Long-term Effect of Chemical Fertilizer, Straw, and Manure on Soil Chemical and Biological Properties in Northwest China. Geoderma 158 (3-4), 173–180. doi:10.1016/j.geoderma.2010.04.029
Luan, M., Tang, R. J., Tang, Y., Tian, W., Hou, C., Zhao, F., et al. (2016). Transport and Homeostasis of Potassium and Phosphate: Limiting Factors for Sustainable Crop Production. J. Exp. Bot. 68 (12), 3091–3105. doi:10.1093/jxb/erw444
Mandal, A., Patra, A., Singh, D., Swarup, A., and Ebhinmasto, R. (2007). Effect of Long-Term Application of Manure and Fertilizer on Biological and Biochemical Activities in Soil during Crop Development Stages. Bioresour. Techn. 98 (18), 3585–3592. doi:10.1016/j.biortech.2006.11.027
Meena, A., and Rao, K. S. (2021). Assessment of Soil Microbial and Enzyme Activity in the Rhizosphere Zone under Different Land Use/cover of a Semiarid Region, India. Ecol. Process. 10 (1), 16. doi:10.1186/s13717-021-00288-3
Mehdi, S. M., Ranjha, A. M., Muhamamd, S., and Hamdy, G. (2001). Response of Wheat to Potassium Application in Six Soil Series of Pakistan. J. Biol. Sci. 1, 429–431. doi:10.3923/jbs.2001.429.431
Nannipieri, P., Grego, S., Ceccanti, B., Bollag, J., and Stotzky, G. (1990). Ecological Significance of the Biological Activity in Soil. Soil Biochem. 6, 293–355.
Nannipieri, P., Ascher, J., Ceccherini, M. T., Landi, L., Pietramellara, G., and Renella, G. (2003). Microbial Diversity and Soil Functions. Eur. J. Soil. Sci 54 (4), 655–670. doi:10.1046/j.1351-0754.2003.0556.x
Nejad, S. D., Nejad, T. S., and Lack, S. (2010). Study Effect Drought Stress and Different Levels Potassium Fertilizer on K Accumulation in Corn. Nat. Sci. 8, 23–27.
Okore, C., Mbanefo, O., Adeyemo, S., Onyekwere, B., and Onyewenjo, S. (2012). The effect of mixed organic amendments on the shooth length of Zea mays grown in condemned engine oil polluted soil. Proc(Online), IPCBEE 47, 58–62.
Olsen, S. R. (1954). Estimation of Available Phosphorus in Soils by Extraction with Sodium Bicarbonate. Washington, United States: US Department of Agriculture.
Pancholy, S. K., and Rice, E. L. (1973). Soil Enzymes in Relation to Old Field Succession: Amylase, Cellulase, Invertase, Dehydrogenase, and Urease. Soil Sci. Soc. Am. J. 37 (1), 47–50. doi:10.2136/sssaj1973.03615995003700010018x
Pankhurst, C., Hawke, B., McDonald, H., Kirkby, C., Buckerfield, J., Michelsen, P., et al. (1995). Evaluation of Soil Biological Properties as Potential Bioindicators of Soil Health. Aust. J. Exp. Agric. 35 (7), 1015–1028. doi:10.1071/ea9951015
Patra, A. K., Dutta, S. K., Dey, P., Majumdar, K., and Sanyal, S. K. (2017). Potassium Fertility Status of Indian Soils: National Soil Health Card Database Highlights the Increasing Potassium Deficit in Soils. Indian J. Fert. 13 (11), 28–33.
Polara, K., Sardhara, R., Parmar, K., Babariya, N., and Patel, K. (2009). Effect of Potassium on Inflow Rate of N, P, K, Ca, S, Fe, Zn and Mn at Various Growth Stages of Wheat. Asian J. Soil Sci. 4 (2), 228–235.
Rajawat, M. V. S., Singh, R., Singh, D., Yadav, A. N., Singh, S., Kumar, M., et al. (2020). Spatial Distribution and Identification of Bacteria in Stressed Environments Capable to Weather Potassium Aluminosilicate mineral. Braz. J. Microbiol. 51 (2), 751–764. doi:10.1007/s42770-019-00210-2
Ramamurthy, V., Naidu, L., Kumar, S. R., Srinivas, S., and Hegde, R. (2009). Soil-based Fertilizer Recommendations for Precision Farming. Curr. Sci., 641–647.
Rani, I. U., Padmaja, G., and Rao, P. C. (2014). Integrated Effect of Organic Manures and Inorganic Fertilizers on Soil Phosphatase Activity and Yield of maize-spinach Cropping System. Agri. Scie. Dige. 34 (1), 31–35. doi:10.5958/j.0976-0547.34.1.006
Rehman, S., Khalil, S. K., Rehman, A., and Saljoqi, A. (2008). Organic and Inorganic Fertilizers Increase Wheat Yield Components and Biomass under Rainfed Condition. Sarhad J. Agric. 24 (1), 11–20.
Singh, G., Kumar, D., and Sharma, P. (2015). Effect of Organics, Biofertilizers and Crop Residue Application on Soil Microbial Activity in rice - Wheat and rice-wheat Mungbean Cropping Systems in the Indo-Gangetic plains. Cogent Geosci. 1 (1), 1085296. doi:10.1080/23312041.2015.1085296
Singh, K., and Bansal, S. (2009). Potassium Indexing of Crops Grown on Eight Benchmark Soil Series of India. Comm. Soil Sci. Plant Ana. 40 (9-10), 1369–1379. doi:10.1080/00103620902818047
Steingrobe, B., and Claassen, N. (2000). Potassium Dynamics in the Rhizosphere and K Efficiency of Crops. J. Plant Nutr. Soil Sci. 163 (1), 101–106. doi:10.1002/(sici)1522-2624(200002)163:1<101:aid-jpln101>3.0.co;2-j
Subbaiah, B. (1956). A Rapid Procedure for Estimation of Available Nitrogen in Soil. Curr. Sci. 25, 259–260.
Tabatabai, M. A., and Bremner, J. M. (1969). Use of P-Nitrophenyl Phosphate for Assay of Soil Phosphatase Activity. Soil Biol. Biochem. 1 (4), 301–307. doi:10.1016/0038-0717(69)90012-1
Wolf, D. C., and Wagner, G. H. (2005). “Carbon Transformations and Soil Organic Matter Formation,” in Principles and Applications of Soil Microbiology. Editors D. M. Sylvia, J. J. Fuhrmann, P. G. Hertel, and D. A. Zuberer 2nd Edn. (New Jersey: Pearson), 285–332.
Wu, L., Jiang, Y., Zhao, F., He, X., Liu, H., and Yu, K. (2020). Increased Organic Fertilizer Application and Reduced Chemical Fertilizer Application Affect the Soil Properties and Bacterial Communities of Grape Rhizosphere Soil. Sci. Rep. 10 (1), 9568. doi:10.1038/s41598-020-66648-9
Yousaf, M., Li, J., Lu, J., Ren, T., Cong, R., Fahad, S., et al. (2017). Effects of Fertilization on Crop Production and Nutrient-Supplying Capacity under rice-oilseed Rape Rotation System. Sci. Rep. 7 (1), 1270. doi:10.1038/s41598-017-01412-0
Keywords: farmyard manure, functional activities, microbial population count, soil enzymatic activities, integrated fertilization approach, yield, wheat
Citation: Kumar S, Dhar S, Barthakur S, Rajawat MVS, Kochewad SA, Kumar S, Kumar D and Meena LR (2021) Farmyard Manure as K-Fertilizer Modulates Soil Biological Activities and Yield of Wheat Using the Integrated Fertilization Approach. Front. Environ. Sci. 9:764489. doi: 10.3389/fenvs.2021.764489
Received: 25 August 2021; Accepted: 18 October 2021;
Published: 01 December 2021.
Edited by:
Rajni Singh, Amity University, IndiaReviewed by:
Ram Karan, King Abdullah University of Science and Technology, Saudi ArabiaCopyright © 2021 Kumar, Dhar, Barthakur, Rajawat, Kochewad, Kumar, Kumar and Meena. This is an open-access article distributed under the terms of the Creative Commons Attribution License (CC BY). The use, distribution or reproduction in other forums is permitted, provided the original author(s) and the copyright owner(s) are credited and that the original publication in this journal is cited, in accordance with accepted academic practice. No use, distribution or reproduction is permitted which does not comply with these terms.
*Correspondence: Sanjeev Kumar, YmhhbnVzYW5qZWV2QGdtYWlsLmNvbQ==
Disclaimer: All claims expressed in this article are solely those of the authors and do not necessarily represent those of their affiliated organizations, or those of the publisher, the editors and the reviewers. Any product that may be evaluated in this article or claim that may be made by its manufacturer is not guaranteed or endorsed by the publisher.
Research integrity at Frontiers
Learn more about the work of our research integrity team to safeguard the quality of each article we publish.