 Guangqin Li
 Xubing Fang
95% of researchers rate our articles as excellent or good
Learn more about the work of our research integrity team to safeguard the quality of each article we publish.
Find out more
ORIGINAL RESEARCH article
Front. Environ. Sci. , 11 November 2021
Sec. Environmental Economics and Management
Volume 9 - 2021 | https://doi.org/10.3389/fenvs.2021.762231
This paper aimed to accurately assess the driving effect of digital inclusive finance (DIF) on green economic growth, better implement DIF-related policies, and promote the development of green economy. Based on the urban panel data from 2011 to 2018 and the DIF index, this paper investigates the impact of DIF on economic green development and its internal mechanism. The results show that there is a significant positive U-shaped nonlinear relationship between DIF and green development. Through the robustness test of the threshold model, instrumental variable model (IV), and system generalized method of moments (SYS-GMM) model, the results are still valid. The mechanism research shows that the DIF can indirectly promote China’s green development by the coagglomeration degree of producer services and optimize and upgrade industrial structure. This study provides policy implications for developing countries around the world to achieve green development by promoting the DIF level.
Since the beginning of the 21st century, the frequent occurrence of major natural disasters and extreme weather events in the world has caused serious losses to the economy, which means that the economic development model at the expense of the environment is unsustainable (Abid et al., 2019; Van Tran et al., 2019; Elahi et al., 2021a). Similarly, with the rapid development of China’s economy, problems such as environmental pollution have become increasingly prominent, which led to severe haze weather in 2013 (Gu et al., 2019; Gu et al., 2020). Fortunately, in recent years, the central government and local governments in China at all levels have adopted a large number of policies and measures to solve environmental problems and achieved good results. According to the data of China Ecological Environment Bulletin, among the 337 prefecture-level cities in China, 202 cities reached the air quality standard in 2020, accounting for 59.9%, while this proportion was only 24.9% in 2016, a decrease of 35 percentage points in four years. The China Government Work Report in 2021 clearly emphasizes “developing a green economy and vigorously promoting sustainable economic development.” Therefore, changing the economic development model, improving the level of green economic development, and achieving sustainable development is an effective way to resolve the contradiction between China’s economic development and environmental pollution.
In recent years, with the development of China’s Internet and mobile payment, the digital inclusive finance (DIF) has developed rapidly in China, which has developed rapidly. The DIF benefits from the digital economy and information technology, which can help reduce the financing threshold of small and medium-sized enterprises and alleviate the difficulties of “financing difficult and expensive.” The DIF can help to reduce the cost of financial services and improve the availability of financial services and financing efficiency. It is helpful to improve the innovation ability of the financial industry, derive rich financial products, and meet the diversified financing needs of enterprises. The DIF plays an important role in optimizing the industrial structure and upgrading, narrowing the urban-rural income gap, improving the quality of residents’ consumption, and improving the ability of technological innovation and is committed to promoting the high-quality development of China’s economy. The realization of high-quality economic development will help alleviate China’s excessive energy consumption, severe environmental pollution, and other difficulties and help improve China’s sustainable economic development. Therefore, discussing the impact of the development of DIF on the level of green economy development and its internal mechanism has important academic value and practical significance for realizing the sustainable development of the Chinese economy.
Through the review of relevant literature about the development of the green economy, we found that geographical pattern (Hamdouch and Depret, 2012), energy structure (Feng et al., 2017), green tax policy (Sapna and Nivedita, 2019), foreign direct investment (fdi) (Hille et al., 2019), industrial structure (Pan et al., 2019), carbon dioxide emissions (Liu N. et al., 2020), and other economic factors will significantly affect the development of green economy. Some scholars have discussed the coordinated development between green finance and green economy from the perspective of the financial industry (Liu Z. J. et al., 2020). Siek and Sutanto (2019) think that the number of financial institutions is helpful to optimize the structure, improve the efficiency of financial services, improve the environmental quality, and promote the development of green economy through green finance. Studies determined the green credit and performance of production systems (Peng et al., 2020; Peng et al., 2021a;; Peng et al., 2021b; Zhao et al., 2021). Similarly, some studies focused on the determination of a nexus between inputs and output in the farm production system (Elahi et al., 2018; Elahi et al., 2019a; Elahi et al., 2019b; Elahi et al., 2019c; Elahi et al., 2020; Elahi et al., 2021b).
On the basis of previous studies, this paper takes China’s DIF as the entry point to investigate the influence of DIF on green economy development and its internal mechanism. The literature related to this paper is Xie and Liu (2019), Ni et al. (2020), and Jiang & Zhou (2021). Xie and Liu (2019) discuss the impact of green credit on green economic growth and analyze the mechanism of green credit indirectly acting on green economy through industrial structure and energy structure by using provincial panel data in China. Ni et al. (2020) also examine the spatial spillover effect of financial development on green total factor productivity (gtfp) based on provincial-level data. Jiang & Zhou (2021) found that there is an inverted “N” curve relationship between DIF and high-quality economic development, and DIF indirectly promotes high-quality economic development through economic intensity, economic stability, economic extroversion, and human capital and ecological capital of DIF. Based on the existing literature, the possible contributions of this paper are as follows. Firstly, there is little literature to investigate the impact of financial development on green economies from the level of prefecture-level cities, but the differences between prefecture-level cities will make the research conclusions biased. Secondly, the combination of the DIF and green economic development enriches and supplements the research on the relationship between them. Thirdly, this paper systematically evaluates the mechanism path of the DIF indirectly promoting the development of green economy through industrial structure upgrading and producer service agglomeration.
This article aims to examine the relationship between DIF and green economic development. As the DIF is a kind of financial type, this paper combs the literature on the relationship between financial development and green economy, which can be summarized into the following three aspects. Firstly, financial development promotes green economic growth (Okuda and Aiba, 2016). The “inclusiveness” of DIF has improved the financing environment of China’s small, medium, and microgreen enterprises, eased financing constraints (Chakravarty and Pal, 2013; Ozili, 2018), increased funding sources for green enterprises, and promoted the development of a green economy. The digital feature of digital financial inclusion reduces the degree of information asymmetry between financial institutions and green companies, improves the financing efficiency of green companies, reduces the risks of financial institutions, and provides green companies with sufficient and stable financial support. In addition, the “catfish effect” of digital financial inclusion reduces financing costs such as communication and transaction costs, which means that the cost of obtaining funds for green companies has been reduced, and more financial funds will be used for green reforms. In summary, digital financial inclusion has promoted the development of a green economy. Secondly, financial development hinders green economic growth. Departments with no pressure to repay loans and with “political background” often occupy financial resources, but some green companies cannot obtain finance. The inefficient allocation of financial resources hinders the development of a green economy by financial resources. Thirdly, there is a nonlinear relationship between financial development and the green economy (Zhang, 2017). Financial development can help alleviate consumer liquidity constraints and stimulate consumer demand. On the one hand, consumer demand has increased, leading to excessive energy consumption. However, with the upgrading of consumption structure, consumers’ awareness of environmental protection has increased, and consumer products are more concentrated on green products that promote green economic growth. It can be seen that the impact of financial development on the growth of the green economy is uncertain.
In the early stage of the DIF development, some enterprises use a large number of financial resources for market arbitrage in an attempt to obtain high profits, rather than using credit resources for technological research and development of enterprise production through the “reservoir” effect, so as to realize the green transformation and upgrading of enterprises (Hall, 2002). In addition, the “inclusion” of DIF makes inefficient backward enterprises crowd out the financial resources of small, medium, and microgreen enterprises, reducing the financing efficiency of green enterprises and hindering the growth of green economy. When the DIF develops to a certain extent, its positive impact on green economy gradually emerges. The DIF can help reduce the innovation threshold of enterprise financing constraints and stimulate the innovation vitality of enterprises in green technology (O'Sullivan, 2005). It is helpful to break through the space limitation of financial accessibility, realize the “inclusive” financial services in remote areas, and solve the problem of “difficult and expensive financing” for small, medium, and microgreen enterprises. It will help guide green consumption and promote green economic development. Accordingly, this paper proposes the following hypothesis 1.
H1. The DIF can influence total factor productivity by promoting the agglomeration of producer services and upgrading of industrial structure.
How does digital financial inclusion affect the development of a green economy? Based on existing research, the internal mechanism of digital financial inclusion for the development of green economy may be manifested in the following two aspects: Firstly, as a producer service industry, the DIF will improve the agglomeration level of the producer service industry and then enhance the development of green economy. The development of the DIF has promoted the development of the producer service industry and other industries and the formation of agglomeration areas by lowering the financing threshold and information asymmetry. The impact of industrial agglomeration on the green development of enterprises: the competitive effect of industrial agglomeration forces enterprises to use financial funds for green technological innovation, transform green production methods, improve the competitiveness of green products, and occupy a dominant market position; industry diversification and agglomeration will help to strengthen green technology exchanges between industries and even within industries and rely on the “learning effect” to promote the development of green industries; enterprises in the agglomeration zone share the benefits of green technological innovation, reduce green industry transaction costs, and use more financial resources to transform green production methods to promote the development of green economy (Beaudry and Schiffauerova, 2009); small, medium, and microgreen enterprises in the agglomeration area can learn advanced management experience and scientific research technology through technology spillover effects to promote their own green development. Secondly, the optimization and upgrading of the industrial structure will help realize digital financial inclusion and promote the development of a green economy. The DIF can not only help to realize the transformation of the green production mode of enterprises but also promote the optimization and upgrading of the industrial structure through the reasonable allocation of financial resources. The industrial integration of the science and technology industry will enhance the level of green technology innovation and promote the development of a green economy. The upgrading of industrial structure can accelerate the gradual flow of infrastructure, technology, and other factors from low-level industries to high-level industries, improve the efficiency of factor resource allocation, stimulate the vitality of green technology innovation of enterprises, and promote the development of green economy (Pai, 2016; Yang and Jiang, 2021). Accordingly, this paper proposes the following hypothesis 2.
H2. The DIF can indirectly promote the development of green economy by increasing the concentration of producer services and optimizing the upgrading of industrial structure.
This paper focuses on the impact of the DIF on green economic development, considering that the DIF may have a nonlinear relationship with green development level, the square term of the DIF index is added to the regression model, and the empirical model is as follows:
Among them, i represents the city; t represents the year; GTFP is the green total factor productivity and represents the level of green development; DIFI represents the DIF index; X is the series of factors that affect the green total factor productivity;
The explained variable is the level of green economy development. This article uses the SBM directional distance function and refers to the global Malmquist-Luenberger index constructed by Oh (2010) to measure the green total factor productivity of China’s prefecture-level cities and serve as a measure of the level of China’s green economy development index. The production possibility set of the global ML index refers to the global production technology set DG(x) and contains both expected and undesired output, which can better measure the level and quality of green development. According to the definition of DG(10) production technology set, the global ML index from t to t+1 period can be expressed as
In the formula,
If ML > 1, it means that the level of green development is increasing; if ML ≤ 1, it means that the level of green development is unchanged or decreasing. Drawing lessons from relevant literature, this article uses the following input and output indicators to measure the level of green development.
Capital input: considering that the capital stock data of the provinces and cities in the Yellow River Basin cannot be directly obtained, this article draws on the mature “perpetual inventory method” to estimate the capital stock (Zhang et al., 2004), and the calculation formula is
Labor input: it is measured by the sum of the number of employed persons in urban units and the number of employed persons in other units in each city. Energy input: the energy consumption of the whole society is used to represent energy input.
Expected output: in order to avoid the interference of price factors on the measurement, this paper adopts the actual gross national product of each city after deflation processing based on the 2011 base period.
Unexpected output: this article uses industrial wastewater and industrial SO2 emissions to measure.
The above indicator data comes from the National Bureau of Statistics, “China Labor Statistical Yearbook,” “China Urban Statistical Yearbook,” and “China Energy Statistical Yearbook.”
The core explanatory variable of this paper is the DIF index, which is used as the proxy index of the development level of urban. This paper uses the DIF index of Peking University compiled by Guo et al. (2020), concluding the subdimensional indexes of the DIF Coverage (brd), Depth of Use (dpth), and Digital Support Service Level (pay), to investigate the impact of the development of the DIF on green economy development.
In addition to the core explanatory variables of the DIF, this paper draws on relevant literature and controls the following variables:
1) Urban economic development level (lnpgdp): it is measured by the natural logarithm of actual pgdp in cities. The improvement of the level of economic development can greatly enhance the vitality of urban green innovation and entrepreneurship and then enhance the green economic development. Expected sign is positive.
2) Financial development level (fin): it is measured by the proportion of the sum of loans and deposits of financial institutions in the actual GDP; on the one hand, financial development can reduce the occurrence of information asymmetry by collecting and processing innovative information and improving the supervision mechanism of innovative projects by financial institutions. Expected sign is positive.
3) The level of fdi: it is measured by the proportion of fdi in regional GDP. fdi sets up enterprises in the investing country, which promotes the improvement of green economic development through the competitive effect among enterprises. Expected sign is positive.
4) Freight volume (log): it is measured by the ratio of cargo transportation volume to GDP of each region. The larger proportion of freight volume indicates that the transportation infrastructure is complete, so it can speed up the flow of talents, technology, and other factors and improve the supply of labor. It can also reduce the cost of communication and transaction between enterprises and promote the improvement of green economy development. Expected sign is positive.
1) Industrial upgrading (upd): it is measured by the proportion of employment in the tertiary industry to employment in the secondary industry. On the one hand, industrial upgrading will inevitably force enterprises to carry out green technological innovation to improve labor productivity and obtain excess profits, thus accelerating the formation of emerging green industries, upgrading and transforming traditional industries, and promoting the development of green economy. Expected sign is positive.
2) Productive service industry: in this paper, we measure the diversification index (dag) of producer services. This paper calculates the diversified agglomeration index of producer services, and its specific calculation formula is
Among them,
There are two main sources of research data in this paper. First, the data related to the DIF comes from the DIF index data of cities at all levels and above from 2011 to 2018 provided by the Digital Finance Research Center of Peking University. In the research process, we take the logarithm of these indexes, and the specific method is to add one to the index and then take the logarithm. Second, all the data except the DIF data are from China Urban Statistics Yearbook and China Regional Economic Statistics Yearbook. According to the availability of statistical data, the research sample of this paper is the panel data of 283 cities at the prefecture level and above in China from 2011 to 2018, and the statistical scope of the sample is the whole city. Table 1 is a descriptive statistical table of the variables involved in this paper.

TABLE 1. Descriptive statistics of variables.
Considering that the multicollinearity between variables will lead to the bias of estimation results, Table 2 presents the correlation coefficient matrix and variance inflation factor (VIF) values of all variables. From the results, the correlation coefficients of all variables are not greater than 0.4. The value of VIF is less than 10; that is, there is no multicollinearity problem.
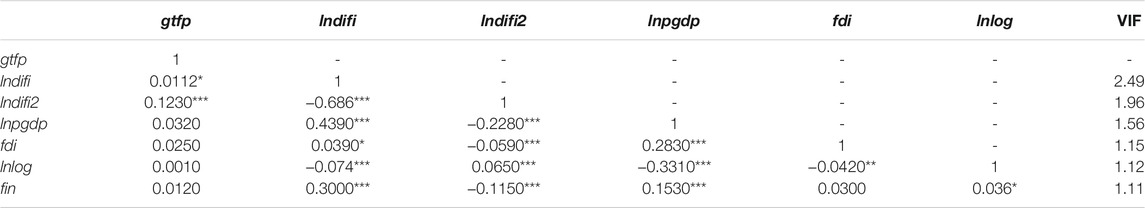
TABLE 2. The correlation coefficient and multicollinearity test of varibles.
According to research hypothesis one and Eq. 1, Table 3 shows the result of benchmark regression. Without adding control variables, column (1) only investigates the influence of the DIF on green economic development, and the results show that there is a negative and not significant influence relationship between the DIF and the green total factor productivity. The results in column (2) show that the coefficients of the first and second terms of the DIF are negative and positive, respectively, and both have passed the significance level of 1%, indicating that the DIF has a positive U-shaped relationship with green total factor productivity. When the control variable is added, the results in column (3) show that the coefficient of the DFI’s first term is significantly negative at the 1% statistical level, and the conclusion in column (4) is the same as that in column (2). When the DIF is at a low level of development, it fails to fully cover the whole region, which will occupy a certain amount of funds, lead to a serious waste of resources, and have a certain inhibitory effect on green economic development. With the vigorous development of the DIF, it will produce a certain scale effect, make reasonable and full use of enterprise funds, and thus promote the development level of green economy.
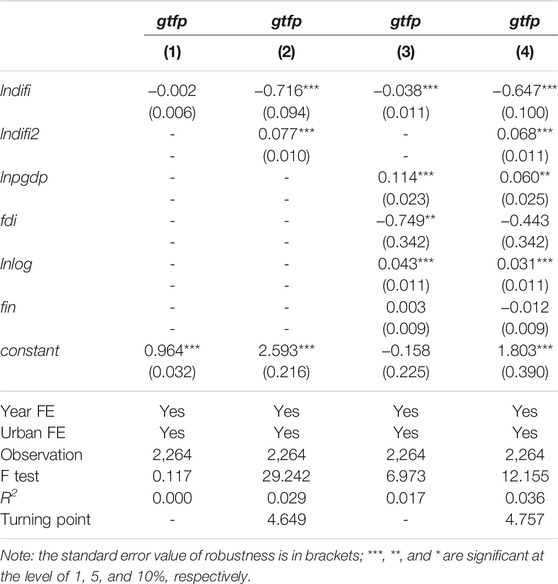
TABLE 3. Benchmark regression results.
According to column (4), through simple calculation, the value of turning point is 4.757 (the DIF is 116), which indicate that when the development of the DIF is less than 116, it will take up a large number of enterprise funds and increase costs, thus inhibiting the development level of green economy. However, when the development of the DIF is greater than 116, the coverage area of the DIF will increase, which will produce economies of scale and promote the improvement of green total factor productivity of enterprises. The conclusion is that there is a nonlinear relationship between the DIF and the development level of green economy. H1 was tested.
Among the control variables, the level of urban economic development (lnpgdp) has a significant positive effect on green total factor productivity, which indicates that rapid economic development can encourage large enterprises to open up resources, participate in coordinated development, and promote the development level of green economy. fdi has no significant inhibitory effect on green total factor productivity, different from the expected results. Freight volume (lnlog) has a significant positive effect on green total factor productivity. While financial development level (fin) has no significant inhibitory effect on green total factor productivity, different from the expected results, the possible explanation is that the increase in financial development scale may not promote the development level of green economy but must adapt to the resource endowment and industrial structure development of the region in order to give full play to the financial function.
In addition to studying the influence of the DIF on the quality of economic development, this part substitutes three subdimensions of the DIF into the model to estimate the influence of subdimensions on the level of green economy. Table 4 reports the influence of three subdimensions of the DIF on green total factor productivity. Regression results show that the primary estimation coefficients of the three subdimensions are significantly negative at the levels of 1, 1, and 5%, respectively, while the secondary estimation coefficients are significantly positive at the levels of 1, 1, and 10%, respectively, indicating that the DIF index of the three subdimensions has a nonlinear relationship with green total factor productivity, while coverage breadth is weakly significant with green total factor productivity, indicating that the “general” characteristics reflected by coverage breadth have not been fully reflected. H1 still holds.
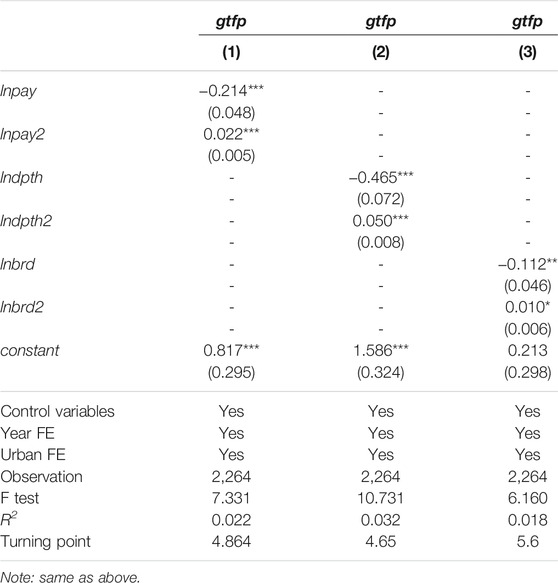
TABLE 4. Substitution explanatory variable.
In this section, the green technology progress index (gtpi) is substituted for green total factor productivity (gtfp) for the robustness test. The results are shown in Table 5. The results of columns (1)–(4) in Table 4 show that the estimated coefficients of the digital financial inclusion total index and the three subdimensions indexes are all manifested as the first-order coefficients are significantly negative and the quadratic coefficients are significantly positive. Both of them are significant at the 1% level, indicating that there is a nonlinear relationship between the DIF or its three subdimensions and the green total factor productivity. H1 still holds.
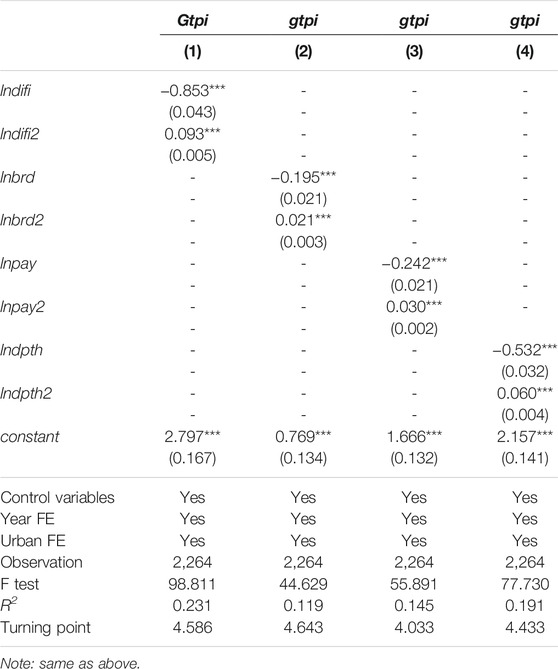
TABLE 5. Replace the explained variable.
Table 6 reports the estimation results of the replacement estimation method. Considering the dynamic change of green total factor productivity, only using the static panel model may lose some useful information. Therefore, considering that the time dimension of the sample is only 8 years, we learn from Arellano and Bover (1995) and use the system generalized method of moments (SYS-GMM) method to estimate the relationship between DIF and urban green total factor productivity. Therefore, we use the method of Fu et al. (2013) for reference and only consider the first-order lag. In addition, another advantage of SYS-GMM estimation is that it can alleviate some possible endogenous problems. The system GMM estimation requires that the random disturbance term
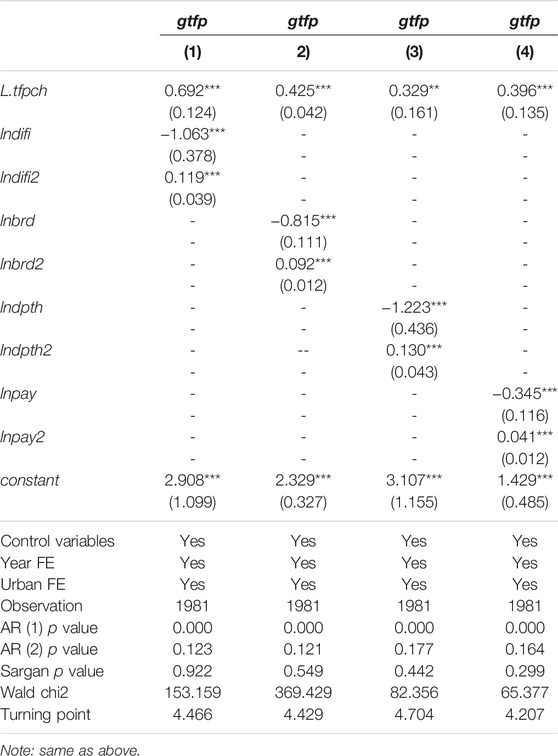
TABLE 6. The stimation of SYS-GMM.
Because the threshold effect model is one of the common methods to deal with nonlinear relations, we use the threshold effect model to test the robustness in this part. Based on the research of Hansen (1999), this paper constructs a panel threshold model between the DIF and green economy development:
Among them, DIFI represents the threshold variable;
Since there is a U-shaped relationship between the DIF and the development level of green economy, it is necessary to further consider the threshold effect of the DIF on the level of green economy. In this paper, Bootstrap is used to sample and calculate the threshold model repeatedly, and F statistics and p values are obtained (see Table 7). The results in Table 6 show that the DIF index (lndifi) has a double threshold effect on green total factor productivity. Among them, the single threshold effect is significant at 1% level, and the threshold value is 5.274. The double threshold effect is significant at 10% level, and the threshold value is 5.405. The triple threshold effect is not significant. The coverage of DIF (lnbrd) has a single threshold effect on green total factor productivity. Among them, the single threshold effect is significant at 1% level, and the threshold value is 5.251; the double threshold effect is not significant. The Digital Support Service Level of DIF (lnpay) has a single threshold effect on green total factor productivity. Among them, the single threshold effect is significant at the level of 5%, and the threshold value is 5.277; the double threshold effect is not significant. The use depth of DIF (lndpth) has a double threshold effect on green total factor productivity. Among them, the single threshold effect is significant at 1% level, and the threshold value is 5.375. The double threshold effect is significant at 5% level, and the threshold value is 5.185. The triple threshold effect is not significant.
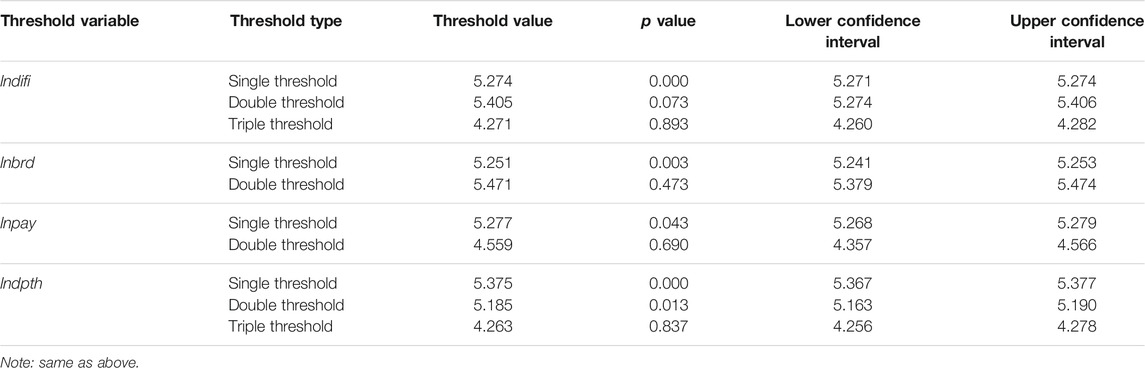
TABLE 7. Threshold effect test.
After determining the corresponding threshold value, this part will estimate the threshold model, and Table 8 shows the threshold regression results. Columns (1)–4) are the regression estimation results of the DIF and threshold effect of three subdimensions. The results in column (1) show that after the control variables are added, the effect of the DIF on green total factor productivity has a significant threshold effect, which has passed the 1% significance level. When the DIF index is less than the threshold value of 5.274, the threshold coefficient is −0.058, and the DIF has a significant inhibitory effect on green total factor productivity. When the threshold value of the DIF index is between [5.274, 5.405], the threshold coefficient is −0.046, and the DIF inhibits the improvement of green total factor productivity. When the DIF index is greater than the threshold value of 5.405, the threshold coefficient is −0.038, the DFI has a significant inhibitory effect on green total factor productivity, and its effect is gradually increasing. It shows that, with the increasing threshold of the DIF, the effect of the DIF on green total factor productivity is gradually enhanced. Developing the DIF can produce a certain scale effect, reduce the cost of enterprises, and promote the improvement of green total factor productivity.
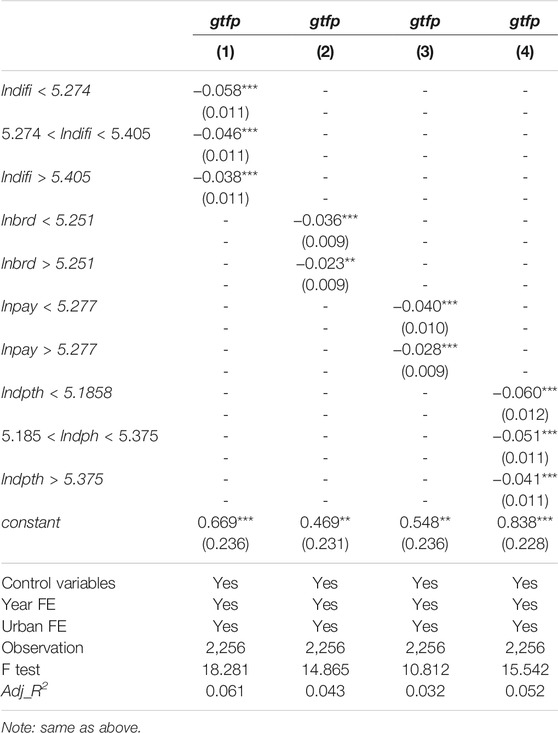
TABLE 8. Threshold regression results.
Furthermore, the robustness results are analyzed; in columns (2)–(4), the three subdimensions of the DIF are replaced by the DIF total index, and the influence of the DIF on the development level of green economy is further investigated. The results show that coverage breadth and digital support service degree have a significant single threshold effect on green total factor productivity. The depth of use has a significant double threshold effect on green total factor productivity, both of which are significant at 1%.
In order to avoid the reverse causal problem, that is, the current green total factor productivity may have an impact on the current DIF development, we treat the core explanatory variables lag one period (see Table 8 for the estimated results). It can be seen from Table 9 that the results in columns (1) to (3) show that the development index of the DIF and the subdivision index of the DIF lag behind the first-order coefficient estimation results and the coefficients of the first and second terms are negative and positive at the level of 1%, which shows that the previous difi, coverage brd, digital degree pay, and usage depth dpth all have an obvious inhibitory effect and then promotes the development of the current urban green economy. H1 still holds.
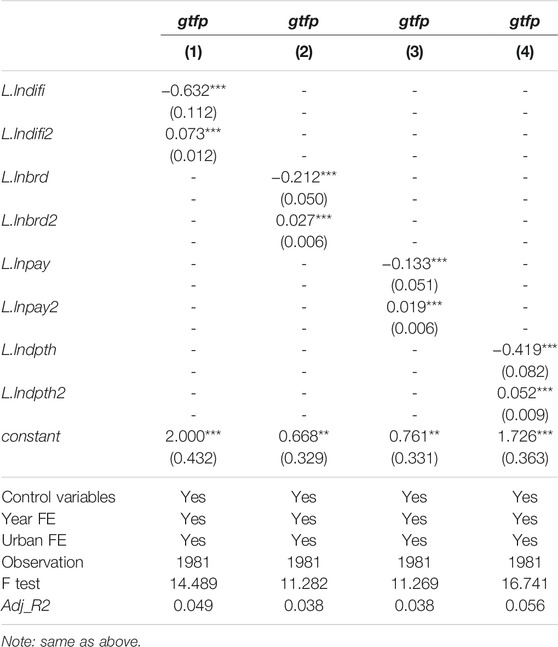
TABLE 9. Estimated results of dealing with reverse causal problems.
Due to the endogenous problems caused by missing variables, measurement errors and simultaneous causality, instrumental variables are used for further testing. Referring to Liang and Zhang (2019), this paper takes Internet popularity (number of Internet users) as the IV of the DIF and adopts the two-stage least square method (2SLS) to identify the causal relationship between the DIF and the green total factor productivity. Through correlation analysis, there is a close relationship between the Internet users and the DIF, which satisfies the correlation characteristics of IV, while there is no direct relationship between Internet users and the green total factor productivity, which satisfies the exclusive characteristics of IV. Therefore, it is reasonable to take the number of Internet users as the IV of the DIF.
Table 10 reports the estimated results with the number of Internet users as the IV. There is a significant positive relationship between the first-order coefficient of Internet popularity and the core explanatory variables in this paper and a significant negative relationship between the second-order coefficient of Internet popularity and the core explanatory variables in this paper, and the F statistic in the first stage is far greater than 10, indicating that there is no weak IV. Columns (1) to (4) of Table 10, respectively, report the impact of the DIF index and its subdimensions on the green total factor productivity after the introduction of IV. The estimation results of IV show that the DIF index and the first term of subdimensions have a significant negative inhibitory effect on green total factor productivity, while the DIF index and the square term of subdimensions significantly promote the improvement of green total factor productivity. H1 holds.
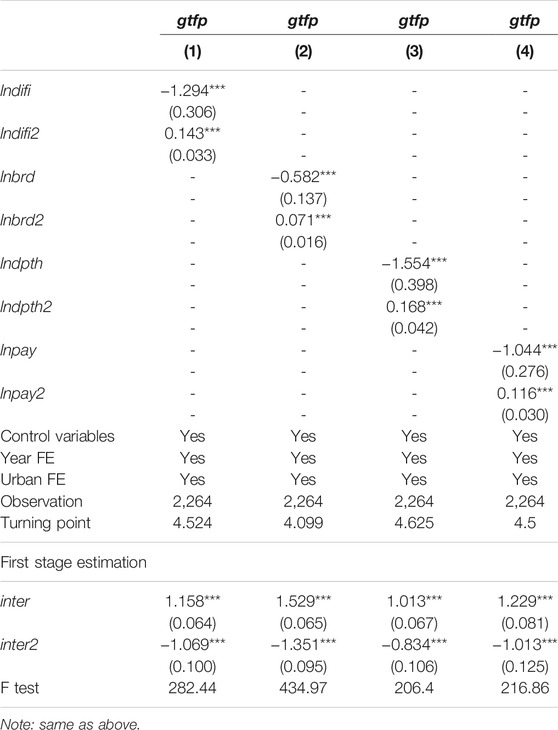
TABLE 10. Estimation results of IV.
In order to test the influence of the DIF on the level of green economy in different geographical locations. The columns (1)–(3) of Table 11, respectively, report the regression results of heterogeneity analysis in eastern, central, and western regions, and the regression results show that the linear estimation coefficient of the DIF in eastern, central, and western regions is significantly negative, while the quadratic estimation coefficient of the DIF in eastern, central, and western regions is significantly positive, all of which are significantly positive at the statistical level of 1%, and the promotion effect on eastern, central, and western regions decreases in turn. This shows that, in the early stage of the development of the DIF, the resource endowments and government support policies of different regions are different, and the role of the DIF on green total factor productivity is very small, which is likely to play a restraining role. For those cities with relatively perfect financial development, the coverage of the DIF gradually expands, which can provide a good financing environment for enterprises, thereby promoting the development of green economy.
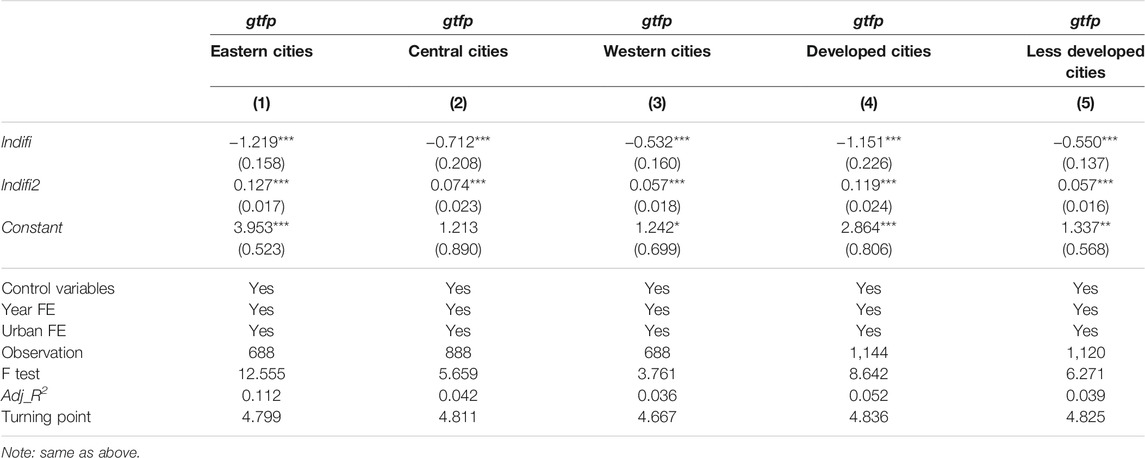
TABLE 11. Heterogeneity test results.
In this paper, 283 cities are divided into more developed cities and less developed cities for regression, with the national average per capita GDP (lnpgdp is 10.6) as the boundary. Column (4) and column (5) in Table 11, respectively, report the impact of the DIF of more developed cities and less developed cities on level of green economy. The results show that the regression coefficient of the first term of the DIF development to green total factor productivity is significantly negative at 1%, while the regression coefficient of the second term of the DIF development to green total factor productivity is significantly positive at 1%. The regression coefficients of the first and second terms of the development of the DIF to green total factor productivity are significantly negative and positive at the level of 1% and have a more significant impact on the former. This may be due to the fact that, compared with general prefecture-level cities and regions, digital financial inclusion plays a significant role in promoting the development of a green economy in key cities.
In this part, we use the research of Baron and Kenny (1986) as a reference to investigate the relationship between the DIF and the development level of green economy. Considering the nonlinear relationship between the DIF and green total factor productivity, we use the research of Chen et al. (2019) as a reference to set up a mediation model with the square term of core explanatory variables, and the specific model is as follows:
Among them, in Eq. 7, upd represents the upgrading of the industrial structure. If the coefficients
This paper focuses on the analysis of the nonlinear relationship between the DIF and green total factor productivity. In Table 12, we add the first term and the second term of the DIF to test the intermediary effect. The results of columns (1) to (3) show that there is a significant U-shaped curve relationship between the DIF and green total factor productivity, and there is a significant U-shaped curve relationship between the DIF and industrial structure upgrading. When the effects of the DIF and industrial structure upgrading on green total factor productivity are investigated at the same time, the first term coefficient of the DIF rises from −0.647 to −0.548, and the second term coefficient of the DIF drops from 0.068 to 0.055. Because of the addition of quadratic term, it is impossible to measure the size of the mediation effect, but the turning point changes of the two models can be calculated, and the turning point of the first column is 4.757, while the turning point of the third column is 4.982, which indicates that adding industrial structure upgrading factors will significantly shift the turning point to the right, which indirectly indicates that industrial structure upgrading plays a masking effect between the DIF and green total factor productivity. H2 holds.
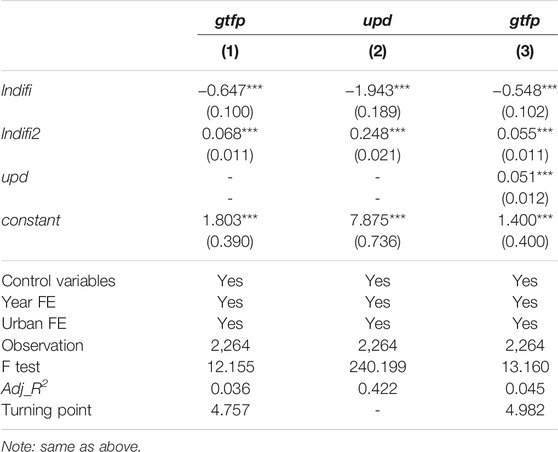
TABLE 12. Analysis of industrial structure upgrading effect of the DIF.
Table 13 examines the moderating effect of producer services agglomeration between the DIF and the development level of green economy. The results in column (1) show that the first and second term coefficients of the DIF are significantly negative and positive, and the dag coefficient is significantly positive, indicating that the agglomeration of producer services has significantly promoted the development of a green economy. According to the results in column (2), the coefficients of the interaction terms between the primary and secondary terms of DIF and the agglomeration of producer services are significantly negative and positive, respectively, which indicates that producer service agglomeration plays a role in regulating the DIF and green total factor productivity; that is, it strengthens the U-shaped relationship between the development of the DIF and green total factor productivity. H2 holds.

TABLE 13. Regulatory effect of producer services agglomeration.
Based on the urban panel data from 2011 to 2018, this paper investigates the impact of the DIF on the level of economic green development and its internal mechanism. The results show that there is a significant U-shaped relationship between the DIF and green total factor productivity. The estimation results of the threshold model show that there is a double threshold effect between the DIF and the level of economic green development. Taking Internet popularity as an IV and adopting the two-stage least square method to deal with the potential endogenous problems, the results still confirm that there is a U-shaped curve relationship between the DIF and green total factor productivity. The research conclusion is still valid after the robustness test from the perspectives of replacement explained/explained variables and replacement estimation methods. The heterogeneity test results show that the turning point of the U-shaped curve of the DIF on green total factor productivity shows a trend in the middle, followed by the east, and later in the west; the impact of the DIF on green total factor productivity is more significant in areas with more developed cities. The impact mechanism research shows that the DIF can indirectly promote China’s development level of a green economy by improving the agglomeration degree of producer services and optimizing the upgrading of the industrial structure.
Based on the conclusions of empirical research, the policy enlightenments of this paper are as follows. Firstly, as a developing country, China should strengthen policy support to promote the development of the Internet and mobile payment and to popularize the DIF. Secondly, from the regional level, we should strengthen the integrated development of DIF and other industries to form the agglomeration effect of producer services, so as to drive the green development of various industries. Thirdly, from the enterprise level, small- and medium-sized and microenterprises should obtain financial resources through DIF to green industry.
Of course, there are still some deficiencies and further development directions in this paper. First, the heterogeneity analysis is not deep enough, and the future research will be further expanded from coastal areas, border areas, and urban agglomeration areas. Second, this paper only discusses the mechanism from the aspect of industrial structure, and the next step can be further analyzed from the perspective of green technology innovation and green production environment.
The original contributions presented in the study are included in the article/Supplementary Material, further inquiries can be directed to the corresponding author.
GL is responsible for the conception and structural design of the article, as well as the later revision of the paper; XF is responsible for writing and revising the first draft of the paper; ML is responsible for data processing and writing the first draft of the paper.
We acknowledge the financial support from the University Research Project of Anhui University of Finance and Economics (Research on the Green Development Effect of China’s Green Credit Policy) and the Graduate Research Innovation Fund of Anhui University of Finance and Economics (ACYC2019039; ACYC2019114).
The authors declare that the research was conducted in the absence of any commercial or financial relationships that could be construed as a potential conflict of interest.
All claims expressed in this article are solely those of the authors and do not necessarily represent those of their affiliated organizations or those of the publisher, the editors, and the reviewers. Any product that may be evaluated in this article or claim that may be made by its manufacturer is not guaranteed or endorsed by the publisher.
The Supplementary Material for this article can be found online at: https://www.frontiersin.org/articles/10.3389/fenvs.2021.762231/full#supplementary-material
Abid, M., Scheffran, J., Schneider, U. A., and Elahi, E. (2019). Farmer Perceptions of Climate Change, Observed Trends and Adaptation of Agriculture in Pakistan. Environ. Manag. 63 (1), 110–123. doi:10.1007/s00267-018-1113-7
Arellano, M., and Bover, O. (1995). Another Look at the Instrumental Variable Estimation of Error-Components Models. J. Econom. 68 (1), 29–51. doi:10.1016/0304-4076(94)01642-d
Baron, R. M., and Kenny, D. A. (1986). The Moderator-Mediator Variable Distinction in Social Psychological Research: Conceptual, Strategic, and Statistical Considerations. J. Personal. Soc. Psychol. 51 (6), 1173–1182. doi:10.1037/0022-3514.51.6.1173
Beaudry, C., and Schiffauerova, A. (2009). Who's Right, Marshall or Jacobs? the Localization versus Urbanization Debate. Res. Pol. 38 (2), 318–337. doi:10.1016/j.respol.2008.11.010
Chakravarty, S. R., and Pal, R. (2013). Financial Inclusion in India: An Axiomatic Approach. J. Pol. Model. 35 (5), 813–837. doi:10.1016/j.jpolmod.2012.12.007
Chen, X., Qiu, B., and Liu, X. (2019). Multicenter Structure and the Rising Status of Global Value Chain: Evidence from Chinese Enterprises. World Econ. 42 (08), 72–96.
Elahi, E., Abid, M., Zhang, L., Ul Haq, S., and Sahito, J. G. M. (2018). Agricultural Advisory and Financial Services; Farm Level Access, Outreach and Impact in a Mixed Cropping District of Punjab, Pakistan. Land use policy 71, 249–260. doi:10.1016/j.landusepol.2017.12.006
Elahi, E., Weijun, C., Jha, S. K., and Zhang, H. (2019a). Estimation of Realistic Renewable and Non-renewable Energy Use Targets for Livestock Production Systems Utilising an Artificial Neural Network Method: A Step towards Livestock Sustainability. Energy 183, 191–204. doi:10.1016/j.energy.2019.06.084
Elahi, E., Weijun, C., Zhang, H., and Abid, M. (2019b). Use of Artificial Neural Networks to rescue Agrochemical-Based Health Hazards: A Resource Optimisation Method for Cleaner Crop Production. J. Clean. Prod. 238, 117900. doi:10.1016/j.jclepro.2019.117900
Elahi, E., Weijun, C., Zhang, H., and Nazeer, M. (2019c). Agricultural Intensification and Damages to Human Health in Relation to Agrochemicals: Application of Artificial Intelligence. Land use policy 83, 461–474. doi:10.1016/j.landusepol.2019.02.023
Elahi, E., Khalid, Z., Weijun, C., and Zhang, H. (2020). The Public Policy of Agricultural Land Allotment to Agrarians and its Impact on Crop Productivity in Punjab Province of Pakistan. Land Use Policy 90, 104324. doi:10.1016/j.landusepol.2019.104324
Elahi, E., Khalid, Z., Tauni, M. Z., Zhang, H., and Lirong, X. (2021a). Extreme Weather Events Risk to Crop-Production and the Adaptation of Innovative Management Strategies to Mitigate the Risk: A Retrospective Survey of Rural Punjab, Pakistan. Technovation, 102255. doi:10.1016/j.technovation.2021.102255
Elahi, E., Zhang, H., Lirong, X., Khalid, Z., and Xu, H. (2021b). Understanding Cognitive and Socio-Psychological Factors Determining Farmers' Intentions to Use Improved Grassland: Implications of Land Use Policy for Sustainable Pasture Production. Land Use Policy 102, 105250. doi:10.1016/j.landusepol.2020.105250
Feng, C., Wang, M., Liu, G.-C., and Huang, J.-B. (2017). Green Development Performance and its Influencing Factors: A Global Perspective. J. Clean. Prod. 144 (2), 323–333. doi:10.1016/j.jclepro.2017.01.005
Fu, H., Mao, Y., and Song, L. (2013). An Empirical Study on the Impact of Innovation on the Advancement of Industrial Structure--Based on Inter-provincial Panel Data from 2000 to 2011. China Ind. Econ. (09), 56–68. doi:10.19581/j.cnki.ciejournal.2013.05.005
Gu, H., Cao, Y., Elahi, E., and Jha, S. K. (2019). Human Health Damages Related to Air Pollution in China. Environ. Sci. Pollut. Res. 26 (13), 13115–13125. doi:10.1007/s11356-019-04708-y
Gu, H., Yan, W., Elahi, E., and Cao, Y. (2020). Air Pollution Risks Human Mental Health: an Implication of Two-Stages Least Squares Estimation of Interaction Effects. Environ. Sci. Pollut. Res. 27 (2), 2036–2043., doi:10.1007/s11356-019-06612-x
Hall, B. H. (2002). The Financing of Research and Development. Oxford Rev. Econ. Pol. 18 (1), 35–51. doi:10.1093/oxrep/18.1.35
Hamdouch, A., and Depret, M. H. (2012). Sustainable Development Policies and the Geographical Landscape of the green Economy: Actors, Scales and Strategies. Finisterra 47 (94), 49–80. doi:10.18055/Finis2681
Hansen, B. E. (1999). Threshold Effects in Non-dynamic Panels: Estimation, Testing, and Inference. J. Econom. 93 (2), 345–368. doi:10.1016/s0304-4076(99)00025-1
Hille, E., Shahbaz, M., and Moosa, I. (2019). The Impact of FDI on Regional Air Pollution in the Republic of Korea: a Way Ahead to Achieve the green Growth Strategy? Energ. Econ. 81, 308–326. doi:10.1016/j.eneco.2019.04.004
Jiang, S., and Zhou, X. (2021). Research on the Influence of Digital Inclusive Finance on High-Quality Economic Development. Financ. Forum 26 (08), 39–49.
Liang, B., and Zhang, J. (2019). Can the Development of Digital Financial Inclusion Inspire Innovation?——Evidence from Chinese cities and SMEs. Contemp. Econ. Sci. 41 (05), 74–86.
Liu, N., Liu, C., Xia, Y., Ren, Y., and Liang, J. (2020). Examining the Coordination between Green Finance and Green Economy aiming for Sustainable Development: A Case Study of China. Sustainability 12 (9), 3717. doi:10.3390/su12093717
Liu, Z.-J., Pypłacz, P., Ermakova, M., and Konev, P. (2020). Sustainable Construction as a Competitive Advantage. Sustainability 12 (15), 5946. doi:10.3390/su12155946
Ni, Y., Chen, B., and Wang, Y. (2020). Financial Development, Environmental Regulation and Green Total Factor Productivity: An Empirical Analysis Based on the Spatial Dubin Model. J. Guizhou Univ. Finance Econ. 38 (03), 12–21. doi:10.3969/j.issn.1003-6636.2020.03.002
Oh, D.-h. (2010). A Global Malmquist-Luenberger Productivity Index. J. Prod. Anal. 34 (3), 183–197. doi:10.1007/s11123-010-0178-y
Okuda, H., and Aiba, D. (2016). Determinants of Operational Efficiency and Total Factor Productivity Change of Major Cambodian Financial Institutions: A Data Envelopment Analysis During 2006-13. Emerging Markets Finance Trade 52 (6), 1455–1471. doi:10.1080/1540496x.2015.1105630
Ozili, P. K. (2018). Impact of Digital Finance on Financial Inclusion and Stability. Borsa Istanbul Rev. 18 (4), 329–340. doi:10.1016/j.bir.2017.12.003
Pai, M. K. (2016). The Technical Progress and Resilience in Productivity Growth of Korea's Growth-Leading Industries. Asian Econ. Pap. 15 (2), 167–191. doi:10.1162/asep_a_00441
Pan, W., Pan, W., Hu, C., Tu, H., Zhao, C., Yu, D., et al. (2019). Assessing the Green Economy in China: An Improved Framework. J. Clean. Prod. 209, 680–691. doi:10.1016/j.jclepro.2018.10.267
Peng, B., Zheng, C., Wei, G., and Elahi, E. (2020). The Cultivation Mechanism of Green Technology Innovation in Manufacturing Industry: From the Perspective of Ecological Niche. J. Clean. Prod. 252, 119711. doi:10.1016/j.jclepro.2019.119711
Peng, B., Yan, W., Elahi, E., and Wan, A. (2021a). Does the Green Credit Policy Affect the Scale of Corporate Debt Financing? Evidence from Listed Companies in Heavy Pollution Industries in China. Environ. Sci. Pollut. Res., 1–13.
Peng, B., Zhang, X., Elahi, E., and Wan, A. (2021b). Evolution of Spatial–Temporal Characteristics and Financial Development as an Influencing Factor of Green Ecology. Environ. Dev. Sustain., 1–21.
Sapna, D., and Nivedita, G. (2019). Effects of Inclusion of Delay in the Imposition of Environmental Tax on the Emission of Greenhouse Gases. Chaos, Solitons Fractals 125, 41–53. doi:10.1016/s0960-0779(19)30214-0
Siek, M., and Sutanto, A. (2019). “Impact Analysis of Fintech on Banking Industry,” in 2019 International Conference on Information Management and Technology (ICIMTech), Bali, Denpasar: IEEE 1, 356–361.
Van Tran, T., Elahi, E., Zhang, L., Magsi, H., Pham, Q., and Hoang, T. (2019). Historical perspective of climate change in sustainable livelihoods of coastal areas of the Red River Delta, Nam Dinh, Vietnam. Int. J. Clim. Change Strateg. Manage. 11 (5), 687–695. doi:10.1108/ijccsm-02-2018-0016
Xie, T., and Liu, J. (2019). How does Green Credit Affect China’s Green Economic Growth? China Popul. Resour. Environ. 29 (09), 83–90. doi:10.12062/cpre.20190501
Yang, H., and Jiang, L. (2021). Digital Economy, Spatial Effect and Total Factor Productivity. Stat. Res. 38 (04), 3–15. doi:10.19343/j.cnki.11-1302/c.2021.04.001
Zhang, J., Wu, G., and Zhang, J. (2004). China's Inter-Provincial Material Capital Stock Estimation: 1952-2000. Econ. Res. 50 (10), 35–44. doi:10.3969/j.issn.1002-9753.2017.09.015
Zhang, F. (2017). Theoretical and Empirical Research on the Influence of Financial Development on Green Total Factor Productivity. China Soft Sci. 32 (09), 154–167.
Keywords: digital inclusive finance, economic green development, China, internal mechanism, upgrading of industrial structure
Citation: Li G, Fang X and Liu M (2021) Will Digital Inclusive Finance Make Economic Development Greener? Evidence From China. Front. Environ. Sci. 9:762231. doi: 10.3389/fenvs.2021.762231
Received: 21 August 2021; Accepted: 21 September 2021;
Published: 11 November 2021.
Edited by:
Faik Bilgili, Erciyes University, TurkeyReviewed by:
Mohamed R. Abonazel, Cairo University, EgyptCopyright © 2021 Li, Fang and Liu. This is an open-access article distributed under the terms of the Creative Commons Attribution License (CC BY). The use, distribution or reproduction in other forums is permitted, provided the original author(s) and the copyright owner(s) are credited and that the original publication in this journal is cited, in accordance with accepted academic practice. No use, distribution or reproduction is permitted which does not comply with these terms.
*Correspondence: Maotao Liu, MjUxNDMwNjE1M0BxcS5jb20=
Disclaimer: All claims expressed in this article are solely those of the authors and do not necessarily represent those of their affiliated organizations, or those of the publisher, the editors and the reviewers. Any product that may be evaluated in this article or claim that may be made by its manufacturer is not guaranteed or endorsed by the publisher.
Research integrity at Frontiers
Learn more about the work of our research integrity team to safeguard the quality of each article we publish.