 Guodong Bian1,2,3,4
 Jianyun Zhang1,2,3,4Jie Chen1Mingming Song2,3,4Ruimin He2,3,4Cuishan Liu2,3,4Yanli Liu2,3,4Zhenxin Bao2,3,4
 Qianguo Lin5
 Guoqing Wang2,3,4*
- 1State Key Laboratory of Water Resources and Hydropower Engineering Science, Wuhan University, Wuhan, China
- 2Nanjing Hydraulic Research Institute, Nanjing, China
- 3Yangtze Institute for Conservation and Development, Nanjing, China
- 4Research Center for Climate Change, Ministry of Water Resources, Nanjing, China
- 5College of Environmental Science and Engineering, North China Electric Power University, Beijing, China
The influence of climate change on the regional hydrological cycle has been an international scientific issue that has attracted more attention in recent decades due to its huge effects on drought and flood. It is essential to investigate the change of regional hydrological characteristics in the context of global warming for developing flood mitigation and water utilization strategies in the future. The purpose of this study is to carry out a comprehensive analysis of changes in future runoff and flood for the upper Huai River basin by combining future climate scenarios, hydrological model, and flood frequency analysis. The daily bias correction (DBC) statistical downscaling method is used to downscale the global climate model (GCM) outputs from the sixth phase of the Coupled Model Intercomparison Project (CMIP6) and to generate future daily temperature and precipitation series. The Xinanjiang (XAJ) hydrological model is driven to project changes in future seasonal runoff under SSP245 and SSP585 scenarios for two future periods: 2050s (2031–2060) and 2080s (2071–2100) based on model calibration and validation. Finally, the peaks over threshold (POT) method and generalized Pareto (GP) distribution are combined to evaluate the changes of flood frequency for the upper Huai River basin. The results show that 1) GCMs project that there has been an insignificant increasing trend in future precipitation series, while an obvious increasing trend is detected in future temperature series; 2) average monthly runoffs in low-flow season have seen decreasing trends under SSP245 and SSP585 scenarios during the 2050s, while there has been an obvious increasing trend of average monthly runoff in high-flow season during the 2080s; 3) there is a decreasing trend in design floods below the 50-year return period under two future scenarios during the 2050s, while there has been an significant increasing trend in design flood during the 2080s in most cases and the amplitude of increase becomes larger for a larger return period. The study suggests that future flood will probably occur more frequently and an urgent need to develop appropriate adaptation measures to increase social resilience to warming climate over the upper Huai River basin.
1 Introduction
Climate change associated with global warming, mainly owing to the rise of greenhouse gas emissions in the atmosphere, has caused an increase of the evapotranspiration over the land surface, which in turn has accelerated the hydrological cycle and altered the hydrological element (Arnell and Gosling, 2013; Schewe et al., 2014; Wang et al., 2017). Recently, several studies have already suggested signs of adverse impacts on availability of water resources due to global warming in different regions around the world (Feyen et al., 2012; Yoon et al., 2016; Byun et al., 2018; Gu et al., 2020). Moreover, there is strengthened evidence that the global water cycle will continue to intensify as global temperatures rise, with precipitation and surface water flows projected to become more variable over most land regions (IPCC, 2021). A warmer climate will intensify very wet and very dry weather and climate events. These extreme events are expected to trigger further, leading to increasing weather-related hazards such as destructive flooding or drought, which possibly pose tremendous societal, economic, and environmental challenges around the world. Therefore, it is of great necessity to enhance the understanding of future changes in the hydrological responses and flood characteristics under the context of climate change to provide support for appropriate adaptation strategies and water resources management.
In recent years, the global climate models have been proven to be the most versatile and effective tool for producing potential climatic scenarios in the future by many studies, which have been extensively applied in investigating the effects of climate change on the hydrological cycle and water resource management (Masood et al., 2015; Amin et al., 2017; Zhuan, et al., 2018). However, the coarse grids of GCMs are generally unable to acquire climate variability at the basin scale; the downscaling techniques are developed to convert GCM outputs with coarse resolution to a finer scale for generating daily series of climate variables representing the future climatic scenarios. Compared to dynamic downscaling techniques, statistical downscaling methods are more widely used owing to their relatively good performance and inexpensive computational expense (Shen et al., 2018; Gu et al., 2020). Moreover, the bias correction approaches are usually used considering their convenience and good ability in identifying extreme climatic features among those statistical downscaling methods (Ahmadalipour et al., 2018). Based on the results of the aforementioned techniques, a hydrological model can be used to project and evaluate future changes in hydrological characteristics from global and regional perspectives (Jung and Chang., 2011; Alkama et al., 2013; Li et al., 2015; Winsemius et al., 2016; Glenn et al., 2017; Wang et al., 2020). For example, Koirala et al. (2014) used runoff outputs from 11 AOGCMs from phase 5 of the Coupled Model Intercomparison Project (CMIP5) to evaluate the changes in global streamflow. They found that high flow had a rising trend over northern high latitudes of Eurasia and North America, Asia, and eastern Africa under emission scenario RCP4.5 and RCP8.5, while mean and low flows were both projected with a decreasing trend in Europe, Middle East, southwestern United States, and Central America. Zheng et al. (2018) projected the changes of future climate and runoff for the south Asia region under the RCP8.5 scenario using 42 CMIP5 GCMs, three downscaling techniques, and an H08 model. Their results indicated that the change in precipitation was the main driving factor leading to the increase in future runoff throughout most of the study region.
Moreover, flood is the most serious disaster related to climate, and it is projected to become more frequent and intense as global warming (IPCC., 2013; Du et al., 2019; IPCC, 2021). Due to the characteristics of the basin and river networks, the Huai River basin is the worst hit area threatened by frequent flood disasters since ancient times, and the flood severity of this area ranks first among the major rivers over China. Recently, the basin-wide floods in 1991, 2003, and 2007 are acknowledged as the most destructive events on record in the Huai River basin, which have resulted in considerable losses with millions of emergency relocation and billions of economy loss (Zhang and You, 2014). These associated socioeconomic damages in the Huai River basin will be even more progressively intensified under the background of climate change. Therefore, investigating the changes in flood characteristics over the Huai River basin is of great importance to formulate regional flood risk mitigation measures for future climatic scenarios. The conventional approach to calculate future design floods is using historical data only by fitting probability distribution functions, while it may not truly reflect the probable future scenario of extreme events due to the climate change. To overcome these shortcomings, climate models and projections are widely employed. In the previous studies, they found that results of the CMIP5 models have shown strong agreement on an array of flood variations (Silva and Portela, 2018; Nam et al., 2019; Tabari, 2020). For instance, Nyaupane et al. (2018) employed the variable infiltration capacity (VIC) model to analyze the change in flood frequency under various future emission scenarios from CMIP5 data for the study basin. They found that there existed a rising trend of the future streamflow in the study area, and the future flood with a 100-year return period likely would be more than 2 times the present flood with a 100-year return period, highlighting the likelihood of the intensification of the risk of future flooding. Gao et al. (2020) used four GCMs drawn from CMIP5 in conjunction with GR4J model to evaluate the variations of future extreme floods in the context of climate change in the Qu river basin of east China under RCP4.5 and RCP8.5 scenarios. They applied the POT method and generalized Pareto distribution and found that a rising tendency of design floods was projected at most cases in the future climate scenarios for the study area.
Despite global climate models from CMIP5 projections effectively providing some useful information on how climate change will affect the future flood, it is necessary to re-evaluate the status of these effects once new datasets and research approaches become available (Cook et al., 2020). Hence, the release of the latest and most advanced climate models from phase 6 of the Coupled Model Intercomparison Project (CMIP6) provides a new opportunity to obtain more credible understanding of influences of climate change on hydrology and to review conclusions from previous community modeling efforts. Thus, the specific purposes of this study are to investigate variations in precipitation, runoff, and flood for the upper Huai River basin under a series of 21st-century development and radiative forcing scenarios informed by the CMIP6 models. The structure of this article contains the following five sections: First, Section 2 introduces the detailed information of the study area and data. Then the employed approaches are described in Section 3, including the downscaling technique, hydrological model, and the POT approach. Section 4 evaluates the potential influences of climate change on future runoff and flood. Finally, the discussion and conclusion are detailed in Sections 5, 6, respectively.
2 Study Area and Data
2.1 Study Area
The Huai River basin is located between 30°55′N–38°20′

FIGURE 1. Location, topography, and river network of the upper Huai River basin, and the distribution of meteorological grids and hydrological stations.
2.2 Data
In this study, the 1980–2014 daily precipitation and temperature data are obtained from observational gridded datasets, with a 0.25° horizontal resolution, which can be downloaded from the website of the National Meteorological Information Center of the China Meteorological Administration (http://cdc.cma.gov.cn/). These observational gridded datasets are interpolated from observations of nearly 2,400 quality-proven stations all over China (Xu et al., 2009). Moreover, the Thiessen polygon method is used to calculate the basin-averaged daily precipitation and temperature data by the gridded datasets for the study basin. The 1980–2014 daily runoff data of Xixian station are obtained from the Hydrology Bureau of the Huai River basin.
To analyze the future climatic scenarios, four GCM outputs (BCC-CSM2-MR, CanESM5, CESM2, and MRI-ESM2-0) from the latest CMIP6 are chosen under two SSP-RCP scenarios (i.e., SSP245 and SSP585). Meanwhile, we downloaded the essential model outputs (daily precipitation and daily temperature) for both the historical period (1980–2014) and future period (2015–2100). The detailed information of the chosen models is listed in Table 1. According to the latest studies (O’Neill et al., 2013; Simpkins, 2017; Su, et al., 2021), the state-of-the-art scenarios become more plausible as the shared socioeconomic pathways (SSPs) work in harmony with RCPs by shared policy assumptions. There are five SSP scenarios that represent the possible future socioeconomic conditions and describe various combinations of mitigation and adaptation challenges, including SSP1: sustainability; SSP2: middle of the road; SSP3: regional rivalry; SSP4: inequality; and SSP5: fossil fuel development (Huang et al., 2019; Su et al., 2021). Among these scenarios, SSP245 and SSP585 are selected for this study as the updated versions of the RCP 4.5 and RCP8.5 scenarios from CMIP5.

TABLE 1. Detail information of four selected GCMs from CMIP6.
3 Methodologies
3.1 Methodology Framework
Figure 2 displays the methodology framework of this study, including three major modules of climate scenario projection, hydrological model, and impact assessment. The module of scenario projection produces climatic scenarios during historical and future periods. The hydrological model module involves the calibration and validation of the XAJ model and calculation of daily runoff simulation under historical and future climatic scenarios. The impact assessments module is applied to investigate the runoff seasonality variations and to quantify the potential impacts of climate change on future design flood.
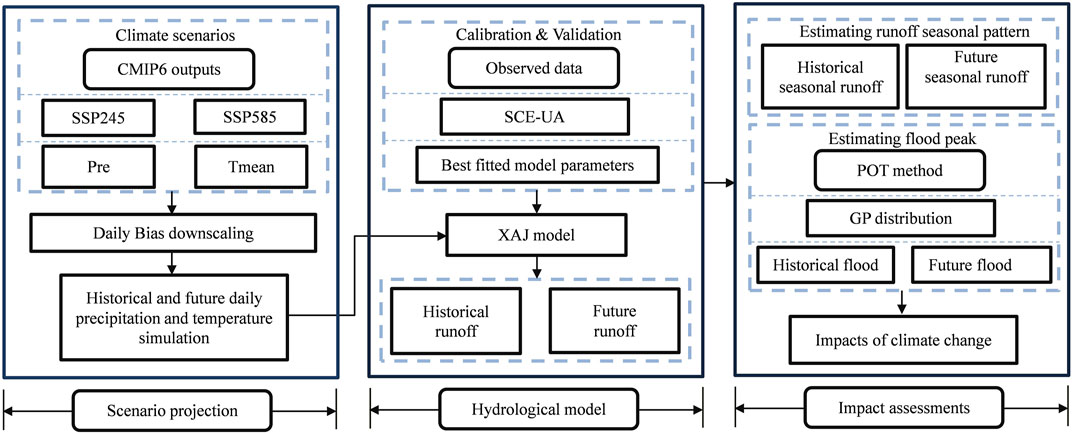
FIGURE 2. Methodology framework of future climate change impacts on seasonal runoff pattern and flood characteristics in the Xixian basin.
3.2 Xinanjiang Hydrological Model
The XAJ model, a conceptual hydrological model, is developed by Zhao (1992). The physical basis of this model is the theory that runoff generation occurs until the saturated condition of soil water is reached. The XAJ model involves 16 free parameters (see Table 2) and has been extensively and successfully applied in runoff simulation and flood forecasting for the humid and semi-humid zones over China. The detail of the XAJ model can be found in Zhang et al. (2012). The basin-average daily precipitation and daily potential evapotranspiration (PET) data are calculated as the inputs of this model, and then the discharge at the basin outlet is the final output. The PET is calculated by the Oudin temperature–based method (Oudin et al., 2005) in this study. Although this method requires only average daily temperature data as input, it has been proved to be an alternative to other complex methods, such as the Penman method, for the hydrological simulations (Oudin et al., 2005). Specifically, the formulas for potential evapotranspiration are presented as follows:
where PET refers to the potential evapotranspiration (mm day−1), Re refers to extraterrestrial radiation (MJ m−2 day−1), depending only on latitude and Julian day, λ refers to the latent hear flux (MJ kg−1), ρ refers to the density of water (kg m−3), and Ta is mean daily air temperature (°C).
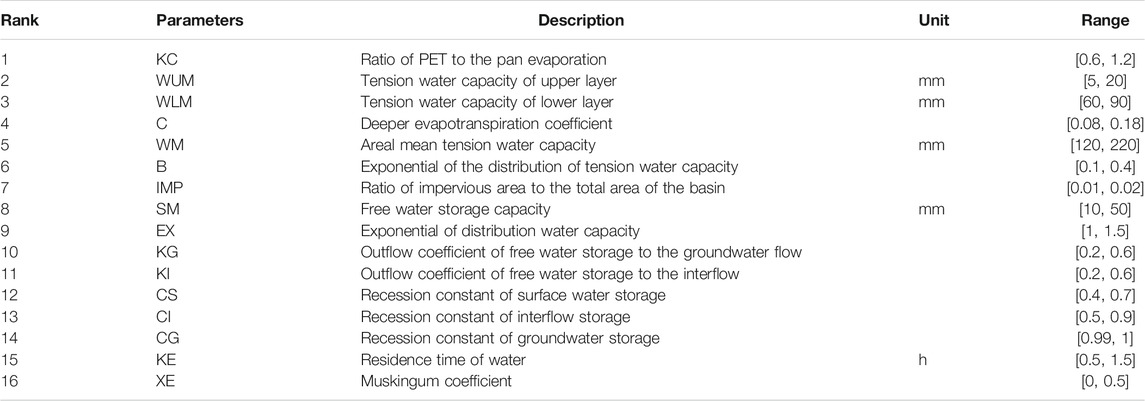
TABLE 2. Parameters of XAJ model.
Furthermore, we select the shuffled complex evolution optimization algorithm (SCE-UA, Duan et al., 1992) to calibrate the XAJ hydrological model. The Kling–Gupta efficiency (KGE) is selected as the evaluation index in this study, and the objective function is to maximize the KGE value during calibration. The KGE value could be calculated as follows (Gupta et al., 2009):
where r indicates Pearson’s linear correlation coefficient between the observed and simulated streamflow, α is the ratio of standard deviations of observed and simulated streamflow, and β is the ratio of the mean value of observation and simulations. The value of KGE ranges from −∞ to 1, with KGE = 1 indicating a perfect fit between the observed and simulated series.
3.3 Daily Bias Correction Approach
The DBC approach is an empirical statistical downscaling approach and has recently been used to correct the systematical errors of raw GCM scenarios (Chen et al., 2013b). The procedures of these methods are calculated as follows: First, the precipitation occurrence of each GCM output is revised by a determined threshold defined month by month from the historical period, which can ensure that the corrected historical precipitation has the same frequency as observations. Then those thresholds are employed to correct the frequency of rainy days for the future period. Furthermore, the daily precipitation distribution of each month is revised by multiplying (or adding) the quantile ratios (or differences) between the observations and GCM simulations during the historical period. Finally, those quantile ratios (or differences) are applied to correct distribution of daily precipitation during the future period. Definitely, these procedures can also be used for temperature correction. The formulas can be expressed as follows:
where the subscript Q is a quantile for a month, the subscript d is a specific day in the historical or future period, and the subscript adj is the corrected variables.
3.4 Peak Over Threshold Method
In this study, the POT approach is employed to extract a number of flood samples each year that are required to exceed the threshold S determined by certain criteria. Compared to annual maximum series method (AMS), this method has the core advantage, allowing more reasonable events to be identified as “floods” for extreme value analysis. Thus, the POT method can not only overcome the shortcoming of short historical data but also provide a more comprehensive description of the “flood” process (Lang et al., 1999). Accordingly, this method has been commonly employed in the estimation of extreme precipitation and temperature and the frequency analysis of flood runoff, and so on (Solari et al., 2017; Lee et al., 2019; Bian et al., 2020; Yang et al., 2020). In this study, the POT method is conducted for flood frequency analysis. The first key step is to ensure that the sampled flood events satisfy the independence condition. Here, the criteria evaluated by Silva et al. (2012) are employed, which indicates that the successive two flood peaks can be accepted when they meet the following formula:
where D refers to the interval time between two flood peaks in days, A denotes the basin area in km2, and Q1 and Q2 are the magnitudes of two flood peaks in m3/s, respectively.
In addition, an appropriate threshold is required to determine to guarantee that the frequency distribution of floods meets a Poisson function, which is another key point here. The mean number of over-threshold events per year μ should be more than two times per year as recommended by Mediero et al. (2014). Therefore, the mean annual number of flood events is set as μ = 3 under the independence assumption in this study. Last, the extracted series of flood peaks are fitted with a generalized Pareto (GP) distribution.
4 Results
4.1 Bias Correction Performance of Global Climate Models
The performances of GCMs are discrepant for different climate variables among various climate regions; thus, there is no common conclusion on how to select suitable GCMs in a particular basin. Therefore, it is necessary to assess the performances of the chosen models (i.e., BCC, CanESM, CESM, and MRI models) in order to investigate the influences of climate change on seasonal runoffs and floods in the Xixian basin. The systematical errors of raw GCM outputs are tackled by the DBC method. Afterward, 23 metrics (Table 3) are selected to describe mean and extreme values of precipitation and temperature series under climate change. The raw GCM simulations have the same historical period 1980–2014 with the observed data.

TABLE 3. List of evaluation metrics for precipitation and temperature.
Figure 3 is a color-coded “portrait diagram” showing the deviations of precipitation and temperature before and after DBC method during the historical period. It is can be seen that raw outputs of precipitation and temperature from four GCMs exhibit obvious deviations. The raw precipitations of GCMs deviate from observed precipitations by more than ±50% for most metrics, whereas the deviations of temperature are generally above ±2°C. However, the systematic biases of GCMs are significantly reduced after the DBC. The biases of precipitation effectively reduce to below 5% in most cases for the selected GCMs, and as for temperature, the biases reduce to lower than 0.1°C. Overall, the performances of bias correction for both precipitation and temperature simulation of GCMs are satisfied for the research requirement. Those results indicate that the DBC method is reliable for reproducing future climate variables in the study basin.
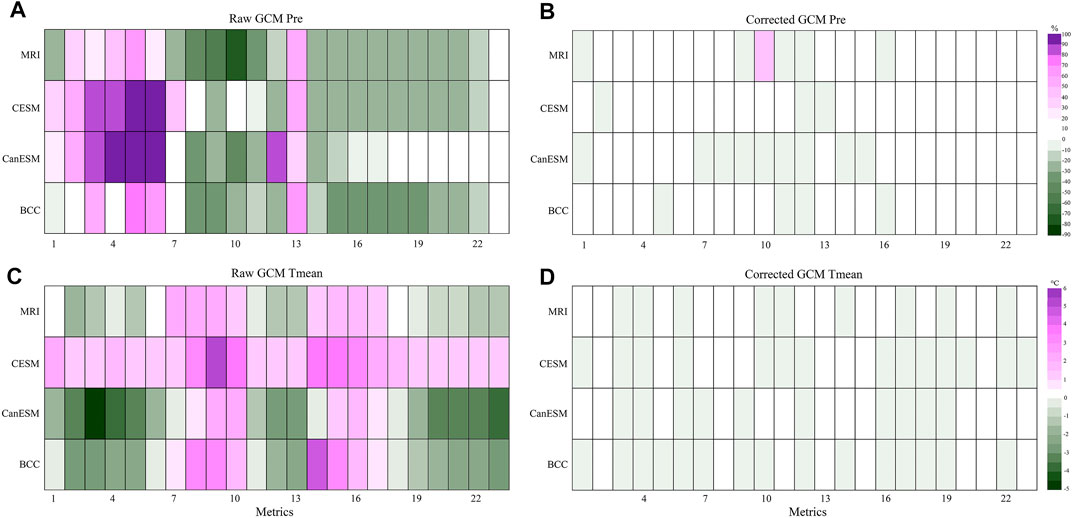
FIGURE 3. Portrait diagram of daily precipitation relative deviation (%) and temperature absolute deviation (°C) for the selected GCMs before and after DBC method in Xixian basin. The x-axis represents the 23 metrics, whereas the y-axis represents the GCMs.
4.2 Projected Variations of Precipitation and Air Temperature
The long-term changes of annual mean precipitation and temperature over the upper Huai River basin are detected during the period of 1980–2100 for each GCM under two different SSP–RCP scenarios (SSP245 and SSP585). Relative to the change of precipitation over the baseline period, there is a general rising trend during the future period, although the rising rate varies with different GCM and SSP scenarios (Figure 4). More specifically, BCC model projects the highest increasing rate of annual mean precipitation with a rising rate up to 28 mm per decade under SSP585 scenarios, while the minimum rising rate of annual mean precipitation with 10.3 mm per decade is projected by the MRI model. For SSP245 scenario, the increasing tendency of precipitation is more insignificant than that under SSP585 scenario.
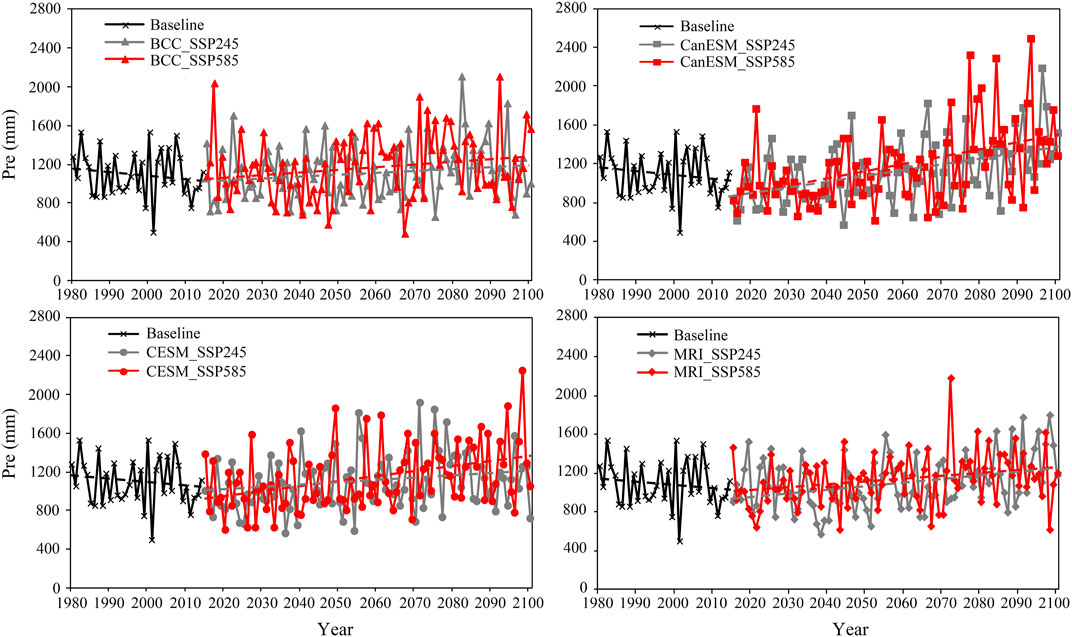
FIGURE 4. Trend results of annual mean precipitation for each GCM in the Xixian basin from 1980 to 2100.
In the field of the long-term tendency of annual mean temperature, Figure 5 shows that a significant increasing trend in temperature is observed during the period 1980–2100, and more significant increasing changing of temperature is observed under SSP585 scenario compared to the SSP245. In detail, the CanESM model releases the most pronounced warming signal, which projects that the annual average temperature has a significant rising rate of 0.37°C and 0.57°C per decade under SSP245 and SSP585 scenarios, respectively. The MRI model exhibits the most optimistic warming condition with an increase of 0.23°C and 0.33°C per decade under the two scenarios, respectively. The BCC and CESM models project that annual average temperature has a significant increase with a rate of 0.28 and 0.23°C per decade under SSP245, respectively, and with a maximum rate of 0.37°C per decade under SSP585 scenarios.
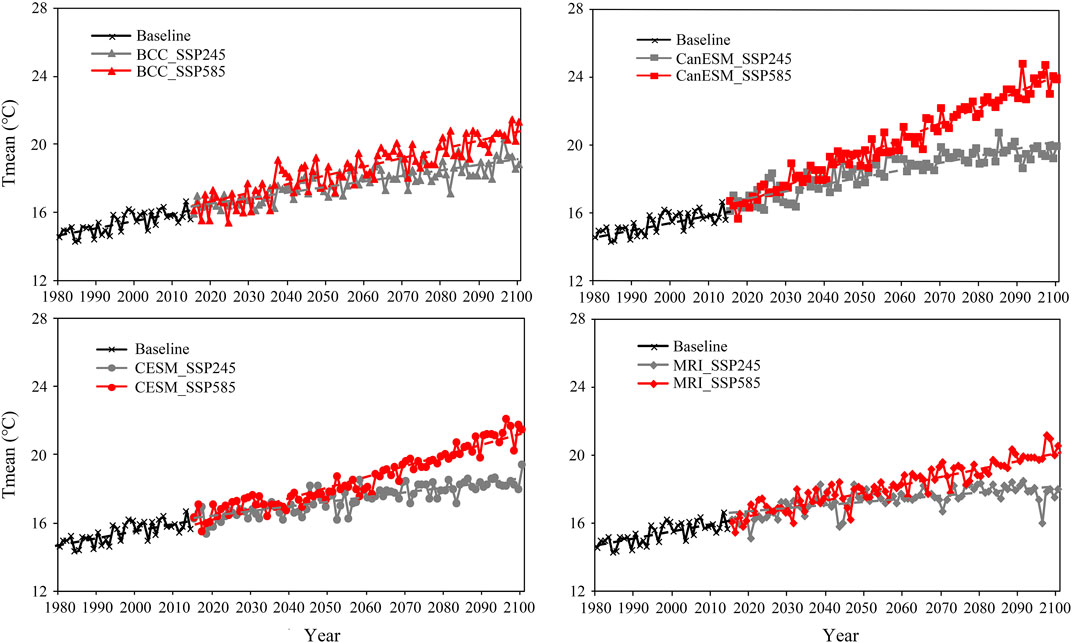
FIGURE 5. Trend results of annual average air temperature for each GCM in the Xixian basin from 1980 to 2100.
4.3 Calibration and Validation Results of Xinanjiang Model
In this study, XAJ model is adopted to simulate hydrological processes in the Xixian basin. Initially, we used the basin-averaged precipitation and temperature data during 1980–1999 to carry out the calibration of the XAJ model, and then the optimum model parameters are obtained with the largest KGE value. The 15-year period during 2000–2014 are used for model validation. To further investigate the performance of the XAJ model, the Nash–Sutcliffe efficiency coefficient (NSE) and relative bias (PBIAS) criteria are also employed.
Table 4 presents the results of calibration and validation periods for the Xixian basin. Furthermore, the comparisons between observed and simulated runoffs in two periods at the daily and monthly scale are presented in Figure 6, which suggest that the XAJ model performs well in the study basin though with overestimates or underestimates in the flood peaks in some cases. From Table 4, it can be seen that the KGE values are 0.86 and 0.91, respectively, at the monthly scale, and 0.79 and 0.82 at the daily scale for calibration and validation periods. In addition, the NSEs are 0.88 and 0.86, respectively, at the monthly scale, and 0.74 and 0.71 at the daily scale, and the PBIAS of the calibration and validation are both lower than 10%. These results indicate that the XAJ model can perform satisfactorily so that it can be used to project hydrological scenarios in subsequent research.

TABLE 4. Evaluation of the XAJ model performance at daily and monthly time step.
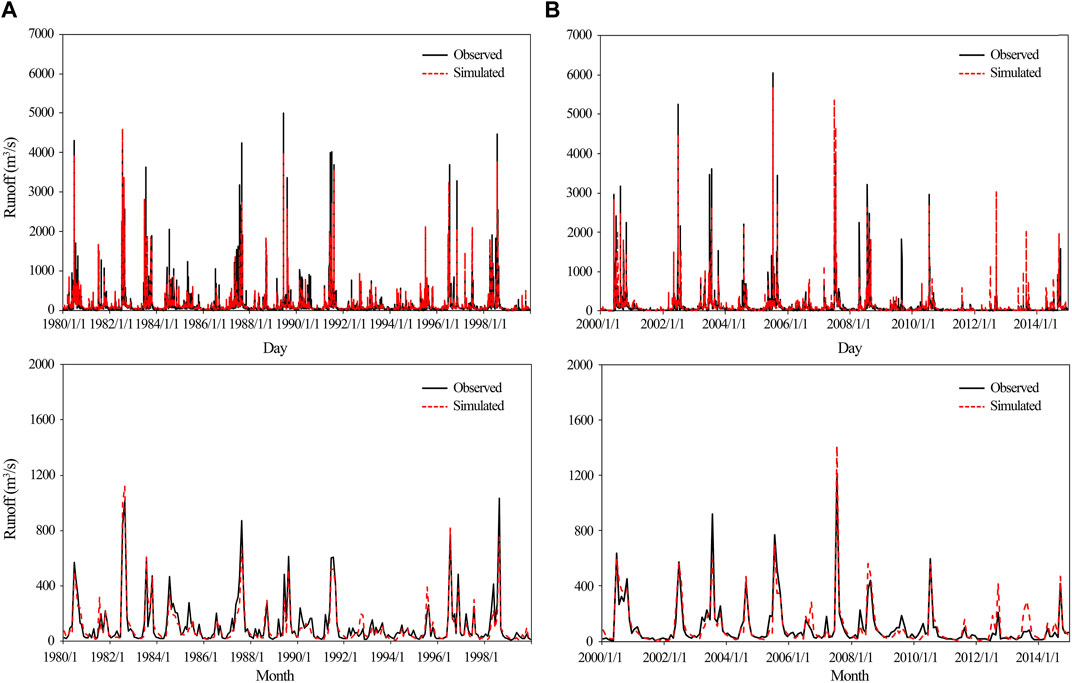
FIGURE 6. Performance of XAJ model for the calibration (A) and validation (B) periods at daily and monthly scale in the Xixian basin.
4.4 Impacts of Climate Change on Runoff Seasonal Pattern
To investigate the influence of climate change on monthly runoff over the Xixian basin, the XAJ model is used to simulate runoffs during the historical period (1980–2014) and two future periods: 2050s (2031–2060) and 2080s (2071–2100). Figure 7 demonstrates the monthly average runoff during the two future periods for each GCM under SSP245 and SSP585 scenarios. Broadly speaking, the selected GCMs perform similarly for change of monthly runoff under two scenarios, but there still exist some differences. Under SSP245 scenario, all GCMs project that runoffs of most months are generally smaller than those in the baseline period over the 2050s, while runoffs of high-flow season over the 2080s are larger than those in the baseline period, reflected in May to September. Moreover, the change patterns of seasonal runoffs under SSP585 scenario are similar to those under SSP245 scenario during the two future periods. These can be explained by the fact that precipitation simulations in the 2050s are equal to or less than those in the baseline period under SSP245 and SSP585 scenarios, while the higher temperature is projected. Thus, the projected monthly runoffs are smaller in the 2050s than those in the baseline period. In contrast, the precipitation simulations in the 2080s are obviously larger than those in the baseline period, which results in higher monthly runoffs. In addition, compared with SSP245, the monthly runoffs under SSP585 scenario are obviously higher, especially for high-flow months.
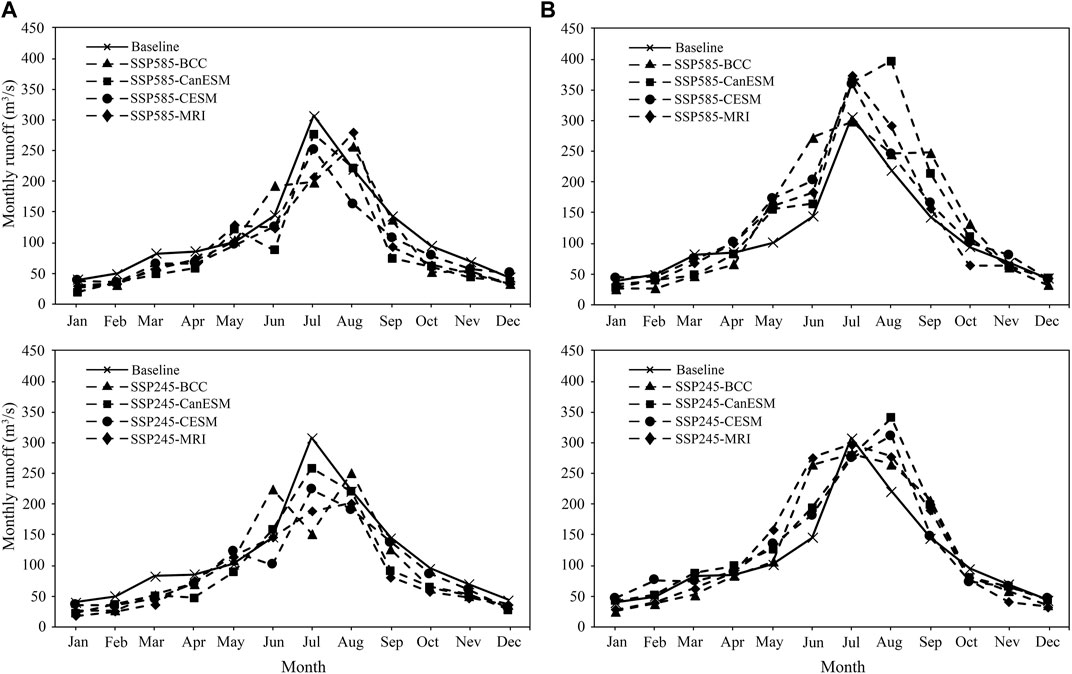
FIGURE 7. Seasonal runoffs of different GCMs under SSP245 (bottom) and SSP585 (top) scenarios during two future periods 2050s (A) and 2080s (B). “Baseline” denotes the results in the baseline period. “SSP245_BCC” denotes the results of BCC model under SSP245 scenario in the future period that as well applies to the other seven abbreviations.
Then, we further analyzed the variations of monthly runoff between the baseline and the two future periods under SSP245 and SSP585 scenarios, as shown in Figure 8. There is a large discrepancy between the changing trends of average monthly runoffs in the two future periods. During the 2050s, the monthly average runoffs in most months have seen decreasing trends for each GCM under SSP245 and SSP585 scenarios, generally occurring in the low-flow season such as January to April and September to December. It can be seen that the monthly average runoffs are lower than that in baseline period and have decreased by about 10 and 8% under SSP245 and SSP585 scenario, respectively. These indicate that there will be more serious water shortage and higher risk of drought during the 2050s in the upper Huai river basin. In addition, Figure 8 shows that there has been an obvious increasing trend of monthly average runoff in the high-flow season during the 2080s. In detail, compared to the baseline period, the GCMs project that the monthly runoffs have generally increased by about 29% from May to September under the SSP245 scenario. Under the SSP585 scenario, the monthly runoffs are projected to increase by approximately 39% from May to September. These may be caused by increasing seasonal precipitation in high-flow season under two future scenarios. Thus, there will be higher flood risk in high-flow season during the 2080s in the upper Huai river basin, especially under the SSP585 scenario, which also are proved in subsequent analyses of impacts of climate change on design floods.
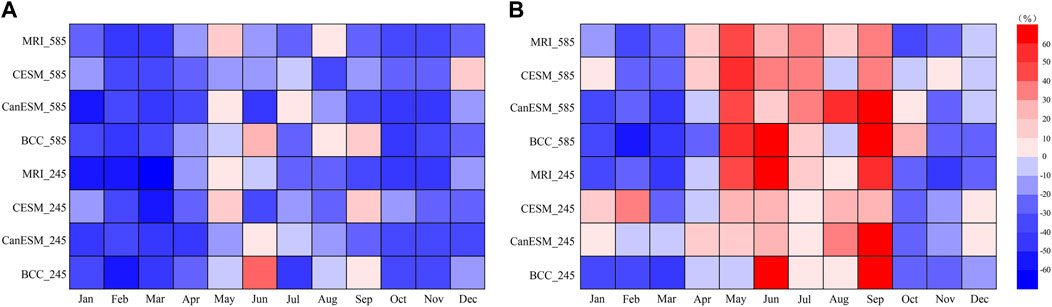
FIGURE 8. Relative change results of seasonal runoffs during two future periods 2050s (A) and 2080s (B) to the historical period.
4.5 Impacts of Climate Change on Design Floods
In order to analyze the changes of flood frequency, the flood peaks are extracted by the POT method in this study, which has been certified to be more reasonable than the annual maximum sampling approach (Mediero et al., 2014; Bian et al., 2020). Moreover, the L-Moment approach (Hosking and Wallis, 1997) is used to estimate the parameters of GP distribution. The design floods under SSP245 and SSP585 scenarios for each GCM during the two future periods are demonstrated in Figure 9. It can be seen that the change patterns of design floods are quite different between the 2050s and 2080s for each GCM under SSP245 and SSP585 scenarios. In detail, during the 2031–2060, the design floods are generally lower than those in baseline period for small return period under the two scenarios for each GCM. However, BCC and CanESM models project that the design flood with a 100-year return period is obviously bigger than that in baseline period under SSP585 scenario. As for the 2080s, there have been the obviously larger design floods for all GCMs under SSP245 scenarios comparing to the near future period. When the return period exceeds 20 years, the design floods of 2080s are larger than those of baseline period. Moreover, the design flood runoffs are projected to increase more significantly when the return periods increase. Under SSP585 scenarios, the design floods of 2080s are larger than those of baseline period when the return period exceeds 10 years. In addition, the flood magnitude with the same return period is greater than that under SSP245 scenario. These indicate that flood extremes are projected to increase during the future periods in the upper Huai River basin, especially under SSP585 scenario.
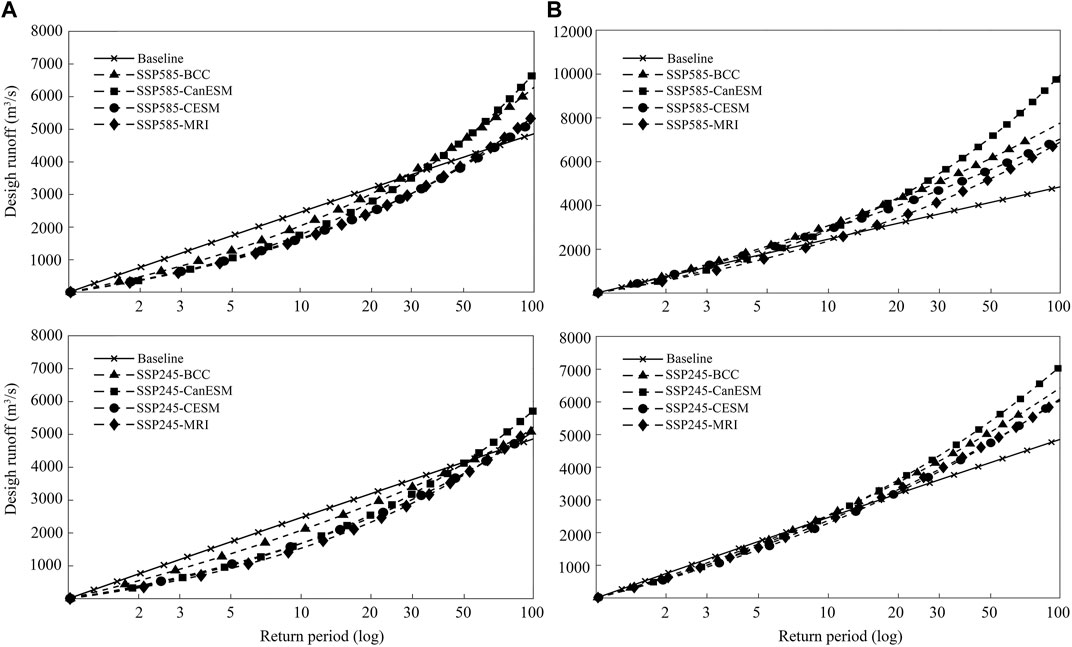
FIGURE 9. Design floods of different return periods for various GCMs under SSP245 (bottom) and SSP585 (top) scenarios during two future periods 2050s (A) and 2080s (B).
To further investigate the results as mentioned above, the changes of future floods are calculated for the 10, 20, 50, and 100-year return period, shown in Figure 10. It can be observed that the design floods of the 100-year return period are increasing for all GCMs under the SSP245 and SSP585 scenarios during the 2050s, especially the CanESM model, which exhibits the largest increasing rate with the 17.9 and 38.4% under SSP245 and SSP585 scenarios, respectively. However, there has been a general decreasing tendency of the design floods with 50, 20 and 10-year return periods during the 2050s under SSP245 scenario. As the return period decreases, the reducing range of design flood runoffs is exacerbated. In addition, Figure 10 demonstrates that the change patterns of design floods for 2080s show great differences from those in 2050s. All GCMs project obvious increasing trends of the design floods for all return periods under the two scenarios, except the design floods with a 10-year return period of CESM and MRI. In detail, CanESM projects that under SSP585 scenario, the rising rate of design floods for the 100-year and 50-year return periods in the 2080s can go up to 106 and 72%, respectively. For the BCC model, the design floods for 100-year and 50-year return periods increase by 60.6 and 48.7%, respectively, under SSP585 scenario. CESM model projects that the increasing rates of design floods for these two return periods are 45.4 and 36.4%, respectively, under SSP585 scenario, and those of MRI model increase by 42.8 and 26.5%, respectively. However, under SSP245 scenario, the increases of design floods with 100-year and 50-year return periods are far below that under the SSP585 scenario. These could be explained by the fact that the heavier emission of gas such as SSP585 scenario causes the larger extreme precipitation. These results indicate that the flood events are likely to occur more frequently during the far future period in the Xixian basin.
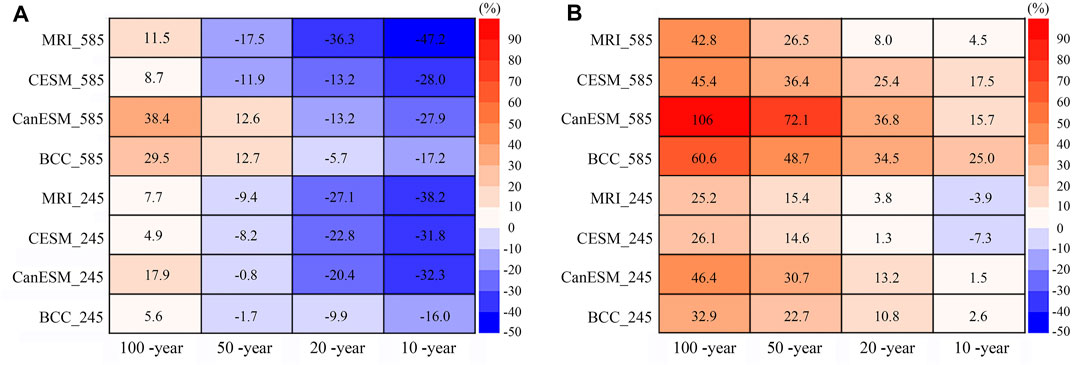
FIGURE 10. Relative changes of design floods with 100-year, 50-year, 20-year, and 10-year return periods during two future periods 2050s (A) and 2080s (B) to the baseline period.
5 Discussion
As we know, flood frequency is expected to increase as the hydrological cycle has been altered by climate change. This paper quantitatively evaluates the changes of future floods in response to climate change coupling of CMIP6 models and XAJ hydrological model in the Xixian basin. As expected, the main results demonstrated that extreme floods will increase under future climatic scenarios in the study area, which is consistent with the previous studies (Wang et al., 2018; Yang et al., 2020). Jin et al. (2017) used CMIP5 models to investigate the effects of climate change on flood in the upper Huai River basin during 2021–2050. They found that future floods were projected to increase under the RCP4.5 and RCP5.8 scenarios over the upper Huai River basin. The fact is that the heavier and more frequent precipitation extremes in future can be used to explain the intensification of extreme floods. Based on the Clausius–Clapeyron law, a 1 K increase in temperature is likely to cause the water vapor holding capacity to increase by about 7% (Trenberth et al., 2003). Therefore, a warmer atmosphere enables to supply more sufficient water vapor and enhances the occurrence of extreme precipitation. Although the physical mechanism of flood production is more complex, flood extremes are projected to increase when extreme precipitation events occur more frequently in the future. This has been confirmed by previous literature studies (Hirabayashi et al., 2013; Wu and Huang., 2015).
In this study, we use four CMIP6 GCMs, two SSP scenarios, one downscaling method, one hydrological model, and one frequent analysis approach to analyze the projections of possible changes range for future design floods during two time stages in the Xixian basin. The results show that GCM and SSP scenarios both cause large uncertainties in projections of floods under future climatic scenarios, which are in agreement with the previous literatures (Chen et al., 2013a; Basheer et al., 2016; Krysanova et al., 2017; Hattermann et al., 2018). Meanwhile, the discrepancy of the projected results from different GCM and SSP scenarios also emphasizes that the misleading conclusions may be drawn if only one GCM and SSP scenario is adopt for future climate change studies. In addition, there are some limitations in this study. First, we ignored the possible impacts of other important uncertainty sources in this study, involving downscaling methods, the structure and parameters of hydrological model, and the flood frequency distribution functions. Although many studies have suggested that GCMs generate much larger uncertainty comparing to those from downscaling techniques and hydrological models (Dobler et al., 2012; Karlsson et al., 2016; Das et al., 2018), this does not mean that the impacts of other uncertainty sourcing should be overlooked. Consequently, the next step of our study is to thoroughly analyze the uncertainties stemming from various uncertainty sources in the evaluation of effects of climate change on future floods. Second, human activities, including land-use change, water conservancy construction, and government policy, are another important driving factor affecting runoff and flood for the upper Huai River basin. Hence, future runoff responses to human activities and climate change are required to further accurately investigate in following works.
6 Conclusion
Based on four CMIP6 GCMs, this study investigates the potential influences of climate change on future seasonal runoffs and extreme floods in the upper Huai River basin. The statistical downscaling methods DBC is adopted to translate the GCM outputs with coarse resolution to regional and basin scale, and then the XAJ model is employed to simulate daily discharge for the baseline period (1980–2014) and two future periods: 2050s (2031–2060) and 2080s (2071–2100). The POT method and GP distribution are employed to estimate the changes in design floods for different return periods. The main conclusions are summarized as follows:
1) There is an insignificant increasing tendency of precipitation in the Xixian basin. The projection of annual mean precipitation has greater climate model uncertainty and roughly increases 11 mm (60 mm) under SSP245 (SSP585) scenario. In terms of the annual mean temperature, there is an obvious increasing trend with a rising rate of 0.59°C (0.36°C) per decade under SSP585 (SSP245) scenario.
2) The XAJ model performs well in simulating both monthly and daily runoffs demonstrated by validation results; thus, it enables to be employed to evaluate the potential influences of climate change on runoffs. Modeling outputs indicate that runoffs in most low-flow months have seen decreasing trends under SSP245 and SSP585 scenarios during the 2050s (2031–2060), while there has been an obvious increasing trend of most high-flow monthly average runoffs during the 2080s (2071–2100).
3) There is a pronounced increasing tendency in design floods with large return period under climate change. Especially the design flood for a 100-year return period is roughly projected to increase 42.8–106% for SSP585 scenario during the 2080s, and the amplitude of flood increase decreases with the decrease of the return period. For the 2050s period, design floods with small return periods have a decreasing trend under two scenarios, and as the return period decreases, the decreasing extent of design flood runoffs is exacerbated.
Data Availability Statement
The original contributions presented in the study are included in the article/Supplementary Material, further inquiries can be directed to the corresponding author.
Author Contributions
GB contributed to methodology, data curation, and writing—original draft preparation; JZ assisted with conceptualization and methodology; JC contributed to methodology, resources, and writing—review and editing; MS helped with data curation, visualization, and investigation; RH contributed to resources and writing—review and editing; CL supported in resources and writing—review and editing; YL contributed to resources and writing—review and editing; ZB assisted with resources and writing—review and editing; QL helped with writing—review and editing; and GW supported in conceptualization, funding acquisition, supervision, and writing—review and editing.
Funding
The study has been financially supported by the National Natural Science Foundation of China (Grants: 41830863, 51879162, 5167090940, 91847301, 92047203, 51879164, and 52121006), and the National Key Research and Development Programs of China (Grants: 2017YFA0605002, 2017YFC0404602 and 2021YFC3200201) and the Belt and Road Fund on Water and Sustainability of the State Key Laboratory of Hydrology-Water Resources and Hydraulic Engineering, China (2019nkzd02, 2020nkzd01).
Conflict of Interest
The authors declare that the research was conducted in the absence of any commercial or financial relationships that could be construed as a potential conflict of interest.
Publisher’s Note
All claims expressed in this article are solely those of the authors and do not necessarily represent those of their affiliated organizations, or those of the publisher, the editors and the reviewers. Any product that may be evaluated in this article, or claim that may be made by its manufacturer, is not guaranteed or endorsed by the publisher.
Acknowledgments
We thank the reviewers and editors.
References
Ahmadalipour, A., Moradkhani, H., and Rana, A. (2018). Accounting for Downscaling and Model Uncertainty in fine-resolution Seasonal Climate Projections over the Columbia River basin. Clim. Dyn. 50, 717–733. doi:10.1007/s00382-017-3639-4
Alkama, R., Marchand, L., Ribes, A., and Decharme, B. (2013). Detection of Global Runoff Changes: Results from Observations and CMIP5 Experiments. Hydrol. Earth Syst. Sci. 17 (7), 2967–2979. doi:10.5194/hess-17-2967-2013
Amin, M. Z. M., Shaaban, A. J., Ercan, A., Ishida, K., Kavvas, M. L., Chen, Z. Q., et al. (2017). Future Climate Change Impact Assessment of Watershed Scale Hydrologic Processes in Peninsular Malaysia by a Regional Climate Model Coupled with a Physically Based Hydrology Model. Sci. Total Environ. 575, 12–22. doi:10.1016/j.scitotenv.2016.10.009
Arnell, N. W., and Gosling, S. N. (2013). The Impacts of Climate Change on River Flow Regimes at the Global Scale. J. Hydrol. 486, 351–364. doi:10.1016/j.jhydrol.2013.02.010
Basheer, A. K., Lu, H., Omer, A., Ali, A. B., and Abdelgader, A. M. S. (2016). Impacts of Climate Change under CMIP5 RCP Scenarios on the Streamflow in the Dinder River and Ecosystem Habitats in Dinder National Park, Sudan. Hydrol. Earth Syst. Sci. 20, 1331–1353. doi:10.5194/hess-20-1331-2016
Bian, G. D., Du, J. K., Song, M., Zhang, X., Zhang, X., Li, R., et al. (2020). Detection and Attribution of Flood Responses to Precipitation Change and Urbanization: a Case Study in Qinhuai River basin, Southeast China. Hydrol. Res. 51 (2), 351–365. doi:10.2166/nh.2020.063
Byun, K., Chiu, C. M., and Hamlet, A. F. (2018). Effects of 21st century Climate Change on Seasonal Flow Regimes and Hydrologic Extremes over the Midwest and Great Lakes Region of the US. Sci. Total Environ. 650, 1261–1277. doi:10.1016/j.scitotenv.2018.09.063
Chen, J., Brissette, F. P., Chaumont, D., and Braun, M. (2013b). Finding Appropriate Bias Correction Methods in Downscaling Precipitation for Hydrologic Impact Studies over north America. Water Resour. Res. 49 (7), 4187–4205. doi:10.1002/wrcr.20331
Chen, J., Brissette, F. P., Chaumont, D., and Braun, M. (2013a). Performance and Uncertainty Evaluation of Empirical Downscaling Methods in Quantifying the Climate Change Impacts on Hydrology over Two North American River Basins. J. Hydrol. 479, 200–214. doi:10.1016/j.jhydrol.2012.11.062
Cook, B. I., Mankin, J. S., Marvel, K., Williams, A. P., Smerdon, J. E., Anchukaitis, K. J., et al. (2020). Twenty‐First Century Drought Projections in the CMIP6 Forcing Scenarios. Earth's Future 8 (6), e2019EF001461. doi:10.1029/2019ef001461
Das, J., Treesa, A., and Umamahesh, N. V. (2018). Modelling Impacts of Climate Change on a River Basin: Analysis of Uncertainty Using REA & Possibilistic Approach. Water Resour. Manage. 32, 4833–4852. doi:10.1007/s11269-018-2046-x
Dobler, C., Hagemann, S., Wilby, R. L., and Stötter, J. (2012). Quantifying Different Sources of Uncertainty in Hydrological Projections in an Alpine Watershed. Hydrol. Earth Syst. Sci. 16, 4343–4360. doi:10.5194/hess-16-4343-2012
Du, H., Alexander, L. V., Donat, M. G., Lippmann, T., Srivastava, A., Salinger, J., et al. (2019). Precipitation from Persistent Extremes Is Increasing in Most Regions and Globally. Geophys. Res. Lett. 46 (11), 6041–6049. doi:10.1029/2019gl081898
Duan, Q., Sorooshian, S., and Gupta, V. (1992). Effective and Efficient Global Optimization for Conceptual Rainfall-Runoff Models. Water Resour. Res. 28 (4), 1015–1031. doi:10.1029/91wr02985
Feyen, L., Dankers, R., Bódis, K., Salamon, P., and Barredo, J. I. (2012). Fluvial Flood Risk in Europe in Present and Future Climates. Climatic Change 112, 47–62. doi:10.1007/s10584-011-0339-7
Gao, C., He, Z., Pan, S., Xuan, W., and Xu, Y.-P. (2020). Effects of Climate Change on Peak Runoff and Flood Levels in Qu River Basin, East China. J. Hydro-environment Res. 28, 34–47. doi:10.1016/j.jher.2018.02.005
Glenn, A., Paul, H., Donald, H. B., Hannaford, J., Renard, B., Stahl, K., et al. (2017). Climate-driven Variability in the Occurrence of Major Floods across North America and Europe. J. Hydrol. 552, 704–717. doi:10.1016/j.jhydrol.2017.07.027
Gu, L., Yin, J., Zhang, H., Wang, H. M., Yang, G., and Wu, X. (2020). On Future Flood Magnitudes and Estimation Uncertainty across 151 Catchments in mainland China. Int. J. Climatol 41, 779–800. doi:10.1002/joc.6725
Gupta, H. V., Kling, H., Yilmaz, K. K., and Martinez, G. F. (2009). Decomposition of the Mean Squared Error and NSE Performance Criteria: Implications for Improving Hydrological Modelling. J. Hydrol. 377, 80–91. doi:10.1016/j.jhydrol.2009.08.003
Hattermann, F. F., Vetter, T., Breuer, L., Su, B., Daggupati, P., Donnelly, C., et al. (2018). Sources of Uncertainty in Hydrological Climate Impact Assessment: a Cross-Scale Study. Environ. Res. Lett. 13, 015006. doi:10.1088/1748-9326/aa9938
Hirabayashi, Y., Mahendran, R., Koirala, S., Konoshima, L., Yamazaki, D., Watanabe, S., et al. (2013). Global Flood Risk under Climate Change. Nat. Clim. Change 3, 816–821. doi:10.1038/nclimate1911
Hosking, J. R. M., and Wallis, J. R. (1997). Regional Frequency Analysis. Cambridge, UK: Cambridge University Press, 224.
Huang, J., Qin, D., Jiang, T., Wang, Y., Feng, Z., Zhai, J., et al. (2019). Effect of Fertility Policy Changes on the Population Structure and Economy of china: from the Perspective of the Shared Socioeconomic Pathways. Earth's Future 7, 250–265. doi:10.1029/2018ef000964
IPCC (2013). “Summary for Policymakers,” in Climate Change 2013: The Physical Science Basis. Contribution of Working Group I to the Fifth Assessment Report of the Intergovernmental Panel on Climate Change. TF Stocker, D Qin, G.-K. Plattner, M. Tignor, S. K. Allen, J. Boschunget al. (Cambridge, UK: Cambridge University Press).
IPCC (2021). “Summary for Policymakers,” in Climate Change 2021: The Physical Science Basis. Contribution of Working Group I to the Sixth Assessment Report of the Intergovernmental Panel on Climate Change. V Masson-Delmotte, PM Zhai, A. Piraniet al. (Cambridge, UK: Cambridge University Press).
Jin, J., He, J., He, R., Liu, C., Zhang, J., Wang, G., et al. (2017). Impacts of Climate Change to Water Resources and Extreme Hydrological Event in the Huaihe River Basin. Scientia Geographica Sinica 37 (8), 1226–1233. doi:10.13249/j.cnki.sgs.2017.08.013
Jung, I.-W., and Chang, H. (2011). Assessment of Future Runoff Trends under Multiple Climate Change Scenarios in the Willamette River Basin, Oregon, USA. Hydrol. Process. 25 (2), 258–277. doi:10.1002/hyp.7842
Karlsson, I. B., Sonnenborg, T. O., Refsgaard, J. C., Trolle, D., Børgesen, C. D., Olesen, J. E., et al. (2016). Combined Effects of Climate Models, Hydrological Model Structures and Land Use Scenarios on Hydrological Impacts of Climate Change. J. Hydrol. 535, 301–317. doi:10.1016/j.jhydrol.2016.01.069
Koirala, S., Hirabayashi, Y., Mahendran, R., and Kanae, S. (2014). Global Assessment of Agreement Among Streamflow Projections Using CMIP5 Model Outputs. Environ. Res. Lett. 9 (6), 064017. doi:10.1088/1748-9326/9/6/064017
Krysanova, V., Vetter, T., Eisner, S., Huang, S., Pechlivanidis, I., Strauch, M., et al. (2017). Intercomparison of Regional-Scale Hydrological Models and Climate Change Impacts Projected for 12 Large River Basins Worldwide-A Synthesis. Environ. Res. Lett. 12, 105002. doi:10.1088/1748-9326/aa8359
Lang, S., Ouarda, T. B. M. J., and Bobee, B. (1999). Production of Microbial Glycolipids. J. Hydrol. 225 (3-4), 103–118. doi:10.1007/978-1-59259-261-6_9
Lee, O., Sim, I., and Kim, S. (2019). Application of the Non-stationary Peak-Over-Threshold Methods for Deriving Rainfall Extremes from Temperature Projections. J. Hydrol. 585, 124318. doi:10.1016/j.jhydrol.2019.124318
Li, L., Diallo, I., Xu, C.-Y., and Stordal, F. (2015). Hydrological Projections under Climate Change in the Near Future by RegCM4 in Southern Africa Using a Large-Scale Hydrological Model. J. Hydrol. 528, 1–16. doi:10.1016/j.jhydrol.2015.05.028
Masood, M., Yeh, P. J.-F., Hanasaki, N., and Takeuchi, K. (2015). Model Study of the Impacts of Future Climate Change on the Hydrology of Ganges-Brahmaputra-Meghna basin. Hydrol. Earth Syst. Sci. 19 (2), 747–770. doi:10.5194/hess-19-747-2015
Mediero, L., Santillán, D., Garrote, L., and Granados, A. (2014). Detection and Attribution of Trends in Magnitude, Frequency and Timing of Floods in Spain. J. Hydrol. 517, 1072–1088. doi:10.1016/j.jhydrol.2014.06.040
Nam, D., Hoa, T., Duong, P., Thuan, D., and Mai, D. (2019). Assessment of Flood Extremes Using Downscaled CMIP5 High-Resolution Ensemble Projections of Near-Term Climate for the Upper Thu Bon Catchment in Vietnam. Water 11 (4), 634. doi:10.3390/w11040634
Nyaupane, N., Thakur, B., Kalra, A., and Ahmad, S. (2018). Evaluating Future Flood Scenarios Using Cmip5 Climate Projections. Water 10 (12), 1866. doi:10.3390/w10121866
O’Neill, B. C., Kriegler, E., Riahi, K., Ebi, K. L., Hallegatte, S., Carter, T. R., et al. (2013). A New Scenario Framework for Climate Change Research: the Concept of Shared Socioeconomic Pathways. Clim. Chang 122, 387–400. doi:10.1007/s10584-013-0905-2
Oudin, L., Hervieu, F., Michel, C., Perrin, C., Andréassian, V., Anctil, F., et al. (2005). Which Potential Evapotranspiration Input for a Lumped Rainfall–Runoff Model?: Part 2—Towards a Simple and Efficient Potential Evapotranspiration Model for Rainfall–Runoff Modelling. J. Hydrol. 303, 290–306. doi:10.1016/j.jhydrol.2004.08.026
Schewe, J., Heinke, J., Gerten, D., Haddeland, I., Arnell, N. W., Clark, D. B., et al. (2014). Multimodel Assessment of Water Scarcity under Climate Change. Proc. Natl. Acad. Sci. USA 111, 3245–3250. doi:10.1073/pnas.1222460110
Shen, M., Chen, J., Zhuan, M., Chen, H., Xu, C.-Y., and Xiong, L. (2018). Estimating Uncertainty and its Temporal Variation Related to Global Climate Models in Quantifying Climate Change Impacts on Hydrology. J. Hydrol. 556, 10–24. doi:10.1016/j.jhydrol.2017.11.004
Silva, A. T., Portela, M. M., and Naghettini, M. (2012). Nonstationarities in the Occurrence Rates of Flood Events in Portuguese Watersheds. Hydrol. Earth Syst. Sci. 16 (1), 241–254. doi:10.5194/hess-16-241-2012
Silva, A. T., and Portela, M. M. (2018). Using Climate-Flood Links and CMIP5 Projections to Assess Flood Design Levels under Climate Change Scenarios: A Case Study in Southern Brazil. Water Resour. Manage. 32 (15), 4879–4893. doi:10.1007/s11269-018-2058-6
Simpkins, G. (2017). Progress in Climate Modelling. Nat. Clim Change 7, 684–685. doi:10.1038/nclimate3398
Solari, S., Egüen, M., Polo, M. J., and Losada, M. A. (2017). Peaks over Threshold (POT): A Methodology for Automatic Threshold Estimation Using Goodness of Fit P -value. Water Resour. Res. 53 (4), 2833–2849. doi:10.1002/2016wr019426
Su, B., Huang, J., Mondal, S. K., Zhai, J., Wang, Y., Wen, S., et al. (2021). Insight from CMIP6 SSP-RCP Scenarios for Future Drought Characteristics in China. Atmos. Res. 250, 105375. doi:10.1016/j.atmosres.2020.105375
Tabari, H. (2020). Extreme Value Analysis Dilemma for Climate Change Impact Assessment on Global Flood and Extreme Precipitation. J. Hydrol. 593, 125932. doi:10.1016/j.jhydrol.2020.125932
Trenberth, K. E., Dai, A., Rasmussen, R. M., and Parsons, D. B. (2003). The Changing Character of Precipitation. B Am. Meteorol. Soc. 84 (9), 1205–1218. doi:10.1175/bams-84-9-1205
Wang, G., Zhang, J., He, R., Liu, C., Ma, T., Bao, Z., et al. (2017). Runoff Sensitivity to Climate Change for Hydro-Climatically Different Catchments in China. Stoch. Environ. Res. Risk Assess. 31, 1011–1021. doi:10.1007/s00477-016-1218-6
Wang, S., Xu, H., Liu, L., Wang, Y., and Song, A. (2018). Projection of the Impacts of Global Warming of 1.5°C and 2.0°C on Runoff in the Upper-Middle Reaches of Huaihe River Basin. J. Nat. Resour. 33 (11), 1966–1978. doi:10.31497/zrzyxb.20171050
Wang, Y., Wang, Y., and Xu, H. (2020). Impacts of 1.5°C and 2.0°C Global Warming on Runoff of Three Inland Rivers in the Hexi Corridor, Northwest China. J. Meteorol. Res. 34 (5), 1082–1095. doi:10.1007/s13351-020-9152-4
Winsemius, H. C., Aerts, J. C. J. H., van Beek, L. P. H., Bierkens, M. F. P., Bouwman, A., Jongman, B., et al. (2016). Global Drivers of Future River Flood Risk. Nat. Clim Change 6, 381–385. doi:10.1038/nclimate2893
Wu, C., and Huang, G. (2015). Changes in Heavy Precipitation and Floods in the Upstream of the Beijiang River basin, South China. Int. J. Climatol. 35 (10), 2978–2992. doi:10.1002/joc.4187
Xu, Y., Gao, X., Shen, Y., Xu, C., Shi, Y., and Giorgi, F. (2009). A Daily Temperature Dataset over China and its Application in Validating a RCM Simulation. Adv. Atmos. Sci. 26 (4), 763–772. doi:10.1007/s00376-009-9029-z
Yang, Q., Gao, C., Zha, Q., and Zhang, P. (2020). Changes of Climate and Runoff under the Representative Concentration Pathways Scenarios in the Upper Reaches of the Huaihe River. J. Anhui Agric. Sci. 48 (3), 209–214.
Yoon, S.-K., Kim, J.-S., and Moon, Y.-I. (2016). Urban Stream Overflow Probability in a Changing Climate: Case Study of the Seoul Uicheon Basin, Korea. J. Hydro-environment Res. 13, 52–65. doi:10.1016/j.jher.2015.08.001
Zhang, D., Zhang, L., Guan, Y., Chen, X., and Chen, X. (2012). Sensitivity Analysis of Xinanjiang Rainfall-Runoff Model Parameters: a Case Study in Lianghui, Zhejiang Province, China. Hydrol. Res. 43, 123–134. doi:10.2166/nh.2011.131
Zhang, Y.-L., and You, W.-J. (2014). Social Vulnerability to Floods: a Case Study of Huaihe River Basin. Nat. Hazards 71 (3), 2113–2125. doi:10.1007/s11069-013-0996-0
Zheng, H., Chiew, F. H. S., Charles, S., and Podger, G. (2018). Future Climate and Runoff Projections across South Asia from CMIP5 Global Climate Models and Hydrological Modelling. J. Hydrol. Reg. Stud. 18, 92–109. doi:10.1016/j.ejrh.2018.06.004
Keywords: climate change, CMIP6, hydrological modeling, flood, Huai River basin
Citation: Bian G, Zhang J, Chen J, Song M, He R, Liu C, Liu Y, Bao Z, Lin Q and Wang G (2021) Projecting Hydrological Responses to Climate Change Using CMIP6 Climate Scenarios for the Upper Huai River Basin, China. Front. Environ. Sci. 9:759547. doi: 10.3389/fenvs.2021.759547
Received: 16 August 2021; Accepted: 18 November 2021;
Published: 09 December 2021.
Edited by:
Yulei Xie, Guangdong University of Technology, ChinaReviewed by:
Xihui Gu, China University of Geosciences Wuhan, ChinaYuliang Zhou, Hefei University of Technology, China
Copyright © 2021 Bian, Zhang, Chen, Song, He, Liu, Liu, Bao, Lin and Wang. This is an open-access article distributed under the terms of the Creative Commons Attribution License (CC BY). The use, distribution or reproduction in other forums is permitted, provided the original author(s) and the copyright owner(s) are credited and that the original publication in this journal is cited, in accordance with accepted academic practice. No use, distribution or reproduction is permitted which does not comply with these terms.
*Correspondence: Guoqing Wang, Z3F3YW5nQG5ocmkuY24=