- 1Key Laboratory of Fishery Ecology and Environment, South China Sea Fisheries Research Institute, Chinese Academy of Fishery Sciences, Guangzhou, China
- 2South China Institute of Environmental Science, Ministry of Ecology and Environment, Guangzhou, China
- 3Department of Environmental Science and Engineering, Fudan University, Shanghai, China
Daya Bay, especially in the northwestern region, which is a nature reserve with larval economic fish and shrimp populations, is no longer an unpolluted marine environment due to the recent increases in anthropogenic activities. This study collected seasonal surface sediment samples from 20 sites in northwestern Daya Bay to evaluate pollution and ecological risks and to identify possible sources and transport pathways of heavy metals (Cd, Pb, Cr, Cu, Zn, Hg, As). The results showed that all the heavy metal concentrations were below the established primary standard criteria, except for concentrations of Cr in spring, as well as Cu and Zn in autumn at several sampling stations, which had excess rates of 35, 4.76, and 4.76%, respectively. The geoaccumulation index (Igeo) values of heavy metals indicated that all sites had unpolluted to moderate pollution levels. In comparison to the samples collected in autumn, those in spring experienced a higher degree of pollution, particularly Cr and As. The ecological risk indices of heavy metals in sediments ranged from 225.86 to 734.20 in spring and from 196.69 to 567.52 in autumn, suggesting that most sites had a moderate ecological risk or a considerable ecological risk, and very few a had high ecological risk. Moreover, ArcGIS10.2 software was used to visualize their spatial distribution, and the results were similar in both spring and autumn. The results of the Pearson correlation analysis and principal component analysis showed that Cu, Hg, and Pb might be affected by anthropogenic activities, and As might be derived from natural sources such as atmospheric inputs. A cluster analysis showed that heavy metals were mainly affected by the negative impacts of human beings on the environment.
Introduction
Surface sediments are a significant component of aquatic environments. In many areas, the heavy metals in the surface sediment are gradually increasing and have become a growing topic of interest worldwide (Ranjbar Jafarabadi et al., 2017; Nel et al., 2020). This is because of their enrichment, nonbiodegradability, or long biological half-life, as well as their inherent toxicity, extensive sources, biogeochemical recycling, and ecological risks (Ranjbar Jafarabadi et al., 2017; Shakouri and Gheytasi, 2018; Xu et al., 2018). Most heavy metals are incorporated into the sediment once they enter the marine environment. Therefore, sediments are considered a source of metals, and they also record anthropogenic impacts (Kang et al., 2017). With rapid industrial and economic development, many coastal bays are subjected to severe heavy metal pollution arising from anthropogenic activities (Qian et al., 2014; Lu et al., 2017; Zhang P. et al., 2017; Liang et al., 2018; Pan et al., 2020).
Marine conservation areas are intertidal or subtidal environments and encompass the overlying water, other geographical features (such as the coast, estuary, wetlands, and islands), and associated flora and fauna (Ervin et al., 2010; Gaines et al., 2010; Zhang Y. et al., 2017). Marine protected areas are of great significance in the protection of biodiversity and can enhance ecological function and reduce the decline of marine biomass (Ervin et al., 2010). The “Baguang-Aotou-Xiachong” area of Daya Bay, which acts as a buffer zones between the land and the sea, is vulnerable to natural processes and anthropogenic activities. Since the 1980s, there have been large-scale anthropogenic activities along the coastline, such as mariculture, ports, nuclear power stations, and petrochemical industries (Yu et al., 2010; Gu et al., 2016). Various kinds of pollution enter Daya Bay, causing serious heavy metal contamination.
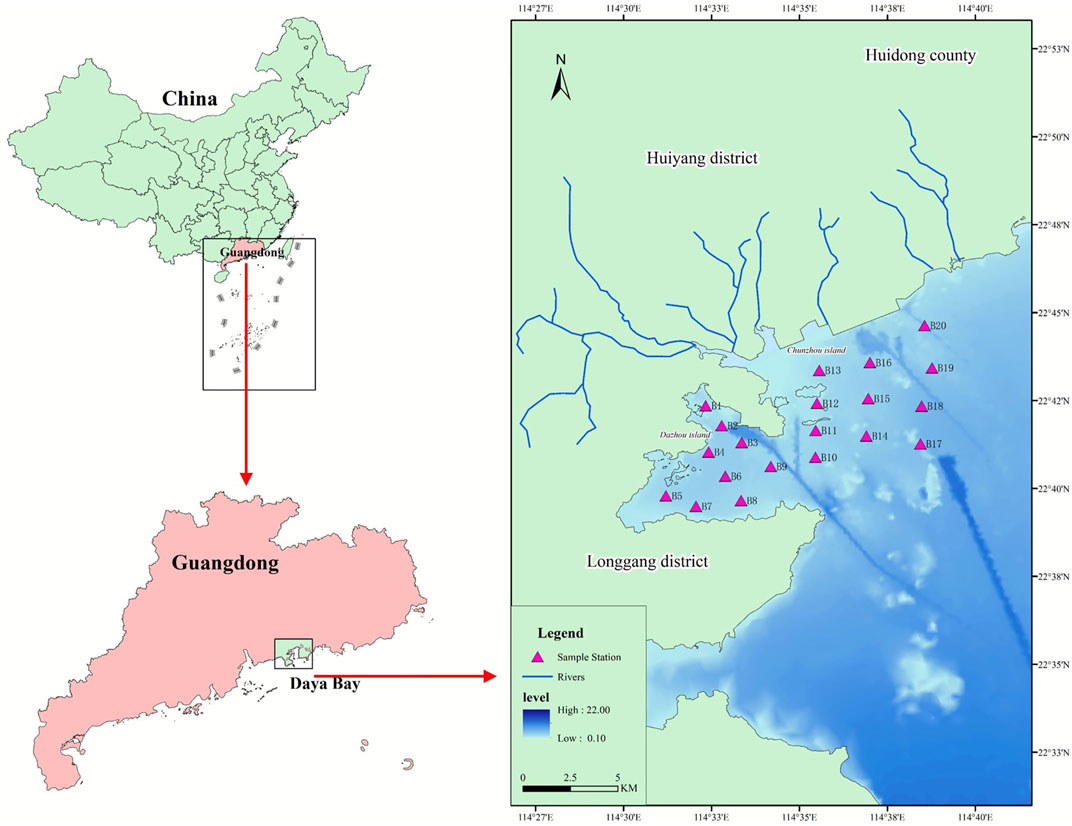
The source, migration, transformation, and destination of heavy metals are hot topics in the study of sedimentary environments. Rivers are an important nonpoint source of pollution and have attracted much research attention. There are five main rivers in northwestern Daya Bay, namely, the Danao River, the Zao River in the south, the Yanqian River, the Baigang River, and the Xiayong River. The upstream industries on these rivers are intensive and include processing and metal industries. Although there have been several previous studies on heavy metal contamination in Daya Bay in recent years, these studies mainly investigated the present situation of heavy metal pollution in the bay as a whole (Yu et al., 2010; Zhao et al., 2016), and there was no specific research on the effects of terrestrial pollutants on heavy metals in marine surface sediments. Most previous researchers divided heavy metal pollution sources into either natural or anthropogenic (Lu et al., 2017; Lü et al., 2018) and lacked a specific relationship between the heavy metals and the sampling stations. Moreover, the effect of sewage outfall on marine protected areas was ignored when identifying heavy metal sources. Therefore, the objectives of this study were as follows: 1) to study the spatial distribution of heavy metals in the Daya Bay area based on the GIS interpolation method; 2) to estimate the degree of heavy metal contamination using the geoaccumulation index (Igeo) and potential ecological risk index (RI); and 3) to identify the sources and transport pathways of heavy metals.
Materials and Methods
Study Area and Sample Collection
Daya Bay (latitude 22°25'∼22°50'N, longitude 114°30'∼114°55'E) has a subtropical climate, high temperatures, rainy conditions, and the prevailing monsoon dominates. It is a submerged valley in a mountainous area, which is more than 30 km from south to north. The gulf of Daya Bay has the characteristics of a subsidence mountain coast. The seabed topography of Daya Bay gradually deepens from the top of the bay, with an average depth of 11 m. The study area includes areas of petrochemical industrial, ports, seawater aquaculture, and densely populated towns. It can be used as a typical study area for the effects of human activities on heavy metal pollution in Daya Bay.
The research area, also known as the Baguang-Aotou-Xiayong area, is located on the northwestern side of Daya Bay. Twenty surface sediment samples were collected in the bay in late spring (April) and early autumn (September) of 2016 (Figure 1).
Analytical Methods
Sediment samples were collected using an oceanic 50 mud collector. For each sample, the top 5 cm of sediment was sampled. The samples were placed in precleaned polyethylene bags and stored at 4°C in the laboratory until analysis.
The sediment samples were freeze-dried. Decomposition of the sample was performed through ultrasonic oscillation before instrumental measurement. Grain size samples were analyzed using the laser diffraction method (Mastersizer2000 Malvern, United Kingdom). The measurement scope of the appliance was 0.02–2000 μm, and the relative error of repeated measurements was less than 3. A sieve analysis method was used for particle sizes larger than 2000 µm. Dried and homogenized samples were analyzed using microwave digestion. After weighing 0.3 g of each sample in a high-pressure Teflon bomb, 8 ml concentrated HNO3 (65%) and 2 ml H2O2 (30%) were added. The sample was covered with a watch glass for 24 h to prevent interference. Samples were then digested using the Ethos Plus microwave laboratory station (Milestone, Sorisole, Italy) with the following temperature stages, all at 1000 W: 30–200°C for 15 min, 200°C for 40 min, followed immediately by ventilation at room temperature for 18 min. Extracts were then transferred into 50 ml flasks and heated until 1 ml remained. After cooling, the concentrated extract was diluted to 5 ml with ultrapure water and mixed well.
The concentrations of mercury (Hg) and arsenic (As) were measured with an atomic fluorescence (AFS, 830, Hitachi, Japan). Copper (Cu), lead (Pb), cadmium (Cd), and chromium (Cr) in the sediments were determined with flame free atomic absorption spectrometry (AAS, Z2000, Hitachi, Japan), and zinc (Zn) by flame atomic absorption spectrometry (AAS, Z2000, Hitachi, Japan).
Quality Assurance and Quality Control
The quality assurance of the analytical process for the dissolving heavy metals in the sediments was implemented using the methods released by the National Research Center for standard GB17378-2007. Each sample was measured three times or more to determine the precision and accuracy. The measured blank values were not greater than the corresponding method detection limit. In addition, the deviation of these values was less than 6% in all analyses. Before operation, all applied glassware (bottles, tubes, etc.) in the lab were soaked with 10% HNO3 (w/w) for more than 2 days and rinsed in deionized water.
Evaluation of Heavy Metals Contamination
Geoaccumulation Index
The useful and common index to define and estimate metal contamination in sediment (Müller, 1979) is the geoaccumulation index (Igeo). It is defined as:
where Ci stands for the concentration of the examined metal i and
Single Pollution Indices (Cf)
The Cf is a commonly used index to evaluate the degree of contamination for sediments in aquatic ecosystems and to reveal the contamination level for an individual metal (Loska et al., 1997). Its calculation is shown with equation below:
where Ci is the concentration of the examined metal i and Bi is the geochemical background concentration of the metal i.
Potential Ecological Risk Index (RI)
To explore ecological risk in the heavy metals, the RI index is introduced (Hakanson, 1980), and its calculation formula is as follows:
where
Statistical Analysis and Geochemical Mapping
The data normality was assessed by the Kolmogorov–Smirnov and Shapiro–Wilk normality tests. Additionally, Pearson correlation analysis, principal component analysis (PCA), and cluster analysis (CA) were conducted in SPSS 22.0 and R3.2.2 to explore the possible sources of the heavy metal elements and their relevance to other metals, respectively. Ultimately, the Kriging interpolation method was introduced to interpolate the values of the calculated indices and heavy metals concentration (Karim and Williams, 2015; Tian et al., 2017), which revealed the visualization of the heavy metal index and their spatial distribution by ArcGIS10.2 software.
Results and Discussion
Concentration of the Heavy Metals in Marine Surface Sediments of Daya Bay
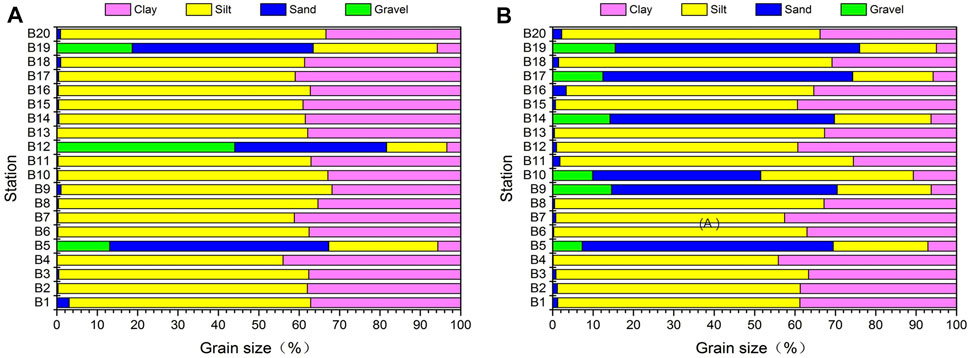
As shown in Figure 2, the grain size of the surface sediment at each station was quite different. Generally, the surface sediments were primarily composed of silt and clay in spring and autumn with mean sizes of 6.78φ and 6.18φ, respectively. The percentage of silt varied between 14.94 and 67.10%, and the percentage of clay ranged from 3.42 to 44.02% in spring. Similarly, the percentage of silt varied between 18.98 and 78.66%, and the percentage of clay ranged from 5 to 44.12% in autumn. The results showed that the average grain size in spring was smaller than that in autumn.
The average amount of organic carbon in autumn was lower than that in spring (Table 1), and the decomposition of total organic carbon was closely related to the migration and transformation of heavy metals in sediments.

TABLE 1. Descriptive statistics of heavy metal concentrations in surface sediments (mg/kg) in Daya Bay.
As shown in Table 1, the concentrations of Cd, Pb, Cr, Cu, Zn, Hg, and As were 0.07–0.42, 28–55, 62–101, 13–82, 79–141, 0.01–0.07, and 6.7–11 mg/kg in spring, respectively. Moreover, in autumn, the respective concentration ranges for individual heavy metals were as follows: Cd, 0.05–0.27 mg/kg; Pb, 24–49 mg/kg; Cr, 24–62 mg/kg; Cu, 12–35 mg/kg; Zn, 90–182 mg/kg; Hg, 0.02–0.06 mg/kg; As, 6.9–8.6 mg/kg. According to their average concentrations, the examined metals in the sampled sediment can be arranged in the following order for both spring and autumn: Zn > Cr > Pb > Cu > As > Cd > Hg. Except for Hg and Zn being equal, the mean concentrations were higher in spring than in autumn for individual heavy metals. Additionally, the coefficients of variation (CVs) of the heavy metals in spring were 58.08, 17.59, 11.93, 53.19, 13.76, 39.68, and 12.10%, respectively. Correspondingly, the heavy metal CVs in autumn were 57.55%, 15.50%, 15.60, 29.33, 18.78, 38.20, and 7.79%, respectively. The results demonstrated that the concentrations of heavy metals (Cd, Pb, Cu, Hg, As) were relatively discrete in spring.
Compared with the marine sediment quality standards (GB18668-2002) (China), the concentration of Cr (excess rate: 35%) in spring and copper (excess rate: 4.76%) and zinc (excess rate: 4.76%) in autumn exceeded the primary standard criteria (MSQ-1), and all the others were below the primary standard criteria. The mean and standard deviations of all the heavy metals in the research area and other relevant regions were calculated and are displayed in Table 2. The average concentration of these examined metals in the research area was higher than that in other related regions in spring, with the exception of mangrove areas and Beibu Bay. However, in autumn, all examined heavy metals were in the mean interval of other relevant areas except Zn, Pb, and Cu.
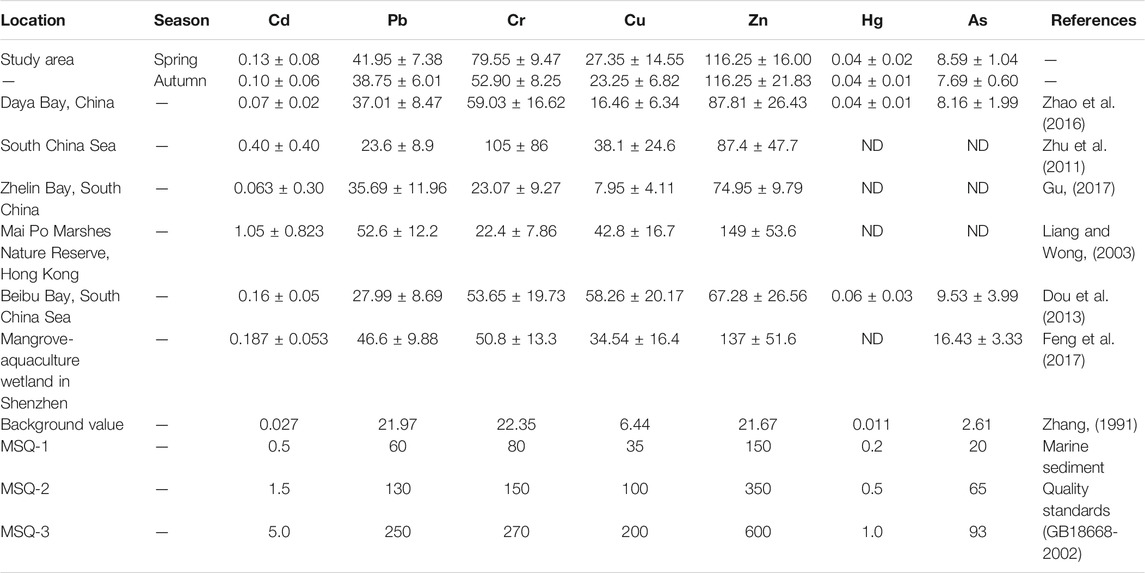
TABLE 2. Concentration (mg/kg) comparative summary for heavy metals in surface sediment of the research region and other relevant areas.
The Spatial Distribution of Heavy Metals
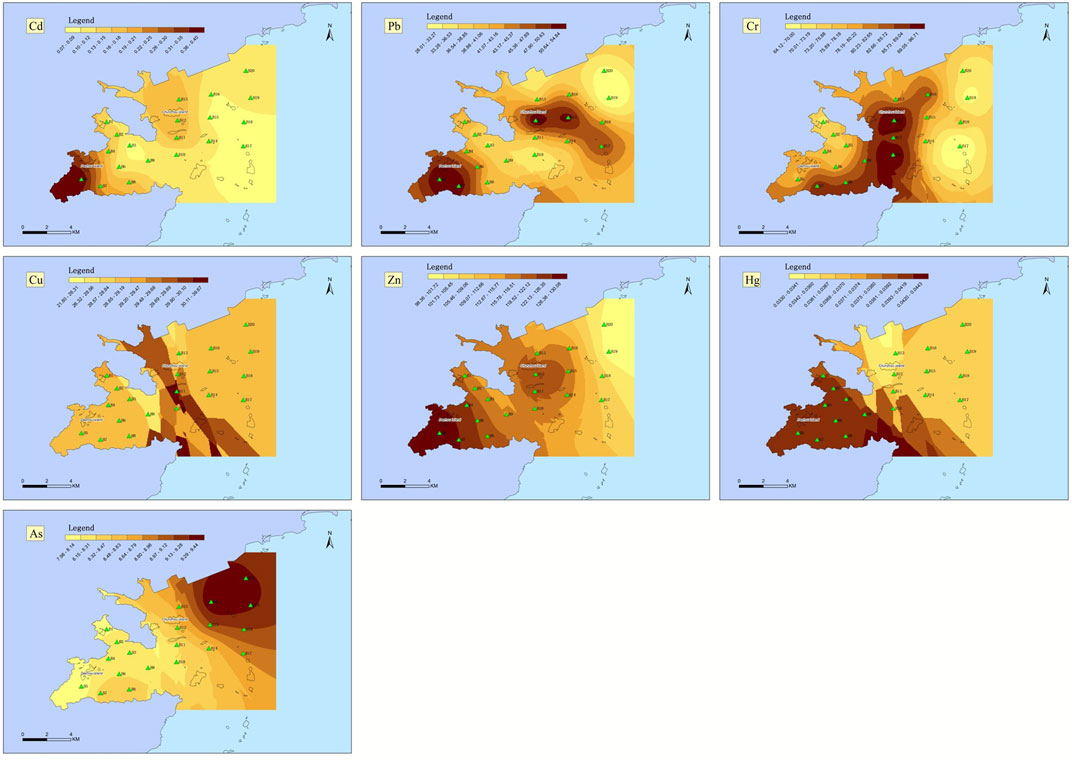
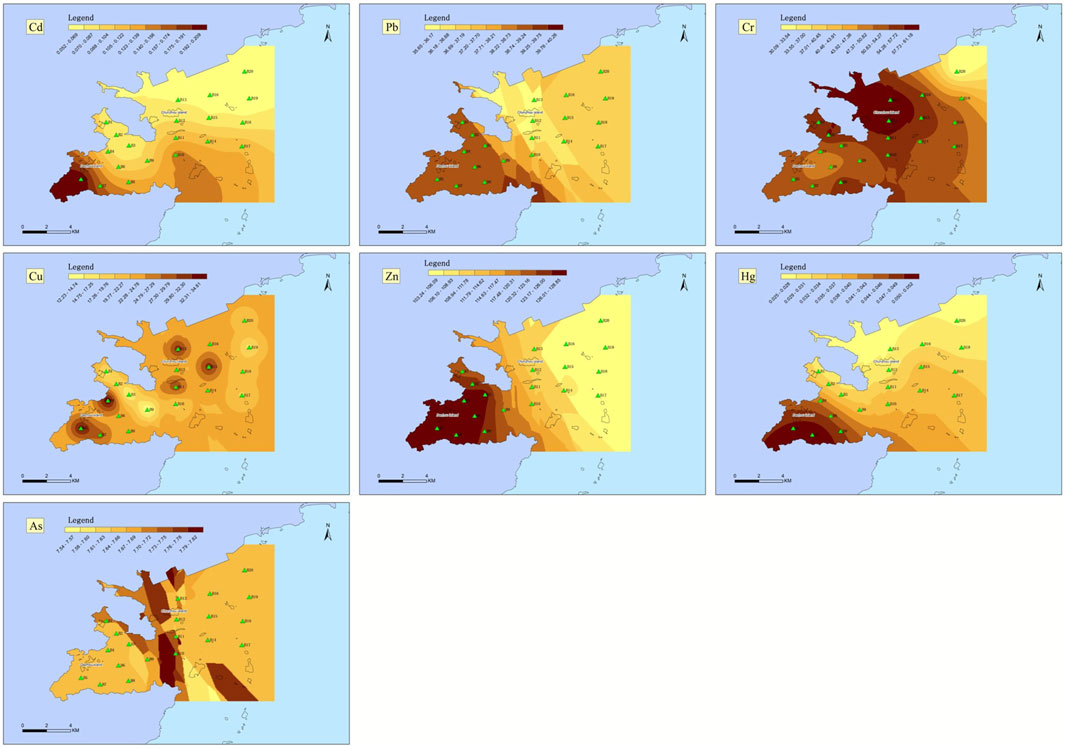
The spatial distributions of heavy metal concentrations in the research region were displayed in Figures 3 and 4, and they showed similar overall patterns. The highest concentrations occurred near Chunzhou and Dazhou Island in spring and autumn, decreasing to the periphery (except for As in spring). Cd, Zn, and Hg showed the same spatial distribution in both spring and autumn, with their highest values occurring near Dazhou Island, especially east of Yalin Bay. The lowest concentrations occurred in the northeastern part of the research area. The maximum values of As occurred in the northeastern part of the study area in spring, and in the central regions in autumn, which was different than observed in a previous study (Dou et al., 2013). Since there is no major rivers discharge into Daya Bay and human activities are concentrated in the vicinity of the continental shelf, higher concentrations of these heavy metals are expected to be inside of the bay (Yu et al., 2010). In general, all heavy metals changed unobviously in spring and autumn except As, which might be due to the small seasonal variation of outlet input volume, and the significant changes of As in spring and autumn might be related to the influence of atmospheric deposition (Lü et al., 2018). Due to the southerly and easterly wind blowing in spring and the northerly wind in autumn in Daya Bay, precipitation in the bay is greater in summer and autumn, explaining the greater seasonal variation in As.
Heavy Metals Contamination and Their Ecological Risk
As illustrated in Figure 5, the Igeo values of the measured heavy metals were: 0.79 to 3.37 (average 1.57) for Cd, -0.24 to 0.74 (average 0.33) for Pb, 0.89 to 1.59 (average 1.24) for Cr, 0.43 to 3.09 (average 1.37) for Cu, 1.28 to 2.12 (average 1.82) for Zn, -0.24 to 1.98 (average 1.12) for Hg, 0.78 to 1.49 (average 1.12) for As in spring, and 0.30 to 2.74 (average 1.10) for Cd, -0.46 to 0.57 (average 0.22) for Pb, -0.48 to 0.89 (average 0.63) for Cr, 0.31 to 1.86 (average 1.21) for Cu, 1.47 to 2.49 (average 1.82) for Zn, 0.28 to 1.93 (average 1.03) for Hg, 0.82 to 1.14 (average 0.97) for As in autumn. These values show that there was a significant difference between spring and autumn. For these metals, their average pollution level can be ranked in descending order in spring: Zn > Cd > Cu > Cr > As = Hg > Pb, while in autumn the order is Zn > Cu > Cd > Hg > As > Cr > Pb. According to Müller’s (Müller, 1981) criteria, the
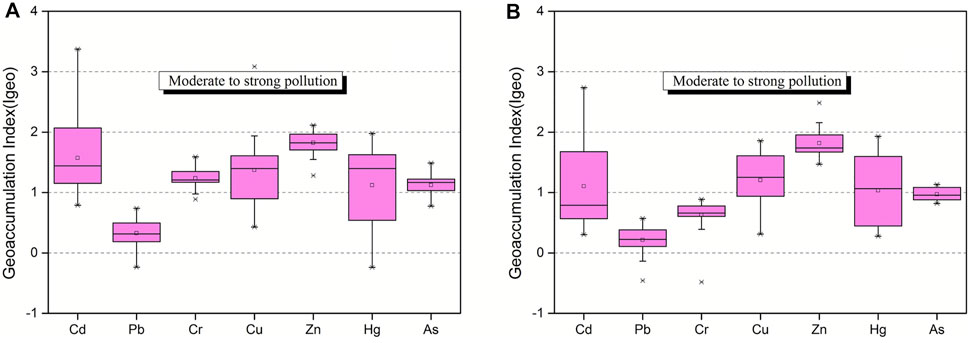
FIGURE 5. Geoaccumulation index (Igeo) of heavy metals in surface sediments during spring (A) and autumn (B).
Risk assessment of heavy metals in sediments is particularly important for environmental management (Qu et al., 2016). The RI values fluctuated greatly, and ranged from 225.86 to 734.20 in spring, and from 196.69 to 567.52 in autumn, respectively. As shown in Figure 6, the highest ecological risk of all heavy metals occurred in the area near Dazhou Island in both spring and autumn, decreasing to the periphery. However, the RI values in spring were obviously higher than those in autumn. On the basis of Hakanson’s classification (Hakanson, 1980), the RI values of the heavy metals in our study suggest that most sites have a moderate ecological risk or a considerable ecological risk, and very few had a high ecological risk. Overall, the distribution trend of RI in spring and autumn was very similar to the
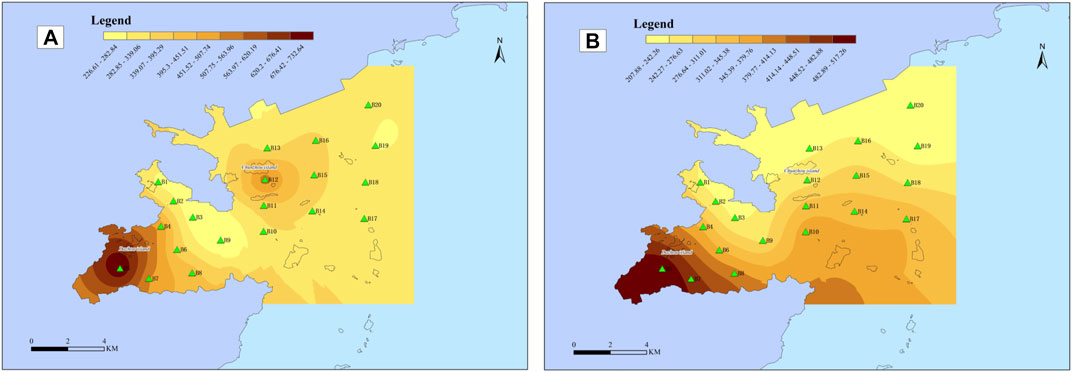
FIGURE 6. The potential ecological risk index (RI) of heavy metals in surface sediments during spring (A) and autumn (B).
Identification of Heavy Metals Sources
Pearson correlation analysis (Figure 7) indicated that there were no relatively significant correlations between heavy metals (Cd, Pb, Cr, Cu, Zn, Hg, As) and the gravel, sand, silt, and clay measurements. A large number of studies (Swarnalatha et al., 2014; Han et al., 2017; Xu et al., 2018) have shown that changes in heavy metal contents are closely related to changes in sediment particle size. An increase in clay minerals, and their specific surface area, results in increased surface free energy and therefore greater heavy metal adsorption (Lu et al., 2017; Naifar et al., 2018). Moreover, organic matter is highly related to heavy metals in the aquatic environment through adsorption and complexion (Dou et al., 2013; Liu et al., 2017). The results of the Pearson correlation matrix show that there is a significant correlation between total organic carbon (TOC) and Cd, Pb, Hg, and Zn. Moreover, As and Cr were also strongly correlated, suggesting that they might have a common source.
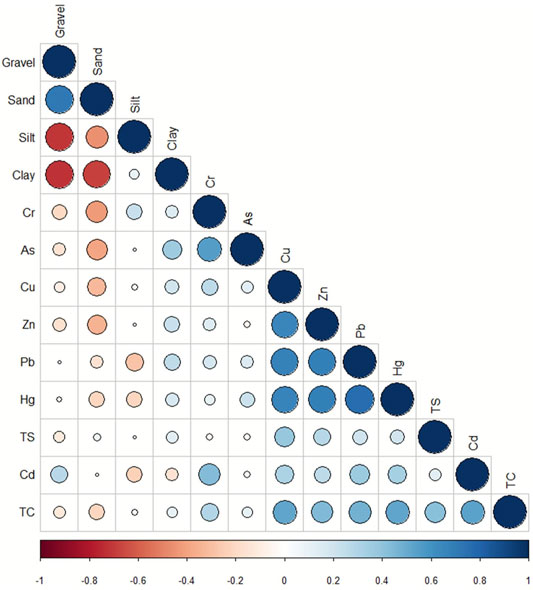
FIGURE 7. Matrices of Pearson correlation among heavy metals (Cd, Pb, Cr, Cu, Zn, Hg, and As), gravel, sand, silt, and clay contents. Red and blue dots correspond to negative and positive correlations, respectively. Small dots with light color intensity represent low correlations, while large dots with darker colors correspond to higher correlations. The rows in the correlation matrices refer to parameters in water, and bivalves are included in a rectangular box.
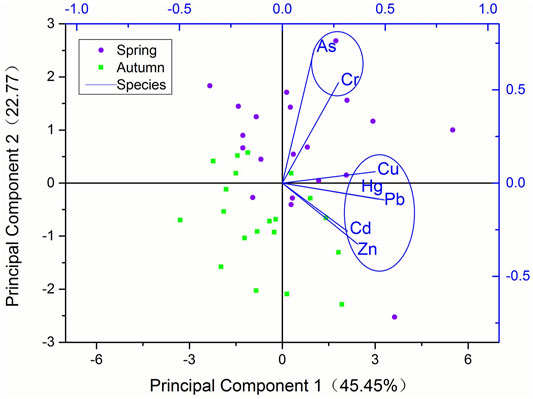
Principal component analysis (PCA) processed by SPSS 22.0 was used in this research. The rotated component matrices of the PCA are shown in Table 3. The Kaiser-Meyer-Olkin (KMO) and Bartlett’s results were 0.650 and 105.62 (df = 21, Sig b < 0.001), respectively, suggesting that PCA might be useful in reducing the dimensionality. The PCA indicated that the proportion of the first two principal components among the total variants was 68.22 (Figure 8). The first principal component (PC1) with high loadings of Cu, Cr, Zn, Hg, and Pb accounted for 45.45% of the total variance, suggesting that they might have similar sources. Concentrations of Cu, Cr, Zn, Hg, and Pb were higher than their corresponding background values, and they were also present at moderate pollution levels based on their Igeo values, demonstrating that these five heavy metals were moderately affected by anthropogenic activities. The second principal component (PC2) accounted for 22.77% of the total variance, with the strongest loadings from As. According to spatial interpolation analysis, As is mainly affected by atmospheric deposition, and PC2 may represent natural sources.
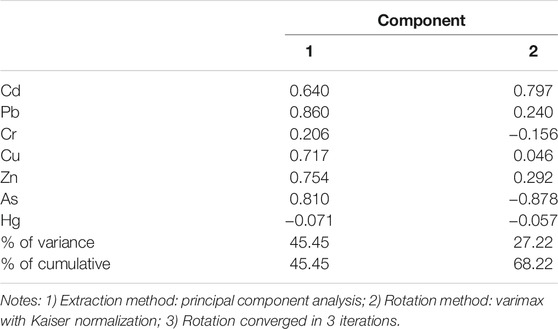
TABLE 3. Heavy metal communality of rotated component matrix for Cd, Pb, Cr, Cu, Zn, Hg, and As of surface sediments in Daya Bay.
Before clustering, the data were processed with a single factor pollution index to reduce the error, so that the clustering result was closer to reality. Cluster analysis was conducted to examine the relationships among variables (heavy metals in the surface sediment) and sample sites (Figure 1). As shown in Figure 9A, in spring, the left vertical dendrogram (left side of the box) exhibited clustering of the sampling sites in line with heavy metal concentrations in the surface sediment. The horizontal dendrogram indicated clustering of heavy metals in line with their likenesses. In the vertical dendrogram, all the sampling sites in Daya Bay were divided into four clusters. Cluster I was composed of 8 sampling sites (B11, B13, B19, B20, B3, B9, B1, B2), cluster II contained 10 sample stations (B8, B4, B7, B15, B16, B17, B18, B6, B10, B14), cluster III contained 1 sampling site (B5), and the last site (B12) near Chunzhou Island was located in cluster IV. The results indicated that the distribution of the heavy metals was somewhat different in the 20 sampling sites. Obviously, there were distinct common characteristics in each cluster. In cluster I, Pb, Cu, and Hg in sites B19, B20, B3, B9, B1, and B2 had relatively low concentrations. These stations should have high concentrations because they are near waterways or sewage outfalls. This phenomenon might be due to the negative impact that of humans have on the environment, such as the regular cleaning of waterways (Jiang et al., 2007). In clusters II and III, all heavy metal concentrations were high, especially the Cd, Cu, and Hg concentrations. According to the spatial distribution diagram, these sites are mainly concentrated in the vicinity of Yalin Bay, suggesting that the high concentrations of Cd, Cu, and Hg were related to shellfish farming. Similar to cluster III and cluster IV, all their concentrations were also relatively higher, but Cu was notably higher. This might be due to the inflow of rivers which have plenty of industrial activities upstream, such as the Danao River and Xiachong River. Industrial activities, including the chemical production industry, cotton industry, paper industry, dyeing industry, and metalworking industry, may augment the concentrations of Cu, Pb, and Zn (Liang et al., 2018). There were 4 different clusters for the heavy metals in the horizontal dendrogram. Cluster I incorporated Cd, cluster II included Pb, Cr, As, and Hg, cluster III was made up of Cu, and the only member of cluster IV was Zn.
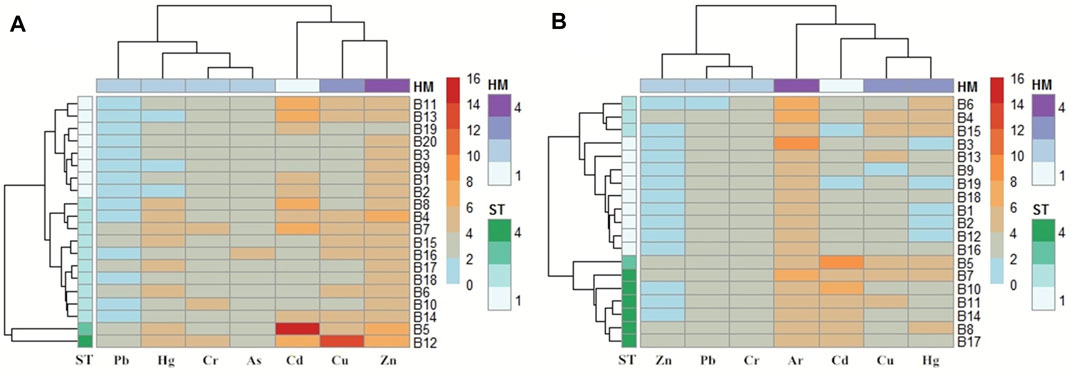
FIGURE 9. Dendrogram obtained based on hierarchical agglomerative cluster analysis (HACA) for (A) the relationship between heavy metals in surface sediments and contributing sites in spring and (B) the relationship between heavy metals in surface sediments and contributing sites in autumn, in Daya Bay in 2016.
As shown in Figure 9B, in the vertical dendrogram, the Daya Bay sampling sites can be divided into four clusters in autumn, which were the same as those in spring. Cluster I was composed of nine sampling sites (B3, B13, B9, B19, B18, B20, B1, B2, B12, B16), cluster II contained three sample sites (B6, B4, B15), cluster III contained one sampling site (B5), and finally, the remaining sites (B10, B11, B14, B8, B17) were included in cluster IV. For cluster I and cluster 3, the above sampling site clustering analysis in spring can also be applied in autumn. There were 4 different clusters for the heavy metals in the horizontal dendrogram. Cluster I consisted of Cd, cluster II included Pb, Cr, and Zn, cluster III was made up of Hg and Cu, and only member of cluster IV was As. This result is different from the results in spring, which also proves that As is affected by atmospheric deposition.
Conclusion
In spring and autumn of 2016, grain size and heavy metal (Cd, Pb, Cr, Cu, Zn, Hg, and As) concentrations were analyzed in surface sediment samples collected from a marine protected area with larval economic fish and shrimp populations in Daya Bay. For the physicochemical properties of the sediments, generally, the surface sediments primarily consisted of silt and clay in spring and autumn, and the average particle size in spring was smaller than that in autumn. For the heavy metal analysis, all the heavy metal concentrations were below the primary standard criteria, except for the concentrations of Cr in spring and Cu and Zn at autumn in several sampling stations. The spatial distributions of heavy metal concentrations in the study area were the same in spring and autumn, which might be due to the small seasonal variation in sewage discharge. The highest heavy metal values were found near Dazhou Island, especially east of Yalin Bay, and the lowest concentrations occurred in the northeastern part of the research area. Most of sites had a moderate ecological risk or a considerable ecological risk level, and very few had high ecological risk levels. Heavy metals are mainly derived from natural sources such as human activities and atmospheric input, and man-made sources are mainly affected negatively by human activities, such as sewage outlets, channel dredging, and shellfish farming.
Data Availability Statement
The original contributions presented in the study are included in the article/Supplementary Material. Further inquiries can be directed to the corresponding authors.
Author Contributions
HW wrote the article and did the laboratory analysis. HW and HH contributed to the field analysis, while the latter also conceptualized the research. ZF, ZK, YY, and HL provided conceptual and editorial inputs on the manuscript and discussed field methodology. All authors contributed to the article and approved the submitted version.
Funding
This work was supported by the Shanghai Pujiang Program and the Project of Science and Technology of Guangdong Province (grant number 2016A020222024)
Conflict of Interest
The authors declare that the research was conducted in the absence of any commercial or financial relationships that could be construed as a potential conflict of interest.
Publisher’s Note
All claims expressed in this article are solely those of the authors and do not necessarily represent those of their affiliated organizations, or those of the publisher, the editors, and the reviewers. Any product that may be evaluated in this article, or claim that may be made by its manufacturer, is not guaranteed or endorsed by the publisher.
Acknowledgments
We are also grateful to reviewers for helpful comments on the manuscript.
References
Dou, Y., Li, J., Zhao, J., Hu, B., and Yang, S. (2013). Distribution, Enrichment and Source of Heavy Metals in Surface Sediments of the Eastern Beibu Bay, South China Sea. Mar. Pollut. Bull. 67 (1-2), 137–145. doi:10.1016/j.marpolbul.2012.11.022
Ervin, J., Mulongoy, K. J., Lawrence, K., Game, E., Sheppard, D., Bridgewater, P., et al. (2010). Making Protected Areas Relevant: A Guide to Integrating Protected Areas into Wider Landscapes, Seascapes and Sectoral Plans and Strategies. Convent. Biol. Divers.
Feng, J., Zhu, X., Wu, H., Ning, C., and Lin, G. (2017). Distribution and Ecological Risk Assessment of Heavy Metals in Surface Sediments of a Typical Restored Mangrove-Aquaculture Wetland in Shenzhen, China. Mar. Pollut. Bull. 124 (2), 1033–1039. doi:10.1016/j.marpolbul.2017.01.004
Gaines, S. D., White, C., Carr, M. H., and Palumbi, S. R. (2010). Designing marine reserve Networks for Both Conservation and Fisheries Management. Proc. Natl. Acad. Sci. 107 (43), 18286–18293. doi:10.1073/pnas.0906473107
Gu, Y.-G. (2018). Heavy Metal Fractionation and Ecological Risk Implications in the Intertidal Surface Sediments of Zhelin Bay, South China. Mar. Pollut. Bull. 129, 905–912. doi:10.1016/j.marpolbul.2017.10.047
Gu, Y.-G., Wang, X.-N., Lin, Q., Du, F.-Y., Ning, J.-J., Wang, L.-G., et al. (2016). Fuzzy Comprehensive Assessment of Heavy Metals and Pb Isotopic Signature in Surface Sediments from a bay under Serious Anthropogenic Influences: Daya Bay, China. Ecotoxicology Environ. Saf. 126, 38–44. doi:10.1016/j.ecoenv.2015.12.011
Hakanson, L. (1980). An Ecological Risk index for Aquatic Pollution control.a Sedimentological Approach. Water Res. 14 (8), 975–1001. doi:10.1016/0043-1354(80)90143-8
Han, D., Cheng, J., Hu, X., Jiang, Z., Mo, L., Xu, H., et al. (2017). Spatial Distribution, Risk Assessment and Source Identification of Heavy Metals in Sediments of the Yangtze River Estuary, China. Mar. Pollut. Bull. 115 (1-2), 141–148. doi:10.1016/j.marpolbul.2016.11.062
Jiang, B., Zheng, H.-l., Huang, G.-q., Ding, H., Li, X.-g., Suo, H.-t., et al. (2007). Characterization and Distribution of Polycyclic Aromatic Hydrocarbon in Sediments of Haihe River, Tianjin, China. J. Environ. Sci. 19 (3), 306–311. doi:10.1016/S1001-0742(07)60050-3
Kang, X., Song, J., Yuan, H., Duan, L., Li, X., Li, N., et al. (2017). Speciation of Heavy Metals in Different Grain Sizes of Jiaozhou Bay Sediments: Bioavailability, Ecological Risk Assessment and Source Analysis on a Centennial Timescale. Ecotoxicology Environ. Saf. 143, 296–306. doi:10.1016/j.ecoenv.2017.05.036
Karim, L. R., and Williams, E. S. (2015). Accumulation of Heavy Metals in the Surface Water of Asthamudi lake, Kollam, Kerala. Nat. Environ. Pollut. Technology 14 (2), 431–434.
Liang, X., Song, J., Duan, L., Yuan, H., Li, X., Li, N., et al. (2018). Source Identification and Risk Assessment Based on Fractionation of Heavy Metals in Surface Sediments of Jiaozhou Bay, China. Mar. Pollut. Bull. 128, 548–556. doi:10.1016/j.marpolbul.2018.02.008
Liang, Y., and Wong, M. H. (2003). Spatial and Temporal Organic and Heavy Metal Pollution at Mai Po Marshes Nature Reserve, Hong Kong. Chemosphere 52 (9), 1647–1658. doi:10.1016/s0045-6535(03)00505-8
Liu, X., Zhang, L., and Zhang, L. (2017). Concentration, Risk Assessment, and Source Identification of Heavy Metals in Surface Sediments in Yinghai: A Shellfish Cultivation Zone in Jiaozhou Bay, China. Mar. Pollut. Bull. 121 (1-2), 216–221. doi:10.1016/j.marpolbul.2017.05.063
Loska, K., Cebula, J., Pelczar, J., Wiechuła, D., and Kwapuliński, J. (1997). Use of Enrichment, and Contamination Factors Together with Geoaccumulation Indexes to Evaluate the Content of Cd, Cu, and Ni in the Rybnik Water Reservoir in Poland. Water Air Soil Pollut. 93 (1-4), 347–365. doi:10.1007/bf02404766
Lü, J., Jiao, W.-B., Qiu, H.-Y., Chen, B., Huang, X.-X., and Kang, B. (2018). Origin and Spatial Distribution of Heavy Metals and Carcinogenic Risk Assessment in Mining Areas at You'xi County Southeast China. Geoderma 310, 99–106. doi:10.1016/j.geoderma.2017.09.016
Lu, J., Li, A., and Huang, P. (2017). Distribution, Sources and Contamination Assessment of Heavy Metals in Surface Sediments of the South Yellow Sea and Northern Part of the East China Sea. Mar. Pollut. Bull. 124 (1), 470–479. doi:10.1016/j.marpolbul.2017.07.007
Müller, G. (1981). Die Schwermetallbelstung der sedimente des Neckars und seiner Nebenflusse: Eine Bestandsaufnahme.
Naifar, I., Pereira, F., Zmemla, R., Bouaziz, M., Elleuch, B., and Garcia, D. (2018). Spatial Distribution and Contamination Assessment of Heavy Metals in marine Sediments of the Southern Coast of Sfax, Gabes Gulf, Tunisia. Mar. Pollut. Bull. 131 (Pt A), 53–62. doi:10.1016/j.marpolbul.2018.03.048
Nel, M. A., Rubidge, G., Adams, J. B., and Human, L. R. D. (2020). Rhizosediments of Salicornia Tegetaria Indicate Metal Contamination in the Intertidal Estuary Zone. Front. Environ. Sci. 8. doi:10.3389/fenvs.2020.572730
Pan, D., Ding, X., Han, H., Zhang, S., and Wang, C. (2020). Species, Spatial-Temporal Distribution, and Contamination Assessment of Trace Metals in Typical Mariculture Area of North China. Front. Mar. Sci. 7. doi:10.3389/fmars.2020.552893
Qian, L., Song, J., Wang, E., Hao, H., Zhang, J., and Wang, Y. (2014). Economic Growth and Pollutant Emissions in China: a Spatial Econometric Analysis. Stochastic Environ. Res. Risk Assess. 28 (2), 429–442.
Qu, C., Li, B., Wu, H., Wang, S., and Li, F. (2016). Probabilistic Ecological Risk Assessment of Heavy Metals in Sediments from China’s Major Aquatic Bodies. Stochastic Environ. Res. Risk Assess. 30 (1), 271–282.
Ranjbar Jafarabadi, A., Riyahi Bakhtiyari, A., Shadmehri Toosi, A., and Jadot, C. (2017). Spatial Distribution, Ecological and Health Risk Assessment of Heavy Metals in marine Surface Sediments and Coastal Seawaters of Fringing Coral Reefs of the Persian Gulf, Iran. Chemosphere 185, 1090–1111. doi:10.1016/j.chemosphere.2017.07.110
Shakouri, A., and Gheytasi, H. (2018). Bioaccumulation of Heavy Metals in Oyster (Saccostrea Cucullata) from Chabahar bay Coast in Oman Sea: Regional, Seasonal and Size-dependent Variations. Mar. Pollut. Bull. 126, 323–329. doi:10.1016/j.marpolbul.2017.11.012
Swarnalatha, K., Letha, J., and Ayoob, S. (2014). Effect of Seasonal Variations on the Surface Sediment Heavy Metal Enrichment of a lake in South India. Environ. Monit. Assess. 186 (7), 4153–4168. doi:10.1007/s10661-014-3687-8
Tian, K., Huang, B., Xing, Z., and Hu, W. (2017). Geochemical Baseline Establishment and Ecological Risk Evaluation of Heavy Metals in Greenhouse Soils from Dongtai, China. Ecol. Indicators 72, 510–520. doi:10.1016/j.ecolind.2016.08.037
Xu, F., Hu, B., Yuan, S., Zhao, Y., Dou, Y., Jiang, Z., et al. (2018). Heavy Metals in Surface Sediments of the continental Shelf of the South Yellow Sea and East China Sea: Sources, Distribution and Contamination. Catena 160, 194–200. doi:10.1016/j.catena.2017.09.022
Yu, X., Yan, Y., and Wang, W.-X. (2010). The Distribution and Speciation of Trace Metals in Surface Sediments from the Pearl River Estuary and the Daya Bay, Southern China. Mar. Pollut. Bull. 60 (8), 1364–1371. doi:10.1016/j.marpolbul.2010.05.012
Zhang, P., Hu, R., Zhu, L., Wang, P., Yin, D., and Zhang, L. (2017a). Distributions and Contamination Assessment of Heavy Metals in the Surface Sediments of Western Laizhou Bay: Implications for the Sources and Influencing Factors. Mar. Pollut. Bull. 119 (1), 429–438. doi:10.1016/j.marpolbul.2017.03.046
Zhang, Y. (1991). A Background Value Study on Heavy Metals in the Sediments of Daya bay. Trapic Oceanology 10 (3), 76–80.
Zhang, Y., Chu, C., Li, T., Xu, S., Liu, L., and Ju, M. (2017b). A Water Quality Management Strategy for Regionally Protected Water through Health Risk Assessment and Spatial Distribution of Heavy Metal Pollution in 3 marine Reserves. Sci. Total Environ. 599-600, 721–731. doi:10.1016/j.scitotenv.2017.04.232
Zhao, G., Ye, S., Yuan, H., Ding, X., and Wang, J. (2016). Distribution and Contamination of Heavy Metals in Surface Sediments of the Daya Bay and Adjacent Shelf, China. Mar. Pollut. Bull. 112 (1-2), 420–426. doi:10.1016/j.marpolbul.2016.07.043
Keywords: heavy metals, marine surface sediments, sources apportionment, ecological risk assessment, daya bay
Citation: Wang H, Fan Z, Kuang Z, Yuan Y, Liu H and Huang H (2021) Heavy Metals in Marine Surface Sediments of Daya Bay, Southern China: Spatial Distribution, Sources Apportionment, and Ecological Risk Assessment. Front. Environ. Sci. 9:755873. doi: 10.3389/fenvs.2021.755873
Received: 09 August 2021; Accepted: 04 November 2021;
Published: 17 December 2021.
Edited by:
Xiaoping Huang, South China Sea Institute of Oceanology (CAS), ChinaReviewed by:
Gang Hou, Fisheries College, Guangdong Ocean University, ChinaAnglu Shen, Shanghai Ocean University, China
Copyright © 2021 Wang, Fan, Kuang, Yuan, Liu and Huang. This is an open-access article distributed under the terms of the Creative Commons Attribution License (CC BY). The use, distribution or reproduction in other forums is permitted, provided the original author(s) and the copyright owner(s) are credited and that the original publication in this journal is cited, in accordance with accepted academic practice. No use, distribution or reproduction is permitted which does not comply with these terms.
*Correspondence: Huaxue Liu, bGl1aHVheHVlQHNjaWVzLm9yZw==; Honghui Huang, aHVhbmdoaEBzY3NmcmkuYWMuY24=
 Huijuan Wang
 Zhengqiu Fan
 Zexing Kuang1,2
 Honghui Huang