- 1School of Intelligent Systems Engineering, Sun Yat-sen University, Guangzhou, China
- 2Guangdong Provincial Key Laboratory of Intelligent Transportation System, Guangzhou, China
- 3Guangdong Provincial Engineering Research Center for Traffic Environmental Monitoring and Control, Guangzhou, China
- 4Guangzhou Transport Planning Research Institute, Guangzhou, China
The road and marine transportation sectors have attracted a great deal of attention as one of the main sources of carbon emissions. In this study, a LEAP (long-range energy alternatives planning system) model is used to predict the energy demand and carbon emissions of the road and marine transportation sectors in Guangdong Province from 2016 to 2030. Based on the model results, if Guangdong Province does not adopt new control measures, in 2030, the energy demand and CO2 (carbon dioxide) emissions from the road and marine transportation sectors will have increased by 117 and 116%, respectively, compared to the levels in 2015. Conversely, under a low-carbon scenario, carbon emissions will peak by 2027 in Guangdong Province. Motor vehicle control measures generate the strongest reduction in energy consumption and CO2 emissions for the road and marine transportation sectors in Guangdong Province. Furthermore, the reduction of emissions resulting from these measures would increase over time. Public transportation development and the promotion of clean energy measures also play significant roles in reducing carbon emissions long-term. The contribution of road passenger transport to emission reduction is the largest, followed by marine freight transport and road freight transport. While the energy demand and carbon emissions peak at a similar time in the model, the peak time for CO2 occurs slightly earlier.
Introduction
Mitigating global climate change has involved cooperation at the national and international levels (Georgatzi et al., 2020; Raza and Lin, 2020). Participating countries in the United Nations Framework Convention on Climate Change have signed the Kyoto Protocol, which aims to stabilize greenhouse gases in the atmosphere at an appropriate level. China, as the largest global emitter, signed the Kyoto Protocol in 1998. China also signed the 2015 Paris Agreement and committed to peaking their carbon emissions by 2030 (Mendonca et al., 2020). To peak carbon emissions as rapidly as possible, many scholars are researching carbon emission peak scenarios, resulting in the topic being the latest research hotspot (Ding et al., 2019; Fang et al., 2019). In China, the transportation sector is the third largest contributor to carbon dioxide emissions after the power generation and manufacturing sectors (Yan, 2018). Therefore, exploring carbon peak scenarios in the transportation sector is highly relevant to China’s climate change mitigation goals (Li and Yu, 2019; Chen H. et al., 2020a). With rapid urbanization and motorization, the transportation demand will continue to grow, which means that energy consumption and greenhouse gas emission levels will continue to grow also (Lee et al., 2018). To meet the goal of low-carbon development, the transportation sector must make urgent efforts to reduce and control carbon emissions from the municipal to federal levels.
Research on carbon emissions in the field of transportation is still in its infancy in terms of statistical data, calculation methods and practical technologies. The research mainly comprises driving factor analysis, emission reduction potential research, cooperative effect analysis, cost-benefit analysis and peak value research (Liu et al., 2017a; Liu et al., 2019; Bai et al., 2020). To control the growth of transport demand and reduce the energy consumption and carbon emissions of the transportation sector in China, a series of measures including a reduction in the number of private vehicles, fuel quality improvement, biofuel promotion, public transportation promotion, and the optimization of freight structure are being implemented (Yan and Crookes, 2009; Liu et al., 2019). The findings of Liu et al. (2017a); Liu et al. (2019) indicate that these measures are economical and effective for the reduction of CO2 emissions. Measuring the potential of these measures to reduce emissions and to peak carbon emissions early, including calculating the time and peak value of the carbon peak, is critical because doing so can help decision makers to choose the most appropriate emission reduction goals.
Although the Chinese government and Chinese industries are increasingly paying attention to carbon emission reduction and carbon peaking, there are relatively few studies on carbon dioxide emissions in China’s road and marine transportation sectors due to the difficulty of data acquisition and the unreliability of available data. Chen X. et al. (2020b) predict the carbon peaks in four pillar sectors (i.e., industrial, building, transport and agricultural sectors) and find that carbon emissions in China will peak in 2036, 6 years later than the target year. Lu et al. (2020) predict future carbon emissions for the heavy chemical industry from 2017 to 2035 and find the ideal carbon emission peak year to be 2021. Li et al. (2020) report construction industry carbon emissions peaking in 2020 under the technological breakthrough scenario and find that the gross domestic product (GDP) has the highest cumulative contribution rate to China’s construction industry carbon emissions. The GDP of Guangdong Province is the highest in China (Lu et al., 2019). Moreover, with the growth of traffic demand, carbon emissions from the road and marine transportation sectors in Guangdong Province will continue to grow and must be reduced.
Accurately modeling carbon emissions is critical to determining their peak time and peak value. There are a variety of bottom-up prediction models, such as AIM/end-use models (Selvakkumaran and Limmeechokchai, 2015), MARKAL (market allocation) models (Pattanapongchai and Limmeechokchai 2011; Li et al., 2015) and LEAP (long-range energy alternatives planning system) models (Rahmadi et al., 2013). The first two models focus on the choice of energy technology. The LEAP model is an energy consumption and environment model based on policy development scenarios. It is highly effective for analyzing policy subsets separately and evaluating the effect of specific policies. This model is consistent with the objective of low-carbon emission transport policy selection. Emodi et al. (2017) apply a scenario-based analysis to explore Nigeria’s future energy demand, supply and associated GHG emissions from 2010 to 2040 using the LEAP model. Nieves et al. (2019) use the LEAP model to analyze the energy demand and greenhouse gas emissions in Colombia. In China, Wang et al. (2017) use the LEAP model to predict the energy consumption from 2016 to 2040 in Hunan Province and analyze the factors that affect energy consumption. Hu et al. (2019) analyze future projections of energy generation and consumption from 2015 to 2030 based on the LEAP model in Shenzhen. The LEAP model is a very popular prediction method for energy consumption and associated GHG emissions. This study will use the LEAP model to predict the carbon emissions of the road and marine transportation sectors in Guangdong Province from 2015 to 2030.
To reduce carbon emission in Guangdong Province, which is the province with the highest GDP in China, low-carbon scenario to predict the energy demand and CO2 emissions of the road and marine transportation sectors from 2016 to 2030 are considered, with a focus on the time and value of the carbon emission peak. This study uses a LEAP model to predict carbon emissions, quantifies the energy demand and emission reduction potential of different scenarios from 2016 to 2030, and forecasts when the road and marine transportation sectors in Guangdong Province will peak their carbon emissions in a low-carbon scenario. Through scientific policy guidance, the contribution of these factors to the carbon dioxide emissions from the road and marine transportation sectors in Guangdong can be reduced. This study quantifies the emission reduction potential of various policies and provides appropriate emission reduction targets for decision makers. The results have a broad application potential and can be used in other regions. The rest of this paper is organized as follows. Section two constructs the carbon emission prediction model. Section three sets up the baseline scenario and low-carbon scenario. Section four forecasts the energy demand and carbon emissions of Guangdong Province and analyzes the emission reduction potential of the different scenarios. Section five presents the conclusions and policy implications.
Methods and Data
To achieve the goals of this study, this paper uses the LEAP model to calculate the carbon emissions of the road and marine transportation sectors and predict the peak of these emissions. CO2 emissions are calculated primarily as a function of the energy consumption of each type of vehicle and the corresponding CO2 emissions, while the energy consumption is related to the activity level of the vehicles. Therefore, to calculate CO2 emissions, it is necessary to first predict energy consumption and activity level. The specific methodology and data are as follows.
The Framework of the Study
This study employs the LEAP model to predict the energy demand and CO2 emissions of the road and marine transportation sectors in Guangdong Province. Using scenario analysis, carbon emission peak, reduction potential and emissions from different modes of transportation and energy sources are analyzed. Finally, policy recommendations are formed based on the analysis.
The LEAP model is an energy-environment model developed by the Stockholm Environmental Institute to calculate pollution emissions caused by energy demand. Users can set a series of scenarios and predict how changing various factors impacts CO2 emissions by adjusting the transportation structure and rate of technological progress. The LEAP model adopts the bottom-up method, setting different scenarios according to the change of energy consumption at the transportation terminal and linking this to carbon emission factors to analyze energy consumption and carbon emissions.
Based on the concept of territorial management, the transportation researched in this paper is defined and divided based on the characteristics of Chinese transportation modes and the feasibility of data acquisition. Transportation referred to in the study includes passenger transport and freight transport. Passenger transport refers to highway passenger transport (mini, small, medium, and large passenger cars), urban road public transport (taxi, bus, and subway transport), motorcycle passenger transport and marine passenger transport. Freight transport includes road freight transport (mini, small, medium, and large trucks) and marine freight transport. The energy consumption and CO2 emission model are constructed according to the operation process and calculation system.
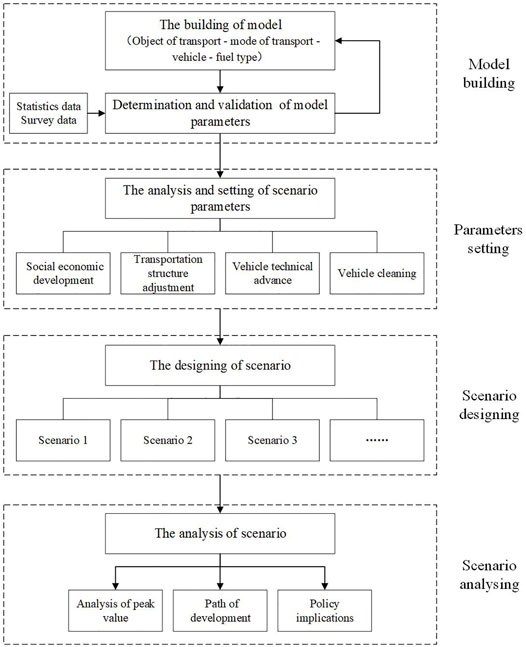
The study focuses on the analysis and evaluation of energy consumption and direct CO2 emissions of the road and marine transportation sectors in Guangdong Province. The calculation process of the model is divided into two parts: energy consumption and CO2 emissions. The current energy consumption and carbon emissions are calculated using 2015 as the base year. The framework of the study is shown in Figure 1.
Calculation of Carbon Emissions
The calculation of CO2 emissions is based on the energy consumption for each energy source and the corresponding CO2 emission factors. The CO2 emissions of transportation, including road transport, water carriage and urban passenger transportation, are calculated according to the following formula:
where Eij represents the CO2 emissions of energy source j in year i, in units of tons; TFij represents the energy consumption of energy source j in year i, in units of tons; and EFij represents the CO2 emission per unit mass fuel of energy source j in year i, in units of tons CO2/tons fuel.
Calculation of Energy Consumption
For road transportation, the energy consumption of motor vehicles is mainly a function of the number of motor vehicles, average annual mileage of motor vehicles, and fuel efficiency. Therefore, the energy consumption of road transportation can be calculated by the following formula:
where Fij represents the energy consumption of vehicles of category j in year i, in units of tons of standard coal; Pij represents the number of vehicles of category j in year i; VKTij represents the average annual mileage of vehicles of category j in year i, in units of km; and Uij represents the fuel economy of vehicles of category j in year i, in units of tons of standard coal/km.
In terms of urban passenger transport, which must consider passenger volume, the energy consumption is typically calculated by multiplying the total passenger transport turnover by the energy consumption per unit of passenger transport turnover. However, in Guangdong Province, urban public transport travel is measured as annual passenger volume. Therefore, the energy consumption of urban passenger transport in this study is calculated by the following formula:
where FPij represents the energy consumption of urban passenger transport type j in year i, in units of tons of standard coal; TDPij represents the passenger capacity of urban passenger transport type j in year i, in units of 104 people; Lij represents the single trip distance of urban passenger transport type j in year i, in units of km; βjk represents the traffic structure proportion of energy source k of urban passenger transport type j, in units of %; and EPassijk represents the energy consumption per unit turnover of energy source k of urban passenger transport type j in year i, in units of standard coal/(person·km).
For marine transportation, the energy consumption is calculated by the following formula:
where FWij represents the energy consumption of marine transport mode j in year i, in units of tons of standard coal; j is 1 or 2, representing freight or passenger transport, respectively; TDWij represents the turnover of passenger transport or freight transport in year i (assuming the average weight of each passenger is 65 kg), in units of t·km; βijk represents the structural proportion of fuel type k of marine transport mode j in year i, in units of %; and EWijk refers to energy consumption per unit turnover of fuel type k of marine transport mode j in year i, in units of tons standard coal/(t·km).
Prediction of Activity Level
Activity level includes the number of motor vehicles and annual mileage of road transport, the traffic volume and turnover volume of each type of urban passenger transport terminal and marine transport, i.e., Pij, VKTij, TDPij, and TDWij. Under the baseline scenario, there is no change in policy. Activity levels for each type of transportation in Guangdong Province are predicted for 2020, 2025, and 2030.
In terms of road transport, the elastic coefficient method is used to predict activity level, including ownership and annual vehicle kilometers of travel. The prediction formula is as follows:
where ε represents the elastic coefficient; α represents the rate of change of activity level for various models; and β represents the rate of change of GDP per capita.
Considering the current policy plan for reducing pollution by controlling the total amount of vehicles, it is assumed that the elasticity coefficient of road transport in Guangdong Province will change in the future, especially for small passenger cars. The elasticity coefficient will be set to 1.77, 1.47, and 0.92 in 2020, 2025, and 2030, respectively, to obtain the activity level for various types of vehicles according to the prediction of per capita GDP.
In terms of urban passenger transport and marine transport, an econometric model is used to establish the regression relationship between the traffic volume or turnover volume of each type of urban passenger transport terminal and marine transport, and per capita GDP, to predict the future urban passenger transport and marine transport traffic volume or turnover volume. The formula for the regression relationship is as follows:
where TDi represents the volume of urban passenger transport in year i, in units of 10,000 people, or the turnover volume of marine transport in year i, in units of 108 tons·km; GDPPi represents the per capita GDP in year i, in units of 104 yuan; and α and β represent model parameters.
Data Collection
Based on data from 2005 to 2015, this study forecasts the energy consumption and carbon emissions from the road and marine transportation sectors in Guangdong Province from 2016 to 2030. The data in this study are derived from four different sources. Emission factors were derived from the Provincial Greenhouse Gas Inventory Compilation Guide(in Chinese). The per capita GDP and vehicle numbers of all different types, including minibus, small passenger car, medium passenger car, large passenger car, minivan, light truck, medium truck and heavy truck, were derived from the Guangdong Statistical Yearbook(in Chinese). Vehicle kilometers of travel were sourced from previous research (Liu et al., 2017b). Public transport passenger volume and marine transport turnover were sourced from the Department of Transportation of Guangdong Province.
Scenario Setting
The selection of scenario policies for transportation sector carbon emissions in Guangdong Province is the basis for evaluating future transportation sector carbon emissions and the effect of different policies. Reduction scenarios were designed according to the current situation and existing problems of transportation development, combined with the carbon emission reduction policies for the road and marine transportation sectors in Guangdong Province and China’s requirements for energy conservation and emission reduction. To reflect the transportation sector energy demand and carbon emissions under the influence of existing policies and to perform a comparative analysis on the effect of different policies, two scenarios are set up in the study. One is the baseline scenario, and the other is the low-carbon scenario.
Baseline Scenario
The baseline (business as usual) scenario refers to measures taken in the base year, without any changes in policy. The activity-level data use the proportion of the service volume of each end-use layer for each year, but the service volume of each department maintains natural growth.
Low-Carbon Scenario
Based on literature research, this paper examines factors influencing transportation sector carbon emissions, considering the current situation of Guangdong Province and data availability, in order to summarize the factors affecting the development of low-carbon transportation. These factors include the social economy, infrastructure, traffic scale, transportation capacity, and science and technology. The design of the low-carbon scenario primarily focuses on factors influencing transportation-related carbon emissions in Guangdong Province, combined with a series of existing transport energy conservation and emission reduction policies, plans, and other references suitable for estimating future emission reduction in Guangdong Province. Considering the operability of measures and the quantification of indicators, a total of five low-carbon measures are set up. The description and setting reference of the five low-carbon measures are shown in Table 1.
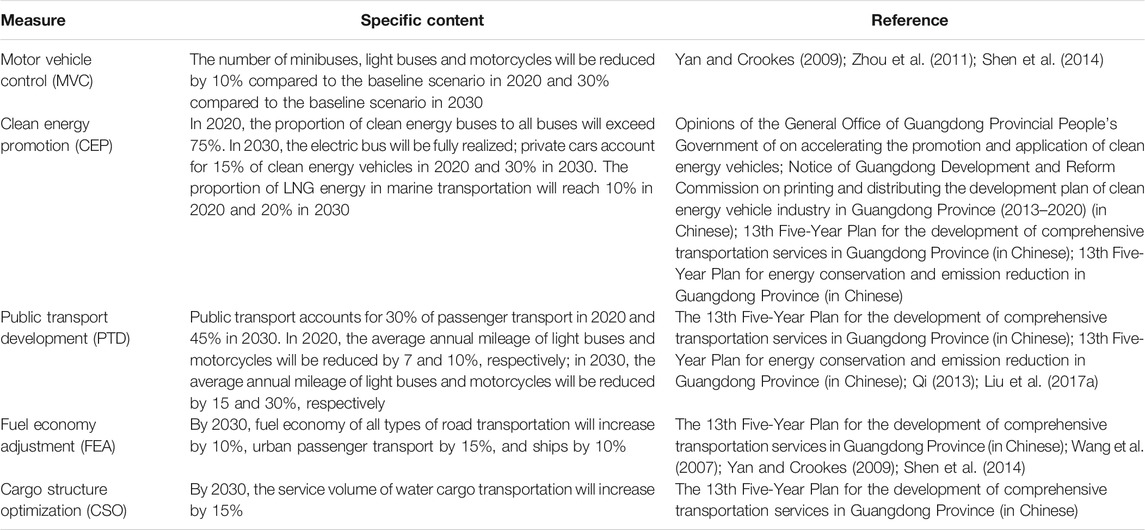
TABLE 1. Low-carbon scenario design of transportation sector carbon emission policy in Guangdong Province.
Based on the above low-carbon scenario settings, the quantitative indicators of different policy measures in 2020, 2025, and 2030 for Guangdong road and marine transportation sector are shown in Table 2.
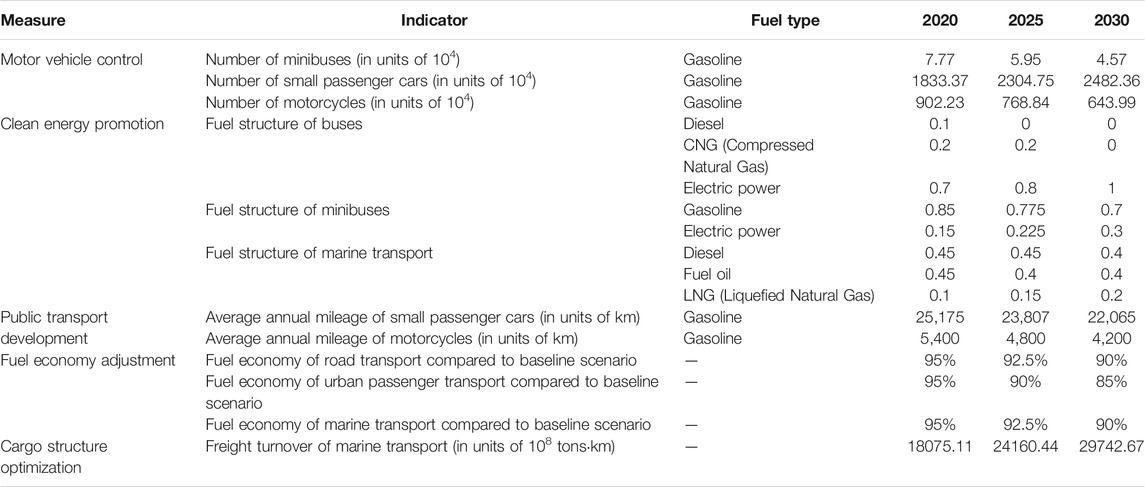
TABLE 2. Specific quantitative indicators of future transportation in Guangdong Province under low-carbon scenarios.
Results and Discussion
Based on data from 2015, we forecast energy demand and carbon emission reductions from 2016 to 2030 and further analyze the energy demand of various modes of transportation and their impact on CO2 emissions. Considering different implementation levels of the policy, we also analyze the peak time of CO2 emission and energy demand in five measures where 80, 90, 100, 110, and 120% of emission reduction target is reached.
Evolution of Energy Demand and Carbon Emissions
Taking 2015 as the base year, the energy demand and CO2 emissions in Guangdong Province from 2016 to 2030 are forecasted using the LEAP model, which is shown in Figure 2. Under the baseline scenario, energy demand in Guangdong Province in 2020, 2025, and 2030 would reach 88 million tons of standard coal, 114 million tons of standard coal equivalent and 135 million tons of standard coal equivalent, respectively. The CO2 emissions would reach 180 million tons, 233 million tons and 274 million tons, respectively. If Guangdong Province does not take new control measures and adopt new policies, transportation energy demand and CO2 emissions will grow rapidly. Compared to 2015 values, transportation energy demand and CO2 emissions in Guangdong Province would more than double by 2030.
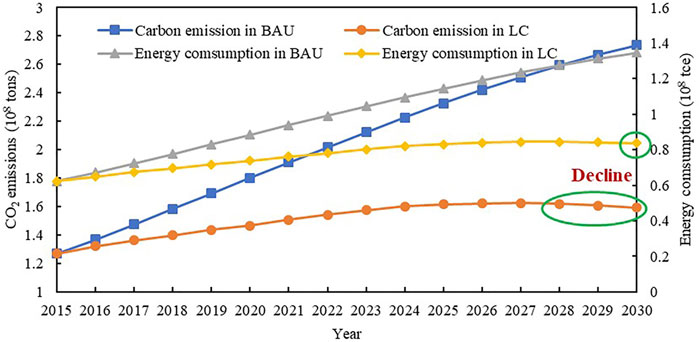
FIGURE 2. The trend of energy demand and CO2 emissions for transportation in Guangdong Province from 2015 to 2030.
At the general debate of the 75th session of the United Nations General Assembly in September 2020, China promised to achieve the peak of carbon emissions by 2030, and strive to achieve carbon neutrality before 2060. The peak of carbon emission was adjusted from “around 2030″ to “before 2030″, which shows that China has greater confidence and determination to deal with climate change. As one of the critical regions of China’s reform and development, the Guangdong government had put forward in-time strategies to slow down the increase of carbon emission, especially in eliminating the backward production capacity and promoting industrial transformation and upgrading. Under the influence of COVID-19, the instability of the climate change situation has been strengthened, and the pressure of continuous improvement of carbon emission and environmental quality in Guangdong Province is increasing. Industrial transformation in the recent year accounts for achievement in energy and emission reduction. From the result of the baseline scenario, carbon emission control in transportation should also be highlighted.
Under the low-carbon scenario, the energy demand of Guangdong Province in 2020, 2025, and 2030 would reach 74 million tons of standard coal equivalent, 83 million tons of standard coal equivalent and 84 million tons of standard coal equivalent respectively, which is 38% lower than the baseline scenario for 2030. The CO2 emissions would reach 147 million tons, 162 million tons and 159 million tons respectively, which is 42% lower than the baseline scenario for 2030. Under the low-carbon scenario, the energy demand of road and marine transportation sectors in Guangdong Province show overall growth, but the growth rate is lower than that of the baseline scenario and is gradually decelerating. The energy demand in 2030 is slightly lower than that in 2029. However, CO2 emissions increase at first before decreasing. Consequently, the carbon emission peak could be reached in 2027. Although the energy demand and CO2 emission keep the same trend, the CO2 emission would reach the peak earlier than the energy demand. The reason is that the optimization of energy structure would reduce the CO2 emission per unit of energy, which is conducive to accelerating the peak of carbon emission. The results of Chen X. et al. (2020b) show that overall carbon emissions in China would peak in 2036: 2031 for the industrial sector, 2035 for the building sector, 2043 for the transportation sector, and 2026 for the agricultural sector. The carbon emission peak time for the road and marine transportation sectors in this study is 15 years earlier than the result of Chen X. et al. (2020b) and shows that China’s goal of peaking carbon emissions could be achieved by 2030. Conversely, a study by Su and Lee (2020) finds that there is potential for peaking carbon emissions by 2028 in China, which is 1 year later than the peak time for the transportation sector in this study. To summarize, the low-carbon scenario is ideal for reducing energy demand and controlling CO2 emissions in Guangdong Province. Under the low-carbon scenario, the road and marine transportation sectors in Guangdong Province could achieve the control requirements for carbon peaks before 2030.
Assessment of Emission Reduction Potential
If Guangdong’s transportation develops according to the low-carbon scenario, the reduction of transportation sector energy demand and CO2 emission in 2020, 2025, and 2030 are shown in Figure 3. According to the model results, under the low-carbon scenario, the transportation sector energy demand in 2020, 2025, and 2030 would be reduced by 15 million tons of standard coal, 31 million tons of standard coal and 51 million tons of standard coal, respectively, compared with the baseline scenario. The CO2 emissions in 2020, 2025, and 2030 would be reduced by 34 million tons, 71 million tons, and 114 million tons, respectively, compared with the baseline scenario. In 2015–2030, compared with the baseline scenario, energy demand and CO2 emissions decrease at an increasing rate.
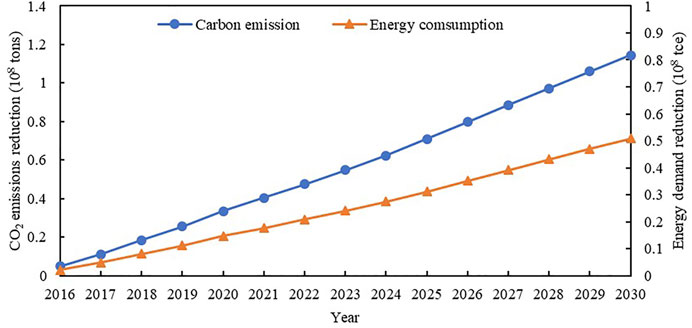
FIGURE 3. The reduction of energy demand and CO2 emission in Guangdong Province under low-carbon scenario compared with the baseline scenario.
To further analyze the implementation effect of different policy measures under the low-carbon scenario, specific results are shown in Figures 4, 5. Under the low-carbon scenario, the five different measures each have different impacts on the energy demand and CO2 emissions of future transportation in Guangdong Province. In general, the order of impact on energy demand reduction from high to low is motor vehicle control > fuel economy adjustment > public transport development > clean energy promotion > cargo structure optimization. For CO2 emission reduction, the order of impact is: motor vehicle control > clean energy promotion > fuel economy adjustment > public transport development > cargo structure optimization.
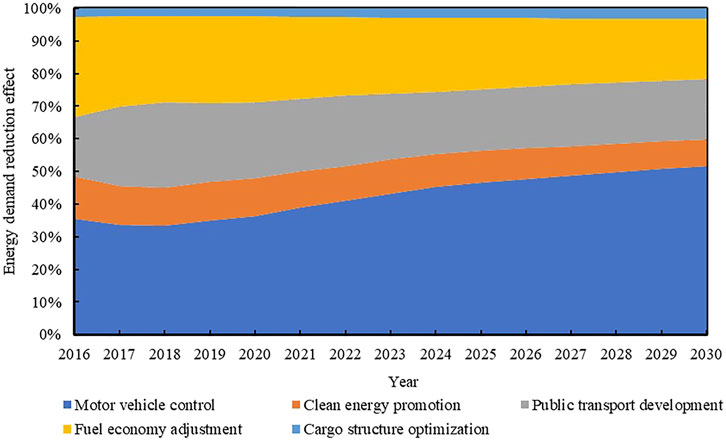
FIGURE 4. Proportion of energy demand reduction for different measures under a low-carbon scenario for the road and marine transportation sectors in Guangdong Province.
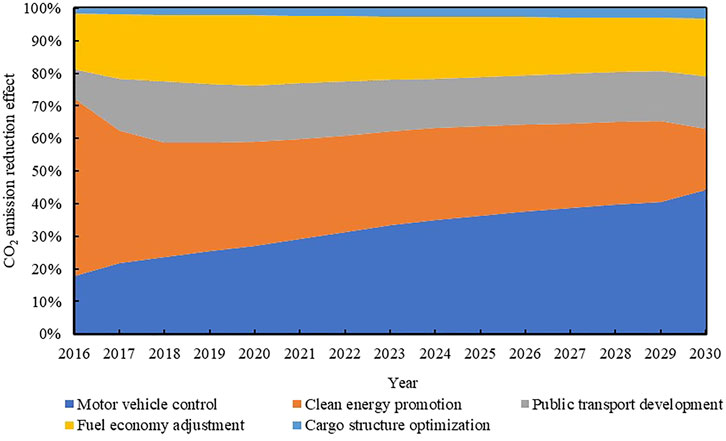
FIGURE 5. Proportion of CO2 reduction for different measures under a low-carbon scenario for the road and marine transportation sectors in Guangdong Province.
Motor vehicle control measures have the largest effect, and the emission reduction effect from motor vehicle control measures would increase over time. Second, clean energy promotion could have a significant CO2 emission reduction effect (approximately 20%), which is conducive to reducing the CO2 emissions of the road and marine transportation sectors in Guangdong Province. The impact of public transportation development would improve energy usage and carbon emissions in 2016–2022 and could provide a carbon emission reduction of 18–23% for this time period. In the following years, with the implementation of clean energy replacement and fuel economy adjustment measures, the efficiency of transport would improve and the intensity of CO2 emissions would be reduced. The impact of public transport development would therefore weaken. In 2030, the five measures including motor vehicle control, clean energy promotion, public transport development, fuel economy adjustment and cargo structure optimization, would reduce CO2 emissions under the low-carbon scenario by 46, 20, 16, 16, and 3%, respectively.
Impact of Different Energy Sources on CO2 Emissions
This study further analyzes the energy demand of various energy sources and their impact on CO2 emissions under the low-carbon scenario, shown in Figures 6, 7. Under the low-carbon scenario, future energy sources for the road and marine transportation sectors in Guangdong Province would be cleaner, and the proportion of clean energy would increase gradually. By 2030, energy demand for the road and marine transportation sector in Guangdong Province would account for 13% of the total energy demand, while emissions would only account for 7%. However, the proportion of the transportation sector being met by fossil fuel would still be as high as 80%. It can be seen that there is still room to increase the use of clean energy in Guangdong’s transportation sector in the future.
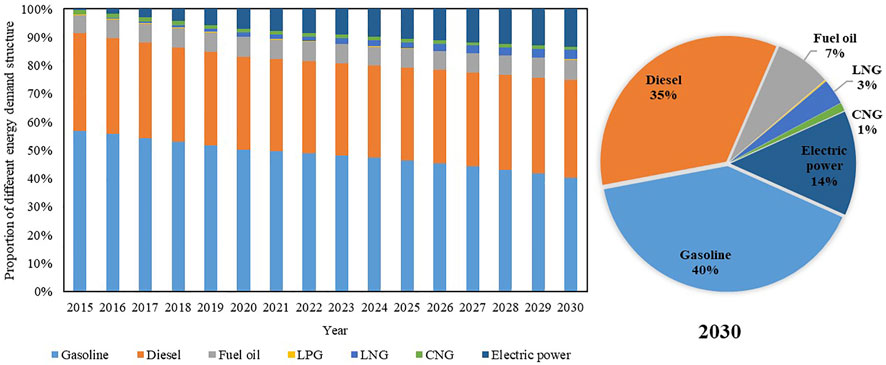
FIGURE 6. Prediction of energy demand structures of transportation under the low-carbon scenario in Guangdong Province.
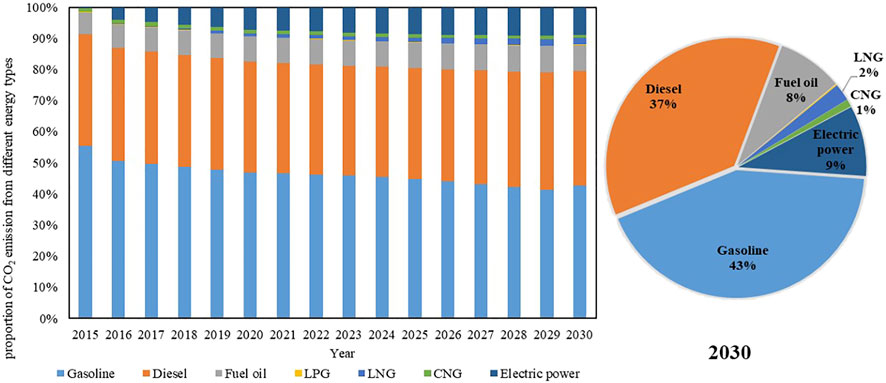
FIGURE 7. Prediction of CO2 emission of energy sources of transportation under the low-carbon scenario in Guangdong Province.
Impact of Different Modes of Transportation on CO2 Emissions
Considering energy consumption by transportation type, as shown in Figure 8, road passenger transport, road freight transport, and marine freight transport would be the most important sources of energy consumption in the Guangdong Province transportation sector in the future, no matter which scenario is evaluated. The road transport sector is responsible for the vast majority of short- and medium-distance transportation and is the sector that accounts for the largest proportion of transportation carbon emissions. These would therefore be the most critical target areas for energy conservation and emission reduction. Under the baseline scenario, as transportation demand increases, the energy consumption of all types of transportation would increase, except for motorcycles, which would be phased out. The growth of road passenger transport, road freight transport and marine freight transport is the largest, with energy consumption in 2030 increasing by 1.5, 1.3, and 0.6 times compared with 2015, respectively. Under the low-carbon scenario, with increased use of clean energy sources, the energy consumption of the transportation sector in Guangdong Province would be significantly reduced compared with the baseline scenario. In 2030, the contribution of road passenger transport, urban public transport, motorcycles, road freight transport and marine freight transport to total transportation sector energy consumption would be approximately 85, 1, 2, 5, and 7%, respectively.
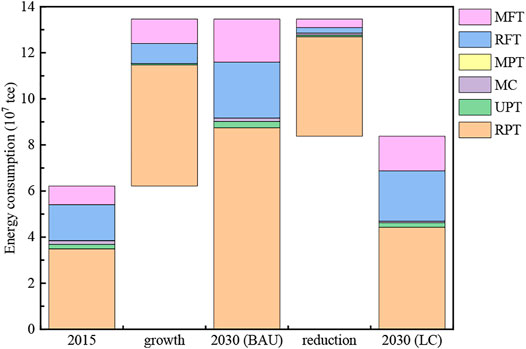
FIGURE 8. Energy consumption reduction of different modes of transportation in Guangdong Province. Note marine freight transport (abbreviated as MFT); road freight transport (abbreviated as RFT); marine passenger transport (abbreviated as MPT); motorcycle (abbreviated as MC); urban public transport (abbreviated as UPT); road passenger transport (abbreviated as RPT).
The trend for carbon emissions by transportation type is similar to that for energy consumption in Guangdong Province, as shown in Figure 9. Road passenger transport, road freight transport and marine freight transport would be the most important sources of CO2 emissions in the future, whether in the baseline scenario or in the low-carbon scenario. Under the low-carbon scenario, with a low-carbon transportation structure and increased use of clean energy, CO2 emissions from the transportation sector would be significantly reduced compared with the baseline scenario. The contribution of road passenger transport to emission reduction is the largest, followed by marine freight transport and road freight transport. The emission reduction contributions in 2030 would be approximately 84, 9, and 5%, respectively, compared with the baseline scenario.
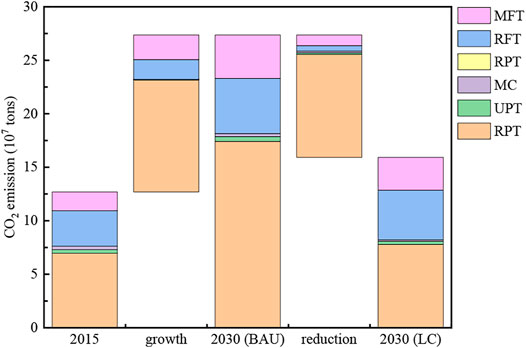
FIGURE 9. CO2 emission reduction of different modes of transportation in Guangdong Province. Note marine freight transport (abbreviated as MFT); road freight transport (abbreviated as RFT); marine passenger transport (abbreviated as MPT); motorcycle (abbreviated as MC); urban public transport (abbreviated as UPT); road passenger transport (abbreviated as RPT).
The Impact of Policies Implementation Level on the Peak
To further predict the transportation sector carbon emissions and energy demand in Guangdong Province, a deviation of 10 and 20% from the 2030 target value is set for carbon emissions, which can be divided into five situations with completion degrees of 80, 90, 100, 110, and 120%. It can be seen from Figures 10, 11 that the energy demand and the carbon emissions peak at a similar time for each scenario. The peak time for CO2 emissions is 1 year ahead of that for energy demand for the completion degrees of 90, 100, 110, and 120%, corresponding to the years 2028, 2027, 2026, and 2025, respectively. When the completion degree is 120%, transportation sector carbon emissions could reach their peak 2 years ahead of schedule. Thus, to achieve the reduction goal of low-carbon scenario in Guangdong Province, the peak of transport carbon emission could be delayed. When the completion degree is 80%, transportation sector carbon emissions would peak in 2029.
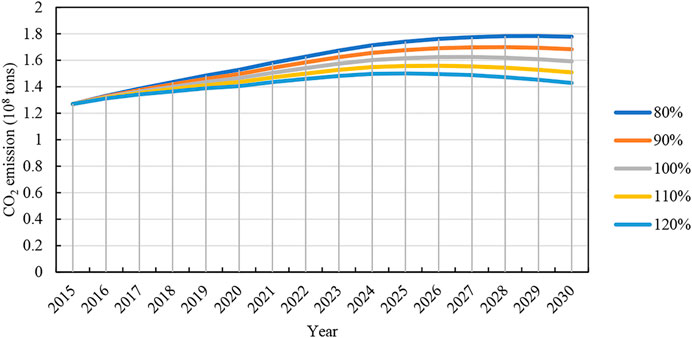
FIGURE 10. CO2 emissions under different degrees of implementation of reduction measures in Guangdong Province.
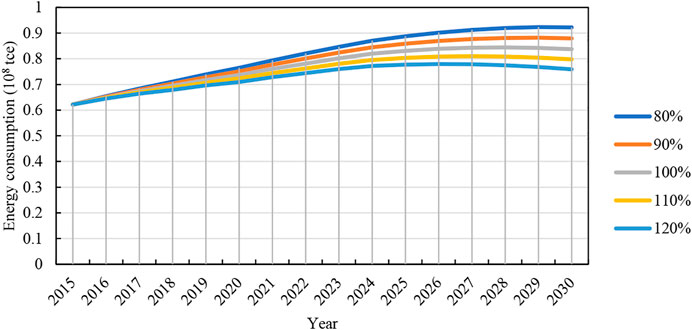
FIGURE 11. Energy demand under different degrees of implementation of reduction measures in Guangdong Province.
Conclusions and Policy Implications
Conclusion
In this study, we use the LEAP model to predict carbon emissions for the road and marine transportation sectors in Guangdong Province from 2015 to 2030. The following conclusions were obtained in this study. The results show that if Guangdong Province does not adopt new control measures, energy demand and CO2 emissions for the road and marine transportation sectors would increase to 117 and 116%, respectively by 2030 compared to 2015. However, in a low-carbon scenario, the carbon emission peak would be reached by 2027. By 2030, the energy demand for road and marine transportation sectors would account for 13% of the total energy demand, while the emissions would only account for 7%. Motor vehicle control measures have the strongest effect on reduction of energy consumption and CO2 emissions, and the reduction of emissions from motor vehicle control measures would increase over time. By 2030, the five measures analyzed in this study, including motor vehicle control, clean energy promotion, public transportation development, fuel economy adjustment, and freight structure optimization, would comprise 46, 20, 16, 16, and 3%, respectively, of total CO2 emission reductions under the low-carbon scenario. In 2030, the contribution of road passenger transport, urban public transport, motorcycles, road freight transport and marine freight transport to energy demand reduction would be approximately 85, 1, 2, 5, and 7%, respectively. The contribution of road passenger transport, marine freight transport and road freight transport to CO2 emission reduction in 2030 would be approximately 84, 9, and 5%, respectively. If Guangdong Province achieves 120% of its 2030 target for carbon emissions in the transportation sector, carbon emissions could peak 2 years ahead of schedule, i.e., in 2025.
Policy Implications
By comparing the five reduction measures under the low-carbon scenario in 2030 with the baseline scenario, the contributions of the five reduction measures are obtained respectively, and the emission reduction contributions of passenger transport and freight transport are summarized, which are shown in Table 3. Motor vehicle control has the greatest impact on energy savings and carbon reduction, indicating that it is necessary to control the number and travel frequency of cars effectively. Strengthening the implementation of total control of the number of small and medium-sized passenger cars and putting forward a timely the implementation plan to include the number of clean energy vehicles in the total number of cars controlled could effectively reduce the number of local private cars. Expanding the scope of travel restrictions for nonlocal vehicles would also gradually reduce travel amount. Strengthening the management of urban parking and congestion and comprehensively implementing differentiated parking supply and management for different regions, types and periods would likewise reduce travel frequency. Finally, using economic means to control the travel frequency of private cars could effectively reduce CO2 emissions.
In addition, the development of public transport and promotion of clean energy also play an important role and have long-term benefits. A comprehensive public transport system would not only greatly improve the convenience of people’s travel but also help to reduce urban congestion. The promotion of clean energy is a new direction. Guangdong Province is vigorously promoting the transition to clean energy buses to actively adapt to the new normal of internet development. At present, energy usage in Guangdong Province is dominated by carbon-intensive energy sources, which is a difficult dependency to change in a short period of time. Therefore, it is critical to adjust the energy structure and gradually replace oil with clean and renewable energy sources such as solar energy, wind energy, hydropower, nuclear power and biomass energy.
Road passenger transport control measures have the greatest contribution to reduction of energy consumption and CO2 emissions. We recommend accelerating the use of biofuels and hydrogen fuels in the field of road passenger transport. The road passenger transport should gradually be converted to LNG buses and hydrogen fuel buses. We also recommend speeding up the elimination of old passenger transport vehicles with high energy consumption and low efficiency and encouraging the development of large and medium-sized passenger vehicles with low energy consumption and emission. The scale and intensity of passenger transport enterprises should be improved. Advanced passenger transport organization and management should be promoted, and the actual load rate of passenger transport should be improved. Public travel information services should be optimized, and the service capacity of the passenger transport system should be improved.
The adoption of clean energy vehicles should be accelerated. The use of clean energy vehicles in public transport, taxis, business vehicles and other fields should continually be promoted. The use of clean energy vehicles in the field of private vehicles should be encouraged. The planning and construction of infrastructure for clean energy vehicles, such as charging piles, should be promoted. Considering the growing traffic demand in the Guangdong-Hong Kong-Macao Greater Bay Area, increasing the proportion of clean energy vehicles could effectively reduce carbon emissions. The purchase of clean energy vehicles and implement economic incentive policies for clean energy vehicles should be encouraged. In 2018, the Mayor’s Transport Strategy of London stated that London’s transport network must meet legal air quality levels as soon as possible in order to achieve the goal of becoming zero carbon city by 2050. This target protects the health of Londoners and demonstrates a commitment to tackling climate change. In Guangdong Province, vigorously promoting the use of clean energy vehicles could be one important measure to help achieve zero carbon emissions from the transportation sector and could address issues of increasing traffic demand simultaneously.
Guangdong Province locates in the Pearl River region. It is necessary to make full use of its geographical advantages and optimize the freight structure to help save energy and reduce carbon emissions. Furthermore, promoting the integration of information technology and transportation industry management and service, promoting the application of intelligent transportation information systems, actively developing efficient transportation organization modes such as multimodal transport, dropping and pulling transport and joint distribution, and promoting the development of low-carbon freight are key measures that should be considered to achieve a reduction in carbon emissions and energy use in the transportation sector.
Additionally, air pollution and climate change are currently the two major challenges facing in most developing countries in the environmental field. However, most developing countries (such as China, India, etc.) focus more on the problem of air pollution, as it has been proven that worsen air quality not only directly associates with the prevalence of respiratory-related diseases and premature death, but also influents social, industrial and economic development. The earlier commitment of reaching carbon emission peak in 2030 and carbon neutrality in 2060 shows our new goal on climate change mitigation, which focuses every field to take more stringent action. Under the new circumstance and higher requirement, it is not advisable to treat these two problems separately. Researches show that the air quality standard could promote the implementation of low-carbon energy policy and realize the coordinated air quality improvement and emission reduction of CO2 (Chen H. et al., 2020a; Xing et al., 2020). Also, air pollutants and carbon dioxide source similarly, which support the feasibility of synergy treatment. Faced with the increasingly higher demand for human being’s health and a happier living environment, more scientific and precise measures are needed in our 14th Five-Year Plan and medium-to-long term action plan. It requires us and more researchers to pay more attention to this theme.
Data Availability Statement
The original contributions presented in the study are included in the article/Supplementary Material, further inquiries can be directed to the corresponding author.
Author Contributions
YZ: Writing—original draft, data compiling, Formal analysis. HD: Methodology, Writing—review and; editing. XL: Investigation, Data curation. LL: Investigation, Data validation. WL: Writing—original draft, Methodology. YL: Supervision, Methodology, Writing—review and; editing.
Funding
National Key Research Program (No. 2018YFB1601100), Natural Science Foundation of China (Nos. 41975165, U1811463), Natural Science Foundation of Guangdong Province (2019A1515010812), Fundamental Research Funds for the Central Universities (No. 2021qntd08).
Conflict of Interest
The authors declare that the research was conducted in the absence of any commercial or financial relationships that could be construed as a potential conflict of interest.
Publisher’s Note
All claims expressed in this article are solely those of the authors and do not necessarily represent those of their affiliated organizations, or those of the publisher, the editors and the reviewers. Any product that may be evaluated in this article, or claim that may be made by its manufacturer, is not guaranteed or endorsed by the publisher.
References
Bai, C., Zhou, L., Xia, M., and Feng, C. (2020). Analysis of the Spatial Association Network Structure of China's Transportation Carbon Emissions and its Driving Factors. J. Environ. Manage. 253, 109765. doi:10.1016/j.jenvman.2019.109765
Chen, H., Chen, W. U., and He, J. K. (2020a). Pathway to Meet Carbon Emission Peak Target and Air Quality Standard for China[J]. China Pollut. Resour. Environ. 30 (10), 12–18. doi:10.12062/cpre20200801
Chen, X., Shuai, C., Wu, Y., and Zhang, Y. (2020b). Analysis on the Carbon Emission Peaks of China's Industrial, Building, Transport, and Agricultural Sectors. Sci. Total Environ. 709, 135768. doi:10.1016/j.scitotenv.2019.135768
Ding, S., Zhang, M., and Song, Y. (2019). Exploring china's Carbon Emissions Peak for Different Carbon Tax Scenarios. Energy Policy 129, 1245–1252. doi:10.1016/j.enpol.2019.03.037
Emodi, N. V., Emodi, C. C., Murthy, G. P., and Emodi, A. S. A. (2017). Energy Policy for Low Carbon Development in Nigeria: A LEAP Model Application. Renew. Sustain. Energ. Rev. 68, 247–261. doi:10.1016/j.rser.2016.09.118
Fang, K., Tang, Y., Zhang, Q., Song, J., Wen, Q., Sun, H., et al. (2019). Will China Peak its Energy-Related Carbon Emissions by 2030? Lessons from 30 Chinese Provinces. Appl. Energ. 255, 113852. doi:10.1016/j.apenergy.2019.113852
Georgatzi, V. V., Stamboulis, Y., and Vetsikas, A. (2020). Examining the Determinants of CO2 Emissions Caused by the Transport Sector: Empirical Evidence from 12 European Countries. Econ. Anal. Pol. 65, 11–20. doi:10.1016/j.eap.2019.11.003
Hu, G., Ma, X., and Ji, J. (2019). Scenarios and Policies for Sustainable Urban Energy Development Based on LEAP Model - A Case Study of a Postindustrial City: Shenzhen China. Appl. Energ. 238, 876–886. doi:10.1016/j.apenergy.2019.01.162
Lee, C. T., Lim, J. S., Fan, Y. V., Liu, X., Fujiwara, T., and Klemeš, J. J. (2018). Enabling Low-Carbon Emissions for Sustainable Development in Asia and beyond. J. Clean. Prod. 176, 726–735. doi:10.1016/j.jclepro.2017.12.110
Li, X., and Yu, B. (2019). Peaking CO2 Emissions for China's Urban Passenger Transport Sector. Energy Policy 133, 110913. doi:10.1016/j.enpol.2019.110913
Li, W., Li, H., and Sun, S. (2015). China’s Low-Carbon Scenario Analysis of CO2 Mitigation Measures towards 2050 Using a Hybrid AIM/CGE Model. Energies 8 (5), 1–27. doi:10.3390/en8053529
Li, B., Han, S., Wang, Y., Wang, Y., Li, J., and Wang, Y. (2020). Feasibility Assessment of the Carbon Emissions Peak in China's Construction Industry: Factor Decomposition and Peak Forecast. Sci. Total Environ. 706, 135716. doi:10.1016/j.scitotenv.2019.135716
Liu, Y.-H., Liao, W.-Y., Lin, X.-F., Li, L., and Zeng, X.-l. (2017a). Assessment of Co-benefits of Vehicle Emission Reduction Measures for 2015-2020 in the Pearl River Delta Region, China. Environ. Pollut. 223, 62–72. doi:10.1016/j.envpol.2016.12.031
Liu, Y.-H., Liao, W.-Y., Li, L., Huang, Y.-T., and Xu, W.-J. (2017b). Vehicle Emission Trends in China's Guangdong Province from 1994 to 2014. Sci. Total Environ. 586, 512–521. doi:10.1016/j.scitotenv.2017.01.215
Liu, Y.-H., Liao, W.-Y., Li, L., Huang, Y.-T., Xu, W.-J., and Zeng, X.-L. (2019). Reduction Measures for Air Pollutants and Greenhouse Gas in the Transportation Sector: A Cost-Benefit Analysis. J. Clean. Prod. 207, 1023–1032. doi:10.1016/j.jclepro.2018.10.094
Lu, Z., Wu, B., Liu, X., and Wu, Y. (2019). “Greenway Planning of Guangdong Province,” in Proceedings of the Fábos Conference on Landscape and Greenway Planning, March 28–30, 2019. Amherst, MA: University of Massachusetts. doi:10.7275/27bq-vz84
Lu, C., Li, W., and Gao, S. (2020). Driving Determinants and Prospective Prediction Simulations on Carbon Emissions Peak for China's Heavy Chemical Industry. J. Clean. Prod. 251, 119642. doi:10.1016/j.jclepro.2019.119642
Mendonça, A. K. d. S., de Andrade Conradi Barni, G., Moro, M. F., Bornia, A. C., Kupek, E., and Fernandes, L. (2020). Hierarchical Modeling of the 50 Largest Economies to Verify the Impact of GDP, Population and Renewable Energy Generation in CO2 Emissions. Sustainable Prod. Consumption 22, 58–67. doi:10.1016/j.spc.2020.02.001
Nieves, J. A., Aristizábal, A. J., Dyner, I., Báez, O., and Ospina, D. H. (2019). Energy Demand and Greenhouse Gas Emissions Analysis in Colombia: A LEAP Model Application. Energy 169, 380–397. doi:10.1016/j.energy.2018.12.051
Pattanapongchai, A., and Limmeechokchai, B. (2011). CO2 Mitigation Model of Future Power Plants with Integrated Carbon Capture and Storage in Thailand. Int. J. Sustain. Energ. 30, 155–174. doi:10.1080/1478646x.2010.539690
Rahmadi, A., Aye, L., and Moore, G. (2013). The Feasibility and Implications for Conventional Liquid Fossil Fuel of the Indonesian Biofuel Target in 2025. Energy Policy 61, 12–21. doi:10.1016/j.enpol.2013.06.103
Raza, M. Y., and Lin, B. (2020). Decoupling and Mitigation Potential Analysis of CO2 Emissions from Pakistan's Transport Sector. Sci. Total Environ. 730, 139000. doi:10.1016/j.scitotenv.2020.139000
Selvakkumaran, S., and Limmeechokchai, B. (2015). Low Carbon Society Scenario Analysis of Transport Sector of an Emerging Economy-The AIM/Enduse Modelling Approach. Energy Policy 81, 199–214. doi:10.1016/j.enpol.2014.10.005
Shen, N. (2014). Research on Energy Demand and Emissions of Road Transport Field. Xian, China: Chang’an University.
Su, K., and Lee, C.-M. (2020). When Will China Achieve its Carbon Emission Peak? A Scenario Analysis Based on Optimal Control and the STIRPAT Model. Ecol. Indic. 112, 106138. doi:10.1016/j.ecolind.2020.106138
Wang, C., Cai, W., Lu, X., and Chen, J. (2007). CO2 Mitigation Scenarios in China's Road Transport Sector. Energ. Convers. Manage. 48 (7), 2110–2118. doi:10.1016/j.enconman.2006.12.022
Wang, P., Wang, C., Hu, Y., and Liu, Z. (2017). Analysis of Energy Consumption in Hunan Province (China) Using a LMDI Method Based LEAP Model. Energ. Proced. 142, 3160–3169. doi:10.1016/j.egypro.2017.12.384
Xing, J., Lu, X., Wang, S., Wang, T., and Hao, J. (2020). The Quest for Improved Air Quality May Push China to Continue its CO2 Reduction beyond the Paris Commitment. Proc. Natl. Acad. Sci. 117 (47), 29535–29542. doi:10.1073/pnas.2013297117
Yan, X., and Crookes, R. J. (2009). Reduction Potentials of Energy Demand and GHG Emissions in China's Road Transport Sector. Energy Policy 37 (2), 658–668. doi:10.1016/j.enpol.2008.10.008
Yan, Z. W. (2018). Measurement of China’s Traffic Carbon Emission and Spatial Econometric Analysis of its Influencing Factors. Dissertation. Beijing, China: Beijing Jiao tong University.
Keywords: CO2 emission, road and marine transportation sectors, emission peak, energy demand, cost-benefit analysis
Citation: Zhao Y, Ding H, Lin X, Li L, Liao W and Liu Y (2021) Carbon Emissions Peak in the Road and Marine Transportation Sectors in View of Cost-Benefit Analysis: A Case of Guangdong Province in China. Front. Environ. Sci. 9:754192. doi: 10.3389/fenvs.2021.754192
Received: 06 August 2021; Accepted: 27 September 2021;
Published: 18 October 2021.
Edited by:
Andries Hof, PBL Netherlands Environmental Assessment Agency, NetherlandsReviewed by:
Alex Oriel Godoy, Universidad del Desarrollo, ChileZongwei Liu, Tsinghua University, China
Copyright © 2021 Zhao, Ding, Lin, Li, Liao and Liu. This is an open-access article distributed under the terms of the Creative Commons Attribution License (CC BY). The use, distribution or reproduction in other forums is permitted, provided the original author(s) and the copyright owner(s) are credited and that the original publication in this journal is cited, in accordance with accepted academic practice. No use, distribution or reproduction is permitted which does not comply with these terms.
*Correspondence: Yonghong Liu, bGl1eWgzQG1haWwuc3lzdS5lZHUuY24=
 Yongming Zhao
 Hui Ding1,2
 Xiaofang Lin
 Yonghong Liu