
94% of researchers rate our articles as excellent or good
Learn more about the work of our research integrity team to safeguard the quality of each article we publish.
Find out more
ORIGINAL RESEARCH article
Front. Environ. Sci., 29 November 2021
Sec. Conservation and Restoration Ecology
Volume 9 - 2021 | https://doi.org/10.3389/fenvs.2021.749279
This article is part of the Research TopicConservation and Restoration of the Tropical Landscape: Governance and Multidisciplinary ApproachesView all 13 articles
 Suria Tarigan1,2*
 Neviaty P. Zamani3,2
 Damayanti Buchori4,2Rilus Kinseng5,2Yuli Suharnoto6Iskandar Z. Siregar7
Peatlands are especially important but fragile tropical landscapes. The importance of peatlands is owing to their ability to 1) sequester a considerable amount of terrestrial carbon, 2) store freshwater, and 3) regulate floods during the rainy season. Nowadays, extensive peatland degradation occurs because of peatland utilization for agriculture purposes, causing severe environmental consequences such as carbon emission, loss of biodiversity, risk of flooding, and peat fire. Meanwhile, local planners and decision makers tend to overlook the long-term strategic function of peatlands for carbon storage and hydrological regulation, preferring peatland utilization for short-term economic benefits. The objective of our study is to quantify the total ecosystem services (except biodiversity) of a tropical peatland landscape in various peat-utilization scenarios to help build awareness among local planners and decision makers on the strategic tradeoff between peatland utilization and restoration. Studies on the total ecosystem services in a tropical peatland landscape involving hydrological regulation are still rare. Based on the net present value calculation, provisioning services, carbon regulation, and hydrological regulation in our study area account for 19, 70, and 11% of the total ecosystem services, respectively. Based on uncertainty analysis, at any combination of the social cost of carbon emission (within a range of USD 52.7–USD 107.4) and discount rate (within a range of 5–10%), the enrichment of peatlands with paludiculture crops (e.g., jelutong) shows superior ecosystem services compared to other peatland-utilization scenarios. Conversely, planting peatlands with monoculture crops, which are associated with peatland drainage, shows a rapid decrease in the total ecosystem services. The fluvial carbon export in our study, which is often neglected in a peatland carbon budget, increases the estimate of the total carbon budget by 8%. Restoring undrained peatlands with paludiculture crops such as jelutong contributes positively to carbon sequestration and potentially reduces carbon emissions by 11%. These quantitative findings can help local planners and decision makers in understanding the tradeoff between the long-term benefits of peatland restoration and the short-term economic benefits of peatland utilization for monoculture crops.
Tropical peatlands have one of the largest carbon deposits in terrestrial landscape, contributing to 65% of the global peatland carbon storage (Moore et al., 2013; Hergoualc’h and Verchot, 2014; Hapsari et al., 2017). Peatlands are especially important but fragile tropical landscapes. The importance of peatlands is related to their ability to 1) hold 525 Gt of carbon, 2) store 10% of the global freshwater, 3) host biodiversity, and 4) regulate floods during the rainy season (Joosten and Clarke, 2002; Jaenicke et al., 2008; Yule, 2010; Page et al., 2011; Acreman and Holden, 2013; Gao et al., 2016).
Tropical peatlands have become increasingly an important global issue owing to their rapid utilization for agriculture purposes. Utilizing tropical peatlands for agricultural purposes necessitates draining. Draining peatlands creates aerobic conditions and exposes organic carbon stored for over a thousand years to decomposition, resulting in CO2 emissions and peat subsidence (Couwenberg et al., 2010; Yule, 2010; Page et al., 2011; Hooijer et al., 2012; Jauhiainen et al., 2016; Tonks et al., 2017; Moore et al., 2018). Upon peatland utilization for agriculture, the rate of emissions increases due to the drainage construction enhancing activities of aerobic microorganisms (Wösten et al., 2008; Turetsky et al., 2015; Miettinen et al., 2016).
Intensive peatland degradation caused by drainage and associated peat fires contributes to approximately 30% of the global carbon land forestry-based emissions (Couwenberg et al., 2010), whereas the other 70% is presumably associated with forest degradation and deforestation. Therefore, peatland restoration has become an essential global environmental policy issue (Ferre and Martin-Ortega, 2019), and tropical peatland management is an important focus for the UN decade of ecosystem restoration (UN Environment Programme, 2019). Peatland restoration and utilization are frequently in conflict in a landscape because peatland restoration requires waterlogged conditions, whereas peatland utilization for agriculture requires drainage. As soon as a peatland is used, its natural ecosystem changes, leading to emissions and threatening peatland sustainability (Evan et al., 2019).
Peatland restoration has become challenging because local planners and decision makers tend to undervalue the long-term strategic function of peatlands for carbon storage and hydrological regulations. Owing to a lack of understanding, they often opt for peatland utilization for short-term economic benefits. One way to improve the peatland stakeholders’ understanding of the tradeoff between peatland restoration and utilization is through ecosystem service assessment (Tallis et al., 2008; Fisher et al., 2009; Goldstein et al., 2012; Macfadyen et al., 2012; Albert et al., 2014; Cohen-Shacham et al., 2015). The ecosystem service concept has become important to communicate human–environment interactions (Busch et al., 2012; Paavola and Hubacek, 2013). Understanding which ecosystem services are provided and where they are provided in a peatland ecosystem will help understand synergies and tradeoffs in peatland management (Paavola et al., 2009; Bagstad et al., 2014). Normally, provisioning and regulating ecosystem services compete in a landscape (Tilman et al., 2002; Rodríguez et al., 2006). An ecosystem service tradeoff occurs when the provision of one service is maximized at the cost of reducing another service.
The ecosystem services of tropical peatlands have often been studied (Kimmel and Mander, 2010; Sumarga et al., 2015; Suwarno et al., 2016; Uda et al., 2017), but none of these studies sufficiently included the hydrological regulation of peatlands (Yule, 2010; Ferre and Martin-Ortega, 2019). A study on boreal peatlands includes biodiversity in an ecosystem service analysis and found a strong tradeoff between biodiversity and ecosystem services in drained peatlands (Juutinen et al., 2020). Despite the very rich biodiversity in our study site, we did not yet include the biodiversity component in the total ecosystem service calculation due to a complex interaction between biodiversity and ecosystem services (Johnson et al., 2012). The objective of our study is to value the provisioning, regulation, and hydrological ecosystem services of peatlands to help build awareness among local planners and decision makers on the strategic values of peatlands. Ecosystem services have been seen as a powerful tool to understand the socioecological and economic benefits of the environment and to consider them in spatial planning and environmental policy. The result of this study can be used for two purposes: 1) planning payment for ecosystem services for those who keep peatlands intact, and 2) assist local policymakers in deciding whether to use peatlands.
There are three neighboring provinces in Sumatra covering approximately 42% of the Indonesian peatlands, i.e., Riau, Jambi, and South Sumatra Provinces with the peatland areas of 4.8, 0.7, and 1.2 million ha, respectively. Parts of the peatlands in these provinces had been used for plantations. This study was conducted in South Sumatra Province, Indonesia (Figure 1). South Sumatra Province has a size of 9 million ha. In 2015, South Sumatra Province experienced severe peat fires. Our study site belongs to Merang-Ngirawan peat hydrological units. These units have been adopted by the Indonesian government as a landscape unit for peatland restoration, and there are hundreds of peat hydrological units throughout Indonesia (BRG, 2019). A peat hydrological unit is commonly characterized by the existence of a lens-shaped peat dome with a marked peat depth around the center of the dome. The radius of peat domes in Indonesia ranges from 5 to 10 km (Dommain et al., 2010). We included hydrological ecosystem services in our analysis and used a watershed as a boundary of the analysis. The area covered by the watershed boundary is 97,286 ha, which contains mainly secondary peat forests (Figure 1). These secondary forests had been logged over sometime in the past, and since then, the vegetation has been regenerating naturally.
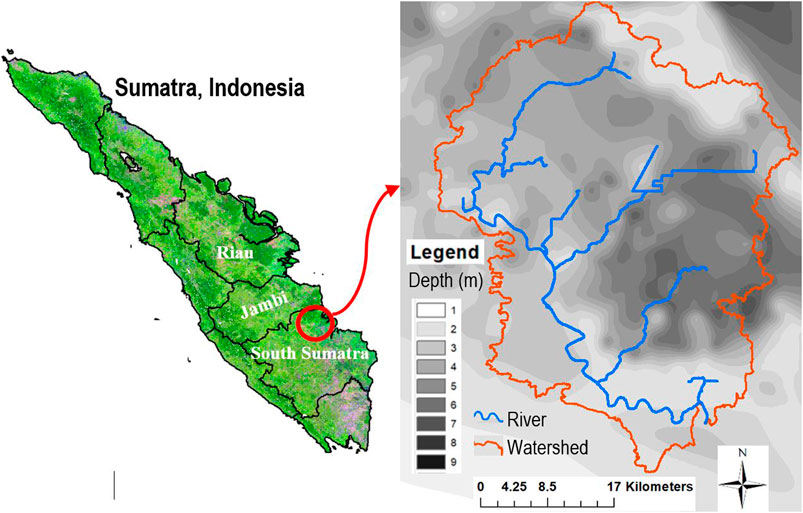
FIGURE 1. Study site in South Sumatra Province, Indonesia with a peat-depth map.
In our scenario, peatlands are classified as undisturbed when they are not drained. At the current condition, a part of the study area had been drained for acacia plantation, especially in the western and eastern parts of the watershed boundaries. Further peatland utilization in the study area is expected to occur in the future. We examined ecosystem services for three land-use scenarios (Figure 2). Scenario 1 is a proxy for the current condition. In Scenario 1, the peatland is assumed to be unutilized. In Scenario 2, the peatland cover is enriched with jelutong crops (Dyera sp.). These crops can sustainably be grown in undrained conditions and do not lead to soil subsidence (Sumarga et al., 2016). Jelutong crops (Dyera sp.) can be planted as an intercropping enriching the current land cover aiming to increase carbon sequestration. They produce latex that can be collected and be sold in the market. In contrast to commercial plantation crops such as oil palm and acacia, jelutong crop does not require drainage. Therefore, jelutong is considered a suitable crop for degraded peatlands (paludiculture crop), but the provisioning service obtained from jelutong latex is not as profitable as those from monoculture crops (e.g., oil palm). In Scenario 3, peat with a depth of less than 3 m was converted into an oil-palm plantation. Oil palm requires peatland draining to grow optimally. According to the Indonesian regulation, only peat with a depth of less than 3 m can be used for economic benefits. It corresponds to 45,620 ha of the watershed area being studied (Table 1).
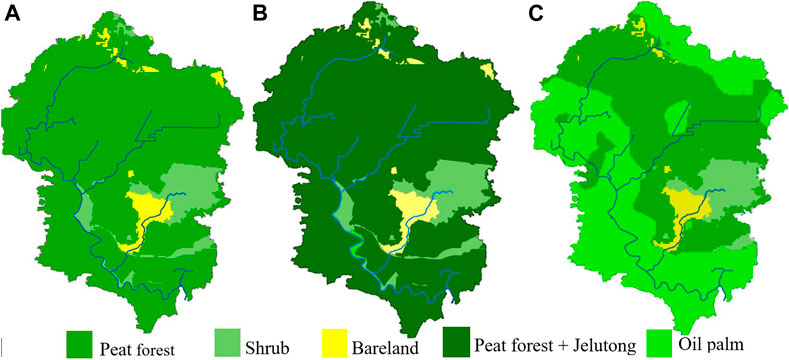
FIGURE 2. Schematic land-use type in (A) Scenario 1, (B) Scenario 2), and (C) Scenario 3
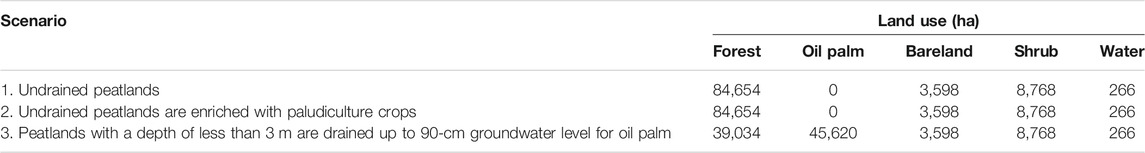
TABLE 1. Land-use proportion and drainage conditions for each scenario.
We analyzed provisioning and regulating ecosystem services for each scenario. Monetary benefits were assessed using net present value (NPV) with a discount rate of 10%. A period of 30 years was used for the NPV calculation, representing one cycle of oil-palm plantation. In 30 years, the oil-palm plantation must be replanted. When calculating the NPV for commodity provisioning services (e.g., oil palm and jelutong), we considered the time required from the beginning of utilization or restoration until their productive stage.
The monetary value of carbon sequestration and emission is based on the social cost of carbon emission. The social cost of carbon emission implies that if carbon is sequestered, there will be cost savings from not having to abate that carbon through other means. Based on a meta-analysis by Tol (2019), the social carbon cost was estimated at USD 106 t−1 C. We adopted the social cost of carbon value at USD 104.7 t−1 C (Interagency Working Group on Social Cost of Carbon, 2013; United States Environmental Protection Agency, 2013; Sumarga et al., 2016; Suwarno et al., 2016; Nordhaus, 2017).
The provisioning services in the study site comprise rattan collection, jelutong latex collection, and oil-palm production. When calculating the provisioning service, we consider the time required to reach a productive stage, e.g., jelutong and oil palm require 5 years after planting before it starts yielding.
The unit monetary values for commodities were derived from a study by Suwarno et al. (2016), i.e., 97.6, 98.8, and 812.8 USD ha−1 y−1 for rattan, jelutong latex, and oil-palm production, respectively.
Climate regulations include a) carbon sequestration due to land-use changes and b) carbon emission due to peatland drainage. Meanwhile, hydrological regulations comprise a) fluvial carbon export and b) a loss of land due to subsidence and subsequent flooding.
We used the Integrated Valuation of Ecosystem Services and Tradeoff (InVEST) model to quantify C sequestration processes related to land cover and land-cover changes (Kareiva et al., 2011). InVEST can model and map change in ecosystem services across a watershed caused by land cover and land-management changes. It can provide monetary evaluation, which is useful to assess tradeoffs between ecosystem services and compare changes in ecosystem services under different land uses and land-use management scenarios. InVEST has been used in various applications around the world (Tallis and Polasky, 2009).
The InVEST model requires the following input: 1) land-use map, 2) carbon-pool data for each land-use type, 3) discount rate, and 4) the social cost of carbon. Land-use data, peat depth, and distribution data were derived from Kelola Sendang Project (2018) and LPPM-IPB (2019). Carbon-pool data for different land uses, i.e., forest and oil palm, were derived from Kotowska et al. (2015); Khasanah et al. (2015) and Irwan and Purwanto (2020) (Table 2).
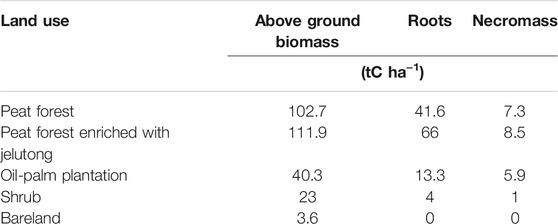
TABLE 2. Carbon-pool inputs for the InVEST model were derived from Kotowska et al. (2015), Khasanah et al. (2015), and Irwan and Purwanto (2020).
During a prolonged dry season, even water levels in pristine peatlands can drop below 40 cm (Takahashi et al., 2002; Hirano et al., 2012; Deshmukh et al., 2021). Therefore, carbon emissions can occur both in pristine and degraded peatlands.
Several studies have been conducted since 2005 to determine the fluxes of carbon in different land uses in tropical peatlands (Page et al., 2009; Couwenberg and Hooijer, 2013; Hergoualc’h and Verchot, 2011; Hirano et al., 2012). Couwenberg and Hooijer (2013) estimated the average carbon losses amount of 18 tC ha−1 y−1 for oil palm and acacia plantations without significant differences between plantation types. Jauhiainen et al. (2016) found the total emission was as high as 22 tC ha−1 y−1 in an acacia plantation (31–46 months old). Moreover, Comeau et al. (2013) reported the carbon fluxes of 28.4, 18.5, and 16.0 tC ha−1 y−1 in oil-palm plantation, degraded peat forest, and undisturbed peat forest, respectively, using a case study in Jambi, Sumatra, Indonesia. All these studies show marked differences in the emission rate despite having the same land-use categories. The difference may be attributable to the different water-table levels during sampling periods. A new study using paired eddy covariance estimated carbon emission rates of 4.2 and 10.8 tC ha−1 y−1 in undisturbed and disturbed peatlands, respectively, in South Sumatra (Desmukh et al., 2021). In our calculation, we used the GHG balance of CO2 and CH4 with the rate of 15.5 and 3.3, and 39.8 and 1.9 tCO2e ha−1 y−1 at undisturbed and degraded sites, respectively, derived from Deshmukh et al. (2021). The reason why we used the emission rate from this study are as follows: 1) it is the latest study conducted in Indonesia with relatively advanced equipment, i.e., eddy covariance tower, and 2) its study site (Riau Province) has the closest proximity to our study site (South Sumatra Province) compared to the other studies (see Figure 1).
The disturbance of hydrological stability in a peatland landscape either through vegetation-cover change or drainage can cause aerobic conditions, followed by a high decomposition rate of organic material in peatlands. This condition may lead to a higher production of dissolved organic carbon (DOC) and particulate organic carbon (POC) that is exported out of the peatland landscape through the fluvial system (Holden et al., 2004; Cowenberg et al., 2010). We require the river-discharge data and concentration of the total organic carbon (TOC) to calculate carbon export using fluvial systems. TOC is the sum of DOC and POC concentrations. We derived the TOC concentration from a study conducted in Indonesia by Moore et al. (2013). Based on Moore et al. (2013), the TOC concentration in fluvial systems is slightly higher in undisturbed (66.1 mg L−1) than disturbed (51.1 mg L−1) peatlands, but both have high TOC concentrations. The DOC from undisturbed peatlands is derived mainly from recent primary production (plant growth). Conversely, the DOC from disturbed peatlands consists mostly of much older (centuries to millennia) carbon from deep within the peat column.
Our study area does not have a discharge data record. We used the SWAT model version 2012 to simulate streamflow components. The SWAT model is a continuous model developed to simulate the impact of land cover/management changes on streamflow in a watershed with varying soil and land-use and management conditions over long periods (Neitsch et al., 2005; Arnold et al., 2012; Tarigan et al., 2016; Tarigan et al., 2017; Tarigan et al., 2020). Major model components include weather, hydrology, soil temperature and properties, plant growth, nutrients, and land management. The data source for the SWAT model in our study is described in Table 3.
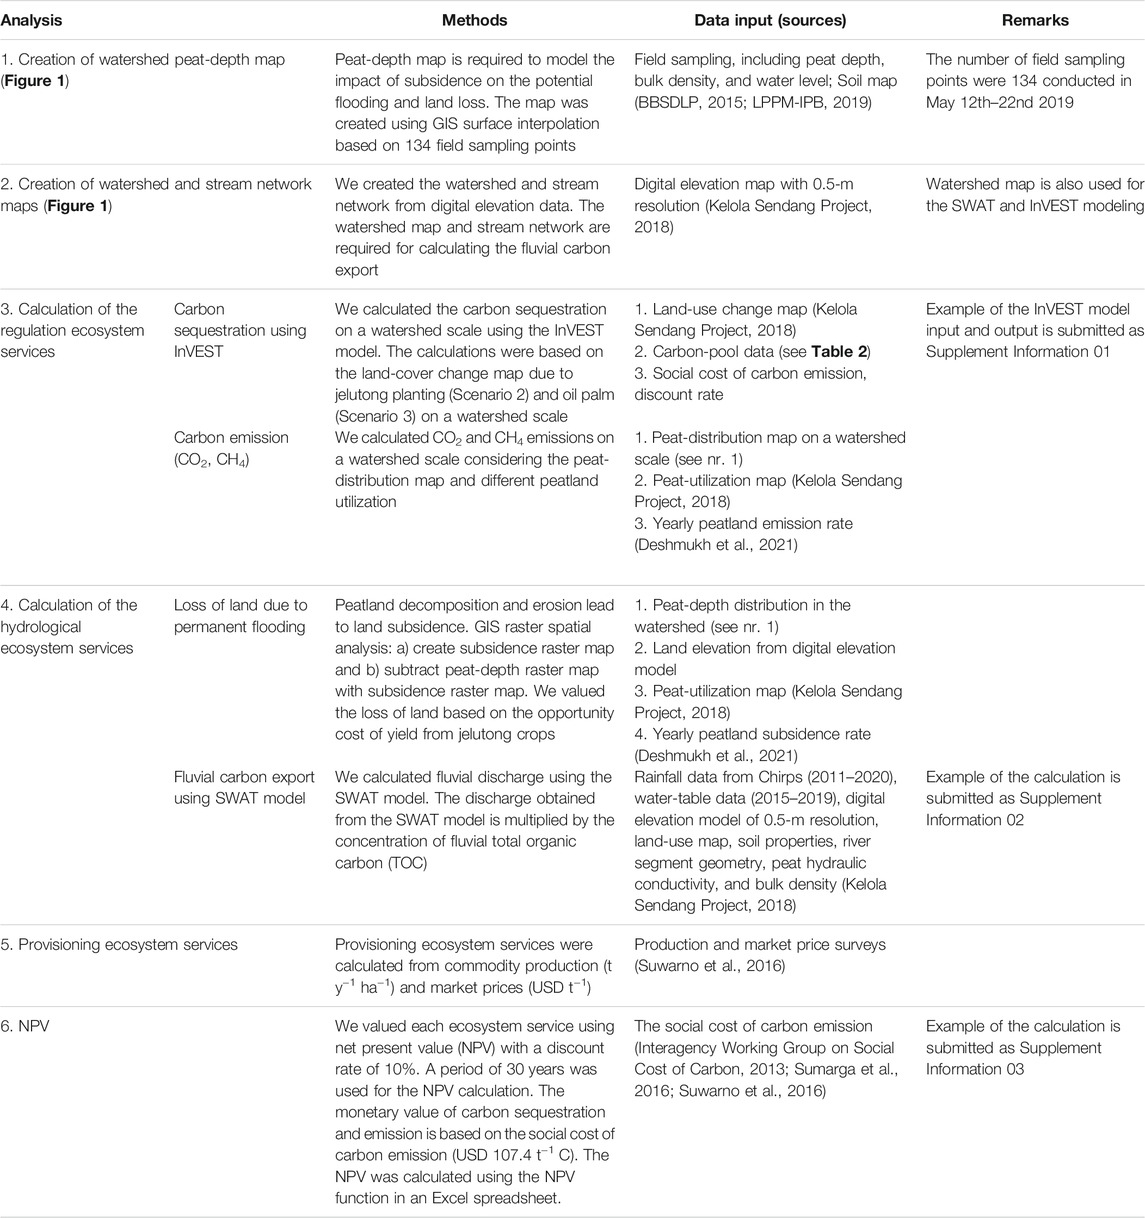
TABLE 3. Method and data description.
The SWAT model simulates the quantity (volume) and quality of water on a daily time step, which can be used for assessing ecosystem services such as water yield for irrigation and hydropower, nutrient export to the river, and peak flood (Neitsch et al., 2005). In the last decade, SWAT has been applied widely around the world to model the impact of land use/land management on streamflow and nutrient export (especially N, P, and C), with hundreds of published examples (www.swat.tamu.edu).
The SWAT model can be calibrated using hard data and/or soft data (Arnold et al., 2015). Hard data are defined as measured time-series data (e.g., time-series streamflow data at a catchment outlet) commonly used in regression-based calibration (Seibert and McDonnell, 2002; Abbaspour, 2012). According to Arnold et al. (2015), soft data are defined as a signature on individual processes within a budget that may not be directly measured within the study area. Examples of soft data include the estimates of the ET/precipitation ratio, streamflow/precipitation ratio, and average annual runoff coefficients. Our study area does not have time-series discharge data, and we cannot calibrate the model using such data. White et al. (2012) developed an evaluation tool (SWAT Check program) to derive soft-data indicators (e.g., ET/precipitation ratio and average annual runoff coefficients). In our study, we employed soft data for calibration, such as the streamflow/precipitation ratio and ET/precipitation ratio derived from the SWAT Check program. Because the goal of the SWAT model in our analysis is simply to find annual water balance, not to predict daily streamflow, we consider that the soft-data calibration is sufficient for our purpose.
Continuous peatland oxidation, compaction and shrinkage, and DOC fluvial export lead to land subsidence and the complete loss of peat layers (Hoojer et al., 2012; Ikkala et al., 2021). In the long term, the area will become relatively lower than its surroundings and potentially be permanently flooded after the rainy season. Large-scale subsidence studies conducted in oil-palm plantations on peatlands in South East Asia have reported that, at average water-table depths of 0.7 m, the subsidence rate is high at the beginning of peat draining, and after several years, it remains constant at approximately 5 cm y−1 (Hoojer et al., 2012). A relatively new study with a more rigorous method and comprehensive analysis reported land subsidence rates of 3.3 and 4.2 cm y−1 in undisturbed and degraded peatlands, respectively (Deshmukh et al., 2021).
To calculate the impact of land subsidence on the loss of land due to flooding on a watershed scale, we adopted the subsidence rate from the latest related study (Deshmukh et al., 2021). Besides, it is more rigorous, and its measurement site (Riau Province) is close to our study site (South Sumatra Province), which are both in Sumatra (Figure 1). The extent of the area flooded due to land subsidence was calculated using a peat contour depth in a raster form and digital elevation model with a 0.5-cm resolution, referenced to water levels in canals. We valued the loss of land based on the opportunity cost of using peatlands with paludiculture crops (e.g., jelutong crop).
The provisioning services in the study area are mainly contributed by three commodity production, i.e., rattan, jelutong resin, and oil palm. Rattan is collected from peat forest. The forest areas in Scenario 1 and 2 are similar, i.e., 84,654 ha. However, in Scenario 2, jelutong latex is collected in addition to rattan collection from a similar area of forest (84,654 ha). In Scenario 3, peat with a depth of less than 3 m inside the watershed boundary was converted to oil-palm plantation. This conversion corresponds to an area of 45,620 ha. In Scenario 3, rattan and jelutong latex were also collected from the area that was not converted into oil palm. Scenario 3 has the highest provisioning ecosystem services associated with oil-palm production (Table 4).
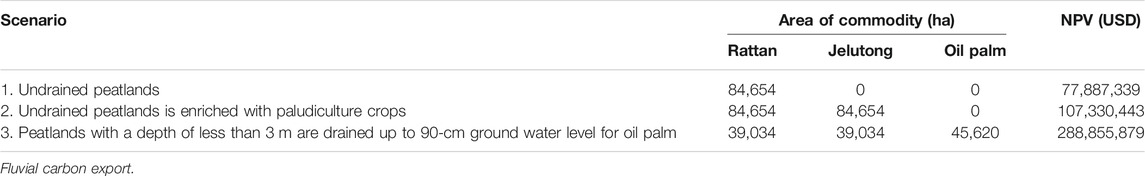
TABLE 4. Provisioning service in each scenario.
Based on the SWAT modeling, the annual discharge from the undisturbed and disturbed watersheds are 1,476 and 1,500 mm, respectively (Figure 3).
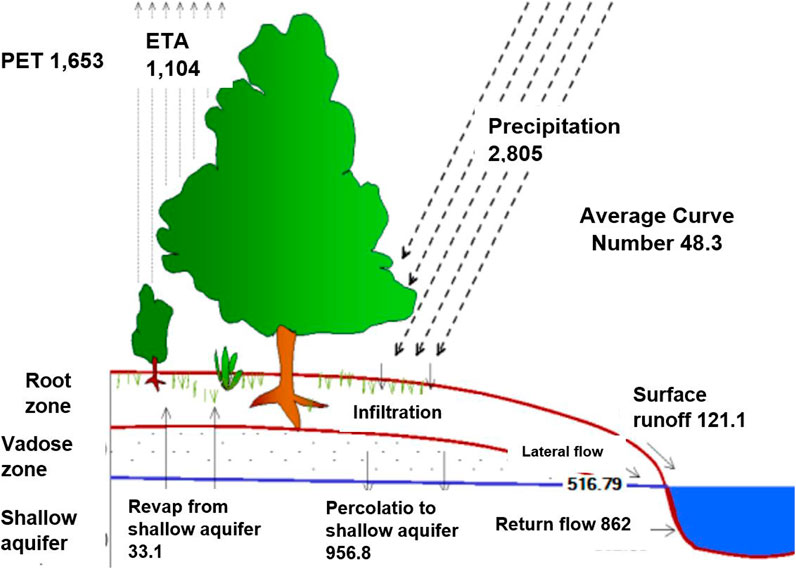
FIGURE 3. Example of SWAT simulation outputs from our study area showing PET (potential evapotranspiration = 1,653 mm), actual evapotranspiration and transpiration (1,104 mm), total discharge (1,500 mm) comprising surface runoff (121.13 mm), lateral flow (516,79 mm), and return flow (862.03 mm).
We used soft data to calibrate the SWAT simulation. We compared four soft-data parameters obtained from the SWAT simulation of the study area and a reference area (see Table 5). Reference values were obtained from a SWAT study in a neighboring province (Jambi, Figure 1) with a Nash–Sutcliffe efficiency value of 85%, categorized as a very good result (Tarigan et al., 2020). Based on the comparison of the four soft-data parameters, the SWAT output in our study area is considered to be in an accepted range (Table 5).
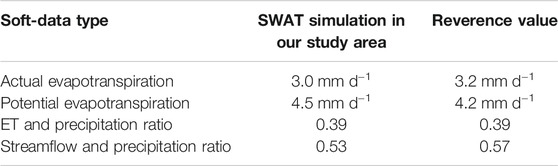
TABLE 5. Calibration and validation of SWAT simulation using soft data.
To calculate the fluvial carbon export, we multiply annual discharge with the TOC. Based on a study by Moore et al. (2013) in Central Kalimantan, Indonesia, the DOC from undisturbed peatlands is derived mainly from the recent decomposition of vegetation, whereas the DOC from disturbed peatlands mostly comes from older and deep peat deposits. This could be the reason why the DOC concentration in the fluvial system was slightly higher in undrained peatlands (Table 6). The fluvial carbon loss in our study, which is frequently neglected in the peatland carbon budget, increases the estimate of the carbon budget by 8%.
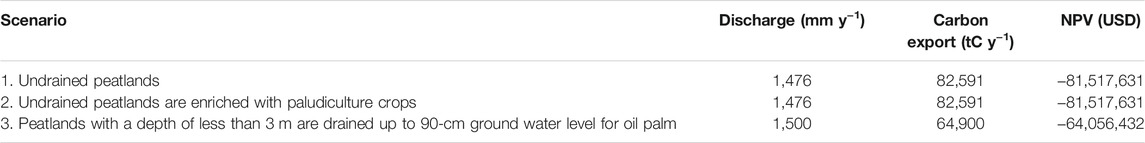
TABLE 6. Carbon emission due to fluvial carbon export.
Scenario 1 does not involve land use and land-cover change, and consequently, there is no carbon sequestration in Scenario 1. Carbon sequestration in Scenario 2 is associated with vegetation enrichment with jelutong (4 a). Moreover, carbon emission due to the land-use change in Scenario 3 is related to the conversion of peat forest into oil-palm plantations (4 b).
The restoration of undrained peatland with paludiculture crops such as jelutong contributes positively to carbon sequestration and potentially reduces carbon loss by 11%. The carbon sequestration or emission in Scenarios 2 and 3, 2,863,627 and −2,728,815 tC y−1, correspond to the NPV of USD 95, 777, 499 and USD −91, 268, 513, respectively (−indicates emission and + sequestration).
With the subsidence rates of 3.3 and 4.2 cm y−1 in undisturbed and disturbed peatlands, the peatland areas of 15,215 and 21,868 ha, respectively inside the watershed will irreversibly subside and be flooded in 30 years, (Figure 4C,D). The loss of land due to subsidence and flooding in undisturbed and disturbed peatlands corresponds to the loss of provisioning services in the future with an NPV of USD −2,703,911 and USD −3,886,239, respectively.
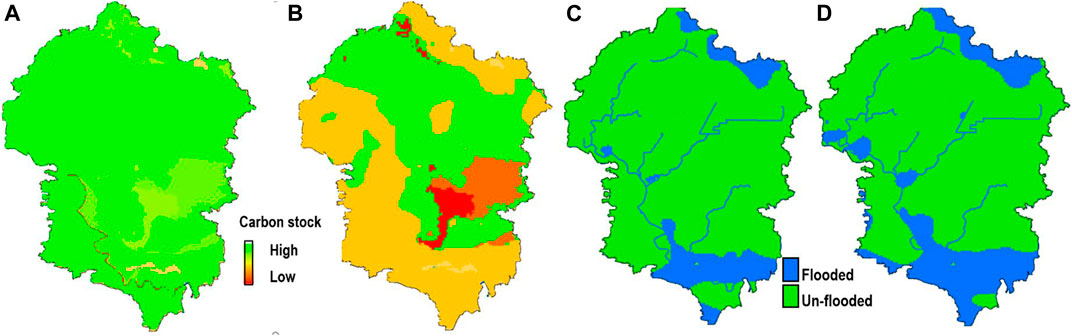
FIGURE 4. InVEST carbon sequestration map due to the conversion of peat forest (A) into oil palm (B); flooded area due to the land-use conversion from peat forest (C) into oil palm (D).
Carbon emission from tropical peatlands is mainly controlled by water-level fluctuation and drainage. The conversion of peat forest into monoculture plantations requires peatland draining. Peatland draining lowers the water table, triggering carbon emissions. However, during a prolonged dry season in Indonesia, the water table can also drop without drainage. Scenarios 1 and 2 do not involve peatland draining, and the drainage-related emissions in Scenarios 1 and 2 (undisturbed peatlands) are assumed to be similar, i.e., −431, 735 tC y−1, corresponding to a negative NPV of USD −426, 121, 452. Emissions in these scenarios are mainly due to the water-level drop during the dry season and methane emissions (Deshmukh et al., 2021). The conversion of the forest area into an oil-palm plantation in Scenario 3 occurs only in a watershed area with a peat depth of less than 3 m, corresponding to 37% of the total forest within the watershed boundary. However, the emission in Scenario 3 is high, i.e., −714, 579 tC y−1, corresponding to an NPV of USD −705, 288, 399.
The highest provisioning service is provided by Scenario 3, which is associated with oil-palm production. However, converting undisturbed peatlands into monoculture plantations (Scenario 3) contributes to the lowest value of the total ecosystem services in Scenario 3 (Figure 5). In Scenario 3, the social costs of carbon emissions exceed the private benefits from oil-palm plantations in peat. These findings highlight the tradeoff between peatland restoration and utilization, posing strong challenges to peatland management in Indonesia today. Peatland utilization for oil palm provides the highest benefit to the private sector but implies long-term disadvantages related to the social cost of carbon emission and loss of land due to subsidence.
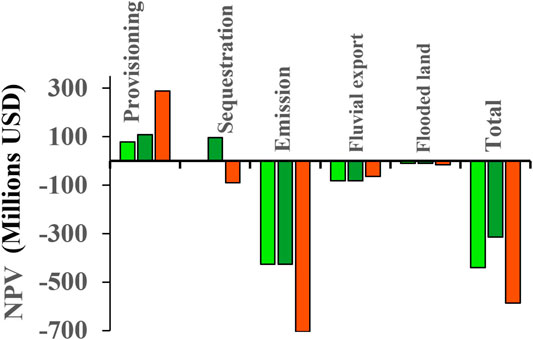
FIGURE 5. Total ecosystem service value (USD).
In our study area, the provisioning ecosystem service, carbon regulation ecosystem, and hydrological ecosystem service account for 19, 70, and 11% of the total ecosystem services, respectively.
Undrained peatlands still significantly contribute to carbon emissions, partly due to methane emissions and partly due to water-level fluctuation during the dry season. In all scenarios, including those without peatland drainage, carbon loss is dominated by peatland decomposition or oxidation processes. As a consequence, the total ecosystem service of all scenarios is strongly dominated by the negative contribution of carbon emission due to the peatland decomposition.
Utilizing peatlands with paludiculture crops (e.g., jelutong-Dyera sp.) increases carbon sequestration, which reduces the total carbon loss by 11% from peatlands. In contrast to commercial plantation crops, jelutong does not require drainage. Any peatland utilization involving draining will lead to high carbon loss. As demonstrated in our study, the land-use scenario associated with peatland drainage (e.g., monoculture plantation) rapidly reduces the total ecosystem service. Oil palm is the most profitable plantation crop in Indonesia, signifying the highest provision ecosystem service in our calculation (Figure 5), but it also increases carbon oxidation due to the associated peatland drainage, decreasing the total ecosystem services.
Translating the ecological impact of peatland restoration and utilization scenarios into ecosystem services provides a quantitative overview for local planners and decision makers to consider the environmental and economic benefits of alternative scenarios. However, the valuation of ecosystem service research can be highly uncertain. A valuation of nonmarketed goods (e.g., carbon cost) is an important source of uncertainty about ecosystem service analysis (Johnson et al., 2012). In our study, we find that there are three important sources of uncertainty: 1) calculating the NPV of ecosystem services involving the social cost of carbon emission and discount rate, 2) the SWAT model simulation, and 3) carbon sequestration simulation with the InVEST model.
The valuation of ecosystem services is commonly based on the social costs of carbon emission, i.e., USD 104.7 t−1 C and a discount rate of 10% (Sumarga et al., 2015; Suwarno et al., 2016; Tol, 2019). The main source of uncertainty in the social costs of carbon emission are the assumed abatement costs because of climate change and the selected discount rate. To assess the impact of these uncertainties on our analysis, we gradually varied the social cost of carbon emission from USD 104.7 t−1 C by 25% (USD 78.5) to 50% (USD 52.4) and then used different combinations of the discount rate, i.e., 5 and 10%, in our calculation (Figure 6).
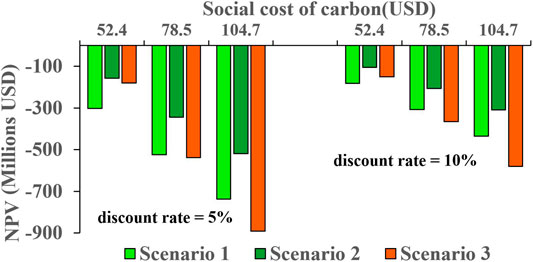
FIGURE 6. Uncertainty analysis of the social costs of carbon emission and discount rate in the calculation of the NPV of ecosystem services in peatlands.
From our calculation, we are certain that, at any combination of the social cost of carbon emission (within a range of USD 78.5–USD 107.4) and discount rate (within a range of 5–10%), Scenario 2 (planting peatland with paludiculture crops, e.g., jelutong) shows superior ecosystem services compared to other scenarios. Similarly, we are assured that, at any combination of the social cost of carbon emission (within a range of USD 78.5–USD 107.4) and discount rate (within a range of 5–10%), Scenario 3 (planting peatland with oil palm) show the lowest total ecosystem services.
Note that, in our analysis, we did not yet include an additional ecosystem service biodiversity in peatland, which will contribute positively to the total ecosystem services of Scenario 2. If we had included biodiversity ecosystem services in our analysis, the superiority of the total ecosystem services of peatland restoration (Scenario 2) over peatland utilization for monoculture crops (Scenario 3) would even be greater.
It is also important to note that, at any combination of the social cost of carbon emission (within a range of USD 52.7–USD 107.4) and discount rate (within a range 0f 5–10%), Scenario 1 (no peatland utilization) is not better than Scenario 2 (peatland utilization with paludiculture crop), signifying the benefit of peatland restoration using paludiculture crops.
A normal procedure to limit the uncertainty in the SWAT simulation model is through calibration and validation processes. There is a standardized procedure to calibrate and validate the SWAT model (Abbaspour, 2012). In our study, the SWAT model was calibrated using soft data due to the unavailability of sufficient time-series discharge data. The input parameter of the InVEST model is relatively simpler, involving a land-use change map, the carbon pools of different vegetation compartments, social cost of carbon emission, and discount rate. Unlike the SWAT model, the InVEST model is not a physical-based model, and there is no standardized procedure to calibrate the parameters. In our study, the carbon balance comprises 1) carbon sequestration, 2) fluvial carbon export, and 3) carbon emission due to oxidation. In any case, the total carbon budget calculation in our study area involving SWAT (Fluvial loss) and InVEST (Sequestration) account for 8 and 11%, respectively (Figure 7.), which is relatively smaller than the carbon calculation involving peatland oxidation due to peatland draining (81%).
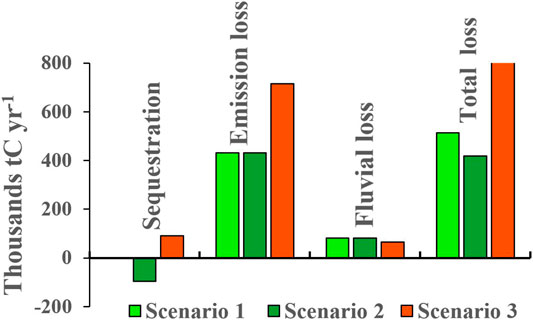
FIGURE 7. Components of the carbon loss in our study area.
In contrast to monoculture plantation crops, paludiculture crop (e.g., jelutong) does not require drainage. Any peatland utilization involving draining will lead to a high carbon loss. Consequently, any peatland utilization associated with peat drainage reduces the total ecosystem services strongly. Peatland utilization for oil palm provides the highest benefit to the private sector but it implies long-term disadvantages related to the social cost of carbon emission and loss of land due to subsidence owing to associated peatland drainage. Our results can help local planners and decision makers realize the superiority of the long-term benefits of peatland restoration over the short-term economic benefits of peatland utilization.
The original contributions presented in the study are included in the article/Supplementary Material, further inquiries can be directed to the corresponding author.
ST, NZ, DB, and RK designed the research. ST wrote the manuscript. NZ, DB, RK and IZS reviewed the manuscript. YS coordinated field data collection.
This study was funded by Ministry of Research and Technology/National Research and Innovation Agency, Indonesia (Kementerian Riset dan Teknologi/Badan Riset dan Inovasi Nasional) with contract Nr: 1/E1/KP.PTNBH/2021 dated March 08, 2021.
The authors declare that the research was conducted in the absence of any commercial or financial relationships that could be construed as a potential conflict of interest.
All claims expressed in this article are solely those of the authors and do not necessarily represent those of their affiliated organizations, or those of the publisher, the editors, and the reviewers. Any product that may be evaluated in this article, or claim that may be made by its manufacturer, is not guaranteed or endorsed by the publisher.
The Supplementary Material for this article can be found online at: https://www.frontiersin.org/articles/10.3389/fenvs.2021.749279/full#supplementary-material
Abbaspour, K. C. (2012). SWAT-CUP: SWAT Calibration and Uncertainty Programs - A User Manual. Duebendorf, Switzerland: Eawag–Swiss Federal Institute of Aquatic Science and Technology, 106.
Acreman, M., and Holden, J. (2013). How Wetlands Affect Floods. Wetlands 33, 773–786. doi:10.1007/s13157-013-0473-2
Albert, C., Aronson, J., Fürst, C., and Opdam, P. (2014). Integrating Ecosystem Services in Landscape Planning: Requirements, Approaches, and Impacts. Landscape Ecol. 29, 1277–1285. doi:10.1007/s10980-014-0085-0
Arnold, J. G., Youssef, M. A., Yen, H., White, M. J., Sheshukov, A. Y., Sadeghi, A. M., et al. (2015). Hydrological Processes and Model Representation: Impact of Soft Data on Calibration. Trans. ASABE 58 (6), 1637–1660. doi:10.13031/trans.58.10726
Bagstad, K. J., Villa, F., Batker, D., Harrison-Cox, J., Voigt, B., and Johnson, G. W. (2014). From Theoretical to Actual Ecosystem Services: Accounting for Beneficiaries and Spatial Flows to Map and Quantify Ecosystem Services. Ecol. Soc. 19 (2), 64. doi:10.5751/es-06523-190264
BBSDLP (2015), Sumberdaya Lahan Pertanian Indonesia: Luas, Penyebaran, Dan Potensi Ketersediaan. Balai Besar Litbang Sumberdaya Lahan Pertanian. Badan Litbang Pertanian. Jakarta: IAARD Press.
BRG (2019), Three Years of Peatland Restoration in Indonesia Report. Badan Restorasi Gambut Republik Indonesia (The Peatland Restoration Agency of the Republic of Indonesia).
Cohen-Shacham, E., Dayan, T., de Groot, R., Beltrame, C., Guillet, F., and Feitelson, E. (2015). Using the Ecosystem Services Concept to Analyse Stakeholder Involvement in Wetland Management. Wetlands Ecol. Manage. 23, 241–256. doi:10.1007/s11273-014-9375-1
Comeau, L. P., Hergoualc’h, K., Smith, J. U., and Verchot, L. (2013), Conversion of Intact Peat Swamp forest to Oil palm Plantation: Effects on Soil CO2 Fluxes in Jambi, Sumatra. Working Paper 110. Bogor, Indonesia: CIFOR.
Couwenberg, J., Dommain, R., and Joosten, H. (2010). Greenhouse Gas Fluxes from Tropical Peatlands in South-East Asia. Glob. Chang. Biol. 16, 1715–1732. doi:10.1111/j.1365-2486.2009.02016.x
Couwenberg, J., and Hooijer, A. (2013). Towards Robust Subsidence-Based Soil Carbon Emission Factors for Peat Soils in South-East Asia, with Special Reference to Oil palm Plantations. Mires Peat 12, 1–13. Article 01.
Deshmukh, C. S., Julius, D., Desai, A. R., Asyhari, A., Page, S. E., Nardi, N., et al. (2021). Conservation Slows Down Emission Increase from a Tropical Peatland in Indonesia. Nat. Geosci. 14, 484–490. doi:10.1038/s41561-021-00785-2
Dommain, R., Couwenberg, J., and Joosten, H. (2010). Hydrological Self-Regulation of Domed Peatlands in South-East Asia and Consequences for Conservation and Restoration. Mires Peat 6, 1–17. Article 05.
Ferre, M., and Martin-Ortega, J. (2019). A User Guide for Valuing the Benefits of Peatland Restoration. [report]. Leeds: University of Leeds.
Fisher, B., Turner, R. K., and Morling, P. (2009). Defining and Classifying Ecosystem Services for Decision Making. Ecol. Econ. 68, 643–653. doi:10.1016/j.ecolecon.2008.09.014
Gao, J., Holden, J., and Kirkby, M. (2016). The Impact of Land-Cover Change on Flood Peaks in Peatland Basins. Water Resour. Res. 52, 3477–3492. doi:10.1002/2015WR017667
Goldstein, J. H., Caldarone, G., Duarte, T. K., Ennaanay, D., Hannah, N., Mendoza, G., et al. (2012). Integrating Ecosystem-Service Trade-Off into Land-Use Decisions. Available at: http://www.pnas.org/cgi/doi/10.1073/pnas.1201040109.
Hapsari, K. A., Biagioni, S., Jennerjahn, T. C., Reimer, P. M., Saad, A., Achnopha, Y., et al. (2017). Environmental Dynamics and Carbon Accumulation Rate of a Tropical Peatland in Central Sumatra, Indonesia. Quat. Sci. Rev. 169, 173–187. doi:10.1016/j.quascirev.2017.05.026
Hergoualc'h, K., and Verchot, L. V. (2011). Stocks and Fluxes of Carbon Associated with Land Use Change in Southeast Asian Tropical Peatlands: A Review. Glob. Biogeochem. Cycles 25, a–n. doi:10.1029/2009GB003718
Hergoualc’h, K., and Verchot, L. V. (2014). Greenhouse Gas Emission Factors for Land Use and Land-Use Change in Southeast Asian Peatlands. Mitig. Adapt. Strateg. Glob. Change 19, 789–807.
Hirano, T., Segah, H., Kusin, K., Limin, S., Takahashi, H., and Osaki, M. (2012). Effects of Disturbances on the Carbon Balance of Tropical Peat Swamp Forests. Glob. Change Biol. 18, 3410–3422. doi:10.1111/j.1365-2486.2012.02793.x
Holden, J., Chapman, P. J., and Labadz, J. C. (2004). Artificial Drainage of Peatlands: Hydrological and Hydrochemical Process and Wetland Restoration. Prog. Phys. Geogr. Earth Environ. 28, 95–123. doi:10.1191/0309133304pp403ra
Hooijer, A., Page, S., Jauhiainen, J., Lee, W. A., Lu, X. X., Idris, A., et al. (2012). Subsidence and Carbon Loss in Drained Tropical Peatlands. Biogeosciences 9, 1053–1071. doi:10.5194/bg-9-1053-2012
Ikkala, L., Ronkanen, A.-K., Utriainen, O., Kløve, B., and Marttila, H. (2021). Peatland Subsidence Enhances Cultivated lowland Flood Risk. Soil Tillage Res. 212, 105078. doi:10.1016/j.still.2021.105078
Interagency Working Group on Social Cost of Carbon (2013). Technical Support Document: Technical Update of the Social Cost of Carbon for Regulatory Impact Analysis. United States Government.
Irawan, U. S., and Purwanto, E. (2020). Pengukuran dan Pendugaan Cadangan Karbon pada Ekosistem Hutan Gambut dan Mineral, Studi Kasus di Hutan Rawa Gambut Pematang Gadung dan Hutan Lindung Sungai Lesan, Kalimantan. Yayasan Tropenbos Indonesia. Bogor.
Jaenicke, J., Rieley, J. O., Mott, C., Kimman, P., and Siegert, F. (2008). Determination of the Amount of Carbon Stored in Indonesian Peatlands. Geoderma 147 (3Äì4), 151–158. doi:10.1016/j.geoderma.2008.08.008
Jauhiainen, J., Page, S, E., and Vasander, H. (2016). Greenhouse Gas Dynamics in Degraded and Restoredtropical Peatlands. Mires Peat 17, 1–12.
Arnold, J. G., Moriasi, D. N., Gassman, P. W., Abbaspour, K. C., White, M. J., Srinivasan, R., et al. (2012). SWAT: Model Use, Calibration, and Validation. Trans. ASABE 55 (4), 1491–1508. doi:10.13031/2013.42256
Johnson, K. A., Polasky, S., Nelson, E., and Pennington, D. (2012). Uncertainty in Ecosystem Services Valuation and Implications for Assessing Land Use Tradeoffs: An Agricultural Case Study in the Minnesota River Basin. Ecol. Econ. 79, 71–79. doi:10.1016/j.ecolecon.2012.04.020
Joosten, H., and Clarke, D. (2002). Wise Use of Mires and Peatlands. International Mire Conservation Group and International Peat Society.
Juutinen, A., Tolvanen, A., Saarimaa, M., Ojanen, P., Sarkkola, S., Ahtikoski, A., et al. (2020). Cost-effective Land-Use Options of Drained Peatlands- Integrated Biophysical-Economic Modeling Approach. Ecol. Econ. 175, 106704. doi:10.1016/j.ecolecon.2020.106704
Kelola Sendang Project (2018). South Sumatra Partnership for Landscape Management Support Project (KELOLA Sendang): Annual Report 2018.
Khasanah, N., van Noordwijk, M., and Ningsih, H. (20152015). Aboveground Carbon Stocks in Oil palm Plantations and the Threshold for Carbon-Neutral Vegetation Conversion on mineral Soils. Cogent Environ. Sci. 1, 1119964. doi:10.1080/23311843.2015.1119964
Kimmel, K., and Mander, Ü. (2010). Ecosystem Services of Peatlands: Implications for Restoration. Prog. Phys. Geogr. Earth Environ. 34 (4), 491–514. doi:10.1177/0309133310365595
Kotowska, M. M., Leuschner, C., Triadiati, T., Meriem, S., and Hertel, D. (2015). Quantifying above- and Below-Ground Biomass Carbon Loss with forest Conversion in Tropical Lowlands of Sumatra (Indonesia). Glob. Change Biol. 21, 3620–3634. doi:10.1111/gcb.12979
LPPM-IPB (2019). Assessing Below-Ground Carbon Stocks of Peatlands in Merang, Buring and Kepahyang Watersheds. Bogor, Indonesia: Institut Pertanian Bogor.
Macfadyen, S., Cunningham, S. A., Costamagna, A. C., and Schellhorn, N. A. (2012). Managing Ecosystem Services and Biodiversity Conservation in Agricultural Landscapes: Are the Solutions the Same? J. Appl. Ecol. 49, 690–694. doi:10.1111/j.1365-2664.2012.02132.x
Miettinen, J., Shi, C., and Liew, S. C. (2016). Land Cover Distribution in the Peatlands of Peninsular Malaysia, Sumatra and Borneo in 2015 with Changes since 1990. Glob. Ecol. Conservation 6, 67–78. doi:10.1016/j.gecco.2016.02.004
Moore, B. D., Kaur, G., Motavalli, P. P., Zurweller, B. A., and Svoma, B. M. (2018). Soil Greenhouse Gas Emissions from Agroforestry and Other Land Uses under Different Moisture Regimes in Lower Missouri River Floodplain Soils: A Laboratory Approach. Agroforest Syst. 92, 335–348. doi:10.1007/s10457-017-0083-8
Moore, S., Evans, C. D., Page, S. E., Garnett, M. H., Jones, T. G., Freeman, C., et al. (2013). Deep Instability of Deforested Tropical Peatlands Revealed by Fluvial Organic Carbon Fluxes. Nature 493, 660–663. doi:10.1038/nature11818
Neitsch, S. L., Arnold, J. G., Kiniry, J. R., and Williams, J. R. (2005). Soil and Water Assessment Theoretical Documentation Version 2005 Grassland, Soil and Water Research Laboratory Agricultural Research Service and Blackland Research Center. Texas Agricultural Experiment Station. http://swatmodel.tamu.edu/media/1292/SWAT2005theory.pdf.
Nordhaus, W. D. (2017). Revisiting the Social Cost of Carbon. Proc. Natl. Acad. Sci. USA 114 (7), 1518–1523. doi:10.1073/pnas.1609244114
Paavola, J., and Hubacek, K. (2013). Ecosystem Services, Governance, and Stakeholder Participation: An Introduction. E&S 18, 4–42. doi:10.5751/ES-06019-180442
Page, S. E., Rieley, J. O., and Banks, C. J. (2011). Global and Regional Importance of the Tropical Peatland Carbon Pool. Glob. Change Biol. 17, 798–818. doi:10.1111/j.1365-2486.2010.02279.x
Page, S., Hosciło, A., Wösten, H., Jauhiainen, J., Silvius, M., Rieley, J., et al. (2009). Restoration Ecology of lowland Tropical Peatlands in Southeast Asia: Current Knowledge and Future Research Directions. Ecosystems 12, 888–905. doi:10.1007/s10021-008-9216-2
P. Kareiva, H. Tallis, T. H. Ricketts, G. C. Daily, and S. Polasky (Editors) (2011). Natural Capital: Theoryand Practice of Mapping Ecosystem Services (New York: Oxford Univ. Press).
Rodríguez, J. P., Beard, T. D., Bennett, E. M., Cumming, G. S., Cork, S. J., Agard, J., et al. (2006). Trade-offs across Space, Time, and Ecosystem Services. Ecol. Soc. 11, 28. doi:10.5751/ES-01667-110128
Seibert, J., and McDonnell, J. J. (2002). “The Quest for an Improved Dialog between Modeler and Experimentalist,”. Calibration of Watershed Models. Editors Q. Duan, H. V. Gupta, S. Sorooshian, A. N. Rousseau, and R. Turcotte (Washington, D.C.: American Geophysical Union), Vol. 6.
Sumarga, E., Hein, L., Edens, B., and Suwarno, A. (2015). Mapping Monetary Values of Ecosystem Services in Support of Developing Ecosystem Accounts. Ecosystem Serv. 12, 71–83. doi:10.1016/j.ecoser.2015.02.009
Sumarga, E., Hein, L., Hooijer, A., and Vernimmen, R. (2016). Hydrological and Economic Effects of Oil palm Cultivation in Indonesian Peatlands. E&S 21, 2–52. doi:10.5751/ES-08490-210252
Suwarno, A., Hein, L., and Sumarga, E. (2016). Who Benefits from Ecosystem Services? A Case Study for Central Kalimantan, Indonesia. Environ. Manage. 57, 331–344. doi:10.1007/s00267-015-0623-9
Takahashi, H., Shimada, S., Ibie, B. I., Usup, A., Asmara, Y., and Limin, S. H. (2002). “Annual Changes of Water Table Balance and Drought index in a Tropical Peat Swamp forest of Central Kalimantan, Indonesia,” in Peatlands for People: Natural Resource Functions and Sustainable Development. Editors J. O. Rieley, S. E. Page, and B. Setiasi (Jakarta: BPPT and Indonesian Peat Association), 63–67.
Tallis, H., Kareiva, P., Marvier, M., and Chang, A. (2008). An Ecosystem Services Framework to Support Both Practical Conservation and Economic Development. Proc. Natl. Acad. Sci. U S A. 105 (45), 9457–9464. doi:10.1073/pnas.0705797105
Tallis, H., and Polasky, S. (2009). Mapping and Valuing Ecosystem Services as an Approach for Conservation and Natural-Resource Management. Ann. N. Y. Acad. Sci. 1162, 265–283. doi:10.1111/j.1749-6632.2009.04152.x
Tarigan, S. D., Sunarti, K., Wiegand, K., Dislich, C., Slamet, B., Heinonen, J., et al. (2016). Mitigation Options for Improving the Ecosystem Function of Water Flow Regulation in a Watershed with Rapid Expansion of Oil palm Plantations. Sustainability Water Qual. Ecol. 8, 4–13. doi:10.1016/j.swaqe.2016.05.001
Tarigan, S., Stiegler, C., Wiegand, K., Knohl, A., and Murtilaksono, K. (2020). Relative Contribution of Evapotranspiration and Soil Compaction to the Fluctuation of Catchment Discharge: Case Study from a Plantation Landscape. Hydrological Sci. J. 65 (7), 1239–1248. doi:10.1080/02626667.2020.1739287
Tarigan, S., Wiegand, K., and Slamet, B. (2017). Minimum forest Cover Required for Sustainable Water Flow Regulation of a Watershed: A Case Study in Jambi Province, Indonesia. Hydrol. Earth Syst. Sci. 22, 581–594. doi:10.5194/hess-22-581-2018
Tilman, D., Cassman, K. G., Matson, P. A., Naylor, R., and Polasky, S. (2002). Agricultural Sustainability and Intensive Production Practices. Nature 418, 671–677. doi:10.1038/nature01014
Tol, R. S. J. (2019). Social Cost of Carbon for (almost) Every Country. Working Paper Series 0219. Brighton: Dept. of Economics, University of Sussex Business School. doi:10.1016/j.eneco.2019.07.006
Tonks, A. J., Aplin, P., Beriro, D. J., Cooper, H., Evers, S., Vane, C. H., et al. (2017). Impacts of Conversion of Tropical Peat Swamp forest to Oil palm Plantation on Peat Organic Chemistry, Physical Properties and Carbon Stocks. Geoderma 289, 36–45. doi:10.1016/j.geoderma.2016.11.018
Turetsky, M. R., Benscoter, B., Page, S., Rein, G., Van Der Werf, G. R., and Watts, A. (2015). Global Vulnerability of Peatlands to Fire and Carbon Loss. Nat. Geosci 8, 11–14. doi:10.1038/ngeo2325
Uda, S. K., Hein, L., and Sumarga, E. (2017). Towards Sustainable Management of Indonesian Tropical Peatlands. Wetlands Ecol. Manage. 25, 683–701. doi:10.1007/s11273-017-9544-0
UN Environment Programme, (2019). New UN Decade on Ecosystem Restoration to Inspire Bold UN Environment Assembly Decisions. UN story. Available at: https://www.unep.org/news-and-stories/story/new-un-decade-ecosystem-restoration-inspire-bold-un-environment-assembly (Accessed November 14, 2021)
United States Environmental Protection Agency (2013). The Social Cost of Carbon. Washington, D.C., USA: United States Environmental Protection Agency. Available at: http://www.epa.gov/climatechange/EPAactivities/economics/scc.html.
White, M. J., Harmel, R. D., Arnold, J. G., and Williams, J. R. (2012). SWAT Check: A Screening Tool to Assist Users in the Identification of Potential Model Application Problems. J. Environ. Qual. 43 (1), 208–214. doi:10.2134/jeq2012.0039
Wösten, J. H. M., Clymans, E., Page, S. E., Rieley, J. O., and Limin, S. H. (2008). Peat-water Interrelationships in a Tropical Peatland Ecosystem in Southeast Asia. Catena 73 (2), 212–224. doi:10.1016/j.catena.2007.07.010
Keywords: carbon loss, monoculture crop, hydrological ecosystem services, paludiculture, fluvial carbon lost
Citation: Tarigan S, Zamani NP, Buchori D, Kinseng R, Suharnoto Y and Siregar IZ (2021) Peatlands Are More Beneficial if Conserved and Restored than Drained for Monoculture Crops. Front. Environ. Sci. 9:749279. doi: 10.3389/fenvs.2021.749279
Received: 29 July 2021; Accepted: 18 October 2021;
Published: 29 November 2021.
Edited by:
Binbin Li, Duke Kunshan University, ChinaReviewed by:
Matthew McCartney, International Water Management Institute, Sri LankaCopyright © 2021 Tarigan, Zamani, Buchori, Kinseng, Suharnoto and Siregar. This is an open-access article distributed under the terms of the Creative Commons Attribution License (CC BY). The use, distribution or reproduction in other forums is permitted, provided the original author(s) and the copyright owner(s) are credited and that the original publication in this journal is cited, in accordance with accepted academic practice. No use, distribution or reproduction is permitted which does not comply with these terms.
*Correspondence: Suria Tarigan, c2R0YXJpZ2FuQGFwcHMuaXBiLmFjLmlk
Disclaimer: All claims expressed in this article are solely those of the authors and do not necessarily represent those of their affiliated organizations, or those of the publisher, the editors and the reviewers. Any product that may be evaluated in this article or claim that may be made by its manufacturer is not guaranteed or endorsed by the publisher.
Research integrity at Frontiers
Learn more about the work of our research integrity team to safeguard the quality of each article we publish.