 WanCheng Xie
 Xing Li
- 1School of Economics and Business Administration, Chongqing University, Chongqing, China
- 2Institute of Finance and Economics Research, Shanghai University of Finance and Economics, Shanghai, China
Industrial agglomeration can promote economic growth through knowledge spillover and cooperation, while it may also bring serious pollution problems. Therefore, clarifying the relationship between industrial agglomeration and green development is of great significance to the realization of China’s sustainable development. In order to study the causal relationship between industrial agglomeration and green development, this paper first adopts the Overall Malquist Index method to more accurately measure the green development of Chinese cities characterized by environmental total factor productivity (ETFP). Subsequently, this paper uses the panel data of prefecture-level cities from 2003 to 2016 to study the causal relationship between industrial agglomeration and green development. We found that China’s current industrial agglomeration can promote green development. Mechanism analysis shows that industrial agglomeration can promote green development through improving the technological innovation, strengthening government intervention and optimizing the industrial structure. Finally, heterogeneity analysis shows that industrial agglomeration has a stronger role in promoting green development in areas where the economy is more developed, the degree of resource dependence is lower, and the degree of industrial agglomeration is higher. This paper not only provides theoretical and policy references for the research on industrial agglomeration and green development, but also provides experience reference for other developing countries.
Introduction
In the more than 40 years since the reform and opening up, China’s economy has continued to grow steadily and has achieved world-renowned achievements. However, China has long adopted an extensive economic growth model characterized by labor-intensive and resource-intensive production methods (Li et al., 2013), which has caused a lot of environmental pollution. According to the 2016 China Environmental Statistics Bulletin, the average PM2.5 concentration in 338 cities across the country is 39 μg/m3, which is far behind the World Health Organization (WHO) standard of 10 μg/m3. Among them, it exceeds the ambient air quality limit. There are as many as 254 cities, and only 9.1% of the 5118 groundwater monitoring points in prefecture-level cities have good water quality. With the shortage of resources and rising labor prices, resource and environmental constraints have become more serious. Therefore, growing the environment total factor productivity has also become key to China’s economic transformation and development. The report of the 19th National Congress of the Communist Party of China puts forward: “Take the supply-side structural reform as the main line, promote the quality of economic development, efficiency, and dynamics, grow total factor productivity, as well as promoting green development.” Under the wave of sustainable development, growing environmental total factor productivity (ETFP) and finally realizing city green development has become a strategic need for China’s sustainable economic development in the new era.
Industrial agglomeration reflects the spatial distribution characteristics of economic development, which is an important engine and growth pole to promote economic development. Meanwhile, industrial agglomeration refers to the economic phenomenon of large-scale aggregation of enterprises within a certain geographic space. There is a huge exchange of material and energy between enterprises and the surrounding environment during the process of industrial agglomeration, which improves the regional green development capacity and efficiency. As China enters a stage of high-quality development, economic development is gradually shifting from an extensive mode of pursuing growth speed to a mode of pursuing coordinated development between economic, social, and environmental benefits. The “13th Five-Year Plan” and “Made in China 2025” propose to accelerate the construction of ecological civilization and promote the development of green industries. The “Industrial Green Development Plan (2016-2020)” also proposes to improve the system and mechanism of agglomeration areas and the innovation of operation and management models, and to strengthen the comprehensive utilization of resources. Under the policy guidance of high-quality development, industrial agglomeration has also become one of the key factors in whether China can achieve green, sustainable and high-quality development.
There has been an abundance of research on the relevant theories of industrial agglomeration. Marshall externalities emphasize that industrial agglomeration has economies of scale (Dixit and Stiglitz, 1977) and various spillover effects (Fujita, 1989). The spatial concentration of elements is conducive to saving various costs and improving the efficiency of element use, thereby improving the utilization efficiency of energy and environmental elements. Glaser (2011) also pointed out through research that cities with high agglomeration are more energy-efficient and environmentally friendly than villages with low economic density. Second, the theory of Jacobs externalities puts forward the effect of diversified industry agglomeration, which mainly refers to the labor agglomeration effect, knowledge spillover effect, and the sharing effect of public infrastructure under the background of industrial diversification (Jacobs, 1969). Diversified agglomeration is conducive to strengthening the internal connections between enterprises and generating a benign green technology spillover effect, which is beneficial to the green development of cities. Finally, research related to new economic geography believes that technological externalities and technological spillovers between enterprises are the main driving forces of industrial agglomeration (Krugman, 1991), and the improvement of research and development efficiency of clean technology brought about by industrial agglomeration helps improvement of city environmental efficiency (Krugman, 1998).
Judging from the reality of China. For one thing, the eastern coastal areas with a high degree of industrial agglomeration have a higher level of economic development and relatively higher pollutant emissions, while the western areas with a relatively low degree of industrial agglomeration have the opposite. For another, as a key area of economic and trade outside the city, The China National Economic and Technological Development Zone is the main area of industrial agglomeration. So far, China has established 219 National Economic and Technological Development Zones. However, the scale of energy consumption and environmental pollution in these areas are also very serious. In view of the difference between theory and China’s actual situation, does industrial agglomeration lead to increased city energy consumption and environmental damage, or dose it facilitate city green development and environmental efficiency? Obviously, this requires strict normative analysis and robust empirical testing to provide a scientific answer to this question. As China enters the stage of high-quality development, studying the impact of industrial agglomeration on green development has very important theoretical and practical significance for China’s economic development goals and sustainable development. However, on the one hand, the existing literature needs to improve the accuracy of ETFP estimation at the city level (Afsharian and Ahn, 2015). On the other hand, there are few literatures that conduct rigorous empirical research on industrial agglomeration and green development at the city level in China.
In order to more accurately measure the ETFP at the city level in China, and conduct a rigorous empirical analysis of the causal relationship between industrial agglomeration and green development, this paper first adopts the Overall Malquist Index method proposed by Afsharian and Ahn (2015) to more accurately measure the green development of Chinese cities characterized by ETFP. Secondly, this paper uses the panel data of prefecture-level cities from 2003 to 2016 to study the causal relationship between industrial agglomeration and green development. We found that China’s current industrial agglomeration can promote green development. Mechanism analysis shows that industrial agglomeration can promote green development through improving the technological innovation, strengthening government intervention and optimizing the industrial structure. Finally, heterogeneity analysis shows that industrial agglomeration has a stronger role in promoting green development in areas where the economy is more developed, the degree of resource dependence is lower, and the degree of industrial agglomeration is higher. This paper not only provides theoretical and policy references for the research on industrial agglomeration and green development, but also provides experience reference for other developing countries.
This paper contributes to the existing literature in the following ways. First, to our knowledge, this paper is among the first time to use the Overall Malquist Index method to make a more accurate measurement of ETFP at the prefecture city level in China. Traditional literature usually uses parameters, SBM, global and other methods to measure ETFP at the provincial level in China. There are problems such as model setting errors and inflated feasible regions, which eventually lead to large errors in the calculation of ETFP (Pastor and Lovell, 2005; Zhang and Ye, 2015; Tang et al., 2017; Xia and Xu, 2020; Lu et al., 2021). We used the method of Afsharian and Ahn (2015) to make a more accurate calculation of ETFP at the city level in China on the basis of correcting the feasible range.
Secondly, we also conducted a more comprehensive and in-depth analysis of the causal relationship between industrial agglomeration and green development. Guo et al. (2020) only discusses the impact of industrial agglomeration in Northeast China on the efficiency of green development. More documents have individually studied the effects of industrial agglomeration on pollution and economy (e.g., Liu and Zhang, 2021; Tanaka and Managi, 2021), or the influencing factors and calculation methods of ETFP(e.g., Hoang and Coelli, 2011; Fang et al., 2021). Few documents have strictly empirically proved the causal relationship between industrial agglomeration and green development. We not only rigorously proved the causal relationship between industrial agglomeration and green development, but also further analyzed the impact mechanism and heterogeneity.
The remainder of this paper is organized as follows. Literature Review and Theoretical Mechanisms outlines the literature reviews and theoretical mechanisms. Methods and Data explains our estimation strategy, econometric models, data and variables. Empirical Results and Discussion presents the empirical results. Conclusion concludes.
Literature Review and Theoretical Mechanisms
Industrial Agglomeration and Environmental Total Factor Productivity
ETFP is also called green total factor productivity, eco-efficiency or green development efficiency, it measured the efficiency of production, which refers to generating more output with less input (capital, labor, energy) while emitting less pollution. The literature on ETFP mainly includes two aspects, namely the calculation of ETFP and the analysis of ETFP influencing factors. The literature for measuring ETFP mainly uses parametric and non-parametric methods, and calculates ETFP from the provincial level or the enterprise level. For example, Chen et al. (2016) used the analytic hierarchy process (AHP) and constructed an evaluation index system for China’s industrial green development. Feng et al. (2017) used a hybrid model and window analysis to measure the efficiency of China’s regional industrial green transformation. Li et al. (2016) used data envelopment analysis (DEA) to evaluate the sustainable development of resource-based cities. Cheng and Li (2018) used non-directional distance function (NDDF) and the meta-Frontier method to measure the green growth of China’s manufacturing industry. Hu et al. (2019) used ultra-relaxation Super-Slack Based Measure (SBM) function and the Global Malmquist-Luenberger (GML) index to calculate the environment total factor productivity of China’s manufacturing.
Other document mainly studies the constituent elements and influencing factors of ETFP. The literature related to this research mainly focuses on the impact of input-output factors, technological progress, and government regulations on ETFP. The literature’s research conclusions on the influence of input-output factors are relatively consistent, and they believed that factors such as resources and environment have a significant impact on ETFP. For example, excessive use of energy and excessive emissions of SO2, CO2, and COD are the main sources of environmental inefficiency (He et al., 2016), and the regional economic development level and ETFP show a strong positive correlation (Zhang and Ye, 2015). He et al. (2016) also found through specific calculations that provinces with higher environmental efficiency are concentrated in the eastern economically developed regions, while the overall ETFP growth level in the central and western regions is relatively low. Xia and Xu (2020) found through further research that the decrease in the output value of the secondary industry with high energy consumption and high pollution and the increase in the output value of the tertiary industry can effectively promote the growth of ETFP.
In terms of the impact of technological progress, Liu and Xin (2019) used provinces in the “One Belt, One Road” strategy as the research object and found that technological progress is the main reason for the increase in ETFP. Yan et al. (2020) further studied the technological innovation level of renewable energy at the provincial level and found that only after the urban economy has developed to a certain stage, technological progress can significantly promote the growth of ETFP. Feng et al. (2018) conducted a detailed analysis of China’s metallurgical industry and found that technological progress is the most important factor in promoting the growth of ETFP. Wang et al. (2020) further studied 34 industrial sectors in China and found that technological innovation is the main driving factor for the growth of ETFP. Part of the literature also analyzed from the perspective of enterprise R and D investment. For example, Chen and Golley (2014) conducted a study on 38 industrial sectors in China and found that R and D investment intensity has a significant role in promoting ETFP, while Xia and Xu (2020) found through further research that the higher the proportion of R and D investment in GDP, the more it can promote the growth of ETFP.
The literature on the research conclusions on the effect of government intervention is quite divergent. He et al. (2016) believe that the government’s environmental management capacity and ETFP show a negative correlation; Zhang and Jiang (2019) found through empirical research that the ETFP of key environmental protection cities in China is lower than that of non-key protection cities, while the Porter Effect of government environmental regulations still exists. Compared with “command-and-control” environmental regulatory policies, market-based environmental regulatory policies can exert a greater Porter Effect and have a greater role in promoting ETFP (Xie et al., 2017). Wang et al. (2019) found through further research that government environmental regulation can significantly promote the growth of ETFP under appropriate intensity, but excessive environmental regulation will offset the innovation effect, thereby inhibiting ETFP. Liu et al. (2018) also found an inverted U-shaped relationship between the intensity of government environmental regulations and environmental efficiency. Jin et al. (2020) and Song et al. (2018) found an inverted U-shaped relationship in the relationship between the intensity of intergovernmental competition, fiscal decentralization, and ETFP.
In the literature related to the influence of industrial agglomeration on ETFP, Chang and Oxley (2009) found that industrial agglomeration can promote ETFP through innovation spillover. Cheng and Jin (2020) found that the industrial complementarity in industrial agglomeration has the strongest promotion effect on ETFP. Lu et al. (2021) believes that the common agglomeration of producer services and manufacturing has significantly promoted the improvement of regional GTFP and has a positive spatial spillover effect on surrounding areas. Xie et al. (2019) thought that the professional agglomeration of producer services not only increases the GTFP of cities and surrounding cities, but also weakens the promotion of GTFP in cities and surrounding cities by the professional agglomeration of producer services. Guo et al. (2020) studied the industrial agglomeration and green development efficiency in Northeast China, found that there is a u-shaped relationship between them, and analyzed the impact of economic development, environmental regulation, and other factors on ETFP.
Mechanism Analysis
This paper uses the industry clusters as the carrier to explore the facilitation of China’s industrial agglomeration on the ETFP in prefecture-level cities. Three paths have been constructed: technological innovation, government intervention and industrial structure. It may be through economies of scale, knowledge spillover effects, technological innovation effects, industrial upgrading effects, industrial transformation effects, and resource sharing effects on city economic performance, social performance, and environmental performance. Thereby accelerating environmental innovation, improving energy efficiency, and promoting the improvement of the production efficiency of city environmental total factors. The specific mechanism diagram (Figure 1) and the mechanism analysis are as follows.
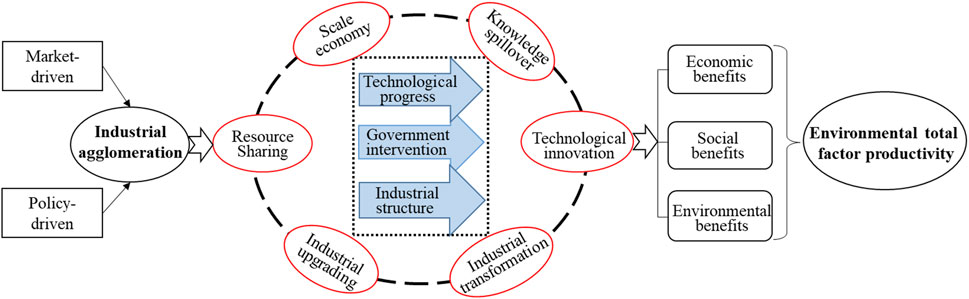
FIGURE 1. Mechanism of industrial agglomeration influencing environmental total factor productivity.
First, industrial agglomeration has a positive impact on innovation through the Marshall externalities agglomerated within the industry (Arrow, 1971; Romer, 1986). Practitioners through face-to-face technical exchanges and information interactions in agglomeration areas are conducive to the spillover of environmental protection knowledge and green technology among enterprises. Second, industrial agglomeration is conducive to the interaction, sharing, and diffusion of energy-saving information and clean technology among enterprises (Wang et al., 2021; Xie et al., 2019). At the same time, cross-industry agglomeration activities are conducive to promoting the deep integration of information and communication technologies such as the Internet and big data with industrial industries, thereby promoting technological innovation. For example, Baptista and Swann (1998) found that the British manufacturing industry has a higher level of agglomeration and a higher level of innovation. In addition, industrial agglomeration strengthens the degree of competition among enterprises. Industrial agglomeration encourages enterprises not only to carry out technological and process innovation but also to learn from each other in the fields of knowledge and technology, thereby giving birth to new ideas and knowledge, accelerating the progress of low-carbon and environmentally friendly technologies, and increasing the green productivity of the industry. In summary, through the spillover effects of clean technology and knowledge, industrial agglomeration is conducive to improving the level of regional technological progress (especially the promotion of environmentally friendly innovative technologies), which can increase the ETFP (Xie et al., 2020). Therefore, this paper proposes the following hypothesis:
Hypothesis 1: Industrial agglomeration could grow the ETFP through the improvement of technological level.
Second, industrial agglomeration can influence ETFP through government intervention. The increase in production efficiency brought about by industrial agglomeration has significantly improved the income and living standards of residents, as well as the ecological and environmental problems that have begun to become prominent. Therefore, the government will raise environmental standards for industrial production, driving industrial agglomeration to gradually transform into green ecological agglomeration. Government intervention is mainly through the formulation of relevant laws and regulations, environmental subsidies, and other means to achieve city governance to facilitate pollution control (Ghazouani et al., 2021; Song et al., 2019). On the one hand, environmental regulations are considered to be the most effective way to solve environmental pollution. The government establishes an active intervention and supervision mechanism by formulating a series of corresponding environmental protection policies and regulations. For example, the government uses fines and shuts down high-polluting enterprises to increase the cost of environmental pollution by enterprises (Guo and Wang, 2018), thereby improving environmental pollution (Shen and Wang, 2018). On the other hand, the government encourages enterprises to introduce advanced production technologies through direct financial compensation for the R and D and application of green technology innovations in enterprises (Cheng et al., 2017), thereby enabling enterprises in agglomeration areas to achieve a “win-win” (Porter and Linde, 1995). In summary, this paper proposes the following hypothesis:
Hypothesis 2: Industrial agglomeration can facilitate the growth of ETFP by strengthening government intervention.
Third, industrial agglomeration can promote ETFP by optimizing the industrial structure. Economic structure and economic activities can have an important impact on environmental pollution and carbon emissions (Ikram et al., 2021; Sharma et al., 2021), and further affect environmental sustainability (Rafique et al., 2021). industrial agglomeration causes enterprises to obtain innovation monopoly profits, and various departments will compete to increase R and D investment to improve production efficiency and production technology level, thereby promoting the adjustment of industrial structure from the supply side. At the same time, industrial diversification and agglomeration optimize the structure of input factors through horizontal and vertical cooperation between industrial chains, thereby promoting the optimization and upgrading of industrial structure. Optimizing the industrial structure can reduce energy consumption (Yu et al., 2018) and reduce pollutant emissions (Cole et al., 2005), thus promoting the improvement of ETFP. Based on this, this paper proposes the following hypothesis:
Hypothesis 3: Industrial agglomeration is conducive to the optimization and upgrading of the industrial structure, thereby promoting ETFP.
Methods and Data
Methods
In order to study the causal effect between industrial agglomeration and ETFP, we set up the following model based on the method of Lin et al. (2011), Li et al. (2021), Hu et al. (2015) and Liu and Zhang (2021):
where i represents city, t represents year, ETFP represents the environmental total factor productivity growth, Agg represents the degree of industrial agglomeration, X represents control variables, γi represents city fixed effect, σt represents year fixed effect, andεit represents the random error term.
Variables and Data
Dependent Variable
The current measurement methods for ETFP mainly include parameter methods and non-parametric method represented by data envelope. Compared with parametric methods, data envelopment analysis does not need to set the function form and put forward various hypotheses. At the same time, it can also build in weights through the optimization method according to the characteristics of the data itself, which can avoid the interference of people’s subjective will to the greatest extent possible. In the data envelopment analysis method, the Malmquist total factor productivity index analysis method can analysis the changes in productivity, technical efficiency, and technological progress on panel data containing multiple time points. It was not until Pastor and Lovell (2005) proposed the global reference Malmquist index that the four assumptions were met simultaneously. The global reference Malmquist index is based on the sum of each period as the reference set, namely
where T represents each period and
Taking Figure 2 as an example, the subscripts 1 and 2 respectively represent two periods that occur in sequence. The points in period 1 form the front surface of OA1B1C1, and the points in period 2 form the front surface of OA2B2. The global reference proposed by Pastor and Lovell (2005) is to combine the points of all periods to form a Frontier, which is OA1A2B1C1 in Figure 1. However, Afsharian and Ahn (2015) posited that the technological Frontier of the global reference violates the underlying assumption that the same Frontier technology remains unchanged. For example, in the global reference, both A1 and A2 are on the leading edge. However, due to the different periods, the technologies of A1 and A2 are also different. Therefore, it is impossible to construct the same front surface with both. Forced construction will inflate the real production feasible set (such as A1A2M and A2B1N), which will lead to bias in efficiency calculations.
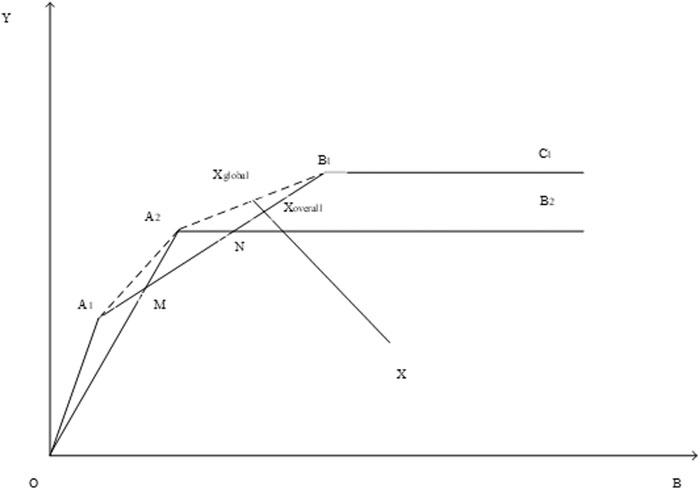
FIGURE 2. Global PPS and overall PPS.
To solve the problem of efficiency bias caused by the inflated production feasible set, and to avoid the problem of no feasible solution for inter-period DDF, we refer to the practice of Afsharian and Ahn (2015), and improved on the basis of Pastor and Lovell (2005). We define the overall production feasible set under environmental constraints as:
where T represents each period and PPSo represents the union of production feasible sets in all periods. The production feasible set is calibrated from OA1A2B1C1 to O1A1MA2NB1C1, eliminating the two production infeasible parts of A1A2M and A1B1N. Under the definition of global reference in Figure 2, the projection of point X on the technological Frontier is Xglobal on A2B1, which is not on the production feasible set. After calibrating the production feasible set, its projection on the technological Frontier surface is the Xoverall point on the B1N, which excludes the infeasible part of production in any period, makes the PPS conform to the actual experience, and eliminates the bias in the process of calculating the efficiency value.
Under the constraints of the overall production feasible set in this part, and combined with the approach of Zhou et al. (2012), the non-angle and non-radial DDF based on the overall technology under environmental constraints is defined as:
where
where
Under the DEA framework, the environmental TFP growth index is calculated based on environmental efficiency. The most common forms are Malmquist-Luenberger productivity index and Luenberger productivity index. Among them, the Malmquist-Luenberger productivity index is a ratio form, usually combined with the radial efficiency measurement model, while the additive form of Luenberger productivity is more compatible with the non-radial efficiency measurement model that is, also an additive form (Zhang and Choi, 2014). According to the Luenberger productivity index form, based on the overall PPS and non-angle and non-radial DDF, the environmental TFP growth (ETFP) between period t and t + 1 is defined as:
In general, the advantage of the Overall Malmquist Index method proposed by Afsharian and Ahn (2015) for ETFP calculation is that this method corrects the problem of false increase in the feasible range compared with the traditional calculation method, so that ETFP can be more accurately calculated (Jia et al., 2021; Xu et al., 2021; Zhao et al., 2018; Zhu et al., 2021).
Independent Variable
Agglomeration can be understood as the relative concentration of a certain element in a region. Common indicators used in existing studies to measure the degree of agglomeration of economic variables include Herfindahl index, Gini index, location entropy index, and Ellision-Glaeser index (Kamal and Sundaram, 2019). Among them, Herfindahl index, Gini index, and Ellision-Glaeser index can only measure the degree of agglomeration of elements at a global level but cannot effectively observe the degree of agglomeration of elements within each region, so they are not suitable for this study. The location entropy index can measure the spatial distribution of elements in a certain area, and is suitable as an effective index to measure the spatial distribution and agglomeration level of the research object, and it is comparable between different geographical units within the area (O’Donoghue and Gleave, 2004), so as to meet the needs of this research. Therefore, we draw on the idea of location entropy index and follow the method of Liu et al. (2021) and Mo et al. (2020) to construct the ratio of city secondary industry employees to the national secondary industry employees. This industry agglomeration index measures the degree of industrial agglomeration in each city, and its specific calculation formula is as follows:
where
Mechanism Variables
(1) Technological progress (Tec). Regional industrial gatherings have a significant impact on the level of technological progress, and industrial gatherings produce knowledge and technology spillover effects, which are conducive to the integration of innovative elements, saving innovation costs, and improving innovation performance to facilitate regional technological innovation (Amiti, 2005). We use the number of patents related to green innovation in each prefecture-level city to indicate the level of technological progress in the region.
(2) Government intervention (Gov). Industrial agglomeration will also affect government intervention in industries to a certain extent. As industrial agglomeration facilitates the continuous expansion of production scale, this may cause problems such as over-utilization of resources and environmental pollution, forcing the government to adopt relevant legal regulations and subsidies to improve resource efficiency and alleviate environmental pollution and other issues (Shen and Wang, 2018). We measure the degree of government intervention by using the ratio of fiscal expenditure to the city’s GDP after deducting education and science.
(3) Industrial structure (Ins). On the one hand, industrial agglomeration reduces enterprise costs through economies of scale (Venables, 1996). On the other hand, it also provides pressure and motivation for enterprise technological innovation. Therefore, industrial agglomeration is an important driving force for the optimization and upgrading of the regional industrial structure. We use the ratio of the number of employees in the secondary industry to the number of employees in the tertiary industry to express.
Control Variables
(1) Foreign direct investment (Fdi). Existing research has two main views on the impact of foreign direct investment on environmental pollution: the “pollution refuge” hypothesis holds that foreign direct investment increases environmental pollution in the host country (Cole et al., 2005). The “pollution halo” hypothesis (Balsalobre-Lorente et al., 2019) pointed out that the adoption of standardized management and production technologies by foreign-funded enterprises can help promote the construction of environmental management systems by domestic enterprises through spillover effects, and this would produce a pollution halo effect and improves environmental quality. Therefore, the sign of the coefficient of foreign direct investment is uncertain. Without loss of generality, we use the proportion of foreign direct investment in the city’s GDP to measure it.
(2) Population density (Pop). Population density reflects the growth rate of economic development and the agglomeration level of regional alliances, and its impact on industrial pollution agglomeration is unclear. On the one hand, areas with higher population densities usually have more frequent economic activities, which may generate more pollution emissions (Li et al., 2019). On the other hand, human capital is a key driving force for sustainable economic growth. The higher the population density, the higher the level of human capital, which may be beneficial to energy conservation and emission reduction (Shao et al., 2011). Without loss of generality, we use the population per square kilometers to measure it.
(3) Weather factors. Meteorological factors can directly affect the undesired output of economic activities. For example, the occurrence of temperature inversion can alleviate air pollution (Jans et al., 2018; Sager, 2019). Wind speed, rainfall, temperature, etc. can also affect the concentration of air pollutants such as PM2.5. Therefore, to more accurately measure the impact of industrial agglomeration on ETFP, we further controlled meteorological factors including temperature (Tem), humidity (Hum), precipitation (Pre), and sunshine (Sun).
(4) Descriptive statistics of data. Based on the selection of the above variables, we have performed descriptive statistics on the data, and the results are reported in Table 1. Among them, the meteorological data comes from the China Meteorological Administration, and the patent data comes from the query of the patent cloud database. The remaining variables are from the China City Statistical Yearbook.
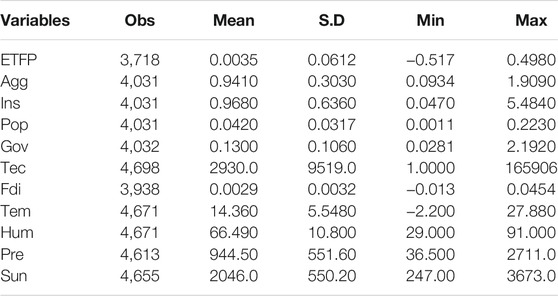
TABLE 1. Descriptive statistics.
Empirical Results and Discussion
Baseline Results
First, we use the baseline regression in Table 2 to study causal relationship between industrial agglomeration and ETFP. Column (1) reports the results of POOL-OLS. We find that the impact of industrial agglomeration on ETFP is not significant without considering the fixed effects of cities and time. Columns (2) to (5) further control multiple effects. Specifically, column (2) controls city fixed effects and year fixed effects based on column (1). Columns (3) and (4) control macroeconomic variables and meteorological factors on the basis of the column (2), respectively. Column (5) controls macroeconomic variables, meteorological factors, city fixed effects, and year fixed effects.
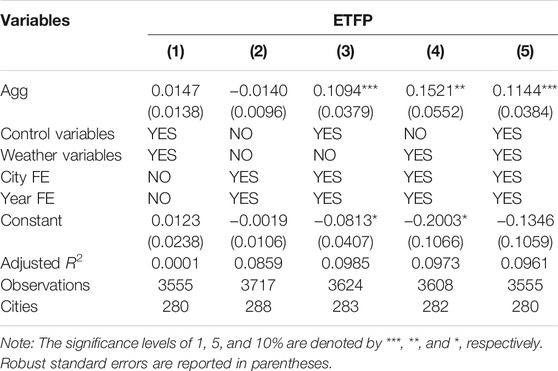
TABLE 2. Baseline regression.
We can find from column (5) that, after considering all control variables and fixed effects, industrial agglomeration can significantly facilitate ETFP. Specifically, on average, for each additional industrial agglomeration (10.63%), the ETFP increases by 11.44% (3.32%). This corresponds to an elasticity between industrial agglomeration and ETFP of 31.23%. Also, we can convert the magnitude using standard deviations. The estimates indicate that a one standard deviation increase in industrial agglomeration increases ETFP by 0.023 standard deviations.
Mechanism Analysis
We investigated the three mechanisms of industrial agglomeration affecting ETFP, and Table 3 reports the estimated results. Column (1) shows the impact of industrial agglomeration on technological innovation. We find that industrial agglomeration can significantly facilitate regional technological innovation levels related to green development. Specifically, due to the knowledge spillover effect that exists in the process of industrial agglomeration, industrial agglomeration can increase the level of technological innovation by 47.96% at the 5% significance level. Industrial agglomeration strengthens the upstream and downstream linkages of industries, which is conducive to enhancing input-output linkages, expanding knowledge spillover effects, and improving the availability of human capital, thereby reducing the cost of technological knowledge dissemination, generating technological innovation effects, improving the level of green technological innovation, and promoting ETFP. This research conclusions is consistent with Guo et al. (2021), who found that green innovation and CO2 are cointegrated, and green innovation is one of the key contributors in explaining CO2 emissions.
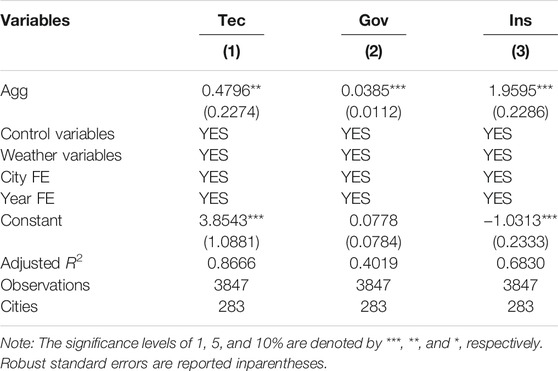
TABLE 3. Mechanism test.
Column (2) reports the impact of industrial agglomeration on government intervention. We can find that industrial agglomeration can significantly facilitate the degree of local government intervention, thereby achieving an increase in ETFP. This is inseparable from the Chinese government’s continued attention to environmental and ecological issues in recent years. In terms of environmental investment, the government has continuously strengthened its investment in pollution control and increased its investment in green technology research and development for enterprises in concentrated areas. In terms of system construction, the government has continuously improved environmental regulations in agglomeration areas and improved relevant laws and regulations, fully implemented the pollution discharge permit system in agglomeration areas, and continued to facilitate market-oriented transactions such as pollution rights, energy rights, water rights, and carbon emissions rights, thereby promoting the city environment improvement of total factor production efficiency. This conclusion is also in line with Farooq et al. (2019) and Shahzad (2020). The burning of fossil fuels causes the emission of greenhouse gases and environmental pollutants, which in turn leads to environmental degradation and affects health. The strengthening of government environmental regulations such as environmental taxes (Farooq et al., 2019) and afforestation (Shahzad, 2020) will reduce environmental pollution and improve environmental quality.
Column (3) shows the impact of industrial agglomeration on the industrial structure. We can find that the improvement of industrial agglomeration can significantly facilitate the upgrading of industrial structure. More companies have transitioned from the secondary industry to the tertiary industry and further improved the regional ETFP. This may be caused by the following reasons. On the one hand, the increase in industrial agglomeration has strengthened the degree of market competition among enterprises, forcing enterprises to continuously improve technology and update equipment to gain competitive advantages, thereby achieving regional industrial structure upgrades. On the other hand, industrial diversification and agglomeration contribute to the formation of the entire industrial chain, improve the production efficiency of the manufacturing industry, and realize the upgrading of China’s manufacturing industry to the high-end of the global value chain. At the same time, it facilitates the vigorous development of the tertiary industry such as productive services. Finally, the ETFP is improved. Similar to the conclusion of Doğan et al. (2021) that economic complexity can alleviate environmental degradation, in the process of promoting the optimization and upgrading of industrial structure, industrial agglomeration has also promoted the growth of labor force, the improvement of production technology and the use of clean energy to a certain extent, thereby promoting the growth of ETFP.
Robustness Test
To make our results more credible, we have conducted a large number of robustness tests through a variety of methods. The results are shown in Table 4. First, the undesired output in the ETFP calculation process includes the 3-year moving average data of the PM2.5 of China’s prefecture-level cities calculated by Columbia University using satellites. We replaced the relevant PM2.5 concentration data with the annual PM2.5 concentration data calculated by the atmospheric composition analysis group of Dalhousie University in Canada. We find from column (1) that, after replacing the calculation content of ETFP, industrial agglomeration can still facilitate ETFP at the 5% significance level.
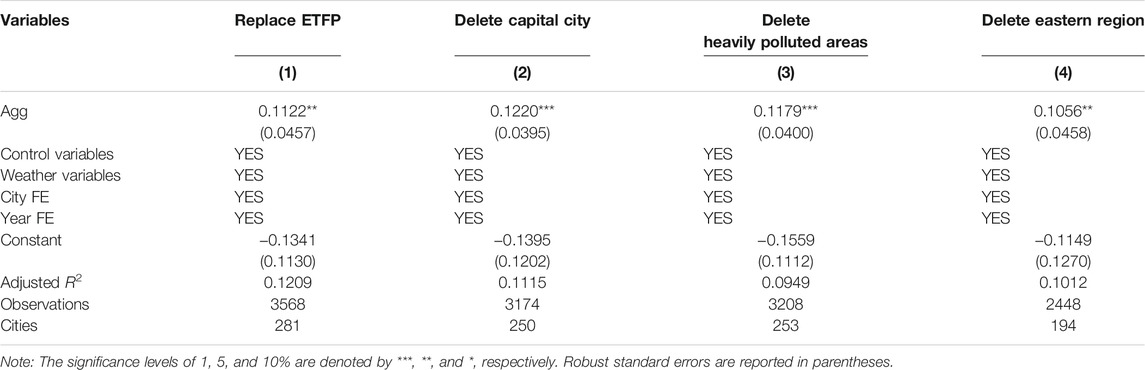
TABLE 4. Robustness test.
As China’s prefecture-level cities or provincial capital cities are the facades of this region, the effects of any national policies must be first shown in provincial capital cities. This also caused the provincial government to concentrate all political resources in the provincial capital to ensure that the provincial capital can fulfil the relevant national policy requirements. If this kind of government behavior is not eliminated, it will cause an overestimation of the effect of industrial agglomeration on ETFP. Therefore, we exclude four municipalities and all provincial capital cities, and the regression results are reported in column (2). We can find that after excluding government behaviors in provincial capital cities, industrial agglomeration can still facilitate ETFP at the 5% significance level.
Second, China has implemented transformational development in recent years, and more environmental policies have further strengthened the regulation of environmental pollutant emissions. The Chinese government has implemented the strictest environmental regulations and policies for the “2 + 26” cities with the most serious environmental pollution. Strict environmental regulation policies can significantly improve regional air quality. If these 28 regions are not excluded, we cannot distinguish the role of environmental regulation policies and overestimate the impact of industrial agglomeration on ETFP. Column (3) reports the estimated results after excluding 28 areas with serious environmental pollution. We can find that after excluding the impact of environmental regulatory policies, industrial agglomeration can still facilitate ETFP at the 1% significance level.
Finally, since the sample time of this paper started in 2003, it includes the migration of polluting enterprises from the east to the west in the Western Development Policy. The development of the secondary industry in the eastern region has been saturated, while the western region has a large amount of resources needed for the development of manufacturing enterprises. With the implementation of the western development policy, enterprises with serious pollution in the eastern region have moved to the western region. This caused an overestimation of the effects of industrial agglomeration policies in the eastern region. Column (4) excludes the heavy industrial areas in the east to excludes the influence of the western development policy. We can find that industrial agglomeration can still increase ETFP at the 5% significance level.
Heterogeneity Analysis
We also conducted a heterogeneous analysis of three aspects of the impact of industrial agglomeration on ETFP in Table 5. First, we rank the industrial agglomeration of all cities each year. We estimate the areas where the industrial agglomeration is higher than the average and lower than the average, respectively, to see the impact of different level of agglomerations on ETFP. We find from columns (1) and (2) of Table 5 that regions with high industrial agglomeration can significantly facilitate ETFP at the 1% significance level, while regions with low agglomeration have no significant effect on promoting ETFP.
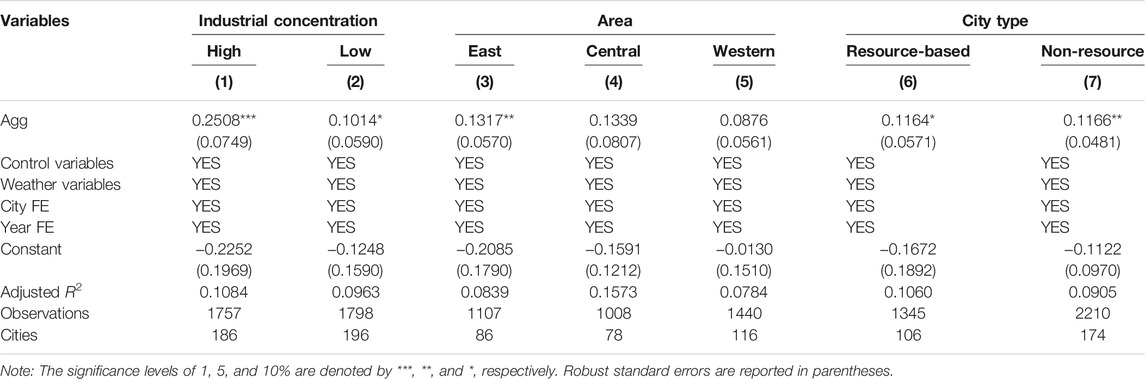
TABLE 5. Heterogeneity test.
Further, we separately examined the impact of industrial agglomeration in the eastern, central, and western regions on ETFP. From columns (3) to (5), it can be found that industrial agglomeration in the eastern region can have a significant impact on ETFP at the 5% significance level, while industrial agglomeration in the central and western regions has no significant impact on ETFP.
Finally, we examine the heterogeneity between resource-based cities2 and non-resource-based cities. The reason for the agglomeration of industries in resource-based cities may be to get closer to the geographical location of local mineral resources. The industrial agglomeration of non-resource-based cities can not only reduce the cost between the upstream and downstream of the industrial chain but also produce the Porter effect and achieve technology spillover, thereby improving production technology and achieving higher-quality development. Therefore, the impact of industrial agglomeration on ETFP will vary with city types. Columns 6) and 7) report the estimated results. We find that in non-resource-based cities, industrial agglomeration can indeed facilitate the increase of ETFP at the 5% significance level, while this facilitation effect is not significant in resource-based cities.
Conclusion
Based on the panel data of 283 cities in China from 2003 to 2016, this paper first adopts the Overall Malquist Index method proposed by Afsharian and Ahn (2015) to more accurately measure the green development of Chinese cities characterized by ETFP. Subsequently, this paper study the causal relationship between industrial agglomeration and green development. We found that China’s current industrial agglomeration can promote green development. On average, for each additional industrial agglomeration (10.63%), the ETFP increases by 11.44% (3.32%). This corresponds to an elasticity between industrial agglomeration and ETFP of 31.23%. Mechanism analysis shows that industrial agglomeration can promote green development through improving the technological innovation, strengthening government intervention, and optimizing the industrial structure. Finally, heterogeneity analysis shows that industrial agglomeration has a stronger role in promoting green development in areas where the economy is more developed, the degree of resource dependence is lower, and the degree of industrial agglomeration is higher.
Our policy recommendations are as follows. First, under the background of the new dual-cycle development pattern, the government should use agglomeration areas as carriers to accelerate industrial agglomeration and industrial chain upgrading. On the one hand, local construction should be guided by green development and gradually introduce new and green industrial construction policies. The government should develop the environmental protection industry, promote the green transformation of key industries and important fields, and promote the safe and efficient use of clean, low-carbon energy. On the other hand, the government should encourage and introduce new enterprises, strengthen legal and policy guarantees for green development, promote cleaner production, support industrial enterprises to increase R&D investment, promote technological innovation and the transformation of scientific and technological achievements, and strengthen advanced production technologies, especially low-carbon technologies and energy saving. In addition, the government should strengthen the innovation of the system and mechanism, supporting facilities, and operation and management models in the industrial cluster areas, and strengthen the efficiency of the comprehensive utilization of resources. Meanwhile, policymakers should expand the regional boundaries of interaction between agglomeration industries, build a long-term mechanism for the coordinated development of industrial agglomerations sharing knowledge, technology, and information, as well as promote the sustainable development of regional integration.
Second, it is necessary to strengthen the coordination and linkage mechanism of government intervention in industrial agglomeration. On the one hand, the government should encourage enterprises to carry out technological innovation. For industries with higher innovation output and high production efficiency, preferential policies such as fiscal subsidies and tax reductions and exemptions should be given to improve the efficiency of green innovation. On the other hand, under the strengthening of the system of environmental regulation, the government should improve the construction of the intellectual property protection system, to form an oppressive mechanism for enterprise innovation. Meanwhile, the government should encourage green technological innovation and management system innovation to open up space for cross-border integration of innovative elements such as talent, information, knowledge, and technology in the modern industrial system. In addition, relying on the knowledge spillover effect between industries agglomerated, and through innovative elements such as “technology + finance” and “Internet +,” promote green financial innovation represented by the carbon financial market, and help market incentives such as carbon emissions trading and emissions trading. The design and improvement of environmental regulatory policy tools will facilitate the growth of city ETFP.
Third, the government should formulate corresponding industrial agglomeration development policies according to different economic development levels and city types. First, for cities in the eastern region with a high level of economic development, while continuously optimising industrial policies, we will formulate strict environmental regulations, continue to promote green technology research, green smart manufacturing, and modern energy technology applications, and strive to create a modern, green development industrial agglomeration. For cities in the central and western regions, development should be their primary goal. Decision-makers should flexibly use environmental regulatory policies and industrial policies, strengthen the leading role of regional core cities, as well as promote the positive externalities of industrial agglomeration, to realise the coordinated development of urban economy and environment. Second, due to resource-based cities’ environment and resource constraints, they should focus on accelerating changes in growth patterns, promote the optimization of the industrial structure in agglomeration areas, eliminate outdated industries, and actively introduce advanced green technologies and management methods to achieve faster reduction of pollutants emission.
There are some limitations in this paper. First, although we include the main input, expected output, and undesired output variables in the calculation of ETFP, due to data limitations, we have no way to obtain other undesired output variables. Second, in the mechanism analysis, some channels were not fully reflected. For example, mechanism variables such as the improvement of labor skills and the improvement of corporate management efficiency can also promote the growth of ETFP, but we do not have enough data to disentangle them. One suggestion for future research is to design, administer, and survey with more detailed macroeconomic variables and micro individual variables information to examine their role in ETFP.
Data Availability Statement
The original contributions presented in the study are included in the article/Supplementary Material, further inquiries can be directed to the corresponding author.
Author Contributions
WX: Conceptualisation, Formal analysis, Investigation, Writing—original draft, XL: Methodology, Writing—review and editing, Supervision, Funding acquisition.
Funding
This work was supported by the Graduate Innovation Fund of Shanghai University of Finance and Economics (No. CXJJ-2020-310).
Conflict of Interest
The authors declare that the research was conducted in the absence of any commercial or financial relationships that could be construed as a potential conflict of interest.
Publisher’s Note
All claims expressed in this article are solely those of the authors and do not necessarily represent those of their affiliated organizations, or those of the publisher, the editors and the reviewers. Any product that may be evaluated in this article, or claim that may be made by its manufacturer, is not guaranteed or endorsed by the publisher.
Supplementary Material
The Supplementary Material for this article can be found online at: https://www.frontiersin.org/articles/10.3389/fenvs.2021.745465/full#supplementary-material
Footnotes
1Input factors include labor (expressed by the total number of employees in the three industries), capital (expressed by total fixed asset investment), and energy consumption (expressed by annual electricity consumption). Expected output is expressed by GDP, and undesired output includes industrial wastewater discharge and industrial SO2 emissions
2According to the plan for the sustainable development of resource-based cities in China (2013–2020) issued by the State Council: resource-based cities are cities in which the mining and processing of natural resources such as minerals and forests in the region are the leading industries (including prefecture-level cities, districts and other county-level administrative districts, etc.). There are a total of 262 resource-based cities, including 126 prefecture-level administrative regions, 62 county-level cities, 58 counties, and 16 municipal districts. Available online at: http://www.gov.cn/zwgk/2013-12/03/content _2540 070.htm
References
Afsharian, M., and Ahn, H. (2015). The Overall Malmquist index: a New Approach for Measuring Productivity Changes over Time. Ann. Oper. Res. 226, 1–27. doi:10.1007/s10479-014-1668-5
Amiti, M. (2005). Location of Vertically Linked Industries: Agglomeration versus Comparative Advantage. Eur. Econ. Rev. 49, 809–832. doi:10.1016/j.euroecorev.2002.12.001
Arrow, K. J. (1971). The Economic Implications of Learning by Doing. Rev. Econ. Stud. 29, 131–149. doi:10.1007/978-1-349-15430-2_11
Balsalobre-Lorente, D., Gokmenoglu, K. K., Taspinar, N., and Cantos-Cantos, J. M. (2019). An Approach to the Pollution haven and Pollution Halo Hypotheses in MINT Countries. Environ. Sci. Pollut. Res. 26, 23010–23026. doi:10.1007/s11356-019-05446-x
Baptista, R., and Swann, P. (1998). Do firms in Clusters Innovate More? Res. Pol. 27, 525–540. doi:10.1016/S0048-7333(98)00065-1
Chang, C.-L., and Oxley, L. (2009). Industrial Agglomeration, Geographic Innovation and Total Factor Productivity: The Case of Taiwan. Mathematics Comput. Simulation 79, 2787–2796. doi:10.1016/j.matcom.2008.09.003
Chen, C., Han, J., and Fan, P. (2016). Measuring the Level of Industrial Green Development and Exploring its Influencing Factors: Empirical Evidence from China's 30 Provinces. Sustainability 8, 153. doi:10.3390/su8020153
Chen, S., and Golley, J. (2014). 'Green' Productivity Growth in China's Industrial Economy. Energ. Econ. 44, 89–98. doi:10.1016/j.eneco.2014.04.002
Cheng, Z., and Jin, W. (2020). Agglomeration Economy and the Growth of green Total-Factor Productivity in Chinese Industry. Socio-Economic Plann. Sci. 1, 101003. doi:10.1016/j.seps.2020.101003
Cheng, Z., Li, L., and Liu, J. (2017). The Emissions Reduction Effect and Technical Progress Effect of Environmental Regulation Policy Tools. J. Clean. Prod. 149, 191–205. doi:10.1016/j.jclepro.2017.02.105
Cheng, Z., and Li, W. (2018). Independent R and D, Technology Introduction, and Green Growth in China's Manufacturing. Sustainability 10, 311–314. doi:10.3390/su10020311
Cole, M. A., Elliott, R. J. R., and Shimamoto, K. (2005). Industrial Characteristics, Environmental Regulations and Air Pollution: An Analysis of the UK Manufacturing Sector. J. Environ. Econ. Manag. 50, 121–143. doi:10.1016/j.jeem.2004.08.001
Dixit, A. K., and Stiglitz, J. E. (1977). Monopolistic Competition and Optimum Product Diversity. The American economic review.
Doğan, B., Driha, O. M., Balsalobre Lorente, D., and Shahzad, U. (2021). The Mitigating Effects of Economic Complexity and Renewable Energy on Carbon Emissions in Developed Countries. Sust. Dev. 29, 1–12. doi:10.1002/sd.2125
Fang, C., Cheng, J., Zhu, Y., Chen, J., and Peng, X. (2021). Green Total Factor Productivity of Extractive Industries in China: An Explanation from Technology Heterogeneity. Resour. Pol. 70, 101933. doi:10.1016/j.resourpol.2020.101933
Farooq, M. U., Shahzad, U., Sarwar, S., and ZaiJun, L. (2019). The Impact of Carbon Emission and forest Activities on Health Outcomes: Empirical Evidence from China. Environ. Sci. Pollut. Res. 26, 12894–12906. doi:10.1007/s11356-019-04779-x
Feng, C., Huang, J.-B., and Wang, M. (2018). Analysis of green Total-Factor Productivity in China's Regional Metal Industry: A Meta-Frontier Approach. Resour. Pol. 58, 219–229. doi:10.1016/j.resourpol.2018.05.008
Feng, C., Wang, M., Liu, G.-C., and Huang, J.-B. (2017). Green Development Performance and its Influencing Factors: A Global Perspective. J. Clean. Prod. 144, 323–333. doi:10.1016/j.jclepro.2017.01.005
Fujita, M. (1989). Urban Economic Theory. UK: Cambridge University Press. doi:10.1017/cbo9780511625862
Ghazouani, A., Jebli, M. B., and Shahzad, U. (2021). Impacts of Environmental Taxes and Technologies on Greenhouse Gas Emissions: Contextual Evidence from Leading Emitter European Countries. Environ. Sci. Pollut. Res. 28, 22758–22767. doi:10.1007/s11356-020-11911-9
Glaser, E. L. (2011). Triumph of the City: How Our Greatest Invention Makes Us Richer, Smarter, Greener, Healthier, and Happier. Maryland: Penguin Press.
Guo, J., Zhou, Y., Ali, S., Shahzad, U., and Cui, L. (2021). Exploring the Role of green Innovation and Investment in Energy for Environmental Quality: An Empirical Appraisal from Provincial Data of China. J. Environ. Manage. 292, 112779. doi:10.1016/j.jenvman.2021.112779
Guo, L., and Wang, Y. (2018). How Does Government Environmental Regulation "unlock" Carbon Emission Effect?-Evidence from China. Chin. J. Popul. Resour. Environ. 16, 232–241. doi:10.1080/10042857.2018.1496703
Guo, Y., Tong, L., and Mei, L. (2020). The Effect of Industrial Agglomeration on green Development Efficiency in Northeast China since the Revitalization. J. Clean. Prod. 258, 120584. doi:10.1016/j.jclepro.2020.120584
He, S., Yan, T., and Zhou, H. (2016). Decomposition and Spatial Clustering Analysis of China's SO2 Emissions. Proced. Comp. Sci. 91, 1064–1072. doi:10.1016/j.procs.2016.07.153
Hoang, V.-N., and Coelli, T. (2011). Measurement of Agricultural Total Factor Productivity Growth Incorporating Environmental Factors: A Nutrients Balance Approach. J. Environ. Econ. Manag. 62, 462–474. doi:10.1016/j.jeem.2011.05.009
Hu, C., Xu, Z., and Yashiro, N. (2015). Agglomeration and Productivity in China: Firm Level Evidence. China Econ. Rev. 33, 50–66. doi:10.1016/j.chieco.2015.01.001
Hu, J., Wang, Z., Huang, Q., and Zhang, X. (2019). Environmental Regulation Intensity, Foreign Direct Investment, and green Technology Spillover-An Empirical Study. Sustainability 11, 2718–8. doi:10.3390/su11102718
Ikram, M., Xia, W., Fareed, Z., Shahzad, U., and Rafique, M. Z. (2021). Exploring the Nexus between Economic Complexity, Economic Growth and Ecological Footprint: Contextual Evidences from Japan. Sustainable Energ. Tech. Assessments 47, 101460. doi:10.1016/j.seta.2021.101460
Jans, J., Johansson, P., and Nilsson, J. P. (2018). Economic Status, Air Quality, and Child Health: Evidence from Inversion Episodes. J. Health Econ. 61, 220–232. doi:10.1016/j.jhealeco.2018.08.002
Jia, R., Fan, M., Shao, S., and Yu, Y. (2021). Urbanization and Haze-Governance Performance: Evidence from China's 248 Cities. J. Environ. Manage. 288, 112436. doi:10.1016/j.jenvman.2021.112436
Jin, G., Shen, K., and Li, J. (2020). Interjurisdiction Political Competition and green Total Factor Productivity in China: An Inverted-U Relationship. China Econ. Rev. 61, 101224. doi:10.1016/j.chieco.2018.09.005
Kamal, F., and Sundaram, A. (2019). Do institutions Determine Economic Geography? Evidence from the Concentration of Foreign Suppliers. J. Urban Econ. 110, 89–101. doi:10.1016/j.jue.2019.02.001
Krugman, P. (1991). Increasing Returns and Economic Geography. J. Polit. Economy 99, 483–499. doi:10.1086/261763
Krugman, P. (1998). Space: The Final Frontier. J. Econ. Perspect. 12, 161–174. doi:10.1257/jep.12.2.161
Li, L., Lei, Y., Pan, D., and Si, C. (2016). Research on Sustainable Development of Resource-Based Cities Based on the DEA Approach: A Case Study of Jiaozuo, China. Math. Probl. Eng. 2016, 1–10. doi:10.1155/2016/5024837
Li, X., Hu, Z., and Cao, J. (2021). The Impact of Carbon Market Pilots on Air Pollution: Evidence from China. Environ. Sci. Pollut. Res. 2021, 1. doi:10.1007/s11356-021-14995-z
Li, Y., Sun, L., Feng, T., and Zhu, C. (2013). How to Reduce Energy Intensity in China: A Regional Comparison Perspective. Energy Policy 61, 513–522. doi:10.1016/j.enpol.2013.06.007
Lin, H.-L., Li, H.-Y., and Yang, C.-H. (2011). Agglomeration and Productivity: Firm-Level Evidence from China's Textile Industry. China Econ. Rev. 22, 313–329. doi:10.1016/j.chieco.2011.03.003
Liu, D., Zhu, X., and Wang, Y. (2021). China's Agricultural green Total Factor Productivity Based on Carbon Emission: An Analysis of Evolution Trend and Influencing Factors. J. Clean. Prod. 278, 123692. doi:10.1016/j.jclepro.2020.123692
Liu, Q., Wang, S., Zhang, W., Zhan, D., and Li, J. (2018). Does Foreign Direct Investment Affect Environmental Pollution in China's Cities? A Spatial Econometric Perspective. Sci. Total Environ. 613-614, 521–529. doi:10.1016/j.scitotenv.2017.09.110
Liu, X., and Zhang, X. (2021). Industrial Agglomeration, Technological Innovation and Carbon Productivity: Evidence from China. Resour. Conservation Recycling 166, 105330. doi:10.1016/j.resconrec.2020.105330
Liu, Z., and Xin, L. (2019). Has China's Belt and Road Initiative Promoted its green Total Factor Productivity?--Evidence from Primary Provinces along the Route. Energy Policy 129, 360–369. doi:10.1016/j.enpol.2019.02.045
Lu, P., Liu, J., Wang, Y., and Ruan, L. (2021). Can Industrial Agglomeration Improve Regional green Total Factor Productivity in China? an Empirical Analysis Based on Spatial Econometrics. Growth and Change 52, 1011–1039. doi:10.1111/grow.12488
Mo, C., He, C., and Yang, L. (2020). Structural Characteristics of Industrial Clusters and Regional Innovation. Econ. Lett. 188, 109003. doi:10.1016/j.econlet.2020.109003
O’Donoghue, D., and Gleave, B. (2004). A Note on Methods for Measuring Industrial Agglomeration. Reg. Stud. 38, 419–427. doi:10.1080/03434002000213932
Pastor, J. T., and Lovell, C. A. K. (2005). A Global Malmquist Productivity index. Econ. Lett. 88, 266–271. doi:10.1016/j.econlet.2005.02.013
Porter, M. E., and Linde, C. v. d. (1995). Toward a New Conception of the Environment-Competitiveness Relationship. J. Econ. Perspect. 9, 97–118. doi:10.1257/jep.9.4.97
Rafique, M. Z., Nadeem, A. M., Xia, W., Ikram, M., Shoaib, H. M., and Shahzad, U. (2021). Does Economic Complexity Matter for Environmental Sustainability? Using Ecological Footprint as an Indicator. Environ. Dev. Sustain. 2021, 1. doi:10.1007/s10668-021-01625-4
Romer, P. M. (1986). Increasing Returns and Long-Run Growth. J. Polit. economy 94, 1002–1037. doi:10.1086/261420
Sager, L. (2019). Estimating the Effect of Air Pollution on Road Safety Using Atmospheric Temperature Inversions. J. Environ. Econ. Manag. 98, 102250. doi:10.1016/j.jeem.2019.102250
Shahzad, U. (2020). Environmental Taxes, Energy Consumption, and Environmental Quality: Theoretical Survey with Policy Implications. Environ. Sci. Pollut. Res. 27, 24848–24862. doi:10.1007/s11356-020-08349-4
Shao, S., Yang, L., Yu, M., and Yu, M. (2011). Estimation, Characteristics, and Determinants of Energy-Related Industrial CO2 Emissions in Shanghai (China), 1994-2009. Energy Policy 39, 6476–6494. doi:10.1016/j.enpol.2011.07.049
Sharma, G. D., Shah, M. I., Shahzad, U., Jain, M., and Chopra, R. (2021). Exploring the Nexus between Agriculture and Greenhouse Gas Emissions in BIMSTEC Region: The Role of Renewable Energy and Human Capital as Moderators. J. Environ. Manage. 297, 113316. doi:10.1016/j.jenvman.2021.113316
Shen, L., and Wang, Y. (2018). Supervision Mechanism for Pollution Behavior of Chinese Enterprises Based on Haze Governance. J. Clean. Prod. 197, 571–582. doi:10.1016/j.jclepro.2018.06.160
Song, M., Du, J., and Tan, K. H. (2018). Impact of Fiscal Decentralization on green Total Factor Productivity. Int. J. Prod. Econ. 205, 359–367. doi:10.1016/j.ijpe.2018.09.019
Song, M., Zhu, S., Wang, J., and Wang, S. (2019). China's Natural Resources Balance Sheet from the Perspective of Government Oversight: Based on the Analysis of Governance and Accounting Attributes. J. Environ. Manage. 248, 109232. doi:10.1016/j.jenvman.2019.07.003
Tanaka, K., and Managi, S. (2021). Industrial Agglomeration Effect for Energy Efficiency in Japanese Production Plants. Energy Policy 156, 112442. doi:10.1016/j.enpol.2021.112442
Tang, D., Tang, J., Xiao, Z., Ma, T., and Bethel, B. J. (2017). Environmental Regulation Efficiency and Total Factor Productivity-Effect Analysis Based on Chinese Data from 2003 to 2013. Ecol. Indicators 73, 312–318. doi:10.1016/j.ecolind.2016.08.040
Venables, A. J. (1996). Equilibrium Locations of Vertically Linked Industries. Int. Econ. Rev. 37, 341–359. doi:10.2307/2527327
Wang, K.-L., Pang, S.-Q., Ding, L.-L., and Miao, Z. (2020). Combining the Biennial Malmquist-Luenberger index and Panel Quantile Regression to Analyze the green Total Factor Productivity of the Industrial Sector in China. Sci. Total Environ. 739, 140280. doi:10.1016/j.scitotenv.2020.140280
Wang, Y., Sun, X., and Guo, X. (2019). Environmental Regulation and green Productivity Growth: Empirical Evidence on the Porter Hypothesis from OECD Industrial Sectors. Energy Policy 132, 611–619. doi:10.1016/j.enpol.2019.06.016
Wang, Z., Ben Jebli, M., Madaleno, M., Doğan, B., and Shahzad, U. (2021). Does export Product Quality and Renewable Energy Induce Carbon Dioxide Emissions: Evidence from Leading Complex and Renewable Energy Economies. Renew. Energ. 171, 360–370. doi:10.1016/j.renene.2021.02.066
Xia, F., and Xu, J. (2020). Green Total Factor Productivity: A Re-examination of Quality of Growth for Provinces in China. China Econ. Rev. 62, 101454. doi:10.1016/j.chieco.2020.101454
Xie, R.-h., Yuan, Y.-j., and Huang, J.-j. (2017). Different Types of Environmental Regulations and Heterogeneous Influence on “Green” Productivity: Evidence from China. Ecol. Econ. 132, 104–112. doi:10.1016/j.ecolecon.2016.10.019
Xie, R., Yao, S., Han, F., and Fang, J. (2019). Land Finance, Producer Services Agglomeration, and Green Total Factor Productivity. Int. Reg. Sci. Rev. 42, 550–579. doi:10.1177/0160017619836270
Xie, W., Yan, T., Xia, S., and Chen, F. (2020). Innovation or Introduction? the Impact of Technological Progress Sources on Industrial green Transformation of Resource-Based Cities in China. Front. Energ. Res. 8, 301. doi:10.3389/fenrg.2020.598141
Xu, L., Fan, M., Yang, L., and Shao, S. (2021). Heterogeneous green Innovations and Carbon Emission Performance: Evidence at China's City Level. Energ. Econ. 99, 105269. doi:10.1016/j.eneco.2021.105269
Yan, Z., Zou, B., Du, K., and Li, K. (2020). Do renewable Energy Technology Innovations Promote China's green Productivity Growth? Fresh Evidence from Partially Linear Functional-Coefficient Models. Energ. Econ. 90, 104842. doi:10.1016/j.eneco.2020.104842
Yu, S., Zheng, S., Zhang, X., Gong, C., and Cheng, J. (2018). Realizing China's Goals on Energy Saving and Pollution Reduction: Industrial Structure Multi-Objective Optimization Approach. Energy Policy 122, 300–312. doi:10.1016/j.enpol.2018.07.034
Zhang, M., Li, H., Song, Y., and Li, C. (2019). Study on the Heterogeneous Government Synergistic Governance Game of Haze in China. J. Environ. Manage. 248, 109318. doi:10.1016/j.jenvman.2019.109318
Zhang, N., and Choi, Y. (2014). A Note on the Evolution of Directional Distance Function and its Development in Energy and Environmental Studies 1997-2013. Renew. Sust. Energ. Rev. 33, 50–59. doi:10.1016/j.rser.2014.01.064
Zhang, N., and Jiang, X. F. (2019). The Effect of Environmental Policy on Chinese Firm's green Productivity and Shadow price: A Metafrontier Input Distance Function Approach. Technol. Forecast. Soc. Change 144, 129–136. doi:10.1016/j.techfore.2019.04.015
Zhang, Z., and Ye, J. (2015). Decomposition of Environmental Total Factor Productivity Growth Using Hyperbolic Distance Functions: A Panel Data Analysis for China. Energ. Econ. 47, 87–97. doi:10.1016/j.eneco.2014.10.023
Zhao, Z., Bai, Y., Wang, G., Chen, J., Yu, J., and Liu, W. (2018). Land Eco-Efficiency for New-type Urbanization in the Beijing-Tianjin-Hebei Region. Technol. Forecast. Soc. Change 137, 19–26. doi:10.1016/j.techfore.2018.09.031
Zhou, P., Ang, B. W., and Zhou, D. Q. (2012). Measuring Economy-wide Energy Efficiency Performance: A Parametric Frontier Approach. Appl. Energ. 90, 196–200. doi:10.1016/j.apenergy.2011.02.025
Zhu, W., Zhu, Y., Lin, H., and Yu, Y. (2021). Technology Progress Bias, Industrial Structure Adjustment, and Regional Industrial Economic Growth Motivation -- Research on Regional Industrial Transformation and Upgrading Based on the Effect of Learning by Doing. Technol. Forecast. Soc. Change 170, 120928. doi:10.1016/j.techfore.2021.120928
Keywords: industrial agglomeration, environmental total factor productivity, technological progress, government intervention, industrial structure, green development
Citation: Xie W and Li X (2021) Can Industrial Agglomeration Facilitate Green Development? Evidence From China. Front. Environ. Sci. 9:745465. doi: 10.3389/fenvs.2021.745465
Received: 22 July 2021; Accepted: 21 September 2021;
Published: 04 October 2021.
Edited by:
Gazi Salah Uddin, Linköping University, SwedenReviewed by:
Daniel Balsalobre-Lorente, University of Castilla-La Mancha, SpainUmer Shahzad, Anhui University of Finance and Economics, China
Copyright © 2021 Xie and Li. This is an open-access article distributed under the terms of the Creative Commons Attribution License (CC BY). The use, distribution or reproduction in other forums is permitted, provided the original author(s) and the copyright owner(s) are credited and that the original publication in this journal is cited, in accordance with accepted academic practice. No use, distribution or reproduction is permitted which does not comply with these terms.
*Correspondence: Xing Li, WGluZ2xpMjc3QDEyNi5jb20=