 Caroline Scaramboni1†
 Jordan Brizi Neris2†
 Rita de Kássia Silva do Nascimento2Natasha Leandra Chiaranda da Rosa2
 Jonatas Schadeck Carvalho2Guilherme Martins Grosseli2
 Maria Lucia Arruda Moura Campos1Pedro Sérgio Fadini2
 Roberta Cerasi Urban2*
- 1Chemistry Department, FFCLRP, University of São Paulo, São Paulo, Brazil
- 2Chemistry Department, Federal University of São Carlos, São Paulo, Brazil
This work describes the optimization of an extraction method for the determination of polycyclic aromatic hydrocarbons (PAHs) and their nitro- and oxy-PAH derivatives in atmospheric particulate matter (PM) samples, and demonstrates that this method is also effective for the determination of levoglucosan. The optimization of the extraction solvents was performed using a three-component mixture design with the solvents dichloromethane, methanol, and acetonitrile. The number of extractions, volume of solvent, and duration of extraction in an ultrasonic bath were optimized using a full factorial design followed by a central composite design. The analyses were performed by gas chromatography coupled with mass spectrometry. The optimized conditions of the method were three extractions using 4.0 ml of acetonitrile, with ultrasonication for 34 min. The proposed method presented good linearity (r > 0.990) and acceptable precision for low (100 ng ml−1, RSD: 1–16%), medium (300 ng ml−1, RSD: 1–19%), and high (500 ng ml−1, RSD: 2–16%) concentrations of PAHs. The limits of quantification for different PAHs ranged from 10 to 50 ng ml−1, which were suitable for atmospheric PM. Assessment of the method using sample matrix spiking/recovery assays, as well as use of a reference method, showed good recoveries for levoglucosan and for most of the PAHs and their derivatives, except for the most volatile compounds, which were lost during the evaporation of the solvent. The results for PM samples extracted by the optimized method and the reference method were in good agreement. The proposed method required 97% less solvent than the reference method, shortened the analysis time by 85%, and proved to be accurate and precise for the determination of at least 27 PAHs and their derivatives present in PM samples collected with a low-volume sampler.
1 Introduction
Atmospheric particulate matter (PM) has been widely studied worldwide due to its impact on the environment, reduction of visibility, and effects on human health (Rodrí guez-Urrego and Rodr í guez-Urrego, 2020; Zheng et al., 2020). It is estimated that the number of deaths in the world due to long-term outdoor exposure to PM ≤ 2.5 µm (PM2.5) was approximately 4.14 million in 2019 (Health Effects Institute, 2020). The high socio-environmental impact is linked to the physicochemical characteristics of PM, with these particles having different chemical compositions and sizes, depending on their formation processes (Alves, 2005; Harrison, 2020). It has been shown that PM2.5 has carcinogenic potential, mainly resulting in lung cancer (Khan et al., 2018; Senthil Kumar et al., 2018).
In general, PM consists of inorganic species (sulfates, nitrates, metals, etc.) and carbonaceous material that is a complex mixture of organic molecules and elemental carbon (Alves, 2005). Several studies have indicated that the carcinogenic potential of these particles is mainly due to the presence of polycyclic aromatic hydrocarbons (PAHs) and their oxy- and nitro-PAH derivatives in the organic fraction of PM (Kelly and Fussell, 2012; de Oliveira Alves et al., 2017; de Oliveira Galvão et al., 2018; Nováková et al., 2020).
PAHs are a class of organic compounds that contain only carbon and hydrogen atoms, consist of two or more aromatic rings condensed together, and are formed during incomplete combustion or pyrolysis of organic material (Kim et al., 2013). Oxy- and nitro-PAHs have substitutions of one or more hydrogen atoms by carbonyl and nitro functional groups, respectively, and are either directly formed during combustion or are products of secondary reactions in the atmosphere (Abbas et al., 2018; Idowu et al., 2019).
The distribution of PAHs between the particulate and gaseous phases is determined by their vapor pressure, which decreases drastically with increasing molecular weight. Consequently, at room temperature, two-ring PAHs are mostly found in the gas phase, while carcinogenic five-ring PAHs, such as benzo [a]pyrene, are mostly adsorbed on airborne particles (IARC–International Agency for Research on Cancer, 2010; Kameda, 2011).
Biomass burning is a major source of PAH emissions, so the use of a chemical tracer capable of identifying this origin of PM is of great relevance (Urban et al., 2014). Levoglucosan is an anhydrosaccharide produced by the pyrolysis of cellulose at high temperatures (>300°C) and has been proposed as a specific tracer for biomass burning (Simoneit et al., 1999; Urban et al., 2012).
Existing methods reported in the literature for simultaneous extraction of levoglucosan and PAHs, prior to determination by gas chromatography-mass spectrometry (GC-MS), are scarce and involve additional experimental steps, such as fractionation, or use of a thermal desorption injection system (Van Drooge and Ballesta, 2009; Sevimoglu and Rogge, 2015; Turap et al., 2018; van Drooge et al., 2018).
It is evident that knowledge of the origins, characteristics, and concentrations of PAHs and their derivatives in atmospheric PM is necessary for the purposes of monitoring and subsequent mitigation of the concentrations of these chemical species in the environment. Among the analytical methods most commonly used to identify and quantify PAHs are GC-MS and high-performance liquid chromatography with fluorescence detection (HPLC-fluorescence) (Eiguren-Fernandez and Miguel, 2003). The use of other methods, such as HPLC-MS, is also possible and can be very efficient, but the associated costs may be prohibitive for many laboratories (Ohno et al., 2009).
HPLC-fluorescence is widely used for PAHs determination, due to its high sensitivity and excellent resolution (Liaud et al., 2015; Boongla et al., 2017). However, the use of the fluorescence detector necessitates the addition of a clean-up column to minimize matrix interferences, as well as a pre-column or on-line derivatization for nitro-PAHs, due to their low or zero fluorescence emission (Delhomme et al., 2007; Sun et al., 2020). These additional experimental steps in the sample preparation procedure increase the time and cost of the analysis.
The use of GC-MS for separation and quantification of PAHs and their derivatives can reduce the coefficients variation (Gratz et al., 2000). The combination of the two techniques (GC and MS) enables the detection and accurate quantification of the compounds, even when present in complex matrices (Abbas et al., 2018; Zhang et al., 2020).
The extraction methods reported in the literature for use with GC-MS usually involve the use of high volumes of organic solvents (>300 ml) and lengthy extraction procedures to enable the detection and quantification of these molecules (Guo et al., 2003; Machado et al., 2009; Marques et al., 2009; Alves et al., 2011; de Oliveira Alves et al., 2015; Song et al., 2018). Several organic solvents have already been used individually or in mixtures to extract PAHs and derivatives from PM, such as acetone, acetonitrile, dichloromethane, hexane, methanol and toluene (Santos et al., 2016; Balducci et al., 2018; Ma et al., 2020; Nováková et al., 2020; Hong et al., 2021; Lim et al., 2021).
Extraction methods that use micro-volumes of solvent are only suitable for the analysis of aerosol samples collected by high-volume air samplers, where there is a large mass of PM deposited on the sampling filter (Santos et al., 2016). Therefore, an extraction method enabling reduction of organic solvent volumes, the use of low-volume samplers, and the simultaneous quantitative extraction of levoglucosan would be highly desirable.
Multivariate techniques such as factorial, central composite, Box-Behnken, Doehlert, and mixture designs have been used to optimize sample preparation procedures, offering advantages such as short optimization times, acquisition of a greater quantity of experimental data using a relatively small number of experiments, and lower reagent consumption (Ferreira et al., 2007; Santos et al., 2016; Gamela et al., 2020).
The objective of this study was to use design of experiments to optimize an extraction method using small solvent volumes for simultaneous determination of PAHs and their oxy- and nitro-derivatives by GC-MS, and to investigate its application for the simultaneous extraction of levoglucosan. This new procedure enables the use of organic solvents to be minimized, while maintaining good accuracy and precision in the analysis of PM collected with low-volume air samplers.
2 Experimental
2.1 Standards
For the construction of analytical curves and for carrying out the recovery tests, a stock standard solution containing all the PAHs, nitro-PAHs, and oxy-PAHs at 1,000 ng ml−1 (individual concentrations) was prepared in dichloromethane:toluene (1:1). A stock internal standard solution containing all the deuterated PAHs, nitro-PAHs, and oxy-PAHs at 1,000 ng ml−1 was also prepared in dichloromethane:toluene (1:1). Solutions of levoglucosan and its internal standard, levoglucosan-C13, were prepared in methanol, both at a concentration of 100,000 ng ml−1. A complete list of the standards used is available in Supplementary Tables S1, S2 shows the internal standards used for each analyte.
2.2 Aerosol Sampling
Aerosol samples used to test the accuracy and the application of the optimized method were collected in two cities, São Carlos and Ribeirão Preto, both located in São Paulo State, Brazil, where biomass burning is an important source of aerosol.
PM10 was collected in the city center of São Carlos (−22.01973S, −47.89009W) on April 27th, 2017, during 24 h, using a high-volume sampler with a size-selective inlet for particles less than 10 μm in diameter (model GS-2310, Accu-vol) fitted with a 509 cm2 glass fiber membrane and operated at a flow rate of 1 m³ min−1. This sample was used to perform the recovery test employing the sample matrix. A high-volume sample was chosen for this test, because the large area of the membrane made it possible to analyze three replicates of three different concentrations, as suggested by IUPAC—International Union of Pure and Applied Chemistry (2002).
For the accuracy test performed by comparison with a reference extraction method, two samples of fractionated PM were collected in parallel at the campus of the University of São Carlos (−21.97812S, −47.88422W), during 7 days from August 20th to 27th, 2020. The sampling was performed with two identical low-volume impactor samplers (MOUDI 100S4, MSP Corporation) with aerodynamic cutoffs for the individual stages of 18, 10, 2.5, and 1.0 µm. The samples were collected on quartz fiber membranes (47 mm diameter, Whatman), at a flow rate of 30 L min−1.
To test the application of the method, a fractionated particulate matter sample was collected using the 4-stage MOUDI impactor at the campus of the University of São Paulo in Ribeirão Preto (−21.16140S, −7.85768W), during 5 days from June 15th to 20th, 2020.
All the membranes containing the particulate matter were wrapped in aluminum foil, placed in plastic bags, and stored at −22°C until analyzed.
Blank tests performed with both types of membranes (glass and quartz fibers) resulted into low or below LOD signals for all studied PAHs and levoglucosan, showing that different membrane types did not present a relevant matrix effect.
2.3 Analytical Instrumentation
Analyses were performed using a gas chromatograph coupled to a mass spectrometer (GCMS-QP2010, Shimadzu). Injections were performed using an autosampler (AOC-20i, Shimadzu). The column used was an SLB®-5 ms Capillary GC Column (Sigma-Aldrich) composed of 5% diphenyl and 95% dimethylpolysiloxane, with dimensions of L × I.D. 30 m × 0.25 mm, df 0.25 µm.
The chromatographic parameters were as described by Santos et al. (2016), with minor changes. The GC oven was programmed as follows: 70°C (2 min); 30°C min−1 to 200°C (5 min); and 5°C min−1 to 320°C (3 min). The carrier gas was helium, at a constant flow rate of 1.0 ml min−1. The injector was operated at 300°C, in splitless mode, with 0.80 min sampling time. The mass spectrometer was operated in electron impact mode, with 70 eV ionization energy and source and interface temperatures of 250 and 320°C, respectively. The analyses were performed in selected ion monitoring (SIM) mode. For each PAH and derivative, at least two ions with different m/z were selected (Supplementary Table S3).
2.4 Extraction Procedure
The experimental optimization of the extraction procedure was performed using blank glass fiber membranes with area of 17.3 cm2 (Gelman Sciences Inc.), which were spiked with standard solutions of PAHs, their nitro- and oxy-derivatives, and the deuterated internal standards, all to final concentrations of 1,000 ng ml−1. The spiked membranes were cut into small pieces directly into a glass vessel and were extracted with organic solvent, using an ultrasonic bath (Unique). When the extraction procedure was repeated, the extracts were combined and then evaporated down to approximately 0.5 ml, under reduced pressure, using a Büchi evaporator. The extract was filtered using a 0.22 µm pore size PTFE filter unit (Analítica), followed by complete evaporation under a gentle flow of nitrogen. The dried material was resuspended in 100 µl of acetonitrile (Supelco) and a 2 µl aliquot was injected into the GC-MS system. In order to obtain the recoveries of each PAH and derivative, the ratio between the peak areas of the analyte and its corresponding internal standard was compared to the corresponding value for a control solution that was directly injected into the GC-MS.
2.5 Experimental Optimization
Firstly, a three-component mixture design was used in order to identify the best extraction solvent, considering acetonitrile, dichloromethane, and methanol (Merck). These solvents were chosen due to their relatively high polarity, which allow for the extraction of more polar derivatives of PAHs, and due to their wider use in works that determined these compounds. Ten experiments were performed according to a simplex-centroid design with axial points. The experimental error was evaluated using three replicates at the central point, increasing the total number of experiments to twelve. In order to determine only the effect of the solvents, the total volume of solvent was fixed at 3 × 5.0 ml and the ultrasonication time was fixed at 30 min.
After selection of the optimal solvent, the parameters that had previously been fixed in the mixture design were then optimized using a full factorial design (2³) with a central point. Nine experiments were performed, varying the extraction solvent volume (3.0, 4.0, and 5.0 ml), the number of extractions (1, 2, and 3), and the sonication time (10, 20, and 30 min). Three replicates at the central point were performed and the total number of experiments was 11. A further refinement was performed using a central composite design in which two variables were tested at five different levels, considering the extraction solvent volume (2.6, 3.0, 4.0, 5.0, and 5.4 ml) and the sonication time (6, 10, 20, 30, and 34 min). A further four experiments were performed in the refinement process.
The recoveries of all the analytes were converted to values between zero (completely undesirable response) and 1 (desirable response), using a desirability function (Pereira-Filho, 2015). The desirability function considered the amplitude of the recovery range obtained (from 0 to 300%) and the desirable range (from 70 to 130%), and was calculated according to Eq. 1, where di represents the individual desirability for each PAH, and y represents the recovery.
The individual desirability for each PAH (
The overall desirability value of each experiment was then used to calculate the effect of each condition on the model response, as well as to calculate the single regression model that represented the best extraction condition. The model was calculated using the freeware Octave [graphical user interface (GUI) version], with the computational routines proposed by Pereira and Pereira-Filho (2018).
2.6 Method Validation
2.6.1 Limits of Detection and Quantification
The limit of detection (LOD) was calculated using the signal-to-noise approach, by gradually decreasing the concentration of the analyte until achieving a signal-to-noise ratio between 3:1 and 2:1 (Jatinder, 2005). The LOD was calculated by directly injecting the standard solutions into the GC-MS system, so the concentration values obtained were related to the detectability power of the chromatographic instrumentation.
The limit of quantification (LOQ) was set as the lowest concentration of the analytical curve, which is the minimum level at which the analyte can be quantified with acceptable accuracy and precision (Jatinder, 2005).
2.6.2 Linearity
The analytical curves were obtained, in triplicate, by spiking blank glass fiber membranes with different volumes of a standard solution containing all the PAHs and derivatives, together with a fixed volume of the standard solution containing the internal standards (final concentration of 200 ng ml−1). The spiked membranes were submitted to the complete extraction process. The filtered extracts were injected into the GC-MS and the analytical curves were obtained by plotting the ratio between the areas of the analyte and the corresponding internal standard against the concentration.
2.6.3 Precision
The precision of the method was obtained by considering the repeatability of nine different determinations covering the analytical range. For this, the relative standard deviation (RSD) was calculated for three replicates at three different concentrations: low (100 ng ml−1), medium (300 ng ml−1) and high (500 ng ml−1) (Jatinder, 2005).
2.6.4 Accuracy
The accuracy of the optimized method was assessed in two ways, using spiking/recovery of the sample matrix and a reference method (IUPAC—International Union of Pure and Applied Chemistry, 2002).
The recovery test using the sample matrix was performed by cutting the 509 cm2 membrane containing the PM10 sample into twelve 17.3 cm2 discs. Three of the discs were extracted and analyzed without spiking, while the other nine were spiked with standard solutions of the PAHs and the derivatives. Three discs were spiked with a final concentration of 100 ng ml−1 (lowest concentration of the analytical range), another three with 300 ng ml−1 (intermediate concentration), and the last three with 500 ng ml−1 (highest concentration). The percentage recovery was calculated by subtracting the concentration for the spiked sample from that for the sample that had not been spiked.
The accuracy test using the reference method (Alves et al., 2011; Urban et al., 2016) was performed using the fine fraction (<1.0 µm) of the two fractionated PM samples collected in parallel with two identical low-volume samplers. One membrane was extracted using the optimized method and the other was extracted using the reference method described in detail by Urban et al. (2016). Briefly, the latter extraction was performed by refluxing the membrane with the collected sample for 24 h in a Soxhlet apparatus containing 300 ml of dichloromethane. The solvent phase was transferred to a clean round-bottom flask and the remaining membrane was extracted with 25 ml of methanol, for 10 min, in an ultrasonic bath. Another two extractions were performed with 25 ml of methanol. The combined dichloromethane and methanol extracts (375 ml) were concentrated to approximately 1 ml, under reduced pressure. The extract was filtered (0.22 µm PTFE membrane) and then completely evaporated under a gentle flow of ultrapure nitrogen. The dried material was resuspended in 100 µl of acetonitrile and a 2 µl aliquot was injected into the GC-MS system. The agreement between the methods was calculated using the ratio between the areas of the analyte and the corresponding internal standard obtained using the optimized method, divided by the ratio obtained using the reference method.
2.7 Levoglucosan Determination
Although the focus of this work is to analyse PAHs and their derivatives in PM samples, the optimized extraction method was applied to the determination of levoglucosan, given the importance of biomass burning as a source of PAHs.
For the recovery test, three blank quartz fiber membranes were spiked with both levoglucosan and levoglucosan-C13, to a final concentration of 1,000 ng ml−1 of each standard, and the extraction was made using the optimized method.
Before injection into the GC-MS system, the dried extracts were derivatized for 3 h, at 70°C, with 40 µl of N,O-bis-(trimethylsilyl)-trifluoroacetamide (BSTFA) containing 1% trimethylchlorosilane (TMCS, Sigma-Aldrich) and 10 µl of pyridine (Merck). After derivatization, a 950 µl volume of hexane was added to the derivatized extract, the mixture was homogenized, and 1 µl was injected into the GC-MS system. The chromatographic parameters for levoglucosan analysis were as described by Urban et al. (2012).
The recoveries were calculated by dividing the ratio between the peak areas of the sugar and the internal standard, obtained after extraction, by the ratio obtained for a control solution that was directly injected into the GC-MS after derivatization.
3 Results and Discussion
3.1 Optimization of the Extraction Method
The solvent was optimized using a mixture design. The experimental conditions for each component of the mixture design (real and coded values) are shown in Table 1, together with the overall desirability (OD).
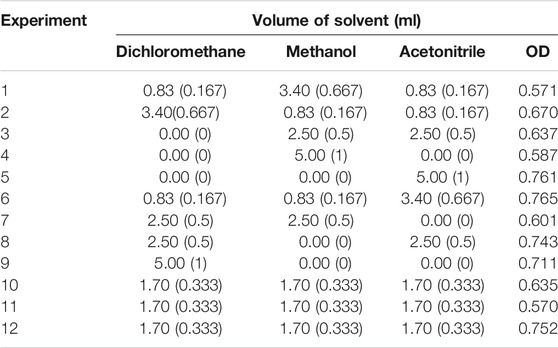
TABLE 1. Experimental conditions of the mixture design performed for the extraction solvent optimization, and the responses in terms of overall desirability (OD). The coded values are shown within parentheses.
Based on the data shown in Table 1, it was possible to calculate the cubic regression model using the computational routine “regression2,” proposed by Pereira and Pereira-Filho (2018). The binary interaction coefficients for all possible pairs of components and the tertiary interaction coefficient for the three components simultaneously were not significant (confidence level = 95%). Thus, the model was recalculated with the individual coefficients, which remained significant after the recalculation (confidence level = 95%).
A short description of the analysis of variance (ANOVA) for the linear model calculated is presented in Supplementary Table S4. The Fisher distribution test (F-test) was used to examine the significance of the difference between the ANOVA parameters. The linear regression model was significant (Fcalculated > Fcritical) and there was no lack of fit (Fcalculated < Fcritical). The model was able to explain 63% of the variation (R2 = 0.6280), with a maximum explicable variation of 79% (R2max = 0.7924). Therefore, the regression model was able to satisfactorily describe the data behavior.
The linear equation obtained (Eq. 3) was used to calculate the optimal experimental conditions and to draw the response surface (Figure 1).
where, R is the response (overall desirability),
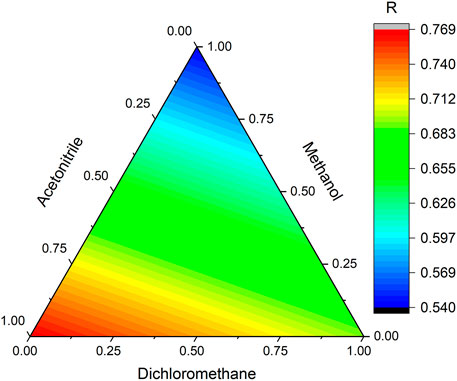
FIGURE 1. Response surface for the overall desirability obtained from the solvent mixture design experimental data.
Methanol was the least favorable solvent, while acetonitrile was the most important solvent in the extraction. The proportion with the highest response (i.e., desirability closest to 1) was 100% acetonitrile, so this condition was chosen to continue the extraction optimization process.
The experimental conditions were codified between −1 and +1 in order to estimate the optimal conditions for the number of extractions, solvent volume, and sonication time, using the full factorial design (2³) with central point. The real and coded values, as well as the overall desirability values are shown in Table 2.

TABLE 2. Experimental conditions of the full factorial design (2³) with central point performed for optimization of the number of extractions, solvent volume, and sonication time, and the responses in terms of overall desirability (OD). The coded values are within parentheses.
Based on the data shown in Table 2, it was possible to calculate the effects that the individual variables and their interactions had on the response. Seven effects, with three being first order (1, 2, and 3–individual variables), three second order (12, 13, and 23–interaction between two variables), and one third order (123–three variables), were calculated using the computational routine “fabi_efeito” (Pereira and Pereira-Filho, 2018). As shown in Figure 2, the most important effect, with a relative percentage of 67%, was for the interaction of variables 2 and 3, solvent volume and sonication time, respectively. Therefore, these two variables were tested at a greater number of levels, in a refinement process. Variable 1 (number of extractions) was the least important effect, so for the refinement process, the number of extractions was kept constant at its high level (+1), because despite being small, the effect was positive (Figure 2).
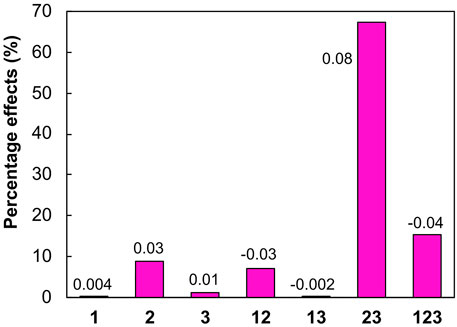
FIGURE 2. Percentage effects of variables 1 (number of extractions), 2 (solvent volume), and 3 (sonication time), and their interactions. The calculated effect values are provided next to each column.
The refinement was performed using a central composite design. With the exclusion of one variable, some experiments from the previous full factorial design were duplicated, so the overall desirability was calculated as the arithmetic mean. The experimental conditions of the central composite design (real and coded values) used for the refinement process are shown in Table 3, together with the overall desirability values.

TABLE 3. Central composite design used for the refinement process of the extraction conditions (solvent volume and sonication time), and the responses in terms of overall desirability (OD). The coded values are within parentheses.
A regression model was generated from the data in Table 3, using the computational routine “regression2” (Pereira and Pereira-Filho, 2018). The model showed a slight lack of fit, as the ratio between the calculated and tabulated F values was slightly greater than 1 (Supplementary Table S5). Despite this, the coefficients were calculated considering that there was no lack of fit in the model. The model was able to explain 48% of the variation (R2 = 0.4768), with a maximum explicable variation of 87% (R2max = 0.8720).
Considering only significant coefficients (confidence level = 95%), the following regression equation was obtained:
where, R is the response (overall desirability) and
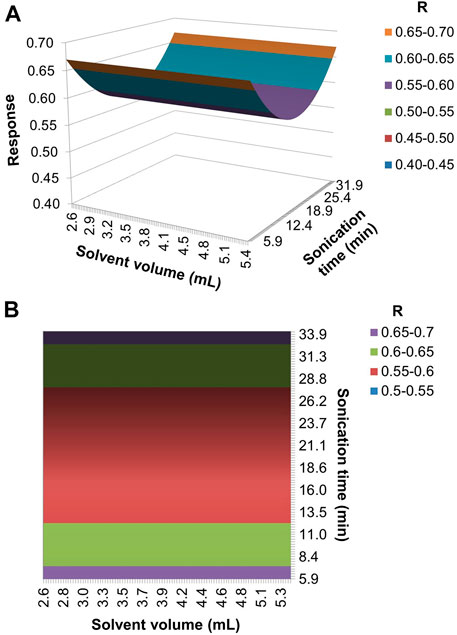
FIGURE 3. (A) Response surface and (B) contour graph for the model generated by the refinement of the extraction conditions optimization.
Since the volume of solvent did not influence the response, the intermediate volume of 4.0 ml was chosen, which minimized the volume of solvent, while ensuring that the entire filter was covered. The extraction time influenced the overall desirability, with the maximum responses obtained at the two extremes (6 and 34 min).
In order to determine the most appropriate time for the extraction, a sample of PM10 was analyzed, in triplicate, maintaining fixed the extraction solvent (acetonitrile), the solvent volume (4 ml), and the number of extractions (3), but using the two different sonication times. Most peak areas (74%) corresponding to the PAHs and their derivatives for the extraction times of 6 and 34 min were not statistically different (t-test, p = 0.05). The peak areas corresponding to pyrene, benzo[a]anthracene, chrysene-d12, chrysene, benzo[k]fluoranthene, benzo[e]pyrene, indeno-[1,2,3-cd]-pyrene, dibenzo [a,h]anthracene, and benzo[g,h,i]perylene were larger after 34 min of extraction (t-test, p = 0.05). Hence, the 34 min sonication extraction time was selected, since greater detectability may be essential for the determination of PAHs in particulate matter samples, due to their low concentrations in this matrix. Therefore, the final optimized method was:
1. The sampled membrane (area of 17.3 cm2) was cut into small pieces directly into a glass vessel.
2. A volume of 4.0 ml of acetonitrile was added into the vessel and ultrasonicated for 34 min.
3. After sonication, the solvent was transferred to a round-bottom flask.
4. Steps 2 and 3 were repeated twice, and the extracts were transferred to the same flask.
5. The combined solution was evaporated down to approximately 0.5 ml using a rotary evaporator.
6. The concentrated extract was filtered (0.22 µm) and dried under a gentle flow of nitrogen.
7. The remaining material was resuspended in 100 µl of acetonitrile and homogenized.
8. A volume of 2 µl of the final extract was injected into the GC-MS.
As described previously (Section 2.6.4), the commonly used extraction procedure is time-consuming and uses a total solvent volume of 375 ml (Alves et al., 2011; Urban et al., 2016). In comparison, the optimized method developed here uses 97% less solvent and shortens the analysis time by about 85%. Furthermore, the proposed method does not require an additional clean-up step, such as fractionation using a silica column, which is normally performed after Soxhlet extraction.
Another extraction method commonly used for the determination of PAHs in particulate matter by GC-MS is the one based on the ultrasonic extraction method number 3550C described by USEPA—United States Environmental Protection Agency (2007). In this method, four extractions with 50 ml of dichloromethane are performed in an ultrasonic bath, each for 15 min, followed by an additional extraction with 100 ml of dichloromethane for 20 min (Machado et al., 2009; Marques et al., 2009). This method is less time-consuming, compared to Soxhlet extraction, and the total extraction time is similar to that of the method proposed here. However, a relatively high amount of solvent is required for only one sample (total of 300 ml of dichloromethane). Guo et al. (2003) used an extraction method similar to the one based on USEPA method 3550C, with three ultrasonic extractions using 150 ml of dichloromethane for 30 min. However, a fractionation step was performed after the extraction, using a silica alumina column.
Other extractions have been proposed with the aim of minimizing the use of organic solvents, such as the one developed by Pereira et al. (2001), involving a single extraction with 4 ml of a mixture of acetonitrile:dichloromethane (3:1) in an ultrasonic bath. More recently, Ferreira et al. (2021) proposed a 3 min ultrasonic extraction using 50 ml of a 1:1 mixture of n-hexane:acetone. However, both methods were validated solely for determination of the 16 priority PAHs and were applied for the analysis of samples collected using high-volume samplers. A reported miniaturized extraction method with micro-extractors uses only 500 µl of 18% acetonitrile in dichloromethane (Santos et al., 2016). However, in the present work, previous recovery tests resulted in peak areas too close to the LOD, demonstrating that this method was unsuitable for samples collected using low-volume samplers (data not shown).
Despite the use of acetonitrile (which is potentially hazardous, since it can be metabolized to cyanide), the proposed method differed from the vast majority of the reported methods by being 100% free from dichloromethane, considered a red category chlorinated solvent, according to the principles of Green Chemistry (Joshi and Adhikari, 2019).
3.2 Method Validation
Validation of the method was performed according to the International Conference on Harmonization guidelines and the criteria suggested by IUPAC and AOAC International (IUPAC—International Union of Pure and Applied Chemistry, 2002; Jatinder, 2005; AOAC International, 2016).
The LOD was 1.0 ng ml−1 for most of the PAHs, 5.0 ng ml−1 for dibenzo [a,h]anthracene and some oxy-PAHs [1,4-benzoquinone, 1,4-naphthoquinone, 1-naphthaldehyde, 6H-benzo (cd)pyren-6-one] and nitro-PAHs (9-nitroanthracene and 9-nitrophenanthrene), and 10 ng ml−1 for 5-nitroacenaphthene, 2-nitrofluorene, 3-nitrofluoranthene, 1-nitropyrene, and 6-nitrobenzo [a]pyrene. The LOQ was 10 ng ml−1 for all the analytes, with the exception of 5-nitroacenaphthene (50 ng ml−1). The linear working range was from 10 to 500 ng ml−1 for all the analytes, with the exception of 5-nitroacenaphthene (from 50 to 500 ng ml−1). All the analytical curves presented good linearity, with linear correlation coefficients ranging from 0.990 to 0.999. All the LODs, LOQs, linear working ranges, equations, and correlation coefficients (r) are provided in Supplementary Table S6.
LOQs and linear correlation coefficients were not assigned for the following analytes: 1,4-benzoquinone, acetophenone, naphthalene, 1,4-naphthoquinone, acenaphthylene, acenaphthene, and 1-naphthaldehyde. These PAHs and oxy-PAHs have the lowest molecular weights of the compounds analyzed and are the most volatile. Consequently, they were probably lost during the solvent evaporation steps of the method and could not be quantified.
The relative standard deviations (RSDs) were in the ranges 1–16%, 1–19%, and 2–16% for low (100 ng ml−1), medium (300 ng ml−1), and high concentrations (500 ng ml−1), respectively (Supplementary Table S7). Considering that the concentrations of the analytes were low (100–500 ng ml−1) and that a variation of up to 21% is permissible at this level (AOAC International, 2016), it could be considered that the RSDs were within an acceptable range and that the optimized method presented satisfactory precision.
The accuracy of the method was assessed in two ways, by spiking/recovery assays, employing the sample matrix, and by comparison with a reference method. The mean recoveries of the compounds from the sample matrix were in the ranges 76–128% (PAHs), 80–117% (oxy-PAHs), and 48–113% (nitro-PAHs) (Table 4). Although the recovery range normally accepted is from 80 to 110% for analytes present in low concentrations (∼100 ng ml−1), the recoveries obtained here could be considered satisfactory, since determination was made of a large number of analytes in a complex matrix, as is the case for atmospheric particulate matter (IUPAC—International Union of Pure and Applied Chemistry, 2002; AOAC International, 2016). Furthermore, in order to correct for low or high recovery of some analytes, analytical curves were constructed with standards that passed through the extraction process.
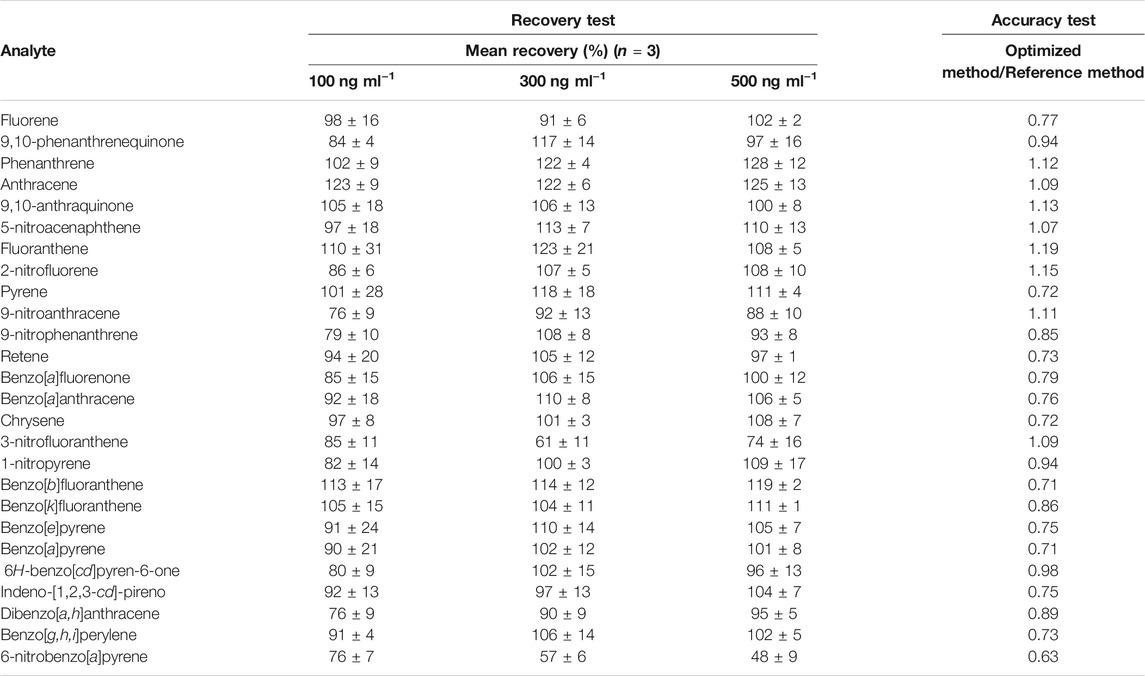
TABLE 4. Mean recoveries of the analytes determined (in triplicate) in spiked PM10 samples, at three different concentrations. Accuracy test is also presented and it was evaluated by the ratios of the signals obtained using the optimized method here proposed and the reference method according to Alves et al., 2011.
The fine fractions (d < 1 µm) of two PM samples collected in parallel at the same site, using two identical low-volume samplers, were extracted according to the optimized method and the reference method. The methods were in good agreement, as shown by the ratios between the signal responses obtained for the two methods, which ranged from 0.63 to 1.19 (Table 4).
The optimized extraction method also proved to be suitable for the determination of levoglucosan at a concentration of 1,000 ng ml−1 (at the low end of concentrations expected for this type of sample), with a recovery of 93 ± 6%. This showed the capacity for expanding the application range of the optimized method. The same extract used for determination of the PAHs by GC-MS could subsequently be derivatized and used for the determination of levoglucosan, also by GC-MS.
3.3 Application of the Method Using an Environmental Sample
In order to illustrate the application of the optimized extraction method, one outdoor PM sample collected in the city of Ribeirão Preto (São Paulo State, Brazil), using a low-volume impactor, was extracted and analyzed. Table 5 presents the mass of each sample fraction, and the concentrations of PAHs and derivatives. It was possible to quantify the analytes in the PM fractions analyzed, at very low concentrations (on the order of pg m−3).
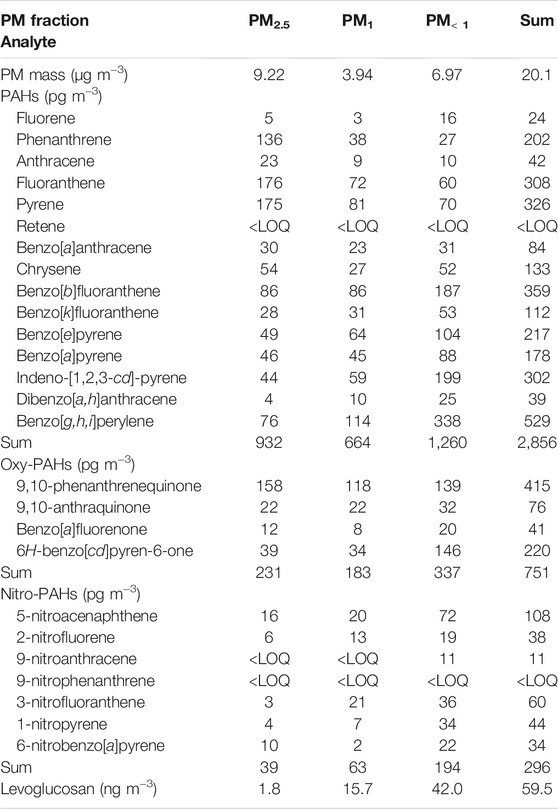
TABLE 5. PM mass (µg m−3), concentrations of PAHs, oxy-PAHs, nitro-PAHs (pg m−3), and levoglucosan (ng m−3) in the fractionated PM sample.
The sum concentrations of the PAHs and derivatives found in the present work were within the concentration ranges generally reported in the literature for Brazilian and other Latin-American cities (Souza et al., 2014; de Oliveira Alves et al., 2015; Urban et al., 2016; de Oliveira Galvão et al., 2018; Pereira et al., 2019; Ferreira et al., 2021).
The sum concentration of levoglucosan obtained here was within the lower portion of the range found for other semi-industrial cities in São Paulo State (Urban et al., 2014), but was similar to the concentrations reported for PM10 samples collected in the Amazon in the wet season (de Oliveira Alves et al., 2015). A larger number of results and an environmentally relevant discussion will be presented elsewhere.
4 Conclusion
The selection of a suitable extraction method depends on a variety of factors, including the amount of available sample matrix, the expected concentration of the analytes, and the availability and cost of the instrumentation.
The extraction method proposed here for the determination of PAHs and their derivatives (nitro- and oxy-PAHs) in aerosol samples was optimized using multivariate design of experiments.
The final optimized conditions were three extractions of a membrane area of 17.3 cm2 with 4.0 ml of acetonitrile, under sonication for 34 min.
The method presented here is based on ultrasonic extraction, which is simpler and less time consuming, compared to other extraction techniques, such as Soxhlet refluxing. The new method enabled economization of 97% in the solvent volume, with no need to use dichloromethane, a potentially hazardous chemical.
The method showed good accuracy and precision, with low limits of quantification, and can be applied for the analysis of particulate matter samples collected by both high- and low-volume samplers. It is an excellent alternative to the extraction methods most commonly reported in the literature.
Data Availability Statement
The original contributions presented in the study are included in the article/Supplementary Material, further inquiries can be directed to the corresponding author.
Author Contributions
CS, JN, GG, and RU conceived the ideas and designed the study. CS, JN, RN, NR, JC, GG, and RU conducted the experiments and the chemometric analysis. CS and JC collected samples. CS, JN, RN, JC, GG, MC, PF, and RU analyzed the data. CS and JN wrote the first draft of this manuscript. All authors contributed to the final version and gave approval for publication.
Funding
RU and MC are grateful for financial support provided by the São Paulo State Research Foundation (FAPESP, process numbers #2018/04820-6 and #2018/16554-9) and INCTAA (CNPq, process number #465768/2018-8; FAPESP, process number #2014/50951-4). This study was financed in part by Coordenação de Aperfeiçoamento de Pessoal de Nível Superior—Brasil (CAPES, Finance Code 001). Student grants were provided to CS (FAPESP, #2018/17931-0), JB Neris (CNPq), RN (CAPES), NC (FAPESP, #2020/04084-8), and JC (CAPES).
Conflict of Interest
The authors declare that the research was conducted in the absence of any commercial or financial relationships that could be construed as a potential conflict of interest.
Publisher’s Note
All claims expressed in this article are solely those of the authors and do not necessarily represent those of their affiliated organizations, or those of the publisher, the editors and the reviewers. Any product that may be evaluated in this article, or claim that may be made by its manufacturer, is not guaranteed or endorsed by the publisher.
Acknowledgments
The authors also thank E. R. Pereira-Filho for productive discussions.
Supplementary Material
The Supplementary Material for this article can be found online at: https://www.frontiersin.org/articles/10.3389/fenvs.2021.742251/full#supplementary-material
References
Abbas, I., Badran, G., Verdin, A., Ledoux, F., Roumié, M., Courcot, D., et al. (2018). Polycyclic Aromatic Hydrocarbon Derivatives in Airborne Particulate Matter: Sources, Analysis and Toxicity. Environ. Chem. Lett. 16, 439–475. doi:10.1007/s10311-017-0697-0
Alves, C. (2005). Aerossóis atmosféricos: perspectiva histórica, fontes, processos químicos de formação e composição orgânica. Quím. Nova 28, 859–870. doi:10.1590/S0100-40422005000500025
Alves, C. A., Vicente, A., Monteiro, C., Gonçalves, C., Evtyugina, M., and Pio, C. (2011). Emission of Trace Gases and Organic Components in Smoke Particles from a Wildfire in a Mixed-evergreen forest in Portugal. Sci. Total Environ. 409, 1466–1475. doi:10.1016/j.scitotenv.2010.12.025
AOAC International (2016). Appendix F: Guidelines for Standard Method Performance Requirements. In AOAC Official Methods of Analysis. Editors G. W. Latimer Jr (Rockville, MD: AOAC INTERNATIONAL), 1–18.
Balducci, C., Cecinato, A., Paolini, V., Guerriero, E., Perilli, M., Romagnoli, P., et al. (2018). Volatilization and Oxidative Artifacts of PM Bound PAHs Collected at Low Volume Sampling (1): Laboratory and Field Evaluation. Chemosphere 200, 106–115. doi:10.1016/j.chemosphere.2018.02.090
Boongla, Y., Orakij, W., Nagaoka, Y., Tang, N., Hayakawa, K., and Toriba, A. (2017). Simultaneous Determination of Polycyclic Aromatic Hydrocarbons and Their Nitro-derivatives in Airborne Particulates by Using Two-Dimensional High-Performance Liquid Chromatography with On-Line Reduction and Fluorescence Detection. ajae 11, 283–299. doi:10.5572/ajae.2017.11.4.283
de Oliveira Alves, N., Brito, J., Caumo, S., Arana, A., de Souza Hacon, S., Artaxo, P., et al. (2015). Biomass Burning in the Amazon Region: Aerosol Source Apportionment and Associated Health Risk Assessment. Atmos. Environ. 120, 277–285. doi:10.1016/j.atmosenv.2015.08.059
de Oliveira Alves, N., Vessoni, A. T., Quinet, A., Fortunato, R. S., Kajitani, G. S., Peixoto, M. S., et al. (2017). Biomass Burning in the Amazon Region Causes DNA Damage and Cell Death in Human Lung Cells. Sci. Rep. 7, 1–13. doi:10.1038/s41598-017-11024-3
de Oliveira Galvão, M. F., de Oliveira Alves, N., Ferreira, P. A., Caumo, S., de Castro Vasconcellos, P., Artaxo, P., et al. (2018). Biomass Burning Particles in the Brazilian Amazon Region: Mutagenic Effects of nitro and Oxy-PAHs and Assessment of Health Risks. Environ. Pollut. 233, 960–970. doi:10.1016/j.envpol.2017.09.068
Delhomme, O., Herckes, P., and Millet, M. (2007). Determination of nitro-polycyclic Aromatic Hydrocarbons in Atmospheric Aerosols Using HPLC Fluorescence with a post-column Derivatisation Technique. Anal. Bioanal. Chem. 389, 1953–1959. doi:10.1007/s00216-007-1562-y
Eiguren-Fernandez, A., and Miguel, A. H. (2003). Determination of Semivolatile and Particulate Polycyclic Aromatic Hydrocarbons in SRM 1649a and PM 2.5 Samples by HPLC-Fluorescence. Polycyclic Aromatic Compd. 23, 193–205. doi:10.1080/10406630308057
Ferreira, R., Nunes, C., Souza, M., and Canela, M. (2021). Multivariate Optimization of Extraction Variables of PAH in Particulate Matter (PM10) in Indoor/Outdoor Air at Campos Dos Goytacazes, Brazil. J. Braz. Chem. Soc. 32, 618–625. doi:10.21577/0103-5053.20200216
Ferreira, S. L. C., Bruns, R. E., da Silva, E. G. P., dos Santos, W. N. L., Quintella, C. M., David, J. M., et al. (2007). Statistical Designs and Response Surface Techniques for the Optimization of Chromatographic Systems. J. Chromatogr. A 1158, 2–14. doi:10.1016/j.chroma.2007.03.051
Gamela, R. R., Costa, V. C., and Pereira-Filho, E. R. (2020). Multivariate Optimization of Ultrasound-Assisted Extraction Procedure for the Determination of Ca, Fe, K, Mg, Mn, P, and Zn in Pepper Samples by ICP OES. Food Anal. Methods 13, 69–77. doi:10.1007/s12161-019-01524-5
Gratz, L. D., Bagley, S. T., Leddy, D. G., Johnson, J. H., Chiu, C., and Stommel, P. (2000). Interlaboratory Comparison of HPLC-Fluorescence Detection and GC/MS: Analysis of PAH Compounds Present in Diesel Exhaust. J. Hazard. Mater. 74, 37–46. doi:10.1016/s0304-3894(99)00197-1
Guo, H., Lee, S. C., Ho, K. F., Wang, X. M., and Zou, S. C. (2003). Particle-associated Polycyclic Aromatic Hydrocarbons in Urban Air of Hong Kong. Atmos. Environ. 37, 5307–5317. doi:10.1016/j.atmosenv.2003.09.011
Harrison, R. M. (2020). Airborne Particulate Matter. Phil. Trans. R. Soc. A. 378, 20190319. doi:10.1098/rsta.2019.0319
Hong, Y., Xu, X., Liao, D., Ji, X., Hong, Z., Chen, Y., et al. (2021). Air Pollution Increases Human Health Risks of PM2.5-bound PAHs and nitro-PAHs in the Yangtze River Delta, China. Sci. Total Environ. 770, 145402. doi:10.1016/j.scitotenv.2021.145402
IARC – International Agency for Research on Cancer (2010). Some Non-heterocyclic Polycyclic Aromatic Hydrocarbons and Some Related Exposures. Lyon, France. doi:10.1002/14356007.a04
Idowu, O., Semple, K. T., Ramadass, K., O'Connor, W., Hansbro, P., and Thavamani, P. (2019). Beyond the Obvious: Environmental Health Implications of Polar Polycyclic Aromatic Hydrocarbons. Environ. Int. 123, 543–557. doi:10.1016/j.envint.2018.12.051
IUPAC - International Union of Pure and Applied Chemistry (2002). Harmonized Guidelines for Single-Laboratory Validation of Methods of Analysis. Pure Appl. Chem. 74, 835–855. doi:10.1351/pac200274050835
ICH Harmonised Tripartite Guideline (2005). Validation of Analytical Procedures: Text and Methodology Q2(R1). J. Pharmacol. Pharmacother.. Available at: https://database.ich.org/sites/default/files/Q2%28R1%29%20Guideline.pdf (Accessed October 13, 2021).
Joshi, D. R., and Adhikari, N. (2019). An Overview on Common Organic Solvents and Their Toxicity. Jpri 28, 1–18. doi:10.9734/jpri/2019/v28i330203
Kameda, T. (2011). Atmospheric Chemistry of Polycyclic Aromatic Hydrocarbons and Related Compounds. J. Health Sci. 57, 504–511. doi:10.1248/jhs.57.504
Kelly, F. J., and Fussell, J. C. (2012). Size, Source and Chemical Composition as Determinants of Toxicity Attributable to Ambient Particulate Matter. Atmos. Environ. 60, 504–526. doi:10.1016/j.atmosenv.2012.06.039
Khan, M. B., Masiol, M., Bruno, C., Pasqualetto, A., Formenton, G. M., Agostinelli, C., et al. (2018). Potential Sources and Meteorological Factors Affecting PM2.5-bound Polycyclic Aromatic Hydrocarbon Levels in Six Main Cities of Northeastern Italy: an Assessment of the Related Carcinogenic and Mutagenic Risks. Environ. Sci. Pollut. Res. 25, 31987–32000. doi:10.1007/s11356-018-2841-1
Kim, K.-H., Jahan, S. A., Kabir, E., and Brown, R. J. C. (2013). A Review of Airborne Polycyclic Aromatic Hydrocarbons (PAHs) and Their Human Health Effects. Environ. Int. 60, 71–80. doi:10.1016/j.envint.2013.07.019
Liaud, C., Millet, M., and Le Calvé, S. (2015). An Analytical Method Coupling Accelerated Solvent Extraction and HPLC-Fluorescence for the Quantification of Particle-Bound PAHs in Indoor Air Sampled with a 3-stages cascade Impactor. Talanta 131, 386–394. doi:10.1016/j.talanta.2014.05.027
Lim, H., Sadiktsis, I., de Oliveira Galvão, M. F., Westerholm, R., and Dreij, K. (2021). Polycyclic Aromatic Compounds in Particulate Matter and Indoor Dust at Preschools in Stockholm, Sweden: Occurrence, Sources and Genotoxic Potential In Vitro. Sci. Total Environ. 755, 142709. doi:10.1016/j.scitotenv.2020.142709
Ma, L., Li, B., Liu, Y., Sun, X., Fu, D., Sun, S., et al. (2020). Characterization, Sources and Risk Assessment of PM2.5-bound Polycyclic Aromatic Hydrocarbons (PAHs) and Nitrated PAHs (NPAHs) in Harbin, a Cold City in Northern China. J. Clean. Prod. 264, 121673. doi:10.1016/j.jclepro.2020.121673
Machado, M. C. S., Loyola, J., Quiterio, S. L., Rocha, G. O. d., Andrade, J. B. d., and Arbilla, G. (2009). Particle-associated polycyclic aromatic hydrocarbons and their dry deposition fluxes from a bus-station in the Rio de Janeiro Metropolitan area, Brazil. J. Braz. Chem. Soc. 20, 1565–1573. doi:10.1590/S0103-50532009000900002
Marques, L. F. C. S., Arbilla, G., Quiterio, S. L., and Machado, M. C. S. (2009). Particle-associated polycyclic aromatic hydrocarbons in a suburban region of Rio de Janeiro, Brazil, with industrial and traffic emissions. J. Braz. Chem. Soc. 20, 518–529. doi:10.1590/S0103-50532009000300017
Nováková, Z., Novák, J., Kitanovski, Z., Kukučka, P., Smutná, M., Wietzoreck, M., et al. (2020). Toxic Potentials of Particulate and Gaseous Air Pollutant Mixtures and the Role of PAHs and Their Derivatives. Environ. Int. 139, 105634. doi:10.1016/j.envint.2020.105634
Ohno, T., Toriba, A., Kameda, T., Tang, N., and Hayakawa, K. (2009). Determination of 1-nitropyrene in Low Volume Ambient Air Samples by High-Performance Liquid Chromatography with Fluorescence Detection. J. Chromatogr. A 1216, 4625–4628. doi:10.1016/j.chroma.2009.03.070
Pereira, F. M. V., and Pereira-Filho, E. R. (2018). Application of Free Computational Program in Experimental Design: a Tutorial. Quim. Nova 41, 1061–1071.
Pereira, G. M., Oraggio, B., Teinilä, K., Custódio, D., Huang, X., Hillamo, R., et al. (2019). A Comparative Chemical Study of PM10 in Three Latin American Cities: Lima, Medellín, and São Paulo. Air Qual. Atmos. Health 12, 1141–1152. doi:10.1007/s11869-019-00735-3
Pereira, P. A. d. P., Andrade, J. B. d., and Miguel, A. H. (2001). Determination of 16 Priority Polycyclic Aromatic Hydrocarbons in Particulate Matter by HRGC-MS after Extraction by Sonication. Anal. Sci. 17, 1229–1231. doi:10.2116/analsci.17.1229
Pereira-Filho, E. R. (2015). Planejamento fatorial em química: maximizando a obtenção de resultados. São Carlos: EdUFSCar.
Rodríguez-Urrego, D., and Rodríguez-Urrego, L. (2020). Air Quality during the COVID-19: PM2.5 Analysis in the 50 Most Polluted Capital Cities in the World. Environ. Pollut. 266, 115042. doi:10.1016/j.envpol.2020.115042
Santos, A. G., Regis, A. C. D., da Rocha, G. O., Bezerra, M. d. A., de Jesus, R. M., and de Andrade., J. B. (2016). A Simple, Comprehensive, and Miniaturized Solvent Extraction Method for Determination of Particulate-phase Polycyclic Aromatic Compounds in Air. J. Chromatogr. A 1435, 6–17. doi:10.1016/j.chroma.2016.01.018
Senthil Kumar, S., Muthuselvam, P., Pugalenthi, V., Subramanian, N., Ramkumar, K. M., Suresh, T., et al. (2018). Toxicoproteomic Analysis of Human Lung Epithelial Cells Exposed to Steel Industry Ambient Particulate Matter (PM) Reveals Possible Mechanism of PM Related Carcinogenesis. Environ. Pollut. 239, 483–492. doi:10.1016/j.envpol.2018.04.049
Sevimoglu, O., and Rogge, W. F. (2015). Organic Compound Concentrations of Size-Segregated PM10 during Sugarcane Burning and Growing Seasons at a Rural and an Urban Site in Florida, USA. Aerosol Air Qual. Res. 15, 1720–1736. doi:10.4209/aaqr.2015.02.0069
Simoneit, B. R. T., Schauer, J. J., Nolte, C. G., Oros, D. R., Elias, V. O., Fraser, M. P., et al. (1999). Levoglucosan, a Tracer for Cellulose in Biomass Burning and Atmospheric Particles. Atmos. Environ. 33, 173–182. doi:10.1016/S1352-2310(98)00145-9
Song, L., Liu, X., Skiba, U., Zhu, B., Zhang, X., Liu, M., et al. (2018). Ambient Concentrations and Deposition Rates of Selected Reactive Nitrogen Species and Their Contribution to PM2.5 Aerosols at Three Locations with Contrasting Land Use in Southwest China. Environ. Pollut. 233, 1164–1176. doi:10.1016/j.envpol.2017.10.002
Souza, K. F., Carvalho, L. R. F., Allen, A. G., and Cardoso, A. A. (2014). Diurnal and Nocturnal Measurements of PAH, nitro-PAH, and Oxy-PAH Compounds in Atmospheric Particulate Matter of a Sugar Cane Burning Region. Atmos. Environ. 83, 193–201. doi:10.1016/j.atmosenv.2013.11.007
Sun, C., Qu, L., Wu, L., Wu, X., Sun, R., and Li, Y. (2020). Advances in Analysis of Nitrated Polycyclic Aromatic Hydrocarbons in Various Matrices. Trac Trends Anal. Chem. 127, 115878. doi:10.1016/j.trac.2020.115878
Turap, Y., Talifu, D., Wang, X., Aierken, T., Rekefu, S., Shen, H., et al. (2018). Concentration Characteristics, Source Apportionment, and Oxidative Damage of PM2.5-bound PAHs in Petrochemical Region in Xinjiang, NW China. Environ. Sci. Pollut. Res. 25, 22629–22640. doi:10.1007/s11356-018-2082-3
Urban, R. C., Alves, C. A., Allen, A. G., Cardoso, A. A., and Campos, M. L. A. M. (2016). Organic Aerosols in a Brazilian Agro-Industrial Area: Speciation and Impact of Biomass Burning. Atmos. Res. 169, 271–279. doi:10.1016/j.atmosres.2015.10.008
Urban, R. C., Alves, C. A., Allen, A. G., Cardoso, A. A., Queiroz, M. E. C., and Campos, M. L. A. M. (2014). Sugar Markers in Aerosol Particles from an Agro-Industrial Region in Brazil. Atmos. Environ. 90, 106–112. doi:10.1016/j.atmosenv.2014.03.034
Urban, R. C., Lima-Souza, M., Caetano-Silva, L., Queiroz, M. E. C., Nogueira, R. F. P., Allen, A. G., et al. (2012). Use of Levoglucosan, Potassium, and Water-Soluble Organic Carbon to Characterize the Origins of Biomass-Burning Aerosols. Atmos. Environ. 61, 562–569. doi:10.1016/j.atmosenv.2012.07.082
USEPA - United States Environmental Protection Agency (2007). Method 3550C - Ultrasonic Extraction. Washington, DC: US Government Printing Office, 1–17. Available at: https://www.epa.gov/sites/default/files/2015-12/documents/3550c.pdf (Accessed October 13, 2021).
Van Drooge, B. L., and Ballesta, P. P. (2009). Seasonal and Daily Source Apportionment of Polycyclic Aromatic Hydrocarbon Concentrations in PM10 in a Semirural European Area. Environ. Sci. Technol. 43, 7310–7316. doi:10.1021/es901381a
van Drooge, B. L., Prats, R. M., Reche, C., Minguillón, M., Querol, X., Grimalt, J. O., et al. (2018). Origin of Polycyclic Aromatic Hydrocarbons and Other Organic Pollutants in the Air Particles of Subway Stations in Barcelona. Sci. Total Environ. 642, 148–154. doi:10.1016/j.scitotenv.2018.06.032
Zhang, Q., Liu, P., Li, S., Zhang, X., and Chen, M. (2020a). Progress in the Analytical Research Methods of Polycyclic Aromatic Hydrocarbons (PAHs). J. Liquid Chromatogr. Relat. Tech. 43, 425–444. doi:10.1080/10826076.2020.1746668
Keywords: PAH, oxy-PAH, nitro-PAH, particulate matter, design of experiments, green chemistry, levoglucosan
Citation: Scaramboni C, Neris JB, do Nascimento RdKS, Chiaranda da Rosa NL, Carvalho JS, Grosseli GM, Campos MLAM, Fadini PS and Urban RC (2021) Optimization of a Low Volume Extraction Method to Determine Polycyclic Aromatic Hydrocarbons in Aerosol Samples. Front. Environ. Sci. 9:742251. doi: 10.3389/fenvs.2021.742251
Received: 15 July 2021; Accepted: 05 October 2021;
Published: 04 November 2021.
Edited by:
Anja H. Tremper, Imperial College London, United KingdomReviewed by:
Sanja Potgieter, Manchester Metropolitan University, United KingdomSilvia Mosca, Istituto sull’Inquinamento Atmosferico (IIA), Italy
Orhan Sevimoğlu, Gebze Technical University, Turkey
Copyright © 2021 Scaramboni, Neris, do Nascimento, Chiaranda da Rosa, Carvalho, Grosseli, Campos, Fadini and Urban. This is an open-access article distributed under the terms of the Creative Commons Attribution License (CC BY). The use, distribution or reproduction in other forums is permitted, provided the original author(s) and the copyright owner(s) are credited and that the original publication in this journal is cited, in accordance with accepted academic practice. No use, distribution or reproduction is permitted which does not comply with these terms.
*Correspondence: Roberta Cerasi Urban, cm9iZXJ0YS51cmJhbkB1ZnNjYXIuYnI=
†These authors have contributed equally to this work and share first authorship