 Christian Orobello
 Giuseppe T. Cirella
- Faculty of Economics, University of Gdansk, Sopot, Poland
Water is a rapidly shrinking commodity. As we continue to use water for industry, farming, and sustaining our own lives, we must realize its intrinsic value. In December of 2020, water was given a new value as a future on a commodities market. This paper aims to discuss the practical, ethical, and financial considerations of trading water in this manner. A thorough conceptual analysis of the literature and research from 2009 to 2020 related to commodities and their history was performed, and a more contemporary review of water policy and pricing. The goal is to develop a mixed solution that gives value to water without allowing it to be exploited to the detriment of the poor; water must be accessible and affordable if it is to be managed ethically. Approaching water as a high-value resource might create a market that makes it unobtainable for most of us; however, with a system that controls pricing, creates standards, and simultaneously works to increase the supply of water, we may be able to create a “market.” Our critique of the research and available solutions indicates rising water prices and mostly regressive policies. As a result, market controls need to be implemented to control pricing while ensuring water availability for all.
Introduction
The first waterworks in the United States was built in 1802. Over the next 80 years, there would be over 600 waterworks nationwide (Stets, 2015)—increasing access, use, and cyclic supply and demand that would aid in the country’s development. The advent of indoor plumbing created an ease in water use, which also increased its usage (Lutz, 2004). Consequently, water scarcity created a shift from solely an intrinsic value of water to include its financialization. In California, the agricultural sector uses the most water in the state. California has the seventh-largest economy globally, in which agriculture accounts for USD 47.1 billion of the state’s gross domestic product (GDP). This is 2% of the overall GDP of the state, the largest in any American state, amounting to more than 12.5% of the country’s agricultural production (Manley, 2017). As a whole, this demonstrates how vital water is to the economy of California. The ability to predict the price of crops prior to their sale through a futures market has been invaluable to farmers and traders alike. The evolution of these markets required many incarnations and changes as it was developed over several thousand years. The idea of speculation created a separate market where betting on price fluctuations for profit was the goal. For instance, the rising price of tulips and the speculation on these prices continuing to go up in the Netherlands perhaps created the first bubble in the market that burst in the early 1600s “Tulipmania,” as it was called, is an example of the “animal spirits” theory (Keynes, 1936), where a herd mentality can create a frenzy. This type of behavior, of course, is an argument against trading commodities and perhaps is what we are seeing in the cryptocurrency markets today. When futures markets were developed, the quality of the goods needed to be a component of pricing, as seen in the Dojima Rice Exchange during the Edo period (1,603–1,867). The theory is that by tracking the prices both before the development of the exchange and after, it can be shown that the exchange reduced the amount of volatility in the price (Algieri, 2018). In the 1800s, the first commodities market was established in the United States. This exchange was based in Chicago, and it became the focus of grain exchange. The creation of a grading system and institution where grades could be better guaranteed had a significant impact on the price of the grain. These improvements gave confidence to farmers and investors and started futures trading based on this institutional confidence (Algieri, 2018). Price stabilization took some of the guesswork out of farming, and futures made it possible for farmers to have more predictive revenue streams. The financialization of commodities made capital more accessible to farmers. Still, it may also have sparked outsized growth of agri-business and made small to medium-sized farmers more at risk [e.g., volatility similar to that of the Dojima Rice Exchange experiment of 7.20% (Algieri, 2018; Hamori et al., 2001; Shi et al., 2016)]. This conceptual analysis aims to look more closely at the motivating factors for water as a commodity and gathers data from several sources and critiques the findings as well as makes some recommendations for alternate solutions that conserve, control price, and make water accessible to the poor. As the change in water pricing happened only recently, there is little data. We have gathered information from other areas of commodities trading, other communities of water scarcity, and used this information to look at the possible solutions and remedies for this problem. Water must remain affordable if we are going to solve the problems ethically.
History of California Water Use
Since statehood in 1850, California has had issues with water use and distribution. As early as 1860, California began building levees and coopting water from natural areas to its growing cities. This resulted in flooding of the valley 2 years later. Additionally, water rights and the actual water available have never been the same. There has always been less water available than promised. California has been growing cities with the idea that there would be water to service these cities and that it essentially does not exist. The California Water Impact Network (C-WIN) has determined that there are 29 million-acre/ft of water available in the Delta network, but 153.7 million acres/ft of water rights claims on this water. Former Governor Earl Warren stated that there is not enough water to meet the obligations. The very idea of water claims, also known as paper water, is part of the problem. This paper water are claims on water, and as noted above, exceed actual water by a factor of 5.5. This means there are five and a half times more claims on water than existing water (C-WIN, 2021).
In a market where demand outpaces supply by a factor of 5.5, price issues arise, creating a threat for those relying on this water. In fact, water system development, since statehood, has almost entirely been funded by local fees paid by consumers on their water bills. From 2008–2011, 84% of spending was funded locally, with state sources and federal coming in a distant second and third, respectively (Hanak et al., 2014). These fees come in several incarnations: service fees, property assessments, permit fees, and developer fees. Service fees are typically fixed fees on water bills paid by consumers (i.e., individuals and businesses). Property assessments are a surcharge assessed on a property tax bill for improvements in water service for the home or the community. Developer fees, or better known as “connection fees,” are one-time fees assessed when a permit for new water service or water service upgrade is pulled. Permit fees are assessed when a pollution permit is given. These fees are one way to pay for infrastructure upgrades or maintenance. This can also be funded through taxes, fines, and bonds, but historically most of the cost has been passed on to the consumer in one way or another.
Water supply and wastewater rates are exempt from voter approval in California, which means that with further restrictions on property taxes made through changes to the state constitution over the past 4 decades, there are fewer options for raising the funds necessary to shore up the water infrastructure. These fees are disproportionally harmful to the poor and amount to a regressive tax. The most significant expenditure in the water system, accounting for more than 85% of spending, is water supply and wastewater. Although the quality of California’s water supply is good, the quantity is limited. California has used its infrastructure to ensure safe drinking water and treatment of wastewater; there is little the state can do about the dwindling supply. These investments have a cost and, as was demonstrated earlier, that cost is mainly supported through consumers’ water bills. Over the last decade, there has been astronomical growth in water bills, far outpacing the consumer price index (CPI). In the 10 years outlined in Figure 1, we can see that prices have increased at a faster rate than the CPI, which saw roughly a 25% increase, whereas San Diego increased 125% over the 2000 levels, meaning the price of water in San Diego doubled in that period. California has declining water use since 1980 but remains the state using the most water in the United States (Brandt et al., 2014). In 2016, Californians on average used 85 gallons of water per person per day, with the most significant usage over the summer months, when this rose to 120 gallons per day, and the lowest was in the cooler months with 64 gallons per day (Brown, 2017). Although there has been a trend since 1980 of falling use, we can see in the summer months of 2016 there is an increase over the 2015 levels. This can be attributed to an easing of conservation measures during that time. We see a reduced use moving forward, linked to increased precipitation during that period (Brown, 2017). Overall, it seems that there continued to be a reduction, or at least a level use from 2015–2016 but the spike at easing restrictions is a cause for concern. This and other data show that regulations such as water bans, low flow fixtures, and turf replacement make a difference; human behavior changes are also impactful on the annual usage numbers.
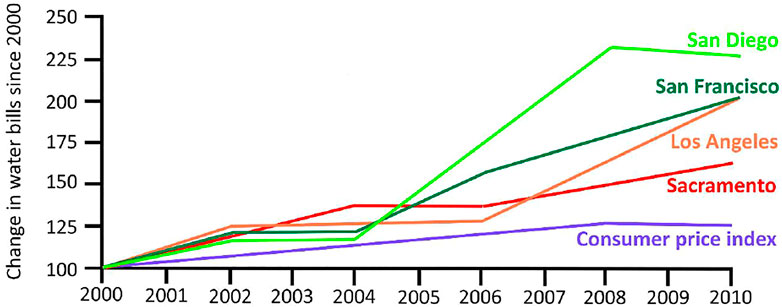
FIGURE 1. Change in water bills in California’s major cities, 2000–2010. Note: bill levels in 2000 = 100. Source: Hanak et al. (2014).
Does price impact usage? As stated in Figure 1, the price has steadily been increasing at a rate, in some cases, 100% higher than the CPI; however, is there a direct link between this and the amount of water used? What is the price elasticity of water? Water demand must first be understood. Water use reduction methods have effectively reduced the strain on the water system; however, there is a floor to the reduction households can make without negatively impacting their lives. There is no good substitute for water, and once all water waste has been eliminated, there is little more that can be done from the demand perspective. This elasticity can be looked at from two different angles, consumption as a function of price elasticity, i.e., is the consumption reduced as the price goes up? The other is to look at water consumption as a function of income elasticity. As the income of a family rises, does their water use rise as well? Based on the research, it appears that on the whole, assuming household water use is homogeneous, which of course it is not, price is inelastic (Arbués et al., 2003; Mazzanti and Montini, 2010; Reynaud and Romano, 2018). This means that water decreases less than one percent for every one percent increase in price (Sebri, 2013; Arbués et al., 2010; Reynaud and Romano, 2018).
Water use, however, is heterogeneous, and so is the price elasticity; the less essential the use, the more elastic the price. Human consumption is inelastic; however, leisure use (i.e., gardening and swimming pools) is more elastic. It seems that the more control we have over the use (i.e., is it discretionary or not?), the more elastic the price is. In this same vein, single-person households are the most price elastic; they also have the most control over household behavior. “Domestic water use is positively correlated with income,” as found in Reynaud and Romano’s (2018) economic analysis of residential water use. Increased income changes the household, and with it, there is an increased propensity for appliances that use greater volumes of water and additional recreational uses. This must be balanced by the fact that more affluent households will also have more modern appliances. If non-price policy (NPP) supports water-restricting regulations on these appliances, this may help balance the water use of more affluent households.
There are other influences on water usage. Climate, household characteristics, and NNP as well. Wetter climates require less outside use of water, and therefore we can see less use than when an area is experiencing drought (Figure 2) (Brown, 2017). Household characteristics are also a factor in the measurement of use. Older houses may have more leaks, fewer water-restricted appliances and fixtures. Larger houses have more use, even if the number of people is the same (Reynaud and Romano, 2018). The age of the occupants is also a factor. Older people tend to consume less water than younger people (Reynaud and Romano, 2018). If a household comprises a homogeneous age group, we will see a decrease in water use as the age increases (Arbués et al., 2003; Reynaud and Romano, 2018). Finally, NPP has an impact on the use. There are three main categories of NPP: public education, technological improvements, and water restrictions. Education programs tend to have the most negligible impact on residential water use. This seems consistent with the fact that human consumption is the smallest sector of use within households (Arbués et al., 2003, Arbués et al., 2010; Sebri, 2013; Reynaud and Romano, 2018). Technological advances seem to have a mixed impact on water usage as these options, unless mandated, will be adopted by those who are already environmentally focused. So the adoption of low-flow fixtures and appliances is part of their overall environmentally conscious behavior. However, if these are mandated, we see changes in the long run; this disproportionally impacts the poor because these new appliances are more expensive and can be restrictive without government subsidies (Hellegers et al., 2008). Lastly, restrictions on water use, water bans, etc., have an impact on conservation; however, there needs to be a policing component of these policies to ensure compliance (Hellegers et al., 2008). Pricing may not be the best way to encourage conservation, although if used in a tiered pricing system where water is priced based on usage and other instruments such as mandated and government-supported technological adoptions in homes and restrictions, these may have an impact on water use. Pricing, however, may have a disproportionately negative impact on low-income households (Olmstead and Stavins, 2009). California lawmakers attempted to define 2% of household income being spent on water as unaffordable (Hanak et al., 2014); this did not pass into law but can still be used to measure affordability for our purposes. Statewide the share of households falling into this 2% or more of their income being spent on water is 13% (Hanak et al., 2014). Figure 3 illustrates how this information affects the whole state.
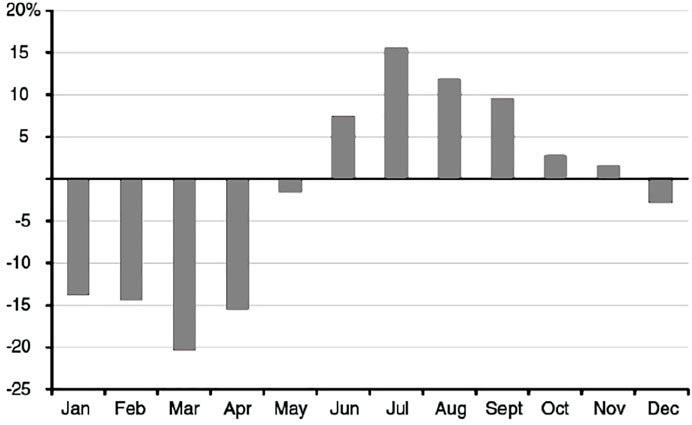
FIGURE 2. Water use in California, percentage change from 2015 to 2016. Note: restrictions were eased by the State Water Resources Control Board in May 2016. Source: Hanak et al. (2014).
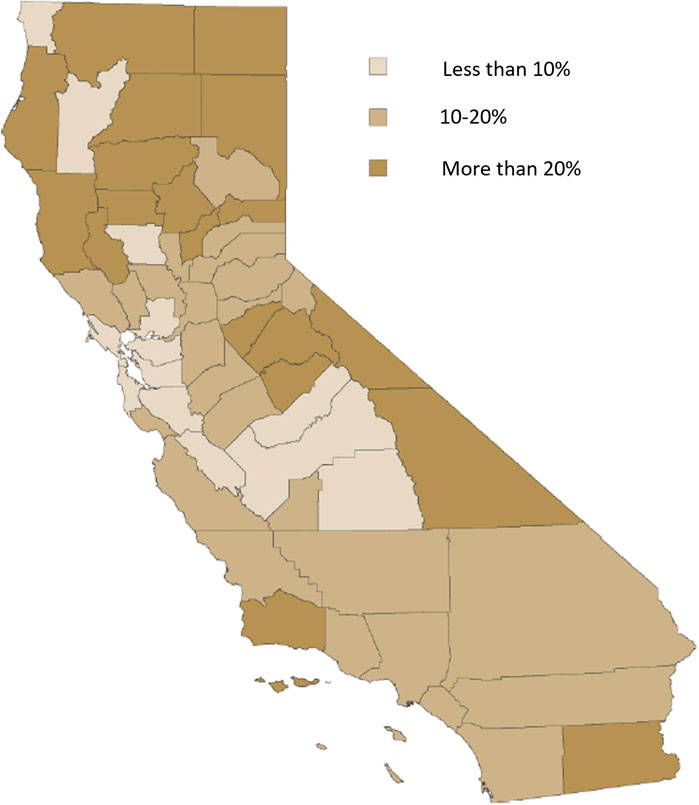
FIGURE 3. Share of California single family households with water bills exceeding 2%, 2014. Source: Hanak et al. (2014).
One way to address this issue is to use tiered billing, which allows for a basic minimum amount of water to be provided at an affordable price, with the price increasing at certain points in correlation with usage. Figure 4 shows the water rate structures that are most commonly used. Using water pricing structures to control demand can be dangerous and exacerbate the problem; however, using these prices to provide a minimum amount of water at a reasonable price can be for the common good. Currently, more than half of California’s water authorities use a tiered system. This is good news for the consumer but challenging for the sustainability of the water authority because 70–80% of their costs are fixed, and tiered pricing does not help minimize these costs or offset them. 2005–2015 was designated by the United Nations as the decade for action, i.e., “Water for Life.” Midway through this decade, it declared water as a human right stating that the right of everyone to sufficient, safe, acceptable, and physically accessible and affordable water for personal and domestic uses belongs to all humans (UN, 2010). The committee defined that sufficient water is 13–26 gallons a day and that affordability means that no more than 3% of the household income should be spent on water. To look at this in the context of California, we must first look at water use in the world. The United States uses more water than any other country per capita, and California uses the most water of any state. As noted in Figure 2, with a high of 120 gallons per person per day and a low of 64 gallons, still well above the 26 gallons that the United Nations says should be protected access.
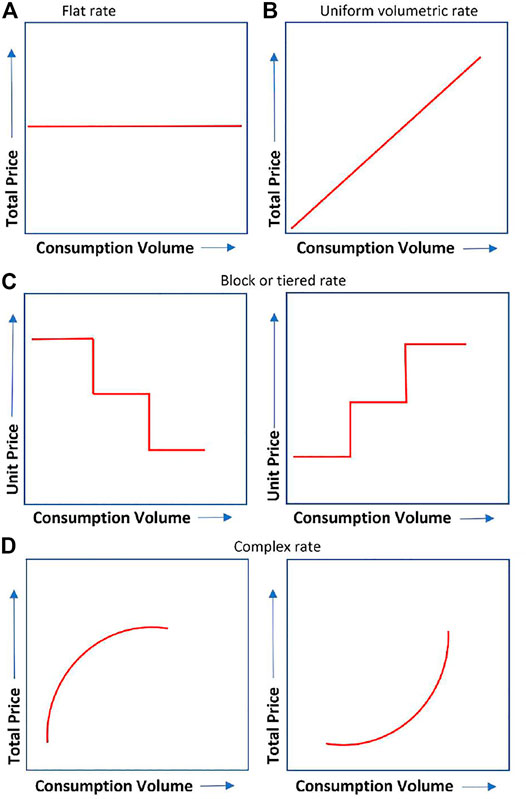
FIGURE 4. Tiered systems, adapted from Rios et al. (2018).
Water as a Commodity
Water future contracts started trading in September 2020. Nasdaq Veles California Water Indexes (NQH2O), managed by CME Group, allows farmers, hedge funds, and municipalities to bet against the price of water (Nasdaq, 2020). What will this mean for water pricing as it relates to the consumer? Through Circle of Blue, Walton and LaFond (2019) have tracked water prices in 30 of the United States’ largest cities. Although water prices have been increasing over the 10 years of the project from 2009–2019, they see a slowing of the increase over the last several years. Brett (Walton and LaFond, 2019) explains this in a podcast and figure on the Circle of Blue website. He says that most citizens are not paying for water but rather the delivery of that water through expensive infrastructure systems and the maintenance of these systems. Significant investments were made to these systems over the last decade, impacting pricing over those years; these investments are now paying off with less increased pricing more recently (Walton and LaFond, 2019).
The ability to control pricing for water by purchasing futures can help farmers and municipalities lock in a price so they can better predict this significant expense. Still, most water trading on this exchange will be done by investors who never plan to see the water they are betting on. They are merely buying and selling as they would any other commodity to profit on the spread between these two prices, hoping it works in their favor. “Our biggest concern is that if this becomes a profit-driven and popular way to trade on the value of water, it could eventually impact real water prices,” said Mike Wade, executive director of the California Farm Water Coalition (Wade, 2019). This, of course, is a considerable concern. What will drive the actual price of water will be these exchanges. It seems that speculation from outside investors could change the equation for farmers and consumers, and they are then chasing the price set by these speculators in a system where demand is already greater than the supply.
The way this works in practice is that water rights have been established over the past decade of water provision in the state. Some of these are lease agreements on reservoir or surface water; others maybe rights to treated wastewater, according to NQH2O (Nasdaq, 2020). In collaboration with WestWater Research (2021), a spot price for water is established each week on Wednesday. This price is an aggregate of the water prices for the state during that period of time. There is a complex price discovery mechanism in place to try and capture the spot price in a state where water variability is high. Variability of hydrology and supply are taken into account to determine this aggregate spot price. This information is critical in establishing a current valuation. Trade in water throughout the west is done through over 20 distinct regions; Figure 5 shows that Southern California is the largest such region (Nasdaq, 2020). NQH2O values the California water market at USD 1.1 billion. Although research into the broader commodities market has shown that over time there will be less volatility in the market, what will this innovation mean for the price? As demand has decreased over the last decade and pricing has been on the decline due to fewer infrastructure projects, we have seen the price in the index rise (Figure 6). The water price per acre-foot from January 2020-January 2021 shows quite a bit of volatility in the market, with the price rising from USD 200 acre/ft to a high of USD 703.99 acre/ft in June. A closer look from when the commodities futures began trading in December 2020 shows a more stable market (Figure 7); however, will the trajectory of cost continue to increase?
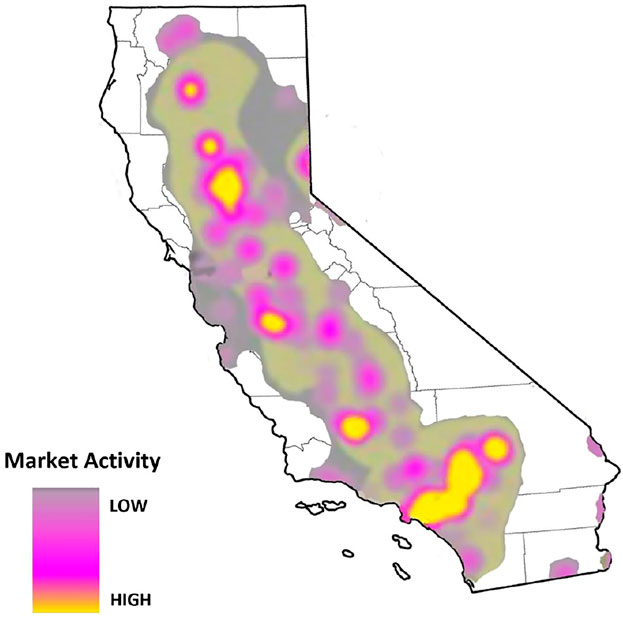
FIGURE 5. Water market activity in California. Source: Nasdaq (2020).
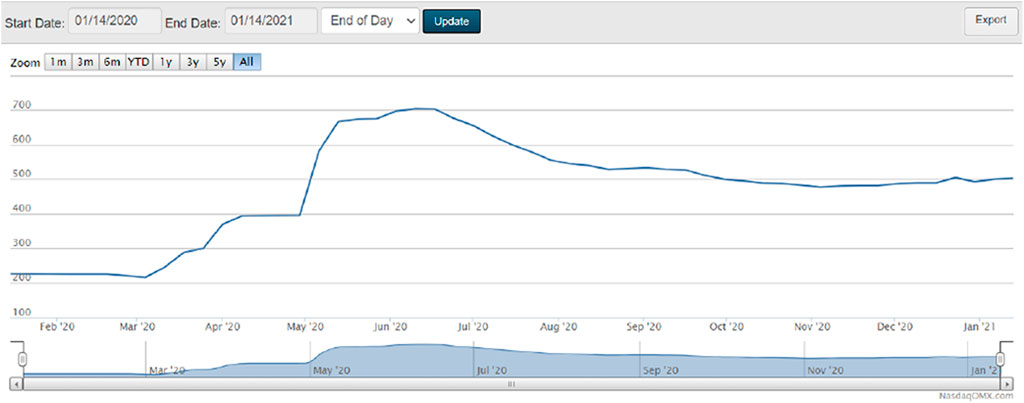
FIGURE 6. Water per acre/ft, 14 January 2020-14 January 2021. Source: Nasdaq (2020).
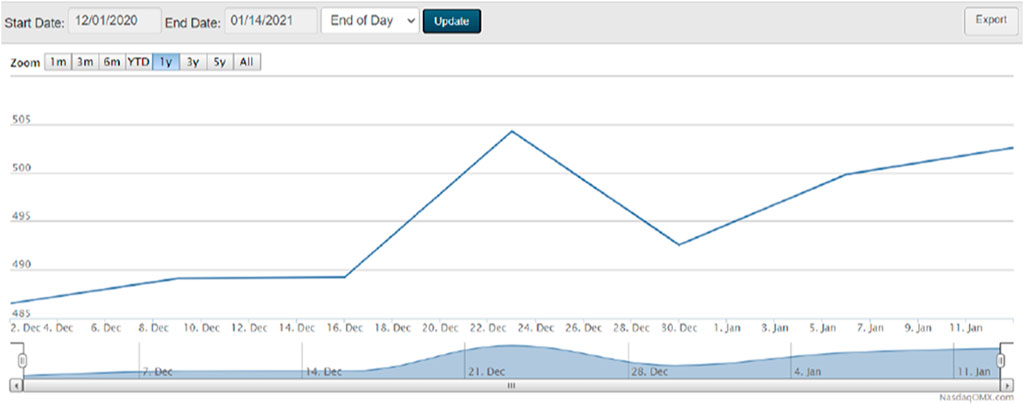
FIGURE 7. Water per acre/ft, 1 December 2020-14 January 2021. Source: Nasdaq (2020).
During the first week of trading, 36 contracts were secured. Water was priced at just under USD 500 an acre-foot, the amount of water that would cover an acre of land one foot deep, or about 326,000 gallons—enough for two households for a year (Alexander, 2020). While there was undoubtedly, an increase in the time of the market being active is not long enough to see a real trend. Looking at the futures will give a better indication of where prices are heading and if this would be consistent with the goal of the scheme, to stabilize the price and make it more predictive. With price and use being so weather dependent, and over the last few years, more volatile, will the commodity market be able to account for this? As a futures market, we can look at the futures prices and evaluate those. The only way to truly determine whether consumers benefit from a water commodity is to compare pre-futured pricing to post. This is challenging because there is not much data to use for comparison (Lence, 2009). When developing commodities markets, the assumption is that investors are making their decisions using a rational expectations theory utilizing the information they have at hand to price the commodity. The challenge with water is that many of the elements needed to make a rational decision are missing. As mentioned earlier, a large part of the volatility is caused by weather, which is difficult to predict. If we go back to basic economics, we can see that the remedy can become part of the equation as well. This Lucas Critique view of commodities pricing shows that no policy recommendation or pricing control can be taken as a stand-alone solution because the mechanism becomes a determining factor in the behavior of the market, and therefore negates or at least taints, its impact as a remedy (Lucas, 1976).
Additionally, buyers are not really paying for the water; instead, they are paying for the delivery of the water. This is why infrastructure upgrades and maintenance make up the cost of the water, and the price fluctuates as these systems are upgraded. If we take the slope and extrapolate this to predict the trend line of futures, we will see that these prices will continue to increase over time. When does this become untenable? As stated earlier, the United Nations states that water should not cost more than 3% of a family’s income (UN, 2010). An acre-foot of water can supply water for two families of four for 1 year. Using the median income and this 3% rule, an acre-foot can cost up to USD 4,122 before it becomes unaffordable for the average American (i.e., USD 68,703 median income) (Semega et al., 2020); however, this is regressive as it disproportionately impacts the poor, and there are few if any programs that subsidize water for low-income families. With a family of four living at the poverty level making USD 26,200 (HHS, 2020), an acre-foot of water can cost up to USD 1,572 an acre-foot to meet this guideline of affordability. There is more that goes into the cost of water than just the water rights, which is what is traded on this futures market. The delivery of water is the actual cost; fixed costs can be between 70–80% (Soliman and McCann, 2015). How does this factor into the water bill people actually receive?
Discussion
In terms of water, as water prices continue to rise, something must be done to ensure it remains affordable and available. Focus on conservation efforts is a crucial element to this challenge. The United Nations recommendation is largely created to inform developing countries; however, in the United States, the average household use is much higher. The most significant portion of this water is used by flushing the toilet. By contrast, the average European uses 38 gallons of water per day (Kostovska, 2019), less than half of an American citizen. Using this as a benchmark for developed countries is an excellent way to set a goal for American households and make changes to water distribution, use, regulations, and pricing. Water loss can reach as high as 50% in some cities (Farley, 2003). There are several main ways that water loss occurs. It can occur at the infrastructure level with leaking reservoirs, faulty pipes, and breaks in the pipeline (Farley, 2003). It can also happen at the consumer level from poorly maintained fixtures (e.g., leaking toilet), indoor pipe leaks, and mainline leaks on the consumer’s property. Depending on the leak and the pressure, some may never be detected (Farley et al., 2008). Improving infrastructure through federal grants can help mitigate this loss without impacting consumer’s water bills. Infrastructure investment through self-funded efforts is one of the most significant factors influencing the price of water. If California can receive federal funds for this purpose, it can be debt neutral and not impact the operating costs of these utilities. Pairing this with increased regulations may allow the federal government to ensure its investment is protected. Requiring low flow fixtures will have a multiplying effect on the infrastructure upgrades. The federal government could make grants to states based on their promise to codify and enforce water-saving measures at the consumer level.
Tiered billing is another measure that can have a water-saving impact while preserving the “right to water” attitude as espoused by the United Nations. For example, suppose 38 gallons per person is the lowest and most affordable tier, and it increases steadily from there in a manner that discourages over-use. In that case, we can both penalize overuse while protecting the basic need for affordable water. The belief is that if a minimum water use per person can be established, the price of the upper tiers can be more aggressively used to deter use and save water. This can be accomplished through an advanced tier system, as was explored in Sao Paolo, Brazil. This “incentive-based approach” gave reductions to those below the consumption average, i.e., the minimum water use, and increased the price rapidly for over-users (Rios et al., 2018). The average reduction based on this program was 25%, and the majority of this was attributed to the “awareness effect” (Rios et al., 2018). This awareness can be further enhanced by using smart meters (Davies et al., 2014). These meters are typically a screen in the home that informs the homeowner about their use, peak times, and when they are approaching a new tier. This can bring awareness of their use and its impact on both the price and the environment. It also gives municipalities the ability to communicate in real-time with consumers and inform them of important issues and create a more informed user who may value water more. Smart metering can provide near real-time information about water consumption (Davies et al., 2014). The intention is to use this information to impact the behavior of the consumer. In-home heads-up displays (IHD) are typically a screen that can show the consumer their water usage and informs them if they are at, above, or below an acceptable level. This is usually done with an emoticon of some kind. A recent study found that the use of IHDs impacted the household’s use of water by reducing it by 6.8%. This change was attributed to increased awareness about their behavior (Davies et al., 2014).
What if we could make more water? One of the challenges with the current system is dealing with increased demand and static supply, in some areas, a dwindling supply. Because water is life-giving, we need to be sure to protect it as a right. There are ethical and environmental concerns in trading water as a commodity, but there is also a concern that scarcity may create a financial value that undermines sustainability efforts. If we can remove the pressure scarcity, we may be able to, combined with the other measures, create an opportunity to create a fair, balanced, and sustainable system. In this paper, sustainability in terms of water use and price was explored through conservation instruments. Australia, for example, has faced similar challenges as California in seeking ways to best deal with an expanding population and shrinking water supply. It has concluded that in order to meet its increasing demand for safe and reliable drinking water, desalination is the best option (Mutai, 2013). Saltwater accounts for more than 94% of the water on the Earth. Although there is some effort to benefit from this resource, primarily transportation and fishing industries, it has not yet become a significant supplier of freshwater for human consumption. The desalination process is costly, but it allows for a reliable and much more plentiful water source (Mutai, 2013). Several technologies can be used in desalination: reverse osmosis, electrodialysis, multi-state flash distillation, multiple-effect distillation, vapour-compression desalination, and solar humification, and membrane distillation (Mutai, 2013). Energy is one challenge in desalination. Is the benefit of creating a sustainable water supply worth the cost of generating the large amounts of energy needed? Reliance on sustainable energy sources will be critical. Advances in technology have caused the price to drop dramatically over the last few years to as low as USD 0.50 per m3 in some locations and USD 1.00 per m3 in others (Ghaffour et al., 2013). Water dealination plants have become more ubiquitous because of increased population, industrialization, and climate change. Qatar and Kuwait both get 100% of their water this way (Ghaffour et al., 2013). Less arid regions are growing their reliance on desalination as well. In 2018, 17,000 desalination plants produced 35.8 billion m3 per year, serving 300 million people in 177 countries (Jones et al., 2019). In California, permitting is a barrier to construction and would need to be streamlined to help make the cost manageable.
Continued investment in technology and sustainable energy sources is a critical element to ensure the widespread adoption of desalination to solve the world’s water problem. It does, however, create a different outlook on the economics of water commodities trading. By adding a production element to the equation, we can better assign a cost to the delivery of water that includes real production costs. This allows for better control over supply, and may offer an incentive to pricing water based on actual production costs and not just based on demand. However, while this may cure one issue with the commodity model, price being purely demand-driven, it does not overcome the ethical implications. As we explore supply chains more carefully and realize that there are profound ethical implications to providing goods to the economic North and West, we need to address these issues. While we will not be able to rework the world economy to eliminate these inequities in the near future, we are able to prevent new systems from falling into this same trap. In addition, we want to ensure appropriate regulation over the production and trade of water so as not to create an over-abundance at the expense of another area of the world or ocean. Working closely with the United Nations to guide policy, investing in renewable energy to power the plants, and creating a price scheme that encourages responsible use while providing for the needs of the poor are all crucial to solving this problem. This mixed approach can meet the needs of consumers, stabilize the price, create a responsible market for desalination (i.e., which may encourage the development of the sector), and ultimately create a more globally reliable source for water.
Recommendations
Our research indicates there are several leading remedies to the water crisis; however, these solutions do not consider the unique needs of the poor. Our conceptual analysis is focused mainly on the impact these solutions have on the poor. The poor need water, and as noted in the European Union Directive 2000, which created a moral directive and gave ethical weight to the protection of water (Armstrong, 2006), their rights need protection. There is a privilege the wealthy and powerful enjoy, and this extends to access to water. With this new moral directive, there is an ethical responsibility to protect those with less power and influence. Without intervention, the primary control for price and access is the weather, according to Lence’s (2009) research specific to American agricultural economics. While research seeks to distill past data and research into current policy recommendations, the Lucas Critique tells us that we cannot base our policy recommendations solely on past data because rational humans will always alter their behavior to the current situation and try to predict outcomes (Lucas, 1976). Therefore, we need to find new ways to control pricing rather than solely relying on market tools. As Lence (2009) points out, the weather is a “deep parameter” because it is unaffected by policy interventions or other tools we might use to regulate market prices.
Legislative remedies focus on the reduction of use. This is not a viable solution because, as pointed out earlier, the highest users are those with the most power, the wealthy and powerful industries. Using a system similar to those proposed for carbon emissions (i.e., cap and trade), such a system only allows the wealthy and powerful to buy permission to use more water and leave the poor once again with little influence over policy and dwindling resources. How then can the issue be solved if the economic variables cannot be relied on and expectations about economic conditions continue to move the market? Finally, based on this conceptual analysis, we argue that policy recommendations should be made through the lens of ethical responsibility to provide access to clean, affordable water. While this does not solve the problem, it can inform our actions in creating a mixed model of controls to ensure a sustaining level of access for the poor.
Author Contributions
Material preparation, data collection, and analysis were performed by CO. All authors contributed equally to the study conception, design, and draft manuscript. GC supervised the project. All authors wrote, read, and approved the final manuscript.
Conflict of Interest
The authors declare that the research was conducted in the absence of any commercial or financial relationships that could be construed as a potential conflict of interest.
Publisher’s Note
All claims expressed in this article are solely those of the authors and do not necessarily represent those of their affiliated organizations, or those of the publisher, the editors and the reviewers. Any product that may be evaluated in this article, or claim that may be made by its manufacturer, is not guaranteed or endorsed by the publisher.
References
Alexander, K. (2020). Investors Can Now Trade on and Profit from California Water: How Might that Work Out? San Francisco, CA: San Francisco Chronicle.
Algieri, B. (2018). A Journey through the History of Commodity Derivatives Markets and the Political Economy of (De)Regulation. SSRN J. 286, 1–59. doi:10.2139/ssrn.3301143
Arbués, F., García-Valiñas, M., and Martínez-Espiñeira, R. (2003). Estimation of Residential Water Demand: A State of the Art Review. J. Socio-Economics 32 (1), 81–102. doi:10.1016/s1053-5357(03)00005-2
Arbués, F., Villanúa, I., and Barberán, R. (2010). Household Size and Residential Water Demand: An Empirical Approach. Aust. J. Agric. Resource Econ. 54 (1), 61–80. doi:10.1111/j.1467-8489.2009.00479.x
Armstrong, A. (2006). Ethical Issues in Water Use and Sustainability. Area 38 (1), 9–15. doi:10.1111/j.1475-4762.2006.00657.x
Brandt, J., Sneed, M., Rogers, L. L., Metzger, L. F., Rewis, D., and House, S. (2014). California Water Use. California, US: USGS California Water Science Center. doi:10.5066/F7KD1VXV
Brown, B. (2017). “Residential Water Use Trends and Implications for Conservation Policy,” in Legislative Analyst’s Off. Calif. Legilature’s Nonpartisan Fiscal Pol. Advisor (Sacramento, CA: Legislative Analyst’s Office).
C-WIN (2021). Advocating for the Sustainable and Equitable Use of California’s Fresh Water Resources. Sacramento, CA: California Water Impact Network. Available at: https://www.c-win.org/ (Accessed November 23, 2021).
Davies, K., Doolan, C., Van Den Honert, R., and Shi, R. (2014). Water-saving Impacts of Smart Meter Technology: An Empirical 5 year, Whole-Of-Community Study in Sydney, Australia. Water Resour. Res. 50 (9), 7348–7358. doi:10.1002/2014WR015812
Farley, M. (2003). Understanding And Managing Losses in Water Distribution Networks WaterWorld. Available at: https://www.waterworld.com/drinking-water/infrastructure-funding/article/16200323/understanding-and-managing-losses-in-water-distribution-networks.
Farley, M., Wyeth, G., Ghazali, Z. B. M., Istandar, A., and Singh, S. (2008). The Manager’s Non-revenue Water Handbook. Bangkok: International Water Association.
Ghaffour, N., Missimer, T. M., and Amy, G. L. (2013). Technical Review and Evaluation of the Economics of Water Desalination: Current and Future Challenges for Better Water Supply Sustainability. Desalination 309, 197–207. doi:10.1016/j.desal.2012.10.015
Hamori, S., Hamori, N., and Anderson, D. A. (2001). An Empirical Analysis of the Efficiency of the Osaka Rice Market during Japan's Tokugawa Era. J. Fut. Mark. 21 (9), 861–874. doi:10.1002/FUT.1905
Hanak, E., Gray, B., Lund, J., Mitchell, D., Chappelle, C., Fahlund, A., et al. (2014). Paying for Water in California. California, United States: Public Policy Institute of California.
Hellegers, P., Schoengold, K., and Zilberman, D. (2008). “Water Resource Management and the Poor,” in Economics of Poverty, Environment and Natural-Resource Use. Editors R. B. Dellink, and A. Ruijs (Heidelberg: Springer), 41–57. Available at: https://www.researchgate.net/publication/40799777_Water_Resource_Management_And_The_Poor.
HHS (2020). 2020 Poverty Guidelines. Office of the Assistant Secretary for Planning and Evaluation. Washington, D.C.: U.S. Department of Health and Human Services.
Jones, E., Qadir, M., van Vliet, M. T. H., Smakhtin, V., and Kang, S.-m. (2019). The State of Desalination and Brine Production: A Global Outlook. Sci. Total Environ. 657, 1343–1356. doi:10.1016/j.scitotenv.2018.12.076
Keynes, J. M. (1936). The General Theory of Employment, Interest, and Money. San Diego, California, United States: Harcourt.
Kostovska, B. (2019). Water Footprint of EU Energy Consumption: 1,301 Litres Per Person Per Day. Brussels: European Commission.
Lence, S. H. (2009). Do futures Benefit Farmers? Am. J. Agric. Econ. 91 (1), 154–167. doi:10.1111/j.1467-8276.2008.01162.x
Lucas, R. E. (1976). Econometric Policy Evaluation: A Critique. Carnegie-Rochester Conf. Ser. Public Pol. 1 (C), 19–46. doi:10.1016/S0167-2231(76)80003-6
Lutz, J. D. (2004). Lest We Forget, a Short History of Housing in the United States. Berkeley, United State: Ernest Orlando Lawrence Berkeley National Laboratory.
Manley, T. (2017). California Agriculture – A State of Abundance. California, Us: Northern California Water Association.
Mazzanti, M., and Montini, A. (2006). The Determinants of Residential Water Demand: Empirical Evidence for a Panel of Italian Municipalities. Appl. Econ. Lett. 13 (2), 107–111. doi:10.1080/13504850500390788
Mutai, A. K. (2013). A Research Report on Desalination Case Study Australia. Nairobi: Water Resource Management Forum).
Nasdaq (2020). Nasdaq Veles Water Indexes: A Clear Solution for Water Price Discovery. New York: Nasdaq.
Olmstead, S. M., and Stavins, R. N. (2009). Comparing price and Nonprice Approaches to Urban Water Conservation. Water Resour. Res. 45, 4301. doi:10.1029/2008WR007227
Reynaud, A., and Romano, G. (2018). Advances in the Economic Analysis of Residential Water Use: An Introduction. Water 10 (9), 1162. doi:10.3390/w10091162
Rios, P. C. S., Deen, T. A., Nagabhatla, N., and Ayala, G. (2018). Explaining Water Pricing through a Water Security Lens. Water 10, 1173. doi:10.3390/w10091173
Sebri, M. (2013). A Meta-Analysis of Residential Water Demand Studies. Environ. Dev. Sustain. 16 (3), 499–520. doi:10.1007/S10668-013-9490-9
Semega, J., Kollar, M., Shrider, E. A., and Creame, J. F. (2020). Income and Poverty in the United States: 2019. Us: US Census Bureau.
Shi, X., Li, Y., and Reshetova, E. (2016). Bottom-up Design of a Gas Futures Market in East Asia: Lessons from the Dojima rice Exchange. Nat. Gas Industry B 3 (4), 377–386. doi:10.1016/J.NGIB.2016.12.003
Soliman, A., and McCann, H. (2015). The “Inexact Science” of Water Pricing. California,Us: Public Policy Institute of California.
Stets, E. (2015). Water Quality Evolution: From the Industrialization to the Age of the Internet. Boulder, CO: Advisory Committee on Water Information.
UN (2010). Human Right to Water and Sanitation: International Decade for Action “Water for Life” 2005-2015. New York, New York, United States: United Nations Department of Economic and Social Affairs.
Wade, M. (2019). Mike Wade, Author at California Farm Water Coalition. California,Us: California Farm Water Coalition.
Walton, B., and LaFond, K. (2019). Water Pricing. Seattle: Circle of Blue. Available at: https://www.circleofblue.org/waterpricing/ (Accessed November 23, 2021).
Keywords: water commodity, tiered water bills, non-price policy, water rights, water privilege, NQH2O, California
Citation: Orobello C and Cirella GT (2021) Financialization of Water: Conceptual Analysis of the California Water Crisis. Front. Environ. Sci. 9:739180. doi: 10.3389/fenvs.2021.739180
Received: 10 July 2021; Accepted: 15 November 2021;
Published: 02 December 2021.
Edited by:
Brian Alan Johnson, Institute for Global Environmental Strategies, JapanReviewed by:
Umer Shahzad, Anhui University of Finance and Economics, ChinaMuhammad Umar, Qingdao University, China
Copyright © 2021 Orobello and Cirella. This is an open-access article distributed under the terms of the Creative Commons Attribution License (CC BY). The use, distribution or reproduction in other forums is permitted, provided the original author(s) and the copyright owner(s) are credited and that the original publication in this journal is cited, in accordance with accepted academic practice. No use, distribution or reproduction is permitted which does not comply with these terms.
*Correspondence: Giuseppe T. Cirella, Z3QuY2lyZWxsYUB1Zy5lZHUucGw=