
95% of researchers rate our articles as excellent or good
Learn more about the work of our research integrity team to safeguard the quality of each article we publish.
Find out more
ORIGINAL RESEARCH article
Front. Environ. Sci. , 25 August 2021
Sec. Environmental Informatics and Remote Sensing
Volume 9 - 2021 | https://doi.org/10.3389/fenvs.2021.727844
This article is part of the Research Topic Environmental Change in Drylands: Past, Present, Future View all 21 articles
Dust events not only cause local ecosystem degradation and desertification, but also have profound impacts on regional and global climate system, as well as air quality and human health. Dust events in Xinjiang Basin, as the important dust source of Eastern Asia, have undergone a significant change under the global warming background and may be in a new active period after 2000, which is worthy of study. This study provides the temporal and spatial variations of dust events in the Xinjiang Basin based on surface meteorological station observation data during 1960–2015. The results show that Southern Xinjiang is the main dust occurrence region where dust events are significantly more than that in the Northern Xinjiang, and each year more than 73% of dust events occurred in spring and summer. The dust index (DI), which is defined to represent the large-scale variation of dust event, shows a significant downward trend during the past 56 years with a linear decreasing rate −8.2 years−1 in Southern Xinjiang. The DI is positively correlated to surface wind speed with a mean correlation coefficient of 0.79. The declining trend of surface wind speed could explain dust events variation during 1960–2000. But in the new active period after 2000, the increase of DI is not consistent with the rising wind speed with the correlation coefficient decreasing to 0.34. It is found that, compared with 1960–1999, the average annual precipitation and frequency increased by 17.4 and 13% during 2000–2015, respectively, and the NDVI also increased at the same time, which indicates that the surface condition changes induced by the increase of precipitation might suppress the occurrence of dust. Moreover, the analysis of high-altitude wind field shows that the variation of the East Asian general circulation’s intensity, dominating the upper-level wind fields in the Xinjiang basin, will change the surface wind speed and precipitation, and further affect the occurrence of dust events.
Dust events, which are classified by visibility as dust storm, blowing dust and floating dust, are common phenomena in the arid and semi-arid regions of central Asia (Indoitu et al., 2012). Dust events not only cause ecosystem degradation and desertification in the local region, but also have profound impacts on the regional and global climate system. Dust aerosol could lead to both cooling by reflecting sunlight back to space and warming by absorbing solar and infrared radiation, which is called the direct radiative effect (Sokolik and Toon, 1999; Wang et al., 2013). They also could increase cloud albedo and suppress precipitation by acting as cloud condensation nuclei and ice nuclei to change the microphysical properties (Wang et al., 2015; Wang et al., 2017), which are defined as the indirect radiative effect (Twomey, 1977; Albrecht, 1989). Dust deposition after long-distance transportation is also one of the sources of marine pollutants and nutrients, influencing marine ecosystems (Cabrerizo et al., 2016; Wang et al., 2019b). And the increased flux of iron, nitrogen and phosphorus to ocean by atmospheric dust can promote the primary production and further the particulate organic carbon export to deep ocean, which is an important way for carbon sequestration of ocean (Struve et al., 2020; Xiu and Chai, 2021). Moreover, large amounts of dust significantly influence air quality and play an essential role in disease transmission (Li et al., 2020; Tian et al., 2020; Wallden et al., 2020; Linares et al., 2021).
Xinjiang is located in Central Asia, one of the important dust source areas, covering 1.66 × 10⁶ km2 with more than 50% areas are desert and Gobi. The Taklimakan Desert, in the southern part of Xinjiang, is the second-largest desert in the world. Dust particles from the Taklimakan Desert are blown into the free troposphere and even can be lofted vertically up to 10 km due to the unique topography and northeasterly winds associated with certain synoptic conditions (Ge et al., 2014). Then they can be transported horizontally to regions far downwind from the Asian continent to the West Pacific by westerlies (Wang et al., 2010; Hu et al., 2020). The Taklimakan Desert is an important source of dust that affects much of Eastern Asia, and is also considered as the dust sediment source for the North Pacific and even North America (Liu et al., 2019; Yasukawa et al., 2019; Chen et al., 2020; Ma et al., 2020). Therefore, the dust of Xinjiang has drawn much attention from researchers all over the world.
Under the background of global warming, like many other regions worldwide, the area of Xinjiang experienced noteworthy climate change in the past few decades. Along with climate change, some studies have shown that the frequency of dust events also changed significantly. Wang et al. (Wang et al., 2008) used ground observational data collected from Xinjiang meteorological stations from 1961–2000 to show that the monthly and annual mean occurrence days of dust in Xinjiang presented a significant decreasing trend. Ma et al. (Ma et al., 2006) applied ground observational data from 1961–2003 and got similar conclusions with Wang et al., and they also found that there existed oscillation periods of dust events, 10–15 years in Northern Xinjiang and 8–10 years in Southern Xinjiang. Pi et al. (Pi et al., 2017) investigated spatial-temporal characteristics of dust events from 1960 to 2007, which shows a long-term decline and there is heavier dust in Southern Xinjiang than in Northern Xinjiang. And the studies of dust events in Southern Xinjiang exhibit obvious fluctuations and wind speed is the dominant factor (Wang et al., 2019b; Jin et al., 2021).
Although dust events in Xinjiang have been studied by many researchers, these studies primarily focus on the period of 1960–2000. With the decrease of dust events in the late 1990s over the globe, relatively less attention was paid to the changes of dust after 2000. However, (Qian et al., 2004), and (Li and Zhong, 2007) both pointed that dust storms in northern China have increased since 2000 and maybe in a new active period. And this phenomenon is more pronounced in 2021, and many people have noticed the increase of dust events. There have been 21 strong storms in northern China by May, and the frequency, intensity, and influenced coverage are all rare in recent years (CCTV-News, 2021). In terms of the broad impacts of Xinjiang dust aerosol, continuous research on variations of dust events in the whole Xinjiang region is needed, especially in the recent 20 years under the global warming background. Based on above all, it is necessary to analyze the recent changes of dust events in this decade to understand its responses to the undergoing climate change and investigate the possible reasons for it. Due to Xinjiang’s unique landform, there are observable spatial differences of climate characteristics between the South and North. This study divides Xinjiang into two parts as Southern and Northern Xinjiang, along the Tianshan Mountains. We provide the temporal and spatial distribution of dust events and analyze the long-term trend as well as abrupt changes of the dust index (DI) in these two parts of Xinjiang from 1960–2015. The potential causes for the variations of dust events are also analyzed.
This paper is organized as follows. Data and Methods introduces the dataset used in this study and describes the method to calculate the DI. In Results and Discussion, the temporal and spatial distribution of dust events over Xinjiang and the trend of dust events as well as the analysis of the abrupt change are presented, and then the potential causes are discussed. Conclusions are given in Conclusion.
Dust events are studied using the ground-based observation of dust storm, blowing dust and floating dust during 1960–2015 from 50 meteorological stations over Xinjiang (Figure 1), provided by the Meteorological Information Center of China Meteorological Administration (CMA). The data of surface wind speed and precipitation from 1960 to 2015 of above stations are also obtained from CMA. NCEP-NCAR reanalysis data (NCEP R1) from 1960 to 2015 are adopted to investigate the atmospheric circulation pattern. NCEP R1 data is one of the most widely used reanalysis data, using a three-dimensional variational (3DVAR) data assimilation scheme with 2.5°×2.5° horizontal resolution and 28 vertical levels (Kang et al., 2016), which are provided by the National Centers for Environmental Prediction and National Center for Atmospheric research (NCEP/NCAR). Moreover, the Normalized Difference Vegetation Index (NDVI) data from 1982 to 2015 are used in this study. The NDVI data are from the Advanced Very High Resolution Radiometer (AVHRR) carried on the National Oceanic and Atmospheric Administration (NOAA) weather satellite, which provides the longest time NDVI product from 1982.
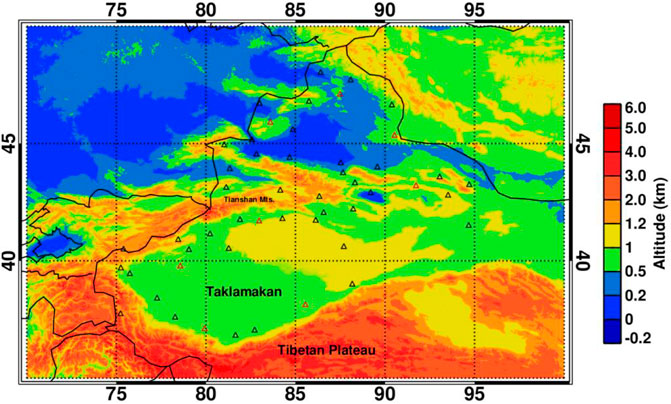
FIGURE 1. The location of surface observation stations for dust events and the topography of Xinjiang Basin (Triangle: observation station; Red triangle: representative station selected to define DI).
Dust events are typically classified into three types: dust storm, blowing dust and flowing dust, according to the visibility (Wang et al., 2005). (Niu et al., 2001) found that the dust concentration of these three dust events is proportional to each other, and the dust concentration of dust storm is three times higher than that of blowing dust and eight times higher than that of floating dust. Based on this relationship, Wang et al. (Wang et al., 2008) defined the DI for Taklimakan Desert with three dust events data from selected stations. In this study, we use the similar definition to calculate the DI of Xinjiang to describe the statistical characters of the dust events over this region. Firstly, we calculate the correlations of the frequency of monthly dust storm days between each station using the observation data of 50 meteorological stations. Then four stations with the highest correlation coefficients to other stations are selected to calculate the DI, which could present the regional characters of three dust events over the Xinjiang region. The detailed information of representative stations is given in Table 1, and the locations are also marked in Figure 1. The correlation coefficients of these representative stations are above 0.8 and 0.67 for Southern and Northern Xinjiang, respectively (p < 0.05).
Based on the formula proposed by Wang et al. (2008), the equation of DI for Xinjiang is defined as
where FD, BD, and DS are occurrence days of floating dust, blowing dust and dust storm, respectively.
The annual mean occurrence days of three dust events at selected stations are used to calculate the DI.
Figure 2 displays the monthly average occurrence days of dust storm, blowing dust and floating dust over Xinjiang region from 1960 to 2015. The frequency of each type of dust event in Southern Xinjiang is significantly greater than that in Northern Xinjiang, according to Figure 2. The annual days of dust events in Southern Xinjiang are 12 times more than that in Northern Xinjiang. The most frequent dust event is floating dust in Southern Xinjiang, and its annual occurrence days is larger than 69 days. While, the blowing dust is the most frequent event in Northern Xinjiang, and its annual occurrence days are about 5 days. This tremendous difference is mainly caused by the special terrain. The local dust emission rules Southern Xinjiang due to the Taklimakan desert, however, only a small amount of dust can be transported to the Northern Xinjiang because of the barrier of Tianshan Mountain. As shown in Figure 2, the three types of dust events in both Southern and Northern Xinjiang primarily occur from March to July, which are characterized by a strong unimodal pattern with peaks in April or May. For Southern Xinjiang, the peak of floating dust is in april, while that of dust storm and blowing dust are both in May. The statistical results in Table 2 show that the total number of dust storm, blowing dust and floating dust in spring and summer accounts for 89.19, 83.17, and 73.04% of these events over the entire year for Southern Xinjiang, respectively, and they are 82.44, 80.80, and 82.20% for Northern Xinjiang, which demonstrates that dust events of Xinjiang mainly occur during Spring and Summer. In spring, the fontal cyclone activity with strong wind is frequent in this region, which induces dust events to happen more often than any other season. In summer, although the wind is not strong as it is in spring due to the rare cold front intrusion, the dust event frequency almost accounts for more than a third of the entire year, only smaller than spring. (Ge et al., 2014) found that although the synoptic situation of spring and summer are quite different, there are also common features for the two seasons: a strong anticyclonic wind anomaly over the Taklimakan at 500 hPa and an enhanced easterly wind over Tarim Basin at 850 hPa, which are all favorable conditions for dust entrainment from the dry desert surface, vertical lofting, and horizontal transportation.
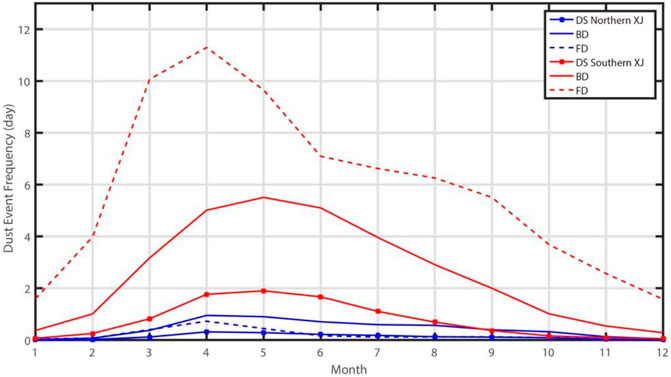
FIGURE 2. Monthly average occurrence days of dust storm, blowing dust and floating dust during 1960–2015.
Figure 3 shows the spatial distribution of the annual average occurrence days of floating dust, blowing dust and dust storm over the 56-year in the Xinjiang area. The average occurrence days of three dust events for many Southern Xinjiang stations are more than 130 days, while that in most Northern Xinjiang stations are less than 15 days. As the dominant type of dust event over Xinjiang, the annual mean occurrence days of floating and blowing dust are about 100 days in Southern Xinjiang and less than 10 days in Northern Xinjiang except for stations located along the main dust transport path. This spatial distribution is mainly caused by the special topography. The Taklimakan Desert is located in the Tarim Basin with an average elevation of 1.1 km, where the Pamir Plateau bounds it with an average elevation of 5.5 km to the west and the Kunlun mountain with an average elevation of 5.5 km to the south, as well as the Tianshan mountain with average elevation 4.8 km to the north. The eastern margin of the Taklimakan is the only low-elevation opening for low-level dust to flow out of the desert basin. The dust from Taklimakan Desert rules the local dust emission and induces the flowing dust to dominate the Southern Xinjiang. Lower dust only can be further transported to the northern part by passing through this “gate”. Hence, the blowing dust is the primary dust event in Northern Xinjiang and relatively much less frequent. Combined with the wind rose diagram in Figure 4, it is clear that Southern Xinjiang is dominated by easterly winds, which produces great wind shear due to the topographic effect of the Qinghai-Tibet Plateau in the Southern Tarim Basin. The wind shear further facilitates the occurrence of strong dust events, which leads to the primary spatial distribution of dust in Southern Xinjiang along the Taklimakan Desert.
The changes of occurrence days of three dust events in Southern and Northern Xinjiang from 1960–2015 are statistically analyzed in Figure 5. In general, annual occurrence days of dust events decrease in the Xinjiang region over 56 years. During this period, the number of annual occurrences of dust events increased gradually from 1960 to 1980 with the peak in the late-1970, after that decreased rapidly until the 21st century, and then began to increase after 2005, especially in Southern Xinjiang. This result is consistent with the results presented by Qian et al. (2004). They got the same conclusions of the trend of variations and also pointed that the northern dust has increased since 2000 and a new rising active period will occur.
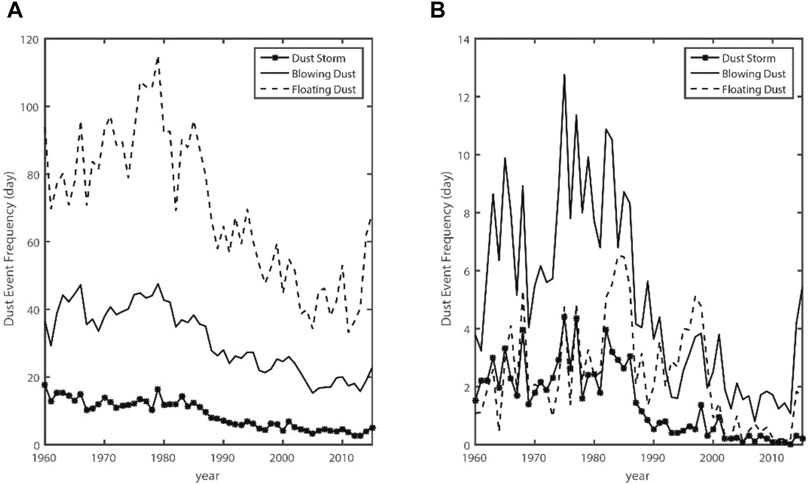
FIGURE 5. Interannual Variations of dust storm, blowing dust and floating dust in (A) Southern Xinjiang and (B) Northern Xinjiang.
The DI, describing the large-scale variability of dust events and defined in Methods, is a combination of dust storm, blowing dust and floating dust with distinct weight coefficients, which is used to investigate the trend of dust variation over Xinjiang during the past 56 years. Figure 6 shows the interannual variations of DI and their corresponding sliding t-test in Southern and Northern Xinjiang from 1960 to 2015. As shown in Figure 6A, the DI in Southern Xinjiang presented a significant downward trend and a linear rate of decrease up to −8.2/year (p < 0.05). For Northern Xinjiang, a similar decline trend with a linear rate of −1.37/year since 1985 is shown in Figure 6B; however, there is an increase trend during 1960–1984 with the linear rate of 2.52/year. The DI of Northern Xinjiang shows great fluctuation, due to the relatively rare occurrence of dust events in Northern Xinjiang, which is only approximately 10% of that in Southern Xinjiang.
Sliding t-test is a widely used statistical method to detect the abrupt change objectively. This method is utilized in this study for DI abrupt change over Southern and Northern Xinjiang, and the results are given in Figures 6C,D, respectively. Figure 6C illustrates that abrupt changes of DI of Southern Xinjiang occurred in 1975 and 1985, but the sliding t-test value decreased significantly after 2005 without passing the 0.05 significance level. The results suggest that although DI has increased since 2005, it does not experience abrupt change. The DI of Northern Xinjiang shows a single peak pattern, with a significant increase before 1984 and a decrease afterward. In combination with the abrupt change detected by the sliding t-test in Figure 6D, the results show that the years of abrupt change in Northern Xinjiang are generally consistent with that in Southern Xinjiang, which are 1978 and 1986.
As an important dust emission region, the declining trend of the dust events in Xinjiang affected the dust activities in the downwind area significantly. Shao et al. (Shao et al., 2013) showed that the global mean dust concentration has decreased by 1.2% yr−1 during the latest 20 years, which can be mainly attributed to the decreased frequencies of dust events in these important dust emission regions. To further identify the potential causes of dust event variations over the Xinjiang region, the changes of controlling factors and their correlations with the DI are investigated in this paper.
It has been recognized that wind is a curial factor in controlling dust events, which plays an essential role not only in the emission but also during the transportation of dust (Kang et al., 2016). Figure 7 displays variations of annual average surface wind speed in Southern and Northern Xinjiang from 1960 to 2015 based on the data from observation stations. It illuminates that the wind speed in both Southern and Northern Xinjiang shows a consistent decreasing trend over the 56-year study period. The linear rates of decline can be up to −0.014/year and −0.009/year for Southern and Northern Xinjiang, respectively (p < 0.05). This downward trend of surface wind speed over Xinjiang agrees with the reduction of the global average surface wind speed that has been occurring over land since 1980, which is a phenomenon known as the “global terrestrial stilling” (Zeng et al., 2019). In general, the results of abrupt change of wind are similar to DI; however, there is an evident abrupt change in 2000, which is more significant than that in the t-test of DI (Interannual Variations and Abrupt Changes of Dust Events).
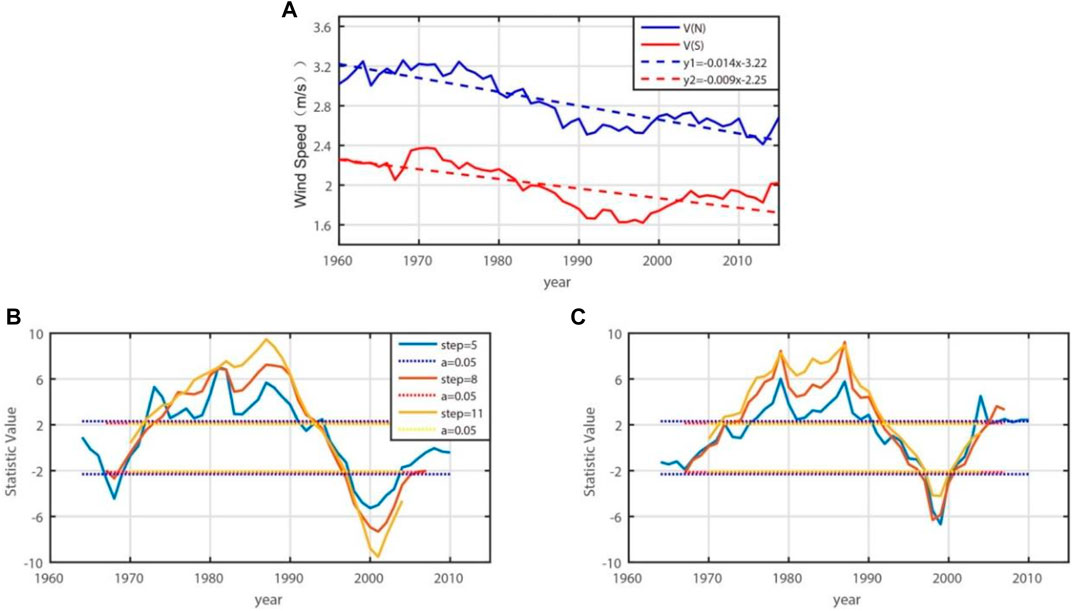
FIGURE 7. (A) Variations of average wind speed and sliding t-test for (B) Southern Xinjiang and (C) Northern Xinjiang.
The comparison of the trend of DI and average wind speed from 1960 to 2015 in Southern and Northern Xinjiang is shown in Figure 8. Since more than 80% of dust events in Xinjiang occurred in spring and summer, DI and wind speed of spring and summer are calculated in Figure 8. DI and wind speed are changing synchronously during 1960–2000, which shows a good one to one relationship between variations and peaks of DI and wind speed, especially in Southern Xinjiang. The correlation of DI and wind speed can reach 0.79 over the 56-year (p < 0.05), which demonstrates that changes of surface wind speed will significantly and directly affect the dust events of this area. But it is worth pointing that after 2000, the magnitude of wind speed increases considerably greater than that of DI. The correlation coefficient between the DI and wind speed also dramatically dropped to 0.37 during 2000–2015, indicating there must be other factors effectively impacting dust events.
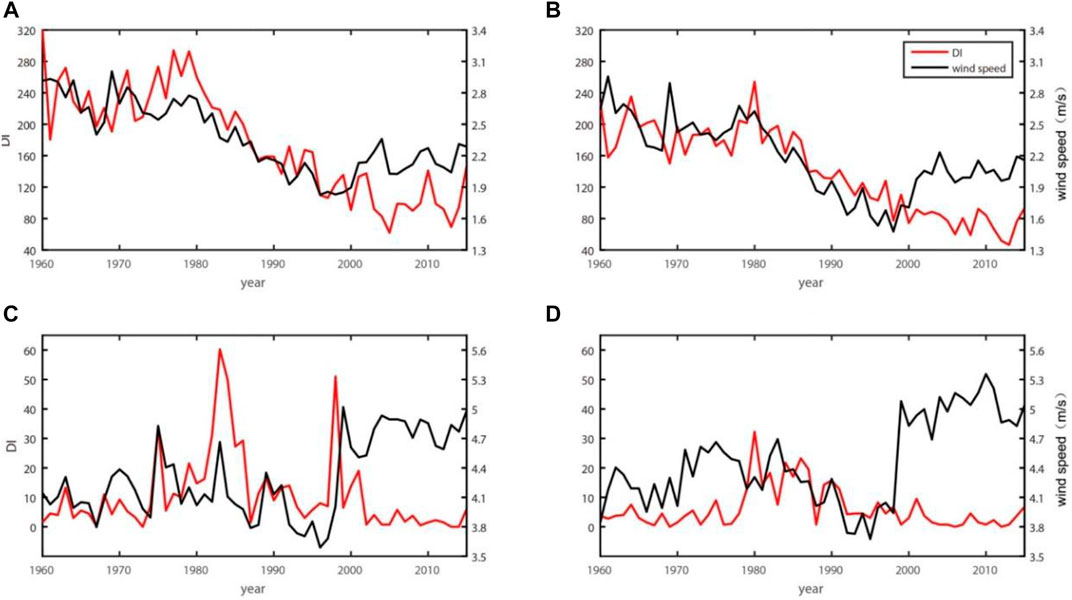
FIGURE 8. Variations of DI and average surface wind speed: Southern Xinjiang (A,B) and Northern Xinjiang (C,D) in spring (A,C) and summer (B,D).
Since the local dust emission is closely associated with surface conditions, the precipitation could indirectly affect dust emission via changing surface conditions. Therefore, we further analyze the relationship between DI and precipitation. Figure 9 illustrates the DI and precipitation in spring and summer during 1960–2015 in Southern and Northern Xinjiang, respectively. It shows a negative relationship between DI and precipitation, especially in summer with more precipitation. Combining with Table 3 that gives the statistical data on the precipitation and frequency during 1960–1999 and 2000–2015, the average annual precipitation increased from 72.33 to 87.52 mm (17.4%) in Southern Xinjiang, and from 176.93 to 202.95 mm (14.7%) in Northern Xinjiang. Meanwhile, their days of precipitation also increased by 13 and 2.8%, respectively. The synchronous increases in the precipitation and the days of precipitation would suppress the occurrence of dust events. Moreover, the changing of surface vegetation is also studied in this paper. Following the similar analysis of above precipitation studies, the variations of DI and NDVI in spring and summer during 1982–2015 are investigated, which are illustrated in Figure 10. The increasing trend of NDVI indicates the improvement of vegetation, especially in summer of Southern Xinjiang. This result is also consistent with other studies which all informed that the vegetation coverage in Xinjiang region had a general increase with fluctuations in recent years (Bao et al., 2017; Yuan et al., 2020; Zhang et al., 2020; Zhou et al., 2021). Therefore this might be another possible reason to explain the change of dust events since 2000. The above analysis suggests that precipitation and vegetation are another factors associated with the variations of dust events in Xinjiang, in view of the change of dust events since 2000.
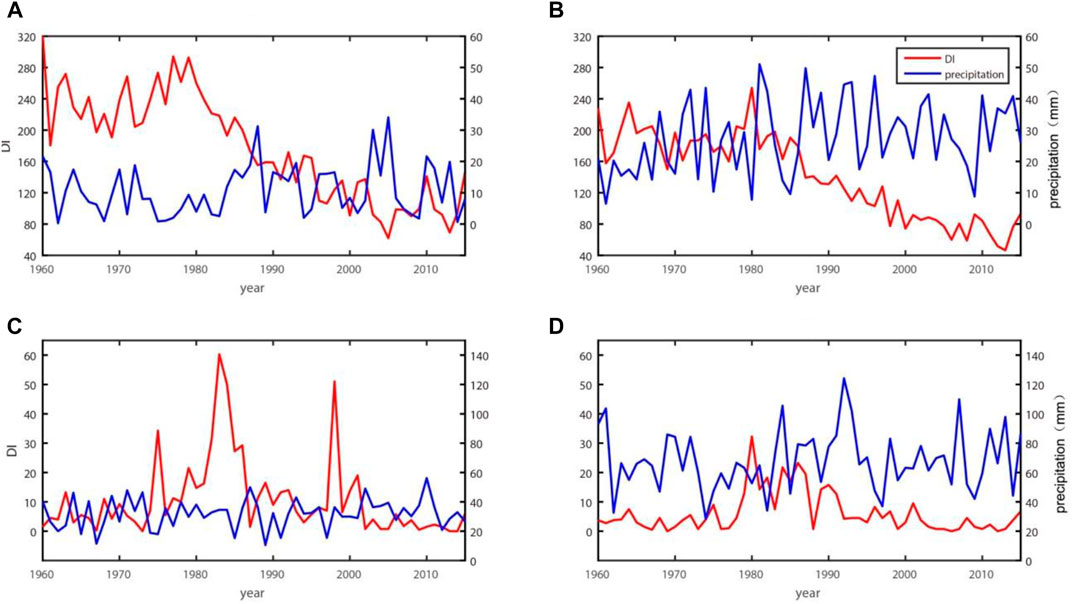
FIGURE 9. Variations of DI and precipitation of Southern Xinjiang (A,B) and Northern Xinjiang (C,D) in spring (A,C) and summer (B,D).
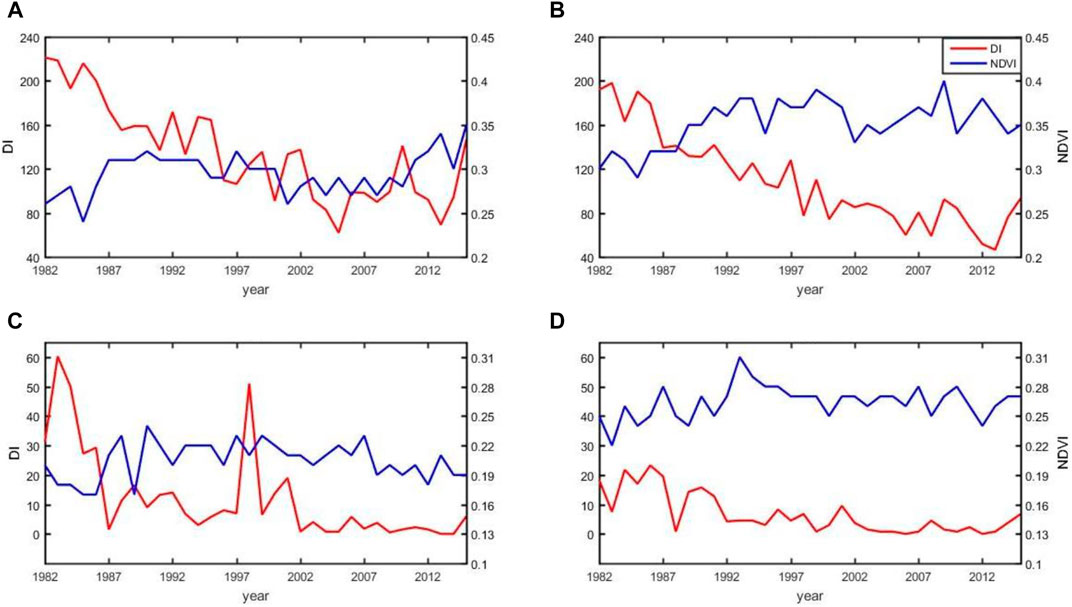
FIGURE 10. Variations of DI and NDVI of Southern Xinjiang (A,B) and Northern Xinjiang (C,D) in spring (A,C) and summer (B,D).
The westerly circulation of the upper troposphere is an important system for the climate of mid-to-high latitude region. The specific circulation pattern is strongly associated with dust events in northern China (Zhong and Li, 2005; Li and Liu, 2015). To further investigate the atmospheric circulation pattern in the rising and declining periods of dust events, we analyze the changes of high-altitude wind fields by using the NECP data of daily zonal wind speed. As discussed in Interannual Variations and Abrupt Changes of Dust Events, the occurrences of dust events increased gradually from 1960 to 1980, peaked in the late-1970, then decreased rapidly until 2000, and started a new active period. Therefore, we chose 1960–1980 and 2000–2015 as the two rising periods and 1981–1999 as the declining period. Meanwhile, the high frequency years and low frequency years are selected during the rising period and declining period respectively as represented years based on the ranking of DI, which are listed in Table 4.
Figure 11 shows the difference of zonal wind speed between rising and declining periods for 200 hPa and 500 hPa, respectively. During these two dusts rising periods, both 500 hPa and 200 pha zonal wind speed show the strengthened wind over the entire northern China region. The 500 hPa zonal mean wind speed during the rising period of dust events (1960–1980) over Xinjiang is larger than 1.24 m/s compared to declining period, whereas that is for about 1.10 m/s during 2000–2015, which is weaker than that of 1960–1980. The rising dust events are linked to the intensified westerly jet over Xinjiang.
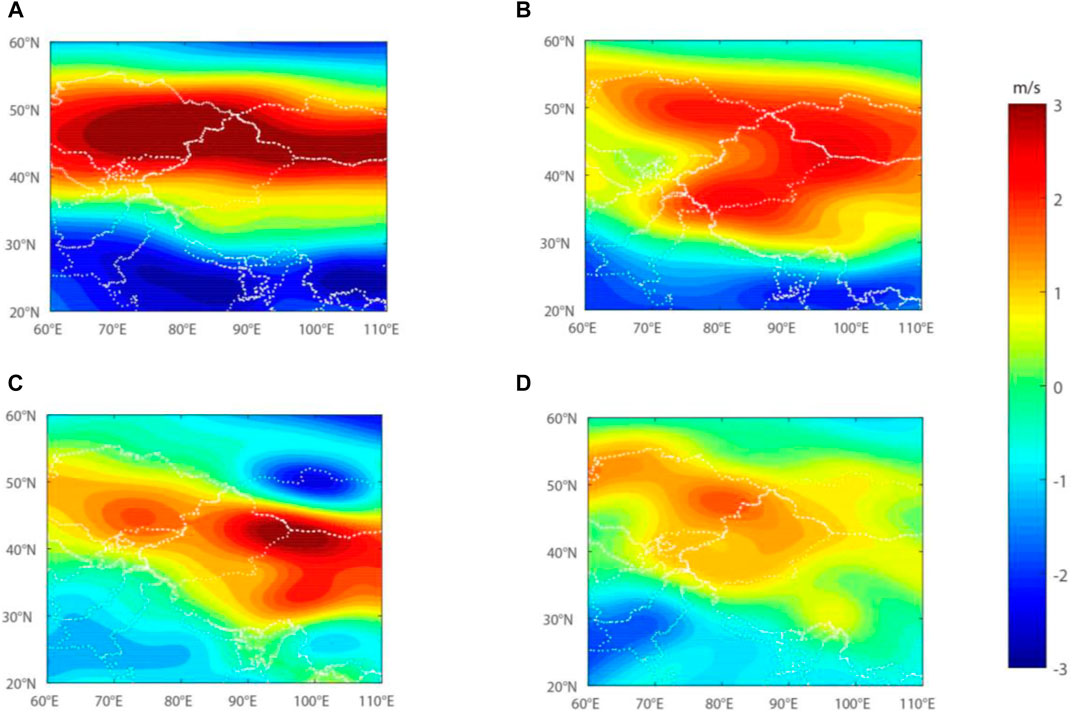
FIGURE 11. Difference of zonal wind speed between rising period 1960–1980 (A,C), 2000–2015 (B,D) and declining period (1981–1999) for 500 hPa (A,B) and 200 hPa (C,D).
The cross-section of the mean zonal wind difference of 70°–100°E indicates that the strengthening trends of westerly jet are coherent at all different height levels, shown in Figure 12. The difference of the high-altitude wind field between the rising and declining periods of dust events show that the changes of the East Asian atmospheric circulation, which dominates the high-altitude wind fields of the area, would lead to changes in the surface wind and precipitation, thereby changing the frequency of dust events.
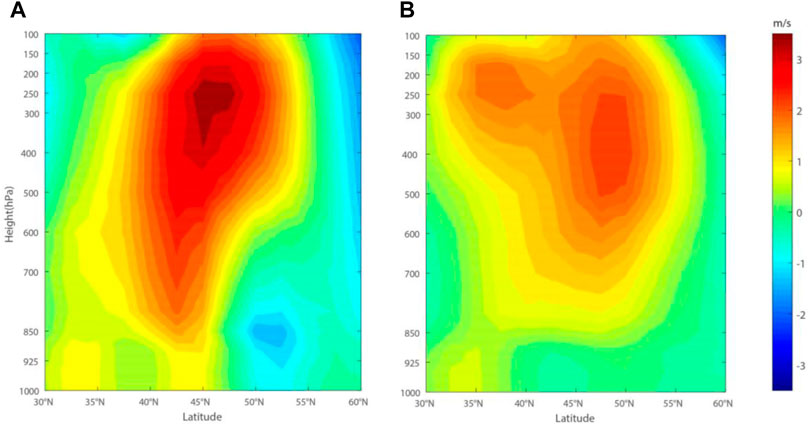
FIGURE 12. Cross-section of difference of average zonal wind speed (70–100E°) between (A) rising period 1960–1979, (B) 2000–2015 and declining period (1990–1999).
This study investigates the temporal and spatial distribution and the long-term trends of dust events in Xinjiang based on ground-based observation during 1960–2015. The dust events of Xinjiang Basin happen frequently in spring and summer, each year more than 73% of the dust events occurring in these two seasons. The dust events in the Southern Xinjiang are significantly more than that in the northern, and the high incidence area is distributed along the Taklamakan Desert. The DI generally increased during the 1960s–1970s and dramatically decreased in the 1980s–1990s, and then increased in a new active period after 2000. The main factors that influence the variations of dust events are also studied by ground meteorological fields, NECP reanalysis data and NOAA NDVI data. In Southern Xinjiang, there is a significant downward trend of DI in the past 56 years with a linear decreasing rate −8.2years−1. Simultaneously, surface wind speed also indicates a similar decline trend. There is an positive correlation coefficient 0.79 between DI and surface wind, but after 2000 the increase of the DI is not as strong as wind speed rising with the correlation coefficient reducing to 0.34. By analysing the precipitation during different periods, it is found that the average annual total amount and frequency of precipitation increased by 17.4 and 13% in 2000–2015 compared with 1960–1999, respectively, and the NDVI which represents the vegetation condition also shows an increasing trend. That indicates the increase of precipitation and improvement of surface condition will suppress the occurrence of dust events. Furthermore, the high-altitude wind field analysis displays that the variation of the East Asian general circulation’s intensity that dominates the upper-level wind fields in the Xinjiang Basin could affect the near-surface wind speed and precipitation, and further the dust activities.
The original contributions presented in the study are included in the article/supplementary material, further inquiries can be directed to the corresponding authors.
All authors listed have made a substantial, direct, and intellectual contribution to the work and approved it for publication.
This research was funded by the National Key Research and Development Program of China (2020YFA0608402) and the National Key Research and Development Program of China (2018YFC1506701).
The authors declare that the research was conducted in the absence of any commercial or financial relationships that could be construed as a potential conflict of interest.
All claims expressed in this article are solely those of the authors and do not necessarily represent those of their affiliated organizations, or those of the publisher, the editors and the reviewers. Any product that may be evaluated in this article, or claim that may be made by its manufacturer, is not guaranteed or endorsed by the publisher.
Albrecht, B. A. (1989). Aerosols, Cloud Microphysics, and Fractional Cloudiness. Science 245 (4923), 1227–1230. doi:10.1126/science.245.4923.1227
Bao, A., Huang, Y., Ma, Y., Guo, H., and Wang, Y. (2017). Assessing the Effect of EWDP on Vegetation Restoration by Remote Sensing in the Lower Reaches of Tarim River. Ecol. Indicators 74, 261–275. doi:10.1016/j.ecolind.2016.11.007
Cabrerizo, M. J., Medina-Sánchez, J. M., González-Olalla, J. M., Villar-Argaiz, M., and Carrillo, P. (2016). Saharan Dust Inputs and High UVR Levels Jointly Alter the Metabolic Balance of marine Oligotrophic Ecosystems. Sci. Rep. 6 (1), 35892. doi:10.1038/srep35892
CCTV-News (2021). Ministry of Ecology and Environment: There Have Been 21 Dust Weather Events in Northern China This Year. [Online]. Available: http://m.news.cctv.com/2021/05/26/ARTI9tg58ixubbJ2KTKTltBW210526.shtml (Accessed 6 1, 2021).
Chen, S., Tong, B., Dong, C., Wang, F., Chen, B., Cheng, C., et al. (2020). Retrievals of Aerosol Layer Height during Dust Events over the Taklimakan and Gobi Desert. J. Quantitative Spectrosc. Radiative Transfer 254, 107198. doi:10.1016/j.jqsrt.2020.107198
Ge, J. M., Huang, J. P., Xu, C. P., Qi, Y. L., and Liu, H. Y. (2014). Characteristics of Taklimakan Dust Emission and Distribution: A Satellite and Reanalysis Field Perspective. J. Geophys. Res. Atmos. 119 (20), 11,772–11,783. doi:10.1002/2014JD022280
Hu, Z., Huang, J., Zhao, C., Jin, Q., Ma, Y., and Yang, B. (2020). Modeling Dust Sources, Transport, and Radiative Effects at Different Altitudes over the Tibetan Plateau. Atmos. Chem. Phys. Discuss. 20 (3), 1507–1529. doi:10.5194/acp-20-1507-2020
Indoitu, R., Orlovsky, L., and Orlovsky, N. (2012). Dust Storms in Central Asia: Spatial and Temporal Variations. J. Arid Environments 85, 62–70. doi:10.1016/j.jaridenv.2012.03.018
Jin, L., He, Q., Li, Z., Deng, M., and Abbas, A. (2021). Interannual and Seasonal Variations of Sand-Dust Events in Tarim Basin, China. Res. Sq. doi:10.21203/rs.3.rs-327333/v1
Kang, L., Huang, J., Chen, S., and Wang, X. (2016). Long-term Trends of Dust Events over Tibetan Plateau during 1961-2010. Atmos. Environ. 125, 188–198. doi:10.1016/j.atmosenv.2015.10.085
Li, D., and Zhong, H. (2007). The Climatic Formation Cause and the Future Developing Trend of Sand-Dust Storm in China. China Environ. Sci. 27 (1), 14–18. doi:10.3321/j.issn:1000-6923.2007.01.005
Li, J., Garshick, E., Al-Hemoud, A., Huang, S., and Koutrakis, P. (2020). Impacts of Meteorology and Vegetation on Surface Dust Concentrations in Middle Eastern Countries. Sci. Total Environ. 712, 136597. doi:10.1016/j.scitotenv.2020.136597
Li, X., and Liu, X. (2015). Relation of Spring Dust-Storm Activities in Northern China and Changes of Upper Westerlies. Plateau Meteorology 34 (5), 1292–1300. doi:10.7522/j.issn.1000-0534.2014.00067
Linares, C., Culqui, D., Belda, F., López-Bueno, J. A., Luna, Y., Sánchez-Martínez, G., et al. (2021). Impact of Environmental Factors and Sahara Dust Intrusions on Incidence and Severity of COVID-19 Disease in Spain. Effect in the First and Second Pandemic Waves. Environ. Sci. Pollut. Res. 16, 1–13. doi:10.1007/s11356-021-14228-3
Liu, L., Guo, J., Gong, H., Li, Z., Chen, W., Wu, R., et al. (2019). Contrasting Influence of Gobi and Taklimakan Deserts on the Dust Aerosols in Western North America. Geophys. Res. Lett. 46 (15), 9064–9071. doi:10.1029/2019GL083508
Ma, M., Yang, X., Zhou, C., He, Q., and Mamtimin, A. (2020). Contributions of Dusty Weather and Dust Devil to Dust Emission Amounts at the Northern Margin of the Taklimakan Desert. Nat. Hazards 103 (1), 1441–1454. doi:10.1007/s11069-020-04043-3
Ma, Y., Wang, X., Huang, Z., and Chen, C. (2006). Change in Space-Time Distribution of Sand-Dust and Influence of Climatic Factors. Arid Land Geogr. 29 (2), 178–185. doi:10.13826/j.cnki.cn65-1103/x.2006.02.003
Niu, S., Sun, J., Chen, Y., and Liu, H. (2001). Observation and Analysis of Mass Concentration of Dust and Sand Aerosol in spring in Helanshan Area. Plateau Meteorology 20 (1), 82–87.
Pi, H., Sharratt, B., and Lei, J. (2017). Atmospheric Dust Events in central Asia: Relationship to Wind, Soil Type, and Land Use. J. Geophys. Res. Atmos. 122 (12), 6652–6671. doi:10.1002/2016JD026314
Qian, Z. a., Cai, Y., Liu, J. T., Li, D. L., Liu, Z. M., and Song, M. H. (2004). Progress in the Study of Sandstorm in Northern China. J. Arid Land Resour. Environ. S1, 1–8. doi:10.3321/j.issn:0001-5733.2006.01.012
Shao, Y., Klose, M., and Wyrwoll, K.-H. (2013). Recent Global Dust Trend and Connections to Climate Forcing. J. Geophys. Res. Atmos. 118 (19), 11,107–11,118. doi:10.1002/jgrd.50836
Sokolik, I. N., and Toon, O. B. (1999). Incorporation of Mineralogical Composition into Models of the Radiative Properties of mineral Aerosol from UV to IR Wavelengths. J. Geophys. Res. 104, 9423–9444. doi:10.1029/1998JD200048
Struve, T., Pahnke, K., Lamy, F., Wengler, M., Böning, P., and Winckler, G. (2020). A Circumpolar Dust Conveyor in the Glacial Southern Ocean. Nat. Commun. 11 (1), 5655. doi:10.1038/s41467-020-18858-y
Tian, Y., Wang, Z., Pan, X., Li, J., Yang, T., Wang, D., et al. (2020). Influence of the Morphological Change in Natural Asian Dust during Transport: A Modeling Study for a Typical Dust Event over Northern China. Sci. Total Environ. 739, 139791. doi:10.1016/j.scitotenv.2020.139791
Twomey, S. (1977). The Influence of Pollution on the Shortwave Albedo of Clouds. J. Atmos. Sci. 34 (7), 1149–1152. doi:10.1175/1520-0469(1977)034<1149:tiopot>2.0.co;2
Wallden, A., Graff, P., Bryngelsson, I.-L., Fornander, L., Wiebert, P., and Vihlborg, P. (2020). Risks of Developing Ulcerative Colitis and Crohn's Disease in Relation to Silica Dust Exposure in Sweden: a Case-Control Study. BMJ Open 10 (2), e034752. doi:10.1136/bmjopen-2019-034752
Wang, S., Wang, J., Zhou, Z., and Shang, K. (2005). Regional Characteristics of Three Kinds of Dust Storm Events in China. Atmos. Environ. 39 (3), 509–520. doi:10.1016/j.atmosenv.2004.09.033
Wang, S., Wang, X., Chen, D., Ji, C., Jiang, Y., and Liu, J. (2019a). The Spatial and Temporal Variation Characteristics and Influencing Factors of Dust Weather in the Southern Xinxiang from 1961 to 2017. J. Arid Land Resour. Environ. 33 (9), 81–86. doi:10.13448/j.cnki.jalre.2019.269
Wang, W., Huang, J., Minnis, P., Hu, Y., Li, J., Huang, Z., et al. (2010). Dusty Cloud Properties and Radiative Forcing over Dust Source and Downwind Regions Derived from A-Train Data during the Pacific Dust Experiment. J. Geophys. Res. 115 (D4), 1–17. doi:10.1029/2010JD014109
Wang, W., Huang, J., Zhou, T., Bi, J., Lin, L., Chen, Y., et al. (2013). Estimation of Radiative Effect of a Heavy Dust Storm over Northwest China Using Fu-Liou Model and Ground Measurements. J. Quantitative Spectrosc. Radiative Transfer 122, 114–126. doi:10.1016/j.jqsrt.2012.10.018
Wang, W., Sheng, L., Dong, X., Qu, W., Sun, J., Jin, H., et al. (2017). Dust Aerosol Impact on the Retrieval of Cloud Top Height from Satellite Observations of CALIPSO, CloudSat and MODIS. J. Quantitative Spectrosc. Radiative Transfer 188, 132–141. doi:10.1016/j.jqsrt.2016.03.034
Wang, W., Sheng, L., Jin, H., and Han, Y. (2015). Dust Aerosol Effects on Cirrus and Altocumulus Clouds in Northwest China. J. Meteorol. Res. 29 (5), 793–805. doi:10.1007/s13351-015-4116-9
Wang, X., Huang, J., Ji, M., and Higuchi, K. (2008). Variability of East Asia Dust Events and Their Long-Term Trend. Atmos. Environ. 42 (13), 3156–3165. doi:10.1016/j.atmosenv.2007.07.046
Wang, Y., Zhang, H., Chen, H., and Chai, F. (2019b). The Sources and Transport of Iron in the North Pacific and its Impact on marine Ecosystems. Atmos. Oceanic Sci. Lett. 12 (1), 30–34. doi:10.1080/16742834.2019.1545513
Xiu, P., and Chai, F. (2021). Impact of Atmospheric Deposition on Carbon Export to the Deep Ocean in the Subtropical Northwest Pacific. Geophys. Res. Lett. 48 (6), e2020GL089640. doi:10.1029/2020GL089640
Yasukawa, K., Ohta, J., Miyazaki, T., Vaglarov, B. S., Chang, Q., Ueki, K., et al. (2019). Statistic and Isotopic Characterization of Deep‐Sea Sediments in the Western North Pacific Ocean: Implications for Genesis of the Sediment Extremely Enriched in Rare Earth Elements. Geochem. Geophys. Geosyst. 20 (7), 3402–3430. doi:10.1029/2019GC008214
Yuan, J., Bian, Z., Yan, Q., Gu, Z., and Yu, H. (2020). An Approach to the Temporal and Spatial Characteristics of Vegetation in the Growing Season in Western China. Remote Sensing 12 (6), 945. doi:10.3390/rs12060945
Zeng, Z., Ziegler, A. D., Searchinger, T., Yang, L., Chen, A., Ju, K., et al. (2019). A Reversal in Global Terrestrial Stilling and its Implications for Wind Energy Production. Nat. Clim. Chang. 9 (12), 979–985. doi:10.1038/s41558-019-0622-6
Zhang, H., Xue, L., Wei, G., Dong, Z., and Meng, X. (2020). Assessing Vegetation Dynamics and Landscape Ecological Risk on the Mainstream of Tarim River, China. Water 12 (8), 2156. doi:10.3390/w12082156
Zhong, H., and Li, D. (2005). Relationship between Sand-Dust Storm in NorthernChina in April and Westerly Circulation. Plateau Meteorology 24 (1), 104–111. doi:10.3321/j.issn:1000-0534.2005.01.016
Keywords: Xinjiang basin, dust event, dust index, temporal-spatial variation, wind, precipitation, NDVI
Citation: Mu L, Su J, Mo X, Peng N, Xu Y, Wang M and Wang J (2021) The Temporal-Spatial Variations and Potential Causes of Dust Events in Xinjiang Basin During 1960–2015. Front. Environ. Sci. 9:727844. doi: 10.3389/fenvs.2021.727844
Received: 19 June 2021; Accepted: 10 August 2021;
Published: 25 August 2021.
Edited by:
Zhiwei Xu, Nanjing University, ChinaCopyright © 2021 Mu, Su, Mo, Peng, Xu, Wang and Wang. This is an open-access article distributed under the terms of the Creative Commons Attribution License (CC BY). The use, distribution or reproduction in other forums is permitted, provided the original author(s) and the copyright owner(s) are credited and that the original publication in this journal is cited, in accordance with accepted academic practice. No use, distribution or reproduction is permitted which does not comply with these terms.
*Correspondence: Jing Su, anN1QGx6dS5lZHUuY24=; Xinyue Mo, bW94eTE2QGx6dS5lZHUuY24=
†These authors have contributed equally to this work and share first authorship
Disclaimer: All claims expressed in this article are solely those of the authors and do not necessarily represent those of their affiliated organizations, or those of the publisher, the editors and the reviewers. Any product that may be evaluated in this article or claim that may be made by its manufacturer is not guaranteed or endorsed by the publisher.
Research integrity at Frontiers

Learn more about the work of our research integrity team to safeguard the quality of each article we publish.