
95% of researchers rate our articles as excellent or good
Learn more about the work of our research integrity team to safeguard the quality of each article we publish.
Find out more
ORIGINAL RESEARCH article
Front. Environ. Sci. , 28 October 2021
Sec. Biogeochemical Dynamics
Volume 9 - 2021 | https://doi.org/10.3389/fenvs.2021.724950
This article is part of the Research Topic Greenhouse Gas Emissions and Terrestrial Ecosystems View all 10 articles
 Uttam Kumar Sahoo1*
 Om Prakash Tripathi2
 Arun Jyoti Nath3
 Sourabh Deb4
 Dhruba Jyoti Das5
 Asha Gupta6
 N. Bijayalaxmi Devi7
 Shiva Shankar Charturvedi8
 Soibam Lanabir Singh1,9
 Amit Kumar10*
 Brajesh Kumar Tiwari8
In the modern era, rapid anthropogenic activities in the vicinity of the Himalayas disturb the carbon sequestration potential resulting in climate change. For the first time, this study estimates the biomass and carbon storage potential of Northeast India’s diverse land uses through a biomass estimation model developed for this region. The mean tree density in tropical, subtropical, and temperate forests was 539, 554, and 638 trees ha−1, respectively. The mean vegetation carbon stock was the highest for temperate forests (122.09 Mg C ha−1), followed by subtropical plantations (115.45 Mg C ha−1), subtropical forests (106.01 Mg C ha−1), tropical forests (105.33 Mg C ha−1), tropical plantations (93.00 Mg C ha−1), and temperate plantations (50.10 Mg C ha−1). Among the forests, the mean soil organic carbon (SOC) stock up to 45 cm depth was the highest for tropical forests (72.54 Mg C ha−1), followed by temperate forests (63.4 Mg C ha−1) and subtropical forests (42.58 Mg C ha−1). A strong relationship between the tree basal area and biomass carbon storage was found for all land-use types. The land-use transformation from agriculture to agroforestry, and grassland to plantations increased both vegetation carbon (VC) and SOC stocks. The corresponding increase in VC and SOC was 40.80 and 43.34 Mg C ha−1, respectively, in the former, and 83.18 and 97.64 Mg C ha−1 in the latter. In general, the landscape-level estimates were drawn from site-level estimates in a given land-use type, and therefore, the corresponding values might be overestimated. Nevertheless, the results provide baseline information on carbon stock which may serve as a reference for devising appropriate land-use change policies in the region.
Since the mid-1900s, many objectives of global climate change research have shifted to reducing terrestrial carbon sources and enhancing sinks as a means of combating future climate change under carbon dioxide (CO2) enrichment (Kumar et al., 2017). In general, CO2 is a predominant greenhouse gas (GHG) in the atmosphere and a major contributor (>50%) to global warming. Studies have reported that a rapid change in land-use alone contributes to nearly 10% of global anthropogenic CO2 emissions (IPCC, 2007; Le Quere et al., 2016). The tropical zones have shown an increased accumulation of atmospheric CO2 to >400 ppm in 2015 (Betts et al., 2016), and this accumulation is projected to exceed 500 ppm by 2050 (Cai et al., 2014). Furthermore, the rapid increase of atmospheric CO2 concentration will increase earth’s surface temperature and further cause negative impacts (e.g., sea level rise, flooding, and increase ecological and human health risk) (IPCC, 2007; IPCC, 2014; Kumar et al., 2021). To combat these effects of climate change, the United Nations Framework Convention on Climate Change (UNFCCC) formulated “Reduction of Emissions from Deforestation and Forest Degradation” (REDD) policy in 2007, which was further enacted as REDD+ in 2010 (UNFCCC, 2008) to conserve and manage 2015 Pg (1 Pg = 1 giga ton = 1015g = 1 million metric ton) of global terrestrial C stock. As per an estimate, the carbon emission from land-use change was 0.9 Pg C yr−1 during 2005 to 2014 (Le Quere et al., 2016). The Paris Agreement (2015) further emphasized on limiting the global temperature increase to 2°C by 2,100 and pursuing efforts to generate more carbon via agricultural materials through both conventional mitigation efforts and alternative routes (Gupta and Kumar, 2020; Kumar and Gupta, 2020), so as to limit the global temperature increase to 1.5°C. Terrestrial carbon stocks, especially in northeast India, are hotspots of current research as it covers an area of 26.3 million hectares which is equivalent to 8% of the total geographical area, and represents ∼25% of the country’s total forest area. In this perspective, studies on carbon accumulation in various pools (e.g., soil, vegetation, litter, etc.) in the terrestrial ecosystem can advance our understanding of climate change adaptation and mitigation. The rapid land-use change in Northeast India is driving climate change and biodiversity loss (Brahma et al., 2018; Ahirwal et al., 2021a; Deb et al., 2021). Thus, the conservation and sustainable development of land-use systems are expected to stabilize CO2 accumulation at the local, regional, and national levels. Moreover, the accurate estimation of biomass, soil carbon stocks, and their spatial distribution in various habitats will be crucial to understanding carbon storage potential and its dynamics (Weiskittel et al., 2015; Singh et al., 2018a).
Biomass estimation models are of immense importance for climate change studies. There is a continuous change of biomass density at individual forest stand and other woodlands due to land-use change, and anthropogenic activities triggered by climate change events (Ahirwal et al., 2021a). These changes are of paramount importance in influencing the global carbon cycle (Qiu et al., 2015; Pellikka et al., 2018). The measurement of biomass at plot levels especially on a mountainous hilly terrain is extremely labor intensive, and due to heterogeneity in landscape, it is practically impossible to cover vast landscape for carbon accounting without bias (Brahma et al., 2021). A precise estimation of carbon across different ecosystems will be desirable to increase our understanding of the location and magnitude of carbon density, and identify the carbon source and sink. The use of the locally developed robust biomass model would be critical in this direction for a more reliable and accurate biomass estimation, and reporting to national carbon stock enhanced knowledge on the carbon budget at both local and regional scales and in relation to the current climate change scenario (Thangjam et al., 2019).
Several factors such as land history, inherent climatic conditions, vegetation patterns and types, and land-use and its management practices play a vital role in influencing the carbon storage and sequestration rate in different carbon pools (Zhang et al., 2015). Over the last decades, environmentalists and policy-makers have become more aware of the vital role that tree diversity plays in combating climate change, and this has prompted them to be more conscious while designing any climate change mitigation and adaptation strategy (Con et al., 2013; Bhat et al., 2020; Sheikh et al., 2021). It has been established that plantation forestry (Brahma et al., 2017; Singh et al., 2018a; Nath et al., 2018; Kurmi et al., 2020), agroforestry (Tamang et al., 2021), and home gardens (Singh et al., 2015; Singh and Sahoo, 2021) have great potential for carbon sink in the Northeastern region of India. Similarly, secondary forests (accounting for variation in age) play an important role in carbon storage (Gogoi et al., 2020; Thong et al., 2020). One of the basic prerequisites for the accurate estimation of biomass stock at the regional and global scales is the use of appropriate models. Till today, only generic models, including those developed by Brown et al. (1989), Chambers et al. (2001) Chave et al. (2005), and Chave et al. (2014), have been used to estimate biomass and carbon stocks for diverse forests in the Northeastern region of India. However, the accuracy of biomass estimates using these models has rarely been tested. To overcome this uncertainty, there is an urgent need to develop a regional biomass estimation model to predict medium and long-term biomass and carbon stocks under different land uses, which could be highly useful for regional and/or global biodiversity conservation.
Computation of the landscape level and carbon storage facilitates the understanding of biogeochemical cycle, carbon dynamic (source/sink), and regional carbon cycle (Weiskittel et al., 2015). Geostatistics and remote sensing techniques have been frequently used for the purpose of extrapolation (Kumar et al., 2015). The use of active remote sensing images like the Moderate Resolution Imaging Spectroradiometer (MODIS), Light Detection and Ranging (LIDAR), Phased Array L-based Synthetic Aperture Radar (PULSAR), and indices such as the Normalized Difference Vegetation Index (NDVI), and the Leaf Area Index (LAI) coupled with field inventory are on the rise to estimate biomass in timely and cost-effective manners, especially on hilly terrains. In Northeast India, some efforts have been made to estimate forest biomass and carbon stock using remote sensing images for a particular state or a forest type in Tripura (Pandey et al., 2019), Manipur (Sharma et al., 2020), Arunachal Pradesh (Kumar et al., 2019), and Assam (Hussain et al., 2019). The use of remote sensing techniques for estimating carbon stock from a variety of complex land uses is often more challenging due to the lack of accurate and consistent measurement methods (Issa et al., 2020). For example, using remote sensing to trace transitions from intact forests to degraded forests on the same landscape may yield the same closed canopy area, while the carbon stock may have plummeted to 75% (UNFCCC, 2006). Low-vegetation signal-to-noise ratios, high soil background reflectance in shifting cultivation areas, and high spatial heterogeneity from plot to state-level data hamper the calibration and evaluation of data (Issa et al., 2020). These constraints pose unique challenges specific to varying environmental conditions and result in high inaccuracies when applying biomass estimation techniques for other ecosystems/land uses. To overcome these challenges and in view of the fact that there are no efforts to estimate the biomass of different habitats at a regional level, innovative ground-level field inventories using the best-fit equations for tree and other woody vegetation were necessitated (Brahma et al., 2021). The present study is the first of its kind for accounting for carbon from different land-use sectors at a regional scale. Further lack of accurate data on carbon stock and sequestration potential under land-use sectors makes this study indispensable. Therefore, the objective of the present study was to develop a robust regional model to estimate tree diversity, biomass, carbon stock, and sequestration potential under different land uses in the Northeast region of India. It also aimed to develop a relationship between tree basal areas and density with the biomass carbon storage at different pools for various land uses so that effective mitigation and adaptation strategies could be developed in advance to combat future climate change.
Northeast India accounts for 8% of the geographical area and ∼25% of the forest cover of India. The region is currently facing dual pressure of economic growth and environmental protection. The region is endowed with diverse land-use types. Besides various forest types, several other tree-based ecosystems such as traditional agroforestry, home gardens, plantations, and secondary forests that provide livelihood opportunities for rural populace are widely prevalent in the region. We selected seven major land uses viz., 1) forest: tropical, subtropical, and temperate; 2) bamboo forest; 3) plantation: tropical, subtropical, and temperate; 4) shifting cultivation fallows: <5 years, 5–10 years, and 11–20 years; 5) agricultural lands; 6) agroforestry; and 7) grasslands, in Northeast India. The agricultural land includes wet rice cultivation. The plantations include rubber (Hevea brasiliensis), areca nut (Areca catechu), oil palm (Elaeis guineensis), and orange (Citrus sinensis), while agroforestry involved traditional home gardens, coffee (Coffea sp.), piper (Piper betel), sugarcane (Saccharum officinarum), and mango-based systems (Mangifera indica) for the study. The area and proportion of each land use have been given in Supplementary Table S1. The estimated above ground biomass (AGB) data of each land use for different northeast Indian states was used to prepare the spatial distribution map. The classified Land Use and Land Cover (LULC) map of each state in the studied region was utilized to estimate the total area coverage under each land use (Figure 1). The LULC map was developed by integrating land image data of the concerned area over a particular time span (from November 2015 to February 2016) using freely available Landsat 8 Operational Land Imager (Landsat OLI) present on the data portal of the United States Geological Survey (USUG): “Earth Explorer”(https://earthexplorer.usug.gov). All the imageries were geo-referenced to Common Universal Traverse Mercator (UTM) projection UTM zone 46 and WSG 84 datum.
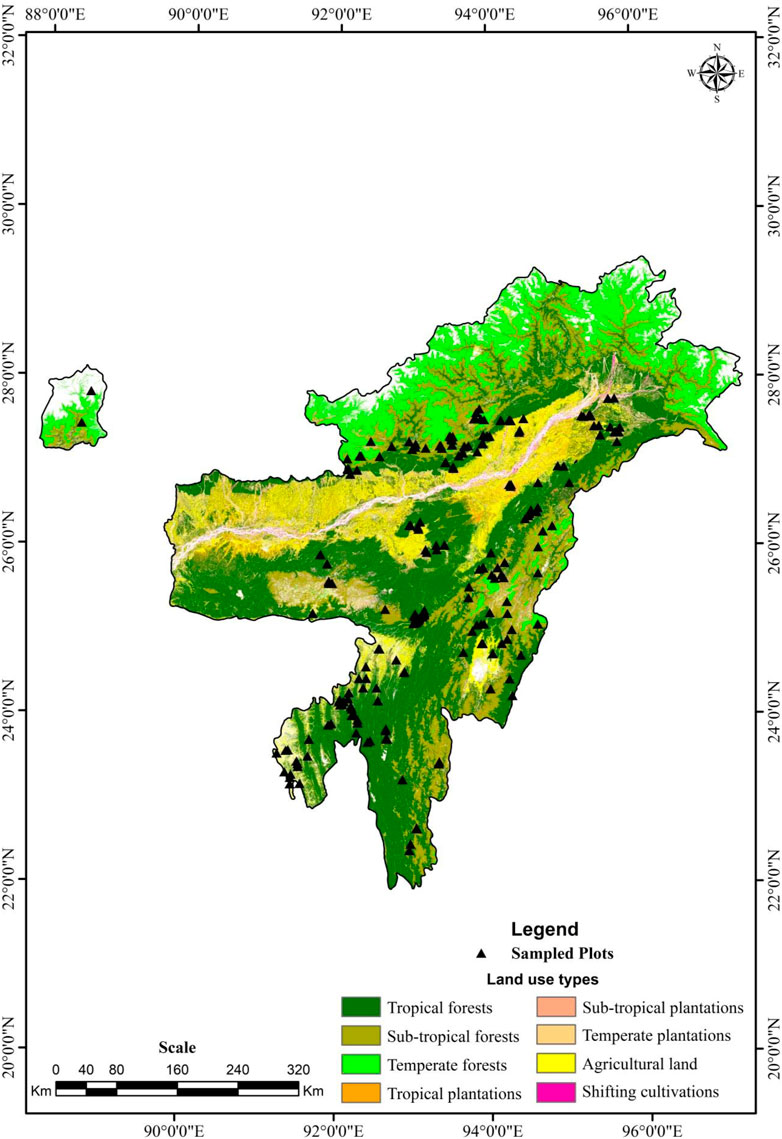
FIGURE 1. Spatial distribution of major land uses showing sampling plots in northeast India.
All the major land-use sectors were stratified, and sub-stratified/classified based on forest types, canopy cover, crop composition, and age of plantation/shifting cultivation, and representative eight permanent sites (250 m × 250 m) were established in each of the eight northeastern states following the ISRO–GBP/NCP–VCP protocol (Singh and Dadhwal, 2009). The field inventory on tree composition, biomass, soil, and carbon estimation from various pools was estimated from the sample quadrant plots of representative size: 0.1 ha (31.62 m × 31.62 m) following standard methods and other studies carried out during 2016–2019. For each site and each land use, four 0.1 ha permanent plots were fixed at the four corners of the site. The number of sampling sites in tropical, subtropical, temperate, and bamboo forests were 231, 40, 12, and 12, respectively. The number of sampling sites for tropical, subtropical, and temperate plantations were 87, 31, and 9, respectively, and for <5 years, 5–10 years, and 11–20 years shifting cultivation fallows, the number of sampling sites were 34, 17, and 7, respectively. The data for agroforestry, agriculture, and grasslands were drawn from 69, 89, and 23 sampling sites, respectively. All trees having ≥ 10 cm dbh (diameter at breast height, i.e., 1.37 m from the base) in each plot were measured for vegetation parameters such as species richness, density, and diversity following standard methods. Diversity indices including the Shannon–Wiener diversity index (Shannon and Weiner, 1963), species richness (Margalef, 1958), species evenness (Pielou, 1966) and species dominance (Simpson, 1949) were determined for all the major land uses. The basal area values of these trees were collected from the calculated mean of four plots at four corners of the site in a given sampling site and were further expanded to per hectare basis.
In Northeast India, the widely used generalized models for estimating biomass have rarely been validated by ground truthing. Besides this, different species-specific models have certain limitations in adhering to sufficient sample size, sampling strategy, validation, etc., resulting in large degrees of uncertainty in obtaining accurate biomass estimation from diverse forest ecosystems (Weiskittel et al., 2015). To overcome these issues, we used the biomass model developed by Nath et al. (2019) using 303 sample tree harvested data drawn from four major forest types of the region for calculation of AGB as
where AGBest = above ground biomass (Kg tree−1), D = diameter at breast height, and 1.32 = correction factor.
Cross-validation is usually recommended to determine how accurately the biomass estimation model will perform when applied to an independent dataset. Usually, 5-fold or 10-fold cross-validation provides a good balance between bias and variance (Sileshi, 2014; Thangjam et al., 2019). However, a 10-fold cross-validation was employed to evaluate the predictive performance of the biomass estimation models developed by Nath et al. (2019). The goodness of fit criteria were calculated for the validation dataset using the lava and forecast packages of the R package. It was found that with high R2 and low AICc, RMSE, and MAPE values (Nath et al., 2019), the biomass model was best suited for tree biomass estimation in Northeast India over the generic model developed by Brown (1989) and the two pantropical models developed by, Chave et al. (2005), Chave et al. (2014). Details of the model development and validation procedure are available in the study by Nath et al. (2019).
We also used species-specific biomass estimation models for rubber and areca nut plantation developed for this region (Brahma et al., 2018). Belowground biomass (BGB) was calculated from the equation given by Mokany et al. (2006), and its carbon stock was calculated as BGB = 0.205 × AGB when AGB < 125 Mg ha−1 and BGB = 0.235 × AGB when AGB > 125 Mg ha−1. Aboveground biomass carbon (AGBC) was estimated from the default value (47%) of total biomass (IPCC, 2003). Two soil profiles (1 m × 1 m × 1 m) were dug randomly within each 250 m × 250 m sized site, totaling eight profiles for a site, twice in 2016 and 2018. Soil samples in triplicates were collected from three depths (0–10, 10–20, and 20–45 cm) using a soil corer (5.6 cm dia). In addition to this, 72 bulk soil samples (8 profile × 3 depth × 3 replication) were obtained for each land use, air-dried, and sieved using 100 micron mesh for the assessment of SOC concentration following a widely used method called “wet oxidation method” (Walkley and Black, 1934). The SOC stock for each depth was computed following the method proposed by Blanco-Canqui and Lal (2008). Values for different soil depths were summed up to obtain SOC stock up to 0–45 cm. Soil bulk density (BD) was calculated following the procedure of Robertson et al. (1974). The carbon stock of major pools (AGB, BGB, and SOC stock) was summed up for particular land use to arrive at the total carbon stock (TCS). The rate of change (sequestration) in carbon stock was determined from the initial/baseline value (2016) to the final value (2018). The age of the land use was recorded by questioning the farmers during field survey. The carbon sequestration rate was estimated by dividing the change in the carbon stock values (between prior (CLU0) and immediate (CLUn) values) by the age of the land use/age interval (Dung et al., 2016), which is expressed as
The variation in tree density, basal area, and carbon stock under different land use was determined using the analysis of variance and Tukey HSD tests at 5% level. The relationships among tree basal area, density, and carbon in different pools of all land-uses were computed using correlation and regression analyses with statistical package SPSS-21 (SPSS Inc., Chicago, IL, United States ). All the basic analyses were done using Microsoft Office -2010.
The mean value of species richness varied significantly (p < 0.05) among land uses and ranged from 1.0 (subtropical plantations) to 12.22 (tropical forest). Tree species richness differed significantly (p < 0.05) between forest types and shifting cultivation fallows (Table 1). The Shannon–Wiener diversity index (H) varied significantly (p < 0.05) among different land uses, showing maximum value (2.40) in 11–20 years shifting cultivation fallows followed by temperate forest (2.39), tropical forest (2.20), 5–10 years shifting cultivation fallow (1.99), and minimum (0.02) in subtropical plantation (Table 1). The Simpson dominance index ranged from 0.09 (11–20 years shifting cultivation fallow) to 0.83 (tropical forest) and Pileou’s evenness index was maximum (0.99) in <5 years and 11–20 years shifting cultivation fallows and minimum (0.55) in bamboo forest (Table 1). Margalef’s species richness index was maximum (3.21) in tropical forests followed by 11–20 years shifting cultivation fallow (2.81) and minimum (0.61) in tropical plantation. Tropical forests had a mean stand density of 539 trees ha−1, and the corresponding values for subtropical and temperate forests were 554 trees ha−1 and 578 trees ha−1, respectively (Table 2). Among the tree plantations, those located in subtropical climate showed the highest stand density (840 trees ha−1), followed by tropical (598 trees ha−1) and temperate (344 trees ha−1). The culm density in bamboo forests was 6,550 culms ha−1. The mean tree density in shifting cultivation fallows varied from 140 trees ha−1 (<5 years fallow) to 703 tree ha−1 (11–20 years fallow). In agroforestry systems, the stand density was 744 trees ha−1 with a mean basal area of 14.35 ± 4.02 m2 ha−1. The temperate forests had the highest average basal area (29.50 ± 2.63 m2 ha−1) followed by subtropical (26.71 ± 2.18 m2 ha−1) and tropical forests (25.07 ± 1.01 m2 ha−1). The basal area of tree plantations also varied significantly and was in the order of subtropical (30.63 ± 6.46 m2 ha−1) > tropical plantation (26.86 ± 1.83 m2 ha−1) > temperate plantation (11.43 ± 1.57 m2 ha−1). Biomass values varied significantly (p < 0.05) between different land uses and ranged from 2.53 ± 0.51 Mg ha−1 (in grassland) to 259.77 ± 15.43 Mg ha−1 (in temperate forest), and were in the order of natural forests > plantations > older shifting cultivation fallows (5–10 and 11–20 years) >agroforestry > bamboo forest > agriculture (Table 2). The details of the dominant species and their respective density, importance value index, basal area, and biomass stock are provided in Supplementary Table S1
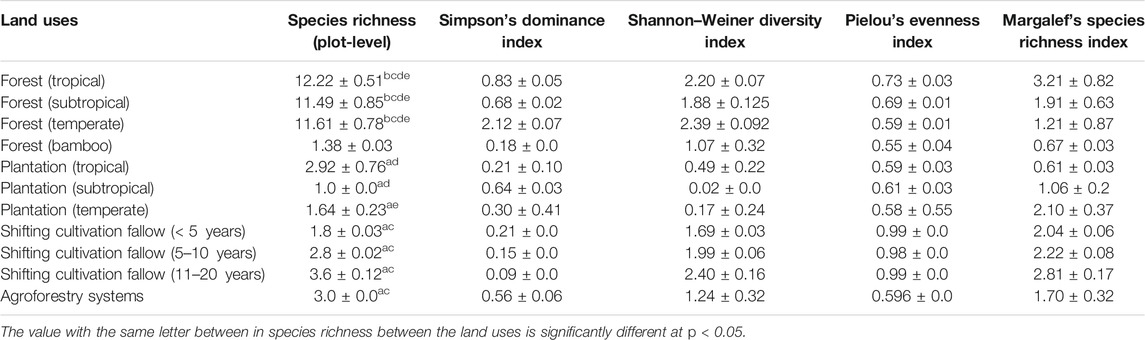
TABLE 1. Species richness and diversity indices of the tree species across different land-use sectors of Northeast India.
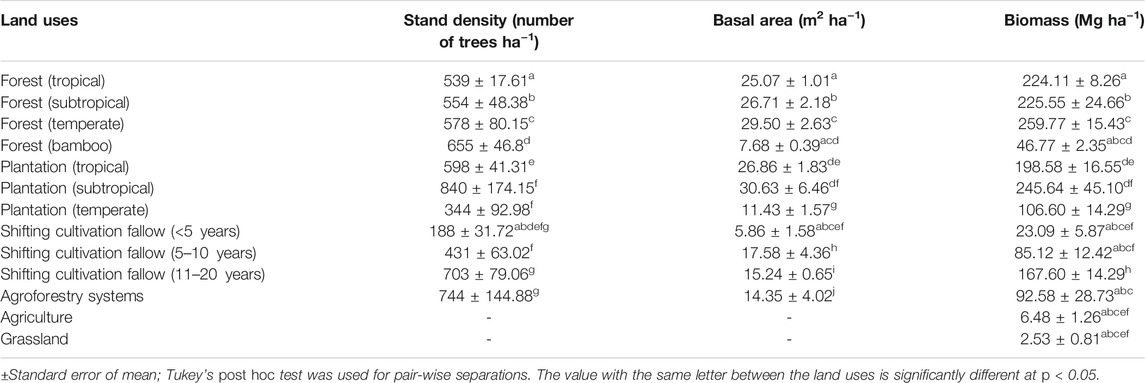
TABLE 2. Stand density, basal area, and biomass in major land-use sectors of Northeast India.
The mean value of AGBC stock was the highest (100.51 ± 11.33 Mg C ha−1) in temperate forest and lowest (0.96 ± 0.31 Mg C ha−1) in grassland. The mean vegetation carbon stock (ABG + BGB) was the highest (122.09 ± 13.59 Mg C ha−1) in temperate forests followed by subtropical (106.01 ± 11.59 Mg C ha−1) and tropical forests (105.33 ± 3.88 Mg C ha−1). The AGBC and total vegetation carbon in bamboo forest were 17.79 ± 1.46 Mg C ha−1 and 21.98 ± 1.80 Mg C ha−1, respectively (Figure 2). Vegetation carbon stock in the plantations were in the order of subtropical (115.45 ± 21.20 Mg C ha−1, range 57.15–266.5 Mg C ha−1) > tropical (93.00 ± 7.80 Mg C ha−1, range 7.23–341.92 Mg C ha−1) > temperate (50.10 ± 6.72 Mg ha−1, range 18.75–75.05 Mg C ha−1) zones. The agricultural land showed an average vegetation carbon stock of 2.71 ± 0.36 Mg C ha−1. The cumulative aboveground carbon storage in four major land-use sectors in Northeast India amounts to 212,675,8462 Mg C (2.13 Pg C) to which tropical, subtropical, and temperate forests contributed 67.68, 10.44, and 13.77%, respectively (Supplementary Table S2).
FIGURE 2. Vegetation carbon and soil organic carbon stocks (0–45 cm soil depth) in major land uses in Northeast India.
Among the forest types, the mean SOC stock was in the order of tropical forests (72.54 ± 2.02 Mg C ha−1) > temperate forests (63.4 ± 6.94 Mg C ha−1) > subtropical forests (42.58 ± 3.32 Mg C ha−1). SOC values in tropical forests ranged from 10.13–119.65 Mg C ha−1, and in temperate forests, its value varied between 22.32 and 114.59 Mg C ha−1. The mean SOC stock was 29.83 ± 0.97 Mg C ha−1, with variations from 25.28 to 34.67 Mg C ha−1 in bamboo forests (Table 3). The SOC stock in plantations was in the order of tropical > subtropical > temperate zones. On average, the SOC stock was the highest in 5–10 years fallows (84.56 ± 3.99 Mg C ha−1) followed by 11–20 years fallows (78.19 ± 2.09 Mg C ha−1) and <5 years fallows (75.76 ± 7.86 Mg C ha−1), and the mean SOC stock in agriculture land-use was 40.13 ± 1.77 Mg C ha−1. Total carbon stock (TCS) was maximum (185.5 ± 15.55 Mg C ha−1) in tropical forests and minimum (40.55 ± 7.77 Mg C ha−1) in grassland (Figure 2).
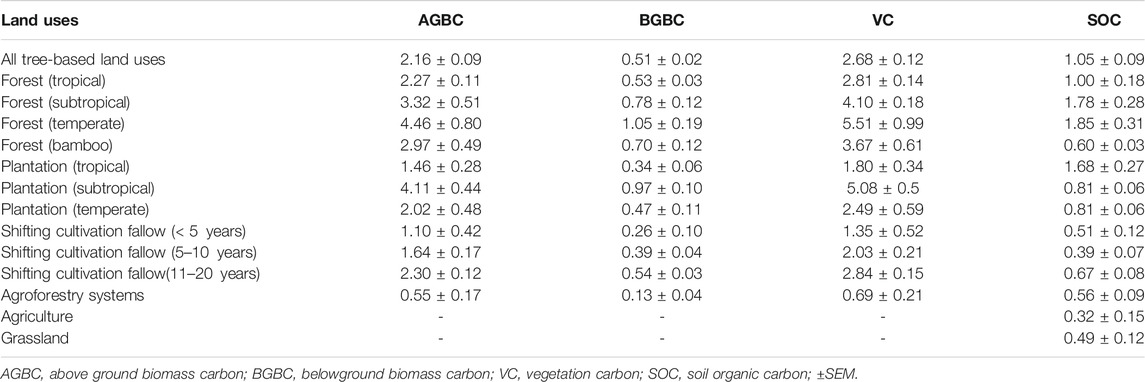
TABLE 3. Mean annual carbon increment (Mg C ha−1 yr−1) in different carbon pools of major land uses in Northeast India.
The mean annual increment (carbon sequestration) in vegetation pools varied between 1.80 Mg C ha−1 yr−1 (tropical plantations) and 5.51 Mg C ha−1 yr−1 (temperate forests). The carbon sequestration rate was significantly higher in forests (2.81–5.51 Mg C ha−1 yr−1), followed by plantations (1.80–5.08 Mg C ha−1 yr−1) and secondary forests (1.35–2.84 Mg C ha−1 yr−1). The results revealed that tree-based land uses registered an increase in vegetation carbon by 2.68 ± 0.12 Mg C ha−1 yr−1. SOC sequestration was the highest in temperate forests (1.85 ± 0.31 Mg C ha−1 yr−1), followed by subtropical forests (1.78 ± 0.28 Mg C ha−1 yr−1) and tropical forests (1.0 ± 0.18 Mg C ha−1 yr−1). Agriculture land use and shifting cultivation fallows (<5-years) showed the lowest rate of SOC sequestration (Table 3). The carbon sequestration rate was found to be significantly (p < 0.05) higher in plant biomass than in soil.
Significant positive relationships were observed between the basal area and tree density for all land uses, except temperate forests. However, no relationship between the basal area and SOC stock was observed, except in the tropical forests. Similarly, there was no relationship between the basal area and BGB carbon stock in the old (11–20 years) shifting cultivation fallows (Table 4).
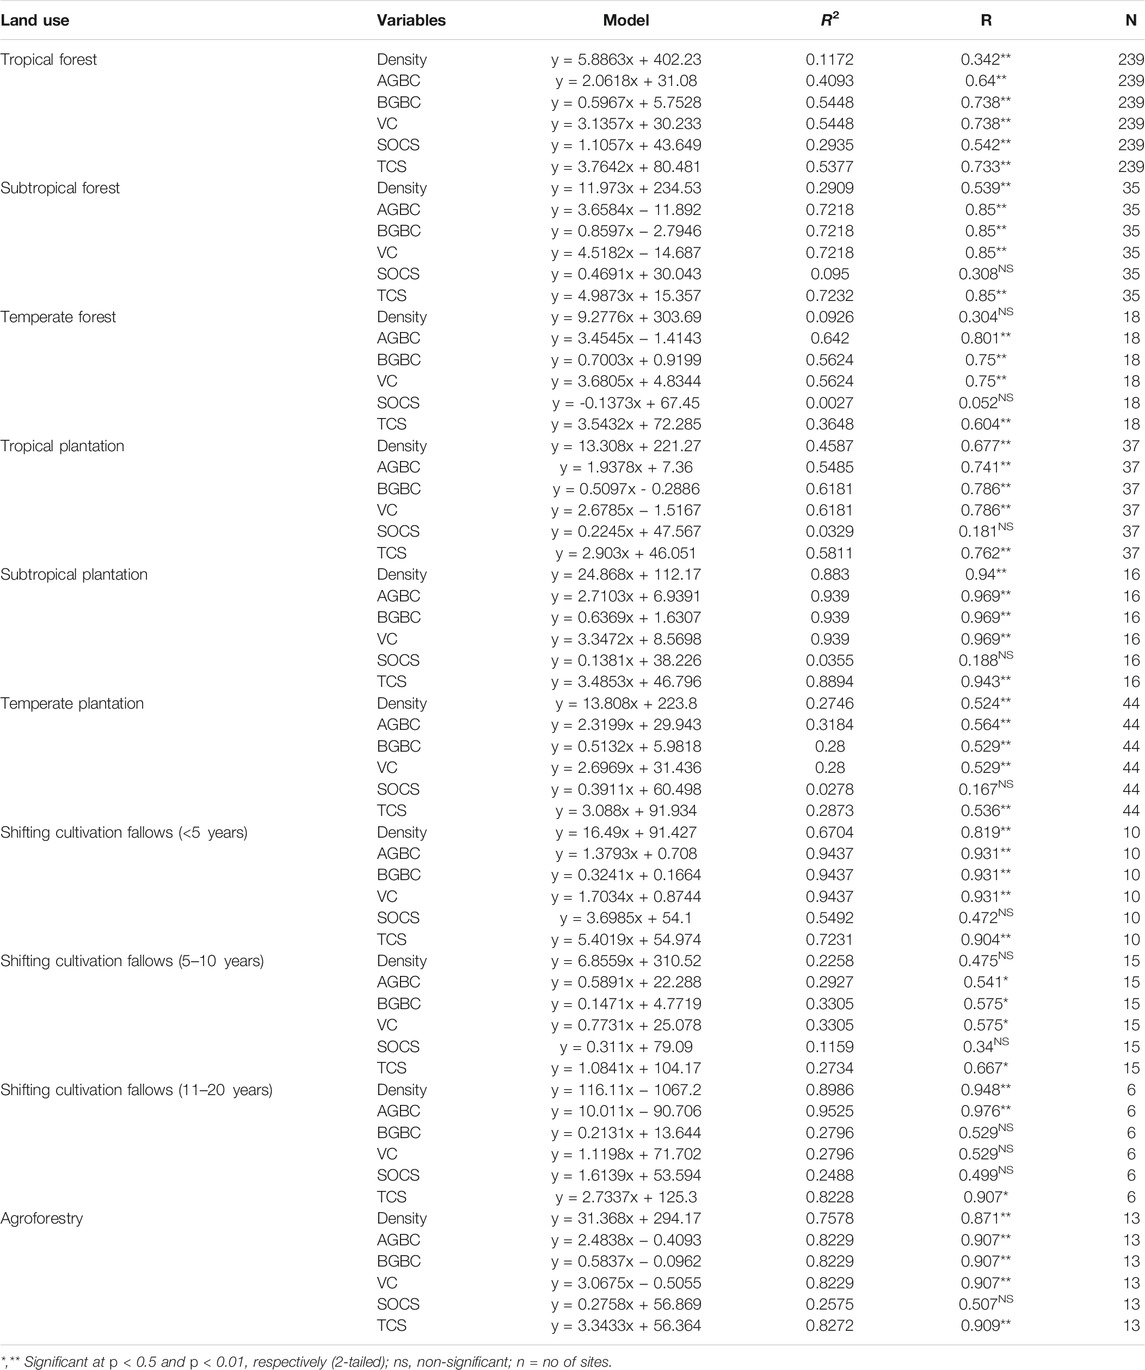
TABLE 4. Relationships among density, aboveground biomass carbon (AGBC), belowground biomass carbon (BGBC), vegetation carbon (VC), soil organic carbon stock (SOCS), and total carbon stock (TCS) with basal area of the trees in different land-use sectors of Northeast India.
Both progressive and retrogressive carbon change were noticed due to land-use change management. When the shifting cultivation fallows were vegetated with plantation/agroforestry, total biomass carbon stock increased, and it ranged from 21.58 to 97.34 Mg C ha−1 (Figure 3). This conversion, however, resulted in SOC loss from 3.87 to 17.66 Mg C ha−1. The conversion of land use from both agriculture and grassland to plantation, on the other hand, resulted in an increase of carbon in all pools (SOC and vegetation carbon). The conversion of natural forest to grassland, current shifting cultivation fallow (<5 years), plantation, and agroforestry resulted in the total carbon stock (TCS) loss which ranged from 28.68 Mg C ha−1 (plantation) to 126.32 Mg C ha−1 (grassland). These conversions also resulted in the maximum loss of vegetation carbon (VC) in grasslands (106.33 Mg C ha−1), followed by the current shifting cultivation fallow (101.80 Mg C ha−1) and the least in plantations (23.15 Mg C ha−1). The conversion of agroforestry to agriculture resulted in the loss of carbon from all pools. The increment in vegetation carbon was the highest (3.62 Mg C ha−1 yr−1) when the grasslands were converted to plantation forests. The SOC stock registered a 0.95 Mg C ha−1 yr−1 increase when less than 5 years shifting cultivation fallows were converted to tree plantations. Similarly, this land-use conversion (<5 years fallows to tree plantations) resulted in the highest (3.71 Mg C ha−1 yr−1) increase in total carbon sequestration (Table 5).
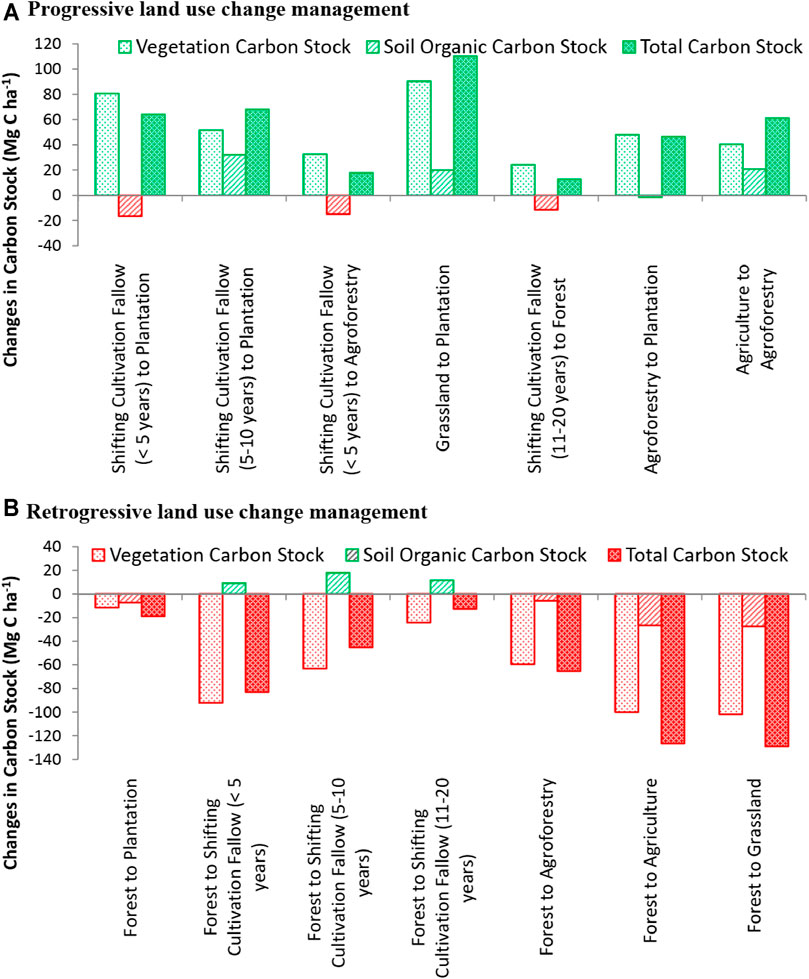
FIGURE 3. Changes in soil organic carbon stock (SOCS) (Mg C ha−1), vegetation carbon stock (VCS) (Mg C ha−1), and total carbon stock (TCS) (Mg C ha−1) with respect to (A) progressive and (B) retrogressive land-use change in Northeast India (the values of SOCS refers to 0–45 cm soil depth).
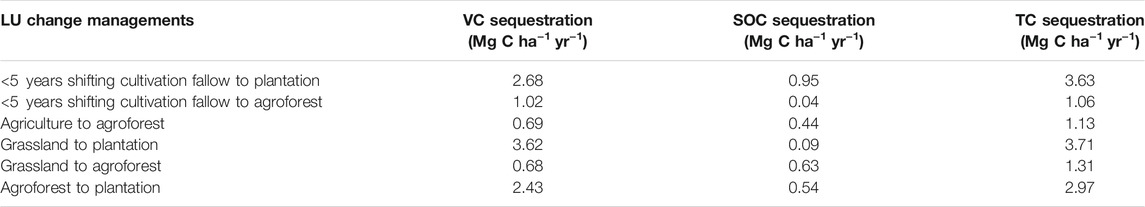
TABLE 5. Vegetation carbon (VC), soil organic carbon (SOC), and total carbon (TC) sequestration after progressive land-use changes in Northeast India.
Evidence from the existing literature advocates that climate change in the anthropogenic era has a direct effect on biodiversity, forcing tree species to adapt either through migrating, developing new physiological traits, or changing phenological cycles (Behera et al., 2019). Higher tree species richness indicates a more stable ecosystem and may demonstrate a better ecosystem/carbon service (Ives et al., 2001). Earlier reports from a similar geographical area suggest management practices and other human-induced disturbances such as small-scale mining, forest encroachment for agricultural expansion, fuelwood, and different non-timber forest product extraction influence tree richness and densities (Gogoi et al., 2018). Additionally, varying community structure, composition, topography, elevation, soil properties, and other microclimatic conditions also influence the tree-based ecosystems’ structural and functional attributes (Nath et al., 2018; Kurmi et al., 2020). Tree size and their growth pattern can influence the basal area and carbon stock (Borah et al., 2015). Many agroforests had lower diversity than the shifting cultivation fallows/secondary forests, and their total carbon stock was similar to the re-growing forests. The single-story vegetation in plantations favor homogenous growth environment, in contrast to the natural forests and shifting cultivation fallows. The forests, agroforests, and shifting cultivation fallows, as expected, had higher tree density and basal area than the plantation forests occupied by monoculture trees (Singh et al., 2018a). Relatively lower organic inputs and higher soil disturbance in the latter could have caused lower SOC stock than the former land uses (Singh et al., 2018b). Land uses may be non-randomly distributed based on the climatic conditions which subsequently influence tree biodiversity (Garcia-Vega et al., 2020). Natural forests had higher species richness, Shannon–Weiner diversity, and the species evenness index than other land uses. The presence of higher evenness or higher richness or both can result in increase in the Shannon–Wiener diversity (Magurran et al., 2004). Shannon diversity in different forests ranged from 1.21 to 2.66 in tropical, 0.28–2.65 in subtropical, and 1.93–2.56 in temperate forests. These values are well within the range reported by Nayak and Sahoo (2020), who found 1.59–2.56 in ten different tropical forest stands of the state of Odisha in India, while in Northeast India, the lowland rainforests showed tree diversity from 2.44 to 3.46 (Gogoi et al., 2018). In dry deciduous forests of central India, tree diversity values reported were 0.77–2.53 (Dar et al., 2019). Rapid urbanization and forest clearing deteriorate forest ecosystem adversely affect the microclimate, regeneration, and soil dynamics, and enhance the emission of greenhouse gases (Qiu et al., 2015; Pellikka et al., 2018). The scale of land-use transition in the region has significantly transformed the forest ecosystem processes, and this could mainly be responsible for poor diversity in all terrestrial ecosystems other than the temperate forests. In the temperate region, the physiography is mostly undulating, population density is thin, and accessibility is somewhat poor, and thus, anthropogenic activities are minimum in the temperate forest. These might have favored almost similar species richness and the Shannon diversity index as tropical forests in the region (Table 1). Furthermore, most tropical forests lie in moist to deciduous forest zone, leading to more homogeneity in species composition.
Species richness and diversity are two essential attributes in an ecosystem that may affect the total biomass and carbon stock (Solomon et al., 2017; Zuo et al., 2017). Habitat variability and other prevailing local factors also influence these indices (Jansen and Oksanen, 2013; Fischer et al., 2014). Higher tree diversity observed in the forests is well within the range reported by Saikia et al. (2017). Higher values of dominance in different forest types and temperate plantations than other land uses revealed an inequitable distribution of trees in these habitats. As there was a weak relationship between tree density and carbon storage, particular tree species having high DBH or basal area in these habitats could have also influenced the carbon storage as argued by Kirby and Potvin (2007).
The aboveground biomass carbon storage in the present study was comparable with various studies reported by others in Northeast India, for example, 16.24–130.82 Mg C ha−1 in Assam (Borah et al., 2013), 60.09–121.43 Mg C ha−1 in forests of Manipur (Thokchom and Yadava, 2017), while being lower than the reported value of 460.5 Mg C ha−1 in an old-growth pine forest of Meghalaya (Baishya and Barik, 2011). The estimated total biomass and carbon pool of the Northeast India forest sites are within the range reported from other Indian forest systems (Ravindranath et al., 1997; Chhabra et al., 2002; Devi and Yadava, 2015; Wagner et al., 2015; Gandhi and Sundarpandian, 2017; Solomon et al., 2017; Gogoi et al., 2020; Tamang et al., 2021). Several factors such as the age of the forest stand (Kolh et al., 2017), tree density (Garcia-Vega et al., 2020), diversity, and basal area (Joshi and Dhyani, 2018) influence the biomass and total vegetation carbon. Among the land uses, forests store more biomass and biomass carbon, which implies that they must be prevented from deforestation and other anthropogenic activities to mitigate the elevated atmospheric CO2 concentration in the region.
SOC content is influenced by soil organic matter accumulation, which is governed by litter input and decomposition (Sahoo et al., 2019), quality of litter, rate of mineralization coupled with stand type, and age (Cao et al., 2018; Ahirwal et al., 2021b). A high lignin-containing litter with relatively lower soil moisture in plantation forests (rubber, areca nut, and oil palm) (Nath et al., 2018) might have been responsible for the reduced SOC stock in these systems. The average SOC stock for the different land-use sectors of the present study can be comparable with the findings reported in other regions of India. For example, Chhabra et al. (2002) reported the SOC stock of 37.5 Mg C ha−1 in dry tropical deciduous forests, while Ramachandran et al. (2007) found SOC stock of 76.85 Mg C ha−1 in thorn forests to 175–369 Mg C ha−1 in forests of Kolli hills of Tamil Nadu (Mohanraj et al., 2011) in the same region.
Basal area is a good predictor for biomass (Gebrewahid and Meressa, 2020) and is often used as a surrogate for biomass and carbon (Balderas Torres and Lovett, 2013). In the present study, basal area was strongly correlated with tree density and with vegetation (AGB + BGB) carbon in line with the findings of many others (Poorter et al., 2015; Salunkhe and Khare, 2016; Amara et al., 2019; Tamang et al., 2021). However, the tree basal area did not have any relationship with the SOC stock, except tropical forests. The variation in biomass and carbon pool in subtropical and temperate forest stands were due to the variation in vegetation composition, forest management practice, forest stand age, girth class, and altitude. The temperate forest has higher amount of biomass and carbon stock than tropical forest stands. It was also found that in the temperate forests, the five most dominant species viz. Quercus sp. (D-71.7, IVI-25), Alnus sp. (D-56.7,IVI-19), Illicium griffithi (D-47.8, IVI-18), Rhododendron sp. (D-44.4, IVI-15), and Castanopsis hystrix (D-38.3, IVI-14) together contributed more than half (154.2 Mg ha−1) to total aboveground stand biomass (Supplementary Table S1).
Carbon sequestration is affected by several site factors such as tree age, diameter, and height of the tree; temperature, water, and nutrient (particularly carbon and nitrogen) requirements for the soil; and organic matter decomposition by microbes (Poorter et al., 2016). The annual precipitation and soil-water holding capacity of the land use also regulate net primary productivity. In infertile soil, trees allocate more biomass to the roots in order to increase nutrient uptake (Grower, 2003). The confounding effects from other soil characteristics and management regimes may affect carbon stock too (Newaj et al., 2016). The rate of carbon sequestration in a habitat is influenced by several factors such as age of the stand/ maturity index, management, and woody species composition (Singh et al., 2018a). The elevation, slope, and aspect could also influence the carbon sequestration rate (Gogoi et al., 2020; Thong et al., 2020). Significantly higher vegetation carbon sequestration in temperate forests (5.51 Mg C ha−1 yr−1) and subtropical plantations (5.08 Mg C ha−1 yr−1) in the present study could be due to favorable growth of certain species over others, resulting in high productivity in the habitats when one species is dominant. In our earlier studies, we found that a 10-year-old oil palm plantation can sequester 3.70 Mg C ha−1 yr−1 vegetation carbon (Singh et al., 2018b) and that shifting cultivation fallows can enhance the total carbon stock to 137.86–140.08 Mg C ha−1 within a span of 15 years of succession (Thong et al., 2020). Similarly, an increase of 33.47 Mg C ha−1 SOC stock and 26.55 Mg C ha−1 of vegetation carbon was reported when the shifting cultivation fallows were left to restore within a span of 15–20 years (Gogoi et al., 2020). Secondary forests show promising CO2 uptake and their role in the recovery of vegetation carbon storage if kept undisturbed over time, though our results showed CO2 uptake of secondary forests is slightly lower than the reported 3.05 Mg C ha−1 yr−1 carbon sequestration of neo-tropical secondary forests (Poorter et al., 2016).
Land-use change is nevertheless the most important factor in the alternation of carbon balance in the Indian Himalayas (Ahirwal et al., 2021a). Conversion of forests to oil palm and other agricultural land use is on the rise in the region to feed the growing population (Singh et al., 2018b). Conversion of forest to other land uses enhances decomposition and removal of carbon through harvest. On the other hand, SOC pools that are the most sensitive to land-use change were found to substantially improve when the shifting cultivation was converted to plantation. In addition to forests that store high amount of AGBC, agroforestry and plantation also show much promise in the region as key component land uses contributing to stronger mitigation and future climate solutions. So eco-restoration through plantation forestry could be the most effective strategy in the region (Gogoi et al., 2021). Furthermore, agroforestry systems were very effective in restoring soil carbon, besides adding to VC through trees. Under the current climate change, this study advocates converting much of the prevailing degraded shifting cultivation to agroforestry and plantation in order to enhance the C stock and abate GHG emissions. Carbon management through enhancing carbon uptake and storage by forests is now globally recognized as a vital strategy to mitigate climate change. Assessing carbon stocks of forest stands will help in prioritizing tree species-specific land-use practices to ensure sustainability. A combined approach of field-based inventory with geospatial techniques is highly recommended for improved carbon estimation at the national level. Such a study would provide more insight into climate change response to minimize the impact at a regional scale for better ecosystem structure and function. Besides, this will help the policy-makers take an appropriate decision for land-use change, reduce deforestation and land degradation, and maintain carbon balance in the global climate scenario.
Quantification of carbon stock at the regional/landscape level of Northeast India is crucial for sustainable management of various land uses that are undergoing various anthropogenic changes. The carbon stock at various terrestrial pools is affected by tree species richness, tree density, and diversity. For the various land uses in Northeast India, the relationship of tree species diversity with aboveground biomass carbon appears to be highly variable, indicating that tree diversity conservation and management may not necessarily assure higher biomass carbon storage. The findings of this study suggest that the various land uses in Northeast India are important for storing carbon. However, the underlying mechanisms governing the complex relationship between tree species diversity and carbon stock are not elucidated yet and need further study. The total carbon stock showed positive gains following land-use conversion from agriculture to agroforestry and grassland to agroforestry, which suggests that the tree-based systems can enhance greater carbon storage and thus help in climate change mitigation and adaptation. This study provides baseline information to environmentalists and policy-makers, who are capable of devising strategies that can help in climate change mitigation and adaptation at the regional, national, and global scale.
The original contributions presented in the study are included in the article/Supplementary Material; further inquiries can be directed to the corresponding author.
US, OT, AN, SD, DD, AG, BD, and SC led the research in their respective states and conceived the outline of the paper; BT supervised the entire work; SS helped in data analysis; US was responsible for most of the text; AK revised the manuscript; OT developed the LULC map. All authors were involved in the final preparation of the draft and have read and approved the manuscript.
The project was an All Indian Coordinated Carbon Project where all authors (barring SS, AK, and BT) have received separate funding from the Department of Science & Technology, Government of India, New Delhi, to carry out research work in their respective states. This research was funded by the Ministry of Science and Technology, Government of India (Grant No. DST/IS-STAC/CO2-SR-225/14(G)-AICP-AFOLU(I-VIII)).
The authors declare that the research was conducted in the absence of any commercial or financial relationships that could be construed as a potential conflict of interest.
All claims expressed in this article are solely those of the authors and do not necessarily represent those of their affiliated organizations, or those of the publisher, the editors, and the reviewers. Any product that may be evaluated in this article, or claim that may be made by its manufacturer, is not guaranteed or endorsed by the publisher.
We thank the academic and administrative heads of various educational institutes/universities across Northeast India for providing all possible in-house laboratory facilities, and the Departments of Environment, Forests, and Climate Change, and Remote Sensing Application Centres of various states for help during field inventory and providing initial land-use and land-cover maps. We also profusely thank all the Jhum farmers and owners of other land uses for providing access to their land for the collection of need-based data and soil samples.
The Supplementary Material for this article can be found online at: https://www.frontiersin.org/articles/10.3389/fenvs.2021.724950/full#supplementary-material
Ahirwal, J., Nath, A., Brahma, B., Deb, S., Sahoo, U. K., and Nath, A. J. (2021a). Patterns and Driving Factors of Biomass Carbon and Soil Organic Carbon Stock in the Indian Himalayan Region. Sci. Total Environ. 770, 145292. doi:10.1016/j.scitotenv.2021.145292
Ahirwal, J., Saha, P., Nath, A., Nath, A. J., Deb, S., and Sahoo, U. K. (2021b). Forests Litter Dynamics and Environmental Patterns in the Indian Himalayan Region. For. Ecol. Manag. 499, 119612. doi:10.1016/j.foreco.2021.119612
Amara, E., Heiskanen, J., Aynekulu, E., and Pellikka, P. K. (2019). Relationship between Carbon Stocks and Tree Species Diversity in a Humid Guinean savanna Landscape in Northern Sierra Leone. South. Forests: a J. For. Sci. 81 (3), 235–245. doi:10.2989/20702620.2018.1555947
Baishya, R., and Barik, S. K. (2011). Estimation of Tree Biomass, Carbon Pool and Net Primary Production of an Old-Growth Pinus Kesiya Royle Ex. Gordon forest in north-eastern India. Ann. For. Sci. 68, 727–736. doi:10.1007/s13595-011-0089-8
Balderas Torres, A., and Lovett, J. C. (2013). Using Basal Area to Estimate Aboveground Carbon Stocks in Forests: La Primavera Biosphere's Reserve, Mexico. Forestry 86 (2), 267–281. doi:10.1093/forestry/cps084
Behera, M. D., Behera, S. K., and Sharma, S. (2019). Recent Advances in Biodiversity and Climate Change Studies in India. Biodivers Conserv 28, 1943–1951. doi:10.1007/s10531-019-01781-0
Betts, R. A., Jones, C. D., Knight, J. R., Keeling, R. F., and Kennedy, J. J. (2016). El Niño and a Record CO2 Rise. Nat. Clim Change 6, 806–810. doi:10.1038/nclimate3063
Bhat, J. A., Kumar, M., Negi, A. K., Todaria, N. P., Malik, Z. A., Pala, N. A., et al. (2020). Species Diversity of Woody Vegetation along Altitudinal Gradient of the Western Himalayas. Glob. Ecol. Conservation 24 (e01302). doi:10.1016/j.gecco.2020.e01302
Blanco-Canqui, H., and Lal, R. (2008). No-tillage and Soil-Profile Carbon Sequestration: An On-Farm Assessment. Soil Sci. Soc. Am. J. 72, 693–701. doi:10.2136/sssaj2007.0233
Borah, M., Das, D., Kalita, J., Deka Boruah, H. P., Phukan, B., and Neog, B. (2015). Tree Species Composition, Biomass and Carbon Stocks in Two Tropical forest of Assam. Biomass and Bioenergy 78, 25–35. doi:10.1016/j.biombioe.2015.04.007
Borah, N., Nath, A. J., and Das, A. K. (2013). Aboveground Biomass and Carbon Stocks of Tree Species in Tropical Forests of Cachar District of Assam, Northeast India. Int. J. Ecol. Environ. Sci. 39 (2), 97–106.
Brahma, B., Nath, A. J., Deb, C., Sileshi, G. W., Sahoo, U. K., and Kumar Das, A. (2021). A Critical Review of forest Biomass Estimation Equations in India. Trees, Forests and People 5, 100098. doi:10.1016/j.tfp.2021.100098
Brahma, B., Pathak, K., Lal, R., Kurmi, B., Das, M., Nath, P. C., et al. (2018). Ecosystem Carbon Sequestration through Restoration of Degraded Lands in Northeast India. Land Degrad. Dev. 29, 15–25. doi:10.1002/ldr.2816
Brahma, B., Sileshi, G. W., Nath, A. J., and Das, A. K. (2017). Development and Evaluation of Robust Tree Biomass Equations for Rubber Tree (Hevea Brasiliensis) Plantations in India. For. Ecosyst. 4, 14. doi:10.1186/s40663-017-0101-3
Brown, S., Gillespie, A. J. R., and Lugo, A. E. (1989). Biomass Estimation Methods for Tropical Forests with Application to Forestry Inventory Data. For. Sci. 35, 881–902.
Cai, W., Borlace, S., Lengaigne, M., van Rensch, P., Collins, M., Vecchi, G., et al. (2014). Increasing Frequency of Extreme El Niño Events Due to Greenhouse Warming. Nat. Clim Change 4 (2), 111–116. doi:10.1038/nclimate2100
Cao, J., Zhang, X., Deo, R., Gong, Y., and Feng, Q. (2018). Influence of Stand Type and Stand Age on Soil Carbon Storage in China's Arid and Semi-arid Regions. Land Use Policy 78, 258–265. doi:10.1016/j.landusepol.2018.07.002
Chambers, J. Q., Santos, J. d., Ribeiro, R. J., and Higuchi, N. (2001). Tree Damage, Allometric Relationships, and Above-Ground Net Primary Production in central Amazon forest. For. Ecol. Manag. 152, 73–84. doi:10.1016/s0378-1127(00)00591-0
Chave, J., Andalo, C., Brown, S., Cairns, M. A., Chambers, J. Q., Eamus, D., et al. (2005). Tree Allometry and Improved Estimation of Carbon Stocks and Balance in Tropical Forests. Oecologica 145, 87–99. doi:10.1007/s00442-005-0100-x
Chave, J., Réjou-Méchain, M., Búrquez, A., Chidumayo, E., Colgan, M. S., Delitti, W. B. C., et al. (2014). Improved Allometric Models to Estimate the Aboveground Biomass of Tropical Trees. Glob. Change Biol. 20, 3177–3190. doi:10.1111/gcb.12629
Chhabra, A., Parila, S., and Dadhwal, V. K. (2002). Growing Stock-Based forest Biomass Estimate for India. Biomass Bioenerg. 22, 187–194. doi:10.1016/s0961-9534(01)00068-x
Con, T. V., Thang, N. T., Ha, D. T. T., Khiem, C. C., Quy, T. H., Lam, V. T., et al. (2013). Relationship between Aboveground Biomass and Measures of Structure and Species Diversity in Tropical Forests of Vietnam. For. Ecol. Manag. 310, 213–218. doi:10.1016/j.foreco.2013.08.034
Dar, J. A., Subashree, K., Raha, D., Kumar, A., Khare, P. K., and Khan, M. L. (2019). Tree Diversity, Biomass and Carbon Storage in Sacred groves of Central India. Environ. Sci. Pollut. Res. 26, 37212–37227. doi:10.1007/s11356-019-06854-9
Deb, D., Jamatia, M., Debbarma, J., Ahirwal, J., Deb, S., and Sahoo, U. K. (2021). Evaluating the Role of Community-Managed forest in Carbon Sequestration and Climate Change Mitigation of Tripura, India. Water Air Soil Pollut. 232, 166. doi:10.1007/s11270-021-05133-z
Devi, L. S., and Yadava, P. S. (2015). Carbon Stock and Rate of Carbon Sequestration in Dipterocarpus Forests of Manipur, Northeast India. J. For. Res. 26, 315–322. doi:10.1007/s11676-015-0070-8
Dung, L. V., Tue, N. T., Nhuan, M. T., and Omori, K. (2016). Carbon Storage in a Restored Mangrove forest in Can Gio Mangrove forest Park, Mekong Delta, Vietnam. For. Ecol. Manag. 380, 31–40. doi:10.1016/j.foreco.2016.08.032
Fischer, H. S., Michler, B., and Ewald, J. (2014). Environmental, Spatial and Structural Components in the Composition of Mountain forest in the Bavarian Alps. Folia Geobot 49, 361–384. doi:10.1007/s12224-013-9185-x
Gandhi, D. S., and Sundarapandian, S. (2017). Large-scale Carbon Stock Assessment of Woody Vegetation in Tropical Dry Deciduous forest of Sathanur reserve forest, Eastern Ghats, India. Environ. Monit. Assess. 189, 187. doi:10.1007/s10661-017-5899-1
García-Vega, D., and Newbold, T. (2020). Assessing the Effects of Land Use on Biodiversity in the World's Drylands and Mediterranean Environments. Biodivers Conserv 29, 393–408. doi:10.1007/s10531-019-01888-4
Gebrewahid, Y., and Meressa, E. (2020). Tree Species Diversity and its Relationship with Carbon Stock in the Parkland Agroforestry of Northern Ethiopia. Cogent Biol. 6 (1), 1728945. doi:10.1080/23312025.2020.1728945
Gogoi, A., Ahirwal, J., and Sahoo, U. K. (2021). Plant Biodiversity and Carbon Sequestration Potential of the Planted forest in Brahmaputra Flood plains. J. Environ. Manage. 280, 111671. doi:10.1016/j.jenvman.2020.111671
Gogoi, A., and Sahoo, U. K. (2018). Impact of Anthropogenic Disturbance on Species Diversity and Vegetation Structure of a lowland Tropical Rainforest of Eastern Himalaya, India. J. Mt. Sci. 15 (11), 2453–2465. doi:10.1007/s11629-017-4713-4
Gogoi, A., Sahoo, U. K., and Saikia, H. (2020). Vegetation and Ecosystem Carbon Recovery Following Shifting Cultivation in Mizoram-Manipur-Kachin Rainforest Eco-Region, Southern Asia. Ecol. Process. 9, 21. doi:10.1186/s13717-020-00225-w
Gower, S. T. (2003). Patterns Andmechanisms of Theforestcarboncycle. Annu. Rev. Environ. Resour. 28, 169–204. doi:10.1146/annurev.energy.28.050302.105515
Gupta, H., and Kumar, R. (2020). Distribution of Selected Polycyclic Aromatic Hydrocarbons in Urban Soils of Delhi, India. Environ. Techn. Innovation 17, 100500. doi:10.1016/j.eti.2019.100500
Hussain, T., Devi, H. S., and Sarma, K. K. (2019). Aboveground Biomass and Carbon Stock Mapping Using NDVI and Ecological Studies of Woody Trees of Jeypore Reserve forest, Assam, India. Ind. For. 145 (7), 614–618.
IPCC (2003). Good Practices Guidelines for Land Use, Land-Use Change and Forestry. Kanagawa Prefecture, Japan: Institute for Global Environmental Strategies.
IPCC (2007). Good Practices Guidelines for Land Use, Land-Use Change and Forestry. Kanagawa Prefecture, Japan: Institute for Global Environmental Strategies.
IPCC (2014). Synthesis Report, Contributions of Working Groups I, II and III to the Fifth Assessment Report of the International Panel on Climate Change. Geneva, Switzerland: IPCC, 151.
Issa, S., Dahy, B., Ksiksi, T., and Saleous, N. (2020). A Review of Terrestrial Carbon Assessment Methods Using Geo-Spatial Technologies with Emphasis on Arid Lands. Remote Sens. 12, 2008. doi:10.3390/rs212200810.3390/rs12122008
Ives, A. R., Klug, J. L., and Gross, K. (2000). Stability and Species Richness in Complex Communities. Ecol. Lett. 3 (5), 399–411. doi:10.1046/j.1461-0248.2000.00144.x
Jansen, F., and Oksanen, J. (2013). How to Model Species Responses along Ecological Gradients - Huisman-Olff-Fresco Models Revisited. J. Veg. Sci. 24, 1108–1117. doi:10.1111/jvs.12050
Joshi, R. K., and Dhyani, S. (2019). Biomass, Carbon Density and Diversity of Tree Species in Tropical Dry Deciduous Forests in Central India. Acta Ecologica Sinica 39, 289–299. doi:10.1016/j.chnaes.2018.09.009
Kirby, K. R., and Potvin, C. (2007). Variation in Carbon Storage Among Tree Species: Implications for the Management of a Small-Scale Carbon Sink Project. For. Ecol. Manag. 246 (2-3), 208–221. doi:10.1016/j.foreco.2007.03.072
Köhl, M., Neupane, P. R., and Lotfiomran, N. (2017). The Impact of Tree Age on Biomass Growth and Carbon Accumulation Capacity: a Retrospective Analysis Using Tree Ring Data of Three Tropical Tree Species Grown in Natural Forests of Suriname. PLoS One 12 (8), e0181187. doi:10.1371/journal.pone.0181187
Kumar, A., and Gupta, H. (2020). Activated Carbon from Sawdust for Naphthalene Removal from Contaminated Water. Environ. Techn. Innovation 20, 101080. doi:10.1016/j.eti.2020.101080
Kumar, A., Kishore, B. S. P. C., Saikia, P., Deka, J., Bharali, S., Singha, L. B., et al. (2019). Tree Diversity Assessment and above Ground Forests Biomass Estimation Using SAR Remote Sensing: A Case Study of Higher Altitude Vegetation of Northeast Himalayas, India. Phys. Chem. Earth, Parts A/B/C 111, 53–64. doi:10.1016/j.pce.2019.03.007
Kumar, A., Pinto, M. C., Candeias, C., and Dinis, P. A. (2021). Baseline Maps of Potentially Toxic Elements in the Soils of Garhwal Himalayas, India: Assessment of Their Eco‐environmental and Human Health Risks. Land Degrad. Dev. 32 (8), 3856–3869. doi:10.1002/ldr.3984
Kumar, A., Sharma, M. P., and Taxak, A. K. (2017). Effect of Vegetation Communities and Altitudes on the Soil Organic Carbon Stock in Kotli Bhel-1A Catchment, India. Clean. - Soil Air Water 45 (8), 1600650. doi:10.1002/clen.201600650
Kumar, L., Sinha, P., Taylor, S., and Alqurashi, A. F. (2015). Review of the Use of Remote Sensing for Biomass Estimation to Support Renewable Energy Generation. J. Appl. Remote Sens 9 (1), 097696. doi:10.1117/1.JRS.9.097696
Kurmi, B., Nath, A. J., Lal, R., and Das, A. K. (2020). Water Stable Aggregates and the Associated Active and Recalcitrant Carbon in Soil under Rubber Plantation. Sci. Total Environ. 703, 135498. doi:10.1016/j.scitotenv.2019.135498
Le Quéré, C., Andrew, R. M., Canadell, J. G., Sitch, S., Korsbakken, J. I., Peters, G. P., et al. (2016). Global Carbon Budget 2016. Earth Syst. Sci. Data 8, 605–649. doi:10.5194/essd-8-605-2016
Margalef, R. (1958). Information Theory in Ecology. Int. J. Gen. Syst. 3, 36–71. doi:10.12691/ajss-2-5-1
Mohanraj, R., Saravanan, J., and Dhanakumar, S. (2011). Carbon Stock in Kolli Forests, Eastern Ghats (India) with Emphasis on Aboveground Biomass, Litter, Woody Debris and Soils. IForest 4, 61–65. doi:10.3832/ifor0568-004
Mokany, K., Raison, R. J., and Prokushkin, A. S. (2006). Critical Analysis of Root : Shoot Ratios in Terrestrial Biomes. Glob. Chang. Biol. 12, 84–96. doi:10.1111/j.1365-2486.2005.001043.x
Nath, A. J., Brahma, B., Sileshi, G. W., and Das, A. K. (2018). Impact of Land Use Changes on the Storage of Soil Organic Carbon in Active and Recalcitrant Pools in a Humid Tropical Region of India. Sci. Total Environ. 624, 908–917. doi:10.1016/j.scitotenv.2017.12.199
Nath, A. J., Tiwari, B. K., Sileshi, G. W., Sahoo, U. K., Brahma, B., Deb, S., et al. (2019). Allometric Models for Estimation of forest Biomass in Northeast India. Forests 10, 1–16. doi:10.3390/f10020103
Nayak, S., and Sahoo, U. K. (2020). Tree Diversity and Ecological Status of Madhuca Latifolia (Roxb.) J.F. Macbr in Forests of Odisha. Ind. J. Ecol. 47 (1), 138–149.
Newaj, R., Chaturvedi, O., and Handa, A. (2016). Recent Development in Agroforestry Research and its Role in Climate Change Adaptation and Mitigation. Ind. J. Agrofor. 18, 1–9.
Pandey, P. C., Srivastava, P. K., Chetri, T., Choudhary, B. K., and Kumar, P. (2019). Forest Biomass Estimation Using Remote Sensing and Field Inventory: a Case Study of Tripura, India. Environ. Monit. Assess. 191 (9), 593. doi:10.1007/s10661-019-7730-7
Pellikka, P. K. E., Heikinheimo, V., Hietanen, J., Schäfer, E., Siljander, M., and Heiskanen, J. (2018). Impact of Land Cover Change on Aboveground Carbon Stocks in Afromontane Landscape in Kenya. Appl. Geogr. 94, 178–189. doi:10.1016/j.apgeog.2018.03.017
Pielou, E. C. (1966). The Measurement of Diversity in Different Types of Biological Collections. J. Theor. Biol. 13, 131–144. doi:10.1016/0022-5193(66)90013-0
Poorter, L., Bongers, F., Aide, T. M., Almeyda Zambrano, A. M., Balvanera, P., Becknell, J. M., et al. (2016). Biomass Resilience of Neotropical Secondary Forests. Nature 530, 211–214. doi:10.1038/nature16512.Epub2016feb3
Poorter, L., vander Sande, M. J., Thompson, J., Aretes, E. J. M. M., Alarcon, A., Alvarez, Sanchez, J., et al. (2015). Diversity Enhances Carbon Storage in Tropical Forests. Glob. Ecol. Biogeogr. 24, 1314–1328. doi:10.1111/geb.12364
Qiu, L., Zhu, J., Wang, K., and Hu, W. (2015). Land Use Changes Induced County-Scale Carbon Consequences in Southeast China 1979-2020, Evidence from Fuyang, Zhejiang Province. Sustainability 8 (1), 38. doi:10.3390/su8010038
Ramachandran, A., Jayakumar, S., Haroon, R. M., Bhaskaran, A., and Arockiasamy, D. I. (2007). Carbon Sequestration: Estimation of Carbon Stock in Natural Forests Using Geospatial Technology in the Eastern Ghats of Tamil Nadu, India. Curr. Sci. 92 (3), 323–331.
Ravindranath, N. H., Somashekhar, B. S., and Gadgil, M. (1997). Carbon Flows in Indian Forests. Clim. Chang. 35, 297–320. doi:10.1023/a:1005303405404
Robertson, W. K., Pope, P. E., and Tomlinson, R. T. (1974). Sampling Tool for Taking Undisturbed Soil Cores. Soil Sci. Soc. America J. 38, 855–857. doi:10.2136/sssaj1974.03615995003800050045x
Sahoo, U. K., Singh, S. L., Gogoi, A., Kenye, A., and Sahoo, S. S. (2019). Active and Passive Soil Organic Carbon Pools as Affected by Different Land Use Types in Mizoram, Northeast India. PLoS One 14 (7), e0219969. doi:10.1371/journal.pone.0219969
Saikia, P., Deka, J., Bharali, S., Kumar, A., Tripathi, O. P., Singha, L. B., et al. (2017). Plant Diversity Patterns and Conservation Status of Eastern Himalayan Forests in Arunachal Pradesh, Northeast India. For. Ecosyst. 4, 28. doi:10.1186/s40663-017-0117-8
Salunkhe, O., and Khare, P. K. (2016). Aboveground Biomass and Carbon Stock of Tropical Deciduous forest Ecosystems of Madhya Pradesh, India. Int. J. Ecol. Environ. Sci. 42 (S), 75–81.
Shannon, C. E., and Wiener, W. (1963). The Mathematical Theory of Communication. Urbana: University of Illinois Press. Available at: https://pure.mpg.de/rest/items/item_2383164/component/file2383163/content.
Sharma, K., Saikia, A., Goswami, S., and Borthakur, M. (2020). Aboveground Biomass Estimation and Carbon Stock Assessment along a Topographical Gradient in the Forests of Manipur, Northeast India. Arab. J. Geosci. 13, 443. doi:10.1007/s12517-020-05398-4
Sheikh, M. A., Kumar, M., Todaria, N. P., Bhat, J. A., Kumar, A., and Pandey, R. (2021). Contribution of Cedrus Deodara Forests for Climate Mitigation along Altitudinal Gradient in Garhwal Himalaya, India. Mitig. Adapt. Strateg. Glob. Change 26, 5. doi:10.1007/s11027-021-09941-w
Sileshi, G. W. (2014). A Critical Review of forest Biomass Estimation Models, Common Mistakes and Corrective Measures. For. Ecol. Manag. 329, 237–254. doi:10.1016/j.foreco.2014.06.026
Singh, S., and Dadhwal, V. K. (2009). Manual on Spatial Assessment of Vegetation Carbon Pool of India. Dehradun: Indian Institute of Remote Sensing (National Remote Sensing Centre), ISRO, Government of India, 32.
Singh, S. L., Sahoo, U. K., Gogoi, A., and Kenye, A. (2018a). Effect of Land Use Changes on Carbon Stock Dynamics in Major Land Use Sectors of Mizoram, Northeast India. J. Environ.l Prot. 9, 1962–1285. doi:10.4236/jep.2018.912079
Singh, S. L., Sahoo, U. K., Kenye, A., and Gogoi, A. (2018b). Assessment of Growth, Carbon Stock and Sequestration Potential of Oil palm Plantations in Mizoram, Northeast India. Jep 09, 912–931. doi:10.4236/jep.2018.99057
Singh, S. L., and Sahoo, U. K. (2015). Soil Carbon Sequestration in Homegardens of Different Age and Size in Aizawl District of Mizoram, Northeast India. Nebios 6, 12–17.
Singh, S. L., and Sahoo, U. K. (2021). Tree Species Composition, Diversity and Soil Organic Carbon Stock in Homegardens and Shifting Cultivation Fallows of Mizoram, Northeast India. Vegetos 34, 220–228. doi:10.1007/s42535-021-00194-1
Solomon, N., Birhane, E., Tadesse, T., Treydte, A. C., and Meles, K. (2017). Carbon Stocks and Sequestration Potential of Dry Forests under Community Management in Tigray, Ethiopia. Ecol. Process. 6, 20. doi:10.1186/s13717-017-0088-2
Tamang, M., Chettri, R., Vineeta, Shukla, G., Shukla, J. A., Kumar, A., Kumar, M., et al. (2021). Stand Structure, Biomass and Carbon Storage in Gmelina Arborea Plantation at Agricultural Landscape in Foothills of Eastern Himalayas. Land 10, 387. doi:10.3390/land10040387
Thangjam, U., Sahoo, U. K., Thong, P., and Sileshi, G. W. (2019). Developing Tree Volume Equation for Parkia Timoriana Grown in home Gardens and Shifting Cultivation Areas of Northeast India. Forests, Trees and Livelihoods 28, 227–239. doi:10.1080/14728028.2019.1624200
Thokchom, A., and Yadava, P. S. (2017). Biomass and Carbon Stock along an Altitudinal Gradient in forest of Manipur, Northeast India. Trop. Ecol. 58 (2), 389–396.
Thong, P., Sahoo, U. K., Thangjam, U., and Pebam, R. (2020). Pattern of forest Recovery and Carbon Stock Following Shifting Cultivation in Manipur, Northeast India. PLoS One 15 (10), e0239906. doi:10.1371/journal.pone.0239906
UNFCCC (2006). Background Paper for the Workshop on Reducing Emissions from Deforestation in Developing Countries. Rome, Italy: United Nations Framework Convention on Climate Change.
UNFCCC (2008). United Nations Framework Convention on Climate Change Handbook. Halesworth, United Kingdom: Technographic Design and Printers Ltd, 210.
WagnerLiang, B. E., Liang, E., Li, X., Dulamsuren, C., Leuschner, C., and Hauck, M. (2015). Carbon Pools of Semi-arid Picea Crassifolia Forests in the Qilian Mountains (north-eastern Tibetan Plateau). For. Ecol. Manag. 343, 136–143. doi:10.1016/j.foreco.2015.02.001
Walkley, A., and Black, I. A. (1934). An Examination of the Degtjareff Method for Determining Soil Organic Matter, and a Proposed Modification of the Chromic Acid Titration Method. Soil Sci. 37, 29–38. doi:10.1097/00010694-193401000-00003
Weiskittel, A. R., MacFarlane, D. W., Radtke, P. J., Affleck, D. L. R., Temesgen, H., Woodall, C. W., et al. (2015). A Call to Improve Methods for Estimating Tree Biomass for Regional and National Assessments. J. For. 113(4), 414–424. doi:10.5849/jof.14-091
Zhang, M., Huang, X., Chuai, X., Yang, H., Lai, L., and Tan, J. (2015). Impact of Land Use Type Conversion on Carbon Storage in Terrestrial Ecosystems of China: A Spatial-Temporal Perspective. Sci. Rep. 5, 10233. doi:10.1038/srep10233
Keywords: biodiversity hotspots, carbon storage, forest types, land use, species richness
Citation: Sahoo UK, Tripathi OP, Nath AJ, Deb S, Das DJ, Gupta A, Devi NB, Charturvedi SS, Singh SL, Kumar A and Tiwari BK (2021) Quantifying Tree Diversity, Carbon Stocks, and Sequestration Potential for Diverse Land Uses in Northeast India. Front. Environ. Sci. 9:724950. doi: 10.3389/fenvs.2021.724950
Received: 14 June 2021; Accepted: 15 September 2021;
Published: 28 October 2021.
Edited by:
Moritz Bigalke, University of Bern, SwitzerlandReviewed by:
Sileshi Gudeta Weldesemayat, University of KwaZulu-Natal, South AfricaCopyright © 2021 Sahoo, Tripathi, Nath, Deb, Das, Gupta, Devi, Charturvedi, Singh, Kumar and Tiwari. This is an open-access article distributed under the terms of the Creative Commons Attribution License (CC BY). The use, distribution or reproduction in other forums is permitted, provided the original author(s) and the copyright owner(s) are credited and that the original publication in this journal is cited, in accordance with accepted academic practice. No use, distribution or reproduction is permitted which does not comply with these terms.
*Correspondence: Uttam Kumar Sahoo, dXR0YW1zNjRAZ21haWwuY29t; Amit Kumar, YW1pdGtkYWhAbnVpc3QuZWR1LmNu
Disclaimer: All claims expressed in this article are solely those of the authors and do not necessarily represent those of their affiliated organizations, or those of the publisher, the editors and the reviewers. Any product that may be evaluated in this article or claim that may be made by its manufacturer is not guaranteed or endorsed by the publisher.
Research integrity at Frontiers
Learn more about the work of our research integrity team to safeguard the quality of each article we publish.