 Ren Wang
 Jiaqi Huang
 Lizhi Zhang
 Yu Xia1
 Xu Xu
Xu Xu- 1School of Finance, Hunan University of Technology and Business, Changsha, China
- 2School of Mathematics and Statistics, Hunan University of Technology and Business, Changsha, China
- 3School of Economics, Beijing Technology and Business University, Beijing, China
The Assessment andAppraisal Method for Ecological Construction Targets (the Method) was promulgated in 2016, which provided a concrete instruction for China’s air pollution control and established an explicit standard for reducing air pollutant concentration. This study implements a sharp regression discontinuity (RD) design and makes an assessment on air quality control effectiveness of the Method based on the high-volume big data acquired from 173 cities in China. The results show that the Method has significantly improved air pollution control on the overall air quality index (AQI) and reducing concentrations of PM2.5, PM10, SO2, NO2, and CO across the country in the observation periods. However, no reduction effect was observed for O3. The robustness tests support the conclusion as well. Besides, the heterogeneity analysis illustrates that the policy had a significant short-term treatment effect in East, South, Central, North, Northwest, Southwest, and Northeast China. However, the Method’s effect is found to decline over time either nationwide or regionally according to the persistence analysis. Therefore, this article puts forward several suggestions regarding the formulation of long-term regulations for air pollution control, the transformation of the growth model for sustainable development, and optimization of the incentive system for improved pollution control and prevention.
Introduction
With China’s rapid economic growth and ever-accelerating increase in resource consumption, air pollution has become the primary problem threatening the country’s sustainable development. Data showed that in 2016, 81% of the Chinese population were exposed to ambient fine particulate matter (PM2.5) higher than the WHO IT1 (or CAAQS) standard (35 μg/m3), and 50% of the population were exposed to an annual average PM2.5 mass concentration of 48.2 μg/m3 or above (Song et al., 2017). In China, air pollution is estimated to cause 1.6 million deaths per year, accounting for roughly 17% of all deaths nationwide (Rohde and Muller, 2015). Air pollution is also identified as a cause of mental illnesses for which the associated health expenditures are USD 22.9 billion annually in total (Chen S. et al., 2018). The disease burden and health economic loss which resulted from ambient air pollution in China are greater than those in the remaining parts of the world as the country with one of the highest levels of air pollution and the largest size of the affected population (Niu et al., 2017). With increasing severity requiring government response, China has implemented a series of environmental protection policies and regulations to tackle air pollution.
In December 2016, the State Council of the People’s Republic of China launched the Assessment and Appraisal Method for Ecological Construction Targets (the Method). The Method, which specified higher requirements on air pollution control in its special assessment of eco-environmental protection, was proposed to center on the completion of critical targets of ecological civilization construction in each region, strengthen the awareness of responsibility in ecological civilization construction of provincial Communist Party of China (CPC) committees and governments, and supervise and urge regions to promote ecological civilization construction on their own initiatives.
Specifically, the Method, combined with the Green Development Index as a quantitative basis, stipulated a comprehensive assessment from many aspects, including regional resource utilization, environmental improvement, ecological conservation, the level of high-quality development, green life, public satisfaction, etc. The goal of the Method is to ensure that all provinces and cities strictly follow the guidelines of the central government when implementing these pollution control measures. Especially, the assessment and appraisal results of the Method would be an important index of general assessment, appraisal, awarding, promotion, and dismissal of leading carders and other local officials. The region with good performance of the appraisal would be commended, while the region with poor performance would be named and shamed, and its officials would be accountable.
In general, the Method impacts environment protection through the below mechanism. It sets ecological civilization construction targets as appraisal indexes for the environmental supervision system. Hence, the leaders of the Party who rule the local bureaucracy and the local government are stimulated to make cooperated efforts and take measures to address the pollution threat.
Although the Method targeted many aspects of the ecological civilization, this study will try to concentrate on air quality. We would like to verify whether the Method has provided the necessary incentives for the local governments to achieve the appraisal goal. Especially, to what degree has the mechanism worked to improve the air quality? Are the improvements made temporary or sustainable? An assessment of the Method and an exploration of its effect will provide necessary suggestions for policymakers on how to improve and optimize the air pollution control and regulations in the next period. From this perspective, this article attempts to use a sharp regression discontinuity (RD) design to accurately evaluate the effectiveness of the Method’s implementation based on the environmental big data collected among 173 cities in China.
Existing research studies evaluating the effect of air pollution regulation policies tend to focus on the following areas: first, research studies have been carried out to explain the reasons to implement air pollution regulations and illustrate their models. The market mechanisms cannot solely solve the environmental pollution problems because of the externalities of environmental pollution and the characteristics of the environment as a public good. Environmental regulations have therefore been crucial for remedying market failures and solving environmental problems (Fan and Sun, 2020). Environmental regulations on market entities’ pollutant discharge behavior can be roughly classified into three subtypes: government-oriented environmental regulations, market-oriented environmental regulations, and voluntary environmental regulations. To cope with growing resource and environmental pressures, the current environmental regulation approach in China is developing from the government-oriented only to the coordination of the government-oriented and the market-oriented (Zhao et al., 2009). Other environmental regulations may indirectly affect air pollution through three possible paths: adjusting the industrial structure (Chen S. et al., 2019; Yu and Wang, 2021), enhancing technological innovation (Jebaraj and Iniyan, 2006; Li et al., 2017; Chen X. et al., 2018), or attracting foreign direct investment (Wu and He, 2017). A second research focus is to evaluate the effect of environmental protection policies and regulations. It is confirmed that environmental regulations are effective in reducing harmful gas emissions and alleviating air pollution according to the studies of environmental regulations’ effect on the ecological environment and on the energy resource protection including the effect of implementing renewable energy policies, coal substitution policies, and other environmental policies (Neves et al., 2020; Ouyang et al., 2019; Shou et al., 2020; Wang et al., 2019). Some scholars argue that environmental inspection at the behest of central authorities has a significant effect, but the effect lasts for a short time (Tan and Mao, 2021). A third research focus is on the effects of regional environmental protection policies. For example, Yang et al. (2019) found that a unified air control policy was more effective in Shanghai, Jiangsu, and Zhejiang, while one with various types of emission control was more effective in the Pearl River Delta region (Hou et al., 2019). As for the Beijing–Tianjin–Hebei region, research has found that air control policies can reduce the region’s annual gross domestic product (GDP) growth rate by 1.4% and that the annual GDP growth rate will drop by 2.3% when the policies are rigidly enforced (Li et al., 2019). In addition, many scholars have started to use big data for environmental assessment research. Zhang et al. (2019), for example, assume that big data analysis (BDA) is helpful to provide decision makers with a sound scientific advice on solving global sustainable development problems. Therefore, BDA is gradually used in forecasting air pollutant concentrations (Alaoui et al., 2019; Al_Janabi et al., 2019; Xu et al., 2020) and other research fields.
Policy evaluation uses a range of research methods to systematically investigate the effectiveness of policy interventions, implementation, and processes and to determine their merit, worth, or value. There are four major methods to evaluate the public policies, including instrumental variable (IV), difference in difference (DID), propensity score matching (PSM), and regression discontinuity design (RDD) (Chang et al., 2018; Jia and Chen, 2019; List et al., 2003; Tu et al., 2020). The IV method could easily generate estimate results, but a suitable instrumental variable is difficult to define. Moreover, the method has a precondition that the heterogeneity of a chosen policy’s effect should be independent of the policy’s overall effect, which is a rigorous hypothesis. Therefore, Heckman, 1997 argues that a heterogeneity result would be invalid when the IV method is adopted. DID has many strengths such as focusing on changes of factors instead of noises, but it is based on strong assumptions. In particular, the conventional DID estimator requires that there should be no time-varying distinction between the treated group and the control group. Besides, the Method is a nationwide policy, and it is impossible to set the control group under such a situation; thus, a DID method cannot be applied to the estimate based on nationwide city-level data.
The RD design possesses several strengths compared with DID and propensity score matching (PSM). The RD design requires relatively less strict assumptions which permit a nonlinear time trend. It yields an unbiased estimate of the local treatment effect. As a quasi-experiment, RD does not require ex-ante randomization and circumvents theoretical issues of random assignment. It can be seen as a randomized experiment in measuring a treatment effect for the purpose of a policy evaluation methodology.
Different from most previous studies, there are three main contributions of this article. First, the evaluation of the air pollution policy is improved. The environmental big data across the country are used and the national factors are considered, which enhance the applicability and credibility of the assessment. Second, the introduced model based on the sharp RD design is capable of reducing the endogeneity problems, which makes the conclusion more robust. Finally, this study is of great practical importance. The heterogeneity analysis is conducted to evaluate the regional effect of the Method’s release on air pollution control nationwide.
The structure of this article is presented as follows: after the Introduction, the second section discusses the research materials and methods, including the big data acquisition and processing, the description analysis, and model setting. The third section presents the results, including an analysis of baseline regression results, the robustness test, persistence analysis, and heterogeneity analysis. The final section consists of the article’s conclusion and suggestions.
Materials and Methods
Big Data Acquisition and Processing
The composite air quality index (AQI) is a rating indicator for reporting the ambient air pollution recorded at monitoring sites on a particular time scale like daily (Kai-guang et al., 2019). The statistic shows that the air pollutants in Chinese cities mainly include six pollutant items such as fine particulate matter (PM2.5), inhalable particles (PM10), sulfur dioxide (SO2), nitrogen dioxide (NO2), carbon monoxide (CO), and ozone (O3) (Liu et al., 2013). Although it is observed by satellite monitoring that the concentration of SO2 showed a decreasing trend (Calkins et al., 2016; Wang and Wang 2020), satellite observations are not seeing ground-based levels of air pollution. The AQI is defined according to the six pollutants and simplifies separately their concentration values into a conceptual index value (Individual Air Quality Index, IAQI), which is the maximum value of the conceptual index values (Zhang et al., 2019). The main objectives of AQI are to inform and caution the public about the risks of exposure to pollution levels and to enforce required regulatory measures. The overall ambient air quality of a specified area can be assessed in a better way and quantified in terms of AQI since it represents the collective effect of all the pollutants. The Chinese Government has collected mass air pollutant data across the country to monitor real-time air quality since 2013.
As mentioned, the Method was launched in 2016 and the first round of annual assessment on ecological environment protection was completed by August, 2017. In order to provide an up-to-date policy effectiveness evaluation research, the high-volume data collected for the period ranging from November 2015 to February 2018 have been processed to explain the change of air quality based on the daily measured indicators including AQIind, hPM2.5avg, hPM10avg, hSO2avg, hNO2avg, hCOavg, and hO3avg, each of which represents its daily average concentration. A total of 1,066,898 observations are collected from selected locations of residential areas. Among the indicators, AQIind is denoted as a description of the overall air quality, and the other indicators of the six pollutants are used to analyze how air quality changes specifically and respectively.
To focus on the impact of the policy on air quality, weather conditions must be controlled in the analysis (Wu et al., 2020). We take the highest temperature (Htmpt), the lowest temperature (Ltmpt), weather conditions (Wthcdt), and wind force (Wndfrc) as the control variables, amounting to 609,656 observations. For weather conditions, we construct a dummy variable: rainy and snowy weathers are counted as “1”, while other conditions are “0”. Wind forces are recorded as “1.5” when lower than 3, “3.5” for the range of 3–4, and “4” for changing from 3–4 to 4–5, and so on. Besides, rapid industrial development and the dominance of economic growth in political decision-making have threatened the environment and air quality in China. Apparently, the economic indicators including the gross regional product (Grorgpdut), per capita gross regional product (PcptlGRP), and gross regional product growth rate (GRPgwrate), amounting to 457,242 observations, should also be controlled for their potential influences on air pollution (Wu et al., 2021). The annual economic indicators are transformed into daily data, and all the variables except dummy ones are standardized.
In summary, in this study, 173 cities at or above the prefecture level are eventually covered because the data of the other cities are excluded from the sample for their data being unavailable or unable to match. Some missing values are filled by the linear interpolation method, and 3,647,669 valid observations in total are acquired as the big data sample. All the data are collected from Chinese Research Data Services (CNRDS), and the analysis is conducted through Stata.
Data Description and Analysis
This article focuses on the impact of the Method on improving air quality based on air quality data from 173 cities at or above the prefecture level across China during 1 year before and after the Method’s implementation (2015–2017). First, by comparing the mean of each air quality indicator data in the different sample time periods, the result is that the value of AQI decreased by 1.343 units 1 year after the Method’s implementation, which reached the expectation. Table 1 summarizes the mean of the sample cities’ AQI and air pollutant indicator data. The results of 1 year before and after the Method’s release periods are presented, respectively, in columns 1 and 2. The mean difference of the comparison between columns 1 and 2 is presented in column 3.

TABLE 1. Comparison of air quality indexes before and after (mean).
In the light of the policy’s effects of continuity and hysteresis, this article extends the sample time span. A line chart (Figure 1) plots the changes of AQI for 3 years before and after the Method implementation. It can be seen in Figure 1 that in the next 2 months after the Method, the value of AQI decreased significantly and kept at a low level. Also, its value in the year after the release was significantly lower than that in the year before the release from the overall trend of the year. Therefore, it can be preliminarily concluded that the AQI declined because of the implementation of the Method. However, it should be noted that national AQI dropped sharply on December 22, 2016, and then rebounded immediately. This is likely because it was the time for the public heating system in China to operate, which twisted the effects of the Method’s implementation temporarily.
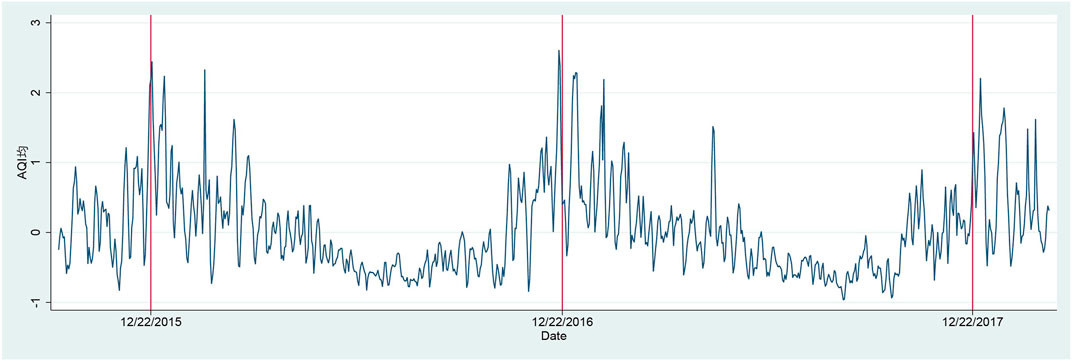
FIGURE 1. Changes in national AQI (mean).
To further find out the effectiveness of the Method on air quality improvement, the mean values of AQI of November, December, and January were compared for the same period among the year before the release (2015), the year of release (2016), and the year after the release (2017). The results are presented in Table 2. The data show that the AQI declined immediately in the next month after the Method’s release. However, the year-on-year growth rates of AQI were all positive in December and January in the pre-Method period and the year of release. It can be inferred that the Method is effective in improving air quality in a short time, but its continuous effect is relatively nominal. However, the effectiveness of the Method cannot be clearly estimated from the raw descriptive statistics, and a more comprehensive analysis needs to be done.
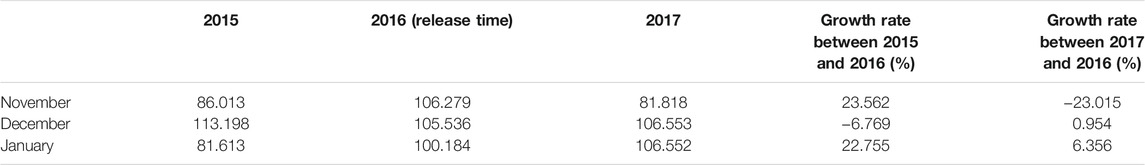
TABLE 2. AQI comparison for the same period of the month (2015–2017).
Model Specification
Studies designed as a quasi-experiment to assess the public policy always encounter the problem of endogeneity. In other words, individual behavior is usually affected by other factors before and after the introduction of the policy, which does not meet the exogenous conditions of a natural experiment. The resulting problem of endogeneity is difficult to completely overcome in public policy evaluation. The so-called policy endogeneity problem is usually a case of “manipulation” and “heap” of data (Chen L. et al., 2019). The biggest difficulty in evaluating the effect of the Method’s implementation lies in evaluating its own effect excluding the impact of other policies, especially due to the Method requiring ecological progress evaluated annually and assessed every 5 years. Big data’s role in the policy evaluation process is essentially the same as that of the corresponding traditional sample data. Thus, common policy evaluation methods can be adopted when big data are used to evaluate public policy evaluation. Lee (2008) believes that the method of RD design can effectively avoid the endogeneity problem in a parameter estimation to truly reflect the causal link between two variables when a randomized experiment cannot be carried out. Since the Method start date can be regarded as a mutation variable of influence, the method of RD design can distinguish the interaction and effect of the Method from other continuous variables. In this way, we can analyze the causal impact of the Method implementation on the jump cut point of outcome variables. In this article, if we can accurately identify whether there are abrupt changes in various pollutant concentration indicators before and after the Method start date while the control variables are continuously changing by using RD, it can be concluded that the Method’s implementation led to the changes in air quality, thereby proving the Method’s effectiveness. Otherwise, the Method is inefficient.
To analyze the influence of the air pollution control policy on the air quality, it is assumed that the improvement of air quality relies solely on the implementation of the relevant policy that could be set as a binary treatment variable, for which treatment is assigned to units with the consistent variable exceeding the cut point c. Let the receipt of treatment be denoted by the binary variable D, and let D = 1 if treatment is received and D = 0 otherwise. When c = 0,
The cities affected by the policies or not are denoted, respectively, by (y0i,y0i). Then, we need to compare whether average outcome gains resulting from treatment differ from both groups. Considering the time period (c−ε, c+ε), it could be assumed that all other factors determining Y of observations are evolving smoothly with respect to x close to the cutoff. The observations after the cut point can be divided into the treatment group, while those before the cut point can be divided into the control group.
Since the Method was released on a specific date, we use sharp RD design to study the impact of the Method’s implementation on air quality referring to RD design. The regression estimation equation is given below:
where AIRit is the outcome variable representing the air quality index (AQI) and the daily average concentrations of six pollutants (including PM2.5, PM10, SO2, NO2, CO, and O3) at city i on date t; Policy represents a dummy variable for the Method, whose value is 0 before the start date; otherwise, it is 1; D (t)τ is a time trend variable, which is used to fit the trend in air quality changes in sample cities before and after the Method start date. We multiply the dummy variable Policy and the time trend variable D (t)τ to ensure the differentiation trend of air quality before and after the Method start date. τ is the time indicator variable. Limited to the range of the bandwidth, the value of τ of 0 represents the Method’s start date, 1 represents the following day, −1 represents the previous day, −2 represents the date 2 days before the release, and the like. Xit is denoted as the control variable, meteorological and economic factors influencing air quality, including the highest temperature (Htmpt), the lowest temperature (Ltmpt), weather conditions (Wthcdt), wind force (Wndfrc), gross regional products (Grorgpdut), per capita gross regional products (PcptlGRP), and GRP growth rate (GRPgwrate). μi represents the regional fixed effect, including public transportation systems, green areas, and populations. δt represents the time fixed effect, and εit represents the random disturbances.
Results
Discussion on the Validity of the Cut Point
Normally, after selecting a certain bandwidth, if the outcome variable presents a sudden change at the cut point, the effectiveness of adopting RD design is considered to be verified and vice versa. As for determining the bandwidth, considering the fact that local officials might pursue the short-term performance and referring to the existing literature (Tu et al., 2020), this study picks the bandwidth of 30 days. After controlling for the effects of meteorological and economic variables on the national air quality, air pollutant concentration trends were fitted for the 30 days before and after the Method’s release. To estimate the model’s effectiveness, whether the Method’s start date (the treatment date) can be seen as a cut point should be examined. All the results are shown in Figure 2. It is illustrated that except O3, the concentrations of PM2.5, PM10, SO2, NO2, and CO demonstrate obvious sudden changes at the start date, which suggests that the decrease in AQI might be owing to the sharp decrease in the five pollutants. On the other hand, O3 is an indirect emission that is not directly emitted by the residents or factories. Its generation process is sophisticated, and no sudden change was observed. Therefore, it is reasonable to conduct the empirical analysis based on a sharp RD design.
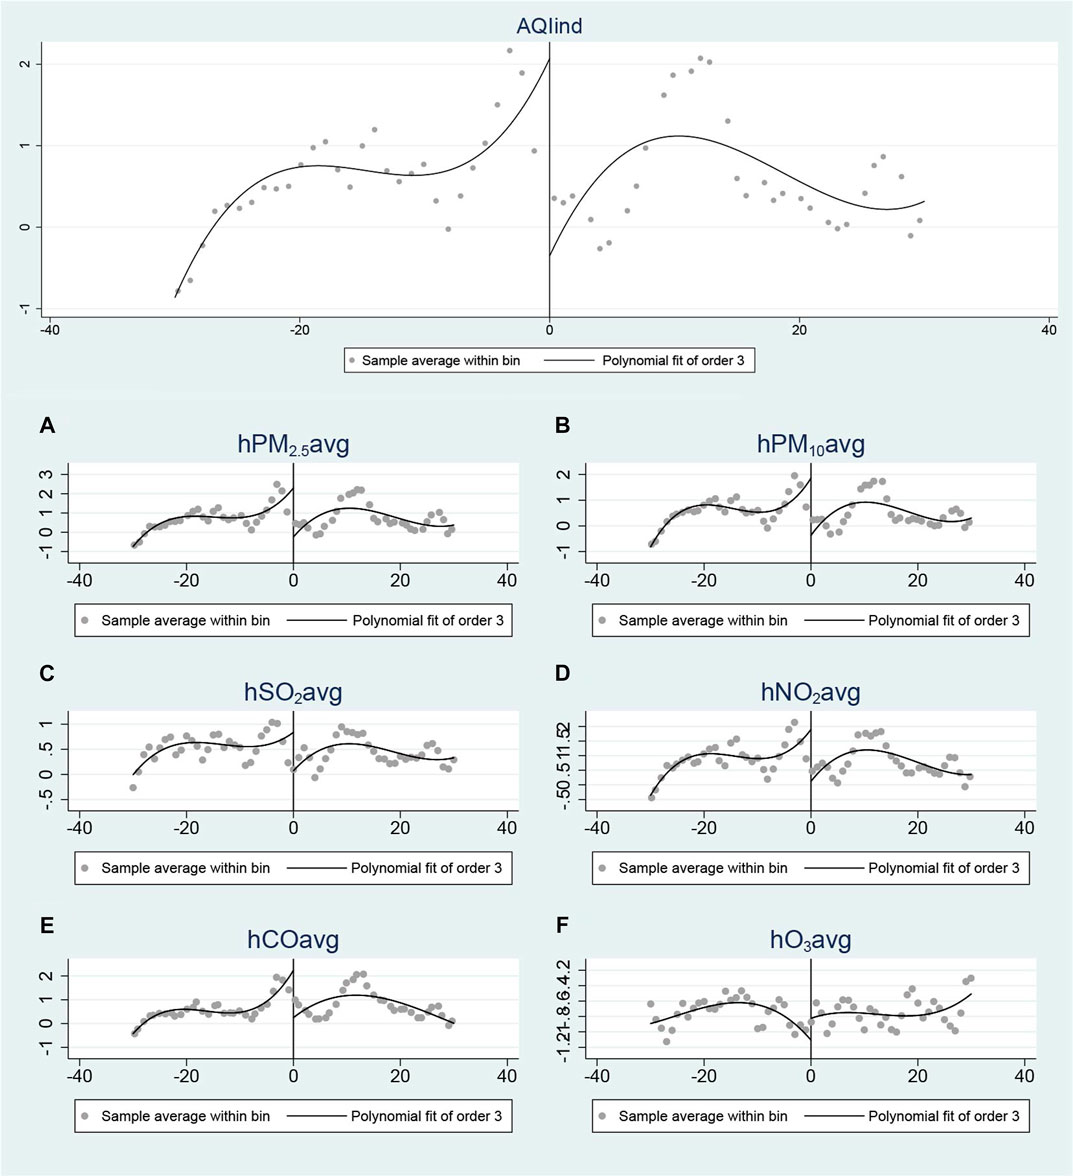
FIGURE 2. (A) Changes in the concentration of AQI 30 days before and after the Method was released. (B) Changes in the concentration of various pollutants 30 days before and after the Method was released.
Baseline Regression
The selection of an optimal bandwidth involves a trade-off between accuracy and bias in linear hypotheses. On the one hand, using a larger bandwidth yields more precise estimates as more observations are available to estimate the regression. On the other hand, the linear specification is less likely to be accurate when a larger bandwidth is used, which can biased in the estimation of the treatment effect (Lee and Lemieux, 2010). There are multiple outcome variables in this article, so there is a different optimal bandwidth for each one. Therefore, a bandwidth of 30 days is selected for unified regression estimation to better evaluate the short-term effect of the Method.
Table 3 illustrates the baseline sharp RD design results of the AQI and six pollutant indicators with a bandwidth of 30 days prior to and following the cut point. Except for O3, the estimated coefficients for AQI and five pollutant indicators are significantly negative, which proves that the Method implementation can significantly improve the air quality. Due to the local governments’ quick response to the Method through the strong executive power, the significant improvement effect of air quality was achieved in a short period of time. For one thing, they strengthened the implementation of air pollution control. For another, they supervised enterprises’ pollution emissions strictly. However, the Method implementation has not been able to significantly reduce the O3 concentration because lower atmospheric O3 is a secondary product of automobile pollutant emission under the irradiation of sunlight.
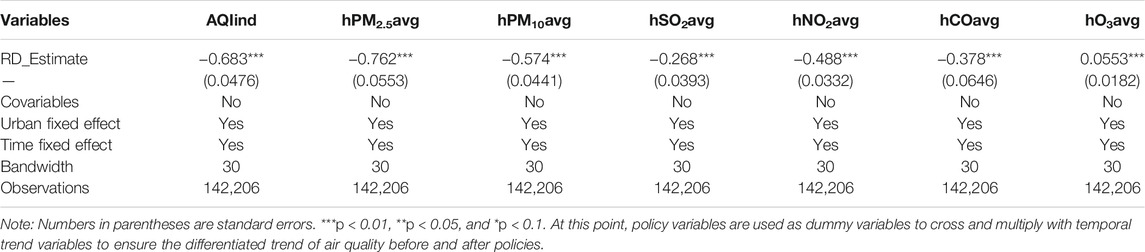
TABLE 3. Results of the sharp RD design for AQI and six pollutant indicators.
Robustness Test
The estimator of RD design is considered to be biased if the assignment variable is manipulated or a large observation heap is found (Barreca et al., 2011). To ensure that the estimation results are unbiased and valid, the following test approaches are employed:
1) Examine the influence of incorporating the covariates;
2) Examine the continuity of pretreatment covariates, which means to examine whether the distribution of covariates also exhibits discontinuity at the cut point;
3) Examine the influence of different bandwidth choices;
4) Examine sample selection sensibility, also known as the “donut hole” test, which reveals the results of omitting the observations that are vulnerable to be selected for certain reasons.
The robustness tests are conducted as follows.
First, the influence of incorporating the covariates is examined. Since the influence of the covariates is ignored in the baseline regression, according to the article contributed by Lee and Lemieux (2010), and the inclusion of covariates in the regression should reduce the residual square of the model and increase the interpretation efficiency but should not exhibit significant differences in estimation coefficients. Therefore, the covariates are included in the RD design as a part of the robustness test. The experimental results in Table 4 show that the results remain roughly constant compared to the baseline regression results, which supports the validity of the results.
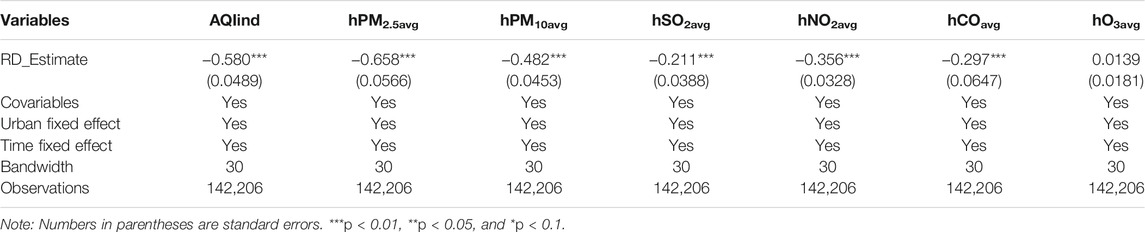
TABLE 4. Results of the sharp RD design with control covariates.
Second, the continuity of pretreatment covariates should be checked, which means that the baseline covariates should be continuous at the threshold. It is necessary to examine the possibility that other changes are occurring at cutoff, which could confound our analysis. That is to say, changes in the air pollutant concentration might be caused by other factors, and the assumption that the Method’s release significantly affects the air pollutant concentration could not be proved. It is reasonable to assume that the treatment effect illustrated in the model is caused by the assignment variable when the control variables are continuous and stable around the cut point.
The results are shown in Table 5. It exhibits the significant influence of the highest temperature, the lowest temperature, weather conditions, and wind force on air quality before and after the Method’s release, while the other variables did not, such as Grorgpdut, PcptlGRP, and GRPgwrate. Considering the lowest temperature, its coefficient is negative, which suggests that air pollution became worse as the temperature dropped. The change in the lowest temperature should have nothing to do with the remarkable improvement in air quality. Although weather conditions and wind force had significant coefficients, their values are −0.0667 and 0.0913, respectively, which should be relatively too small to contribute to the notable improvement of air quality. In conclusion, none of the control variables jumps at the cut point generally and should not affect the results, which further convinces that the release of the Method improved the air quality.
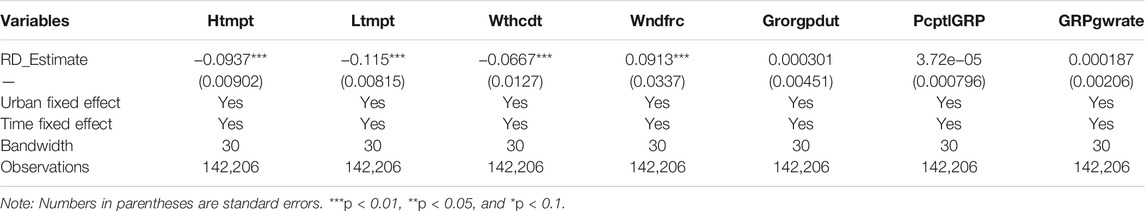
TABLE 5. Results of the control variable continuity test.
Third, various bandwidth selections are tested. When bandwidths are narrow, they tend to guarantee the unbiasedness of the local linear regression. However, narrow bandwidths would also enlarge estimation variance, and the regression results might remain inconsistent as bandwidths expand. Therefore, the study has re-estimated, respectively, with bandwidths 0.5 times and 2 times as wide as that in the baseline regression (Lee and Lemieux, 2010; Tu et al., 2020)—that is, 15 and 60 days before and after the cut point. The results of the treatment effect under the two bandwidths are shown in Table 6. The results under two different bandwidths are essentially consistent with those in the baseline regression, which shows that the result is not sensitive to the bandwidth choices and confirms the robustness of the results.

TABLE 6. Results of different bandwidths.
Fourth, the sample selection sensitivity, which is of great importance to guarantee the validity of RD, has been tested. The present study tries to verify it from both the perspective of the economic factors and the release time of the Method. First, compared to other regions, economically developed cities could lower the AQI more effectively, relying on their better industrial structure, stronger public awareness of environmental protection, and more advanced pollution treatment technologies rather than policy incentives. However, the other cities may count more on policy promotion to achieve the purpose of air pollution control. Considering the gap in environmental governance at the city level, samples of the first-tier cities are excluded to examine the robustness. Second, the closer the time is to the Method’s release, the higher possibility the air quality is to be manipulated during the period close to the cut point. Therefore, 5% of the observations close to the cut point are omitted in order to avoid a very steep change in air quality. The test results are shown in Table 7. The results remain generally consistent compared with the baseline regression results, which support their validity.
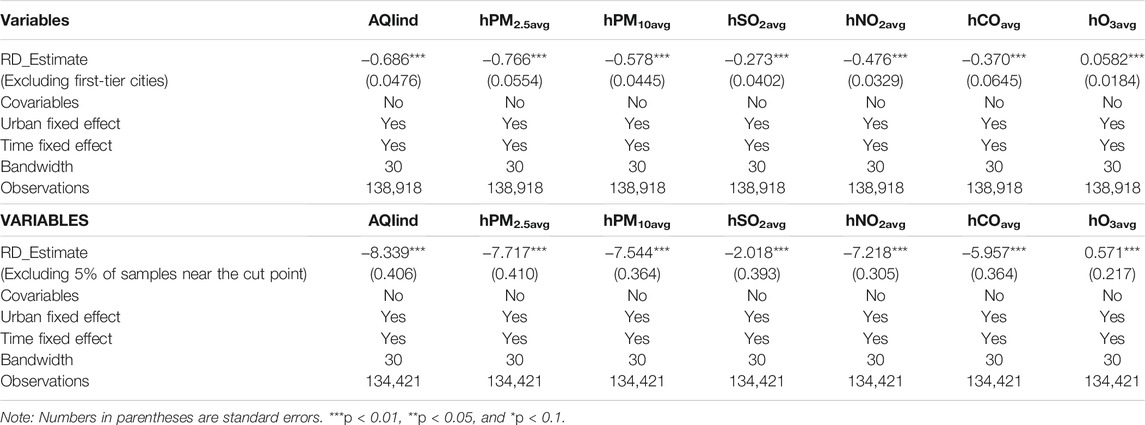
TABLE 7. “Donut hole” test results.
Policy Effect Persistence
Since the baseline regression model limits the sample to a 30-day bandwidth, only the short-term effects of the Method can be shown. The persistence or time variation of the Method effectiveness is also of particular interest.
Table 8 shows regression results of the AQI and six air pollutants in the preceding and following half-year (180 days), year (360 days), one and a half years (540 days), and 2 years (720 days) from the release of the Method. It is suggested that the Method can effectively improve air quality in the next half a year after its release, but the coefficients turn positive despite the treatment effect being significant 1 year after the release. In addition, the coefficient of AQI increases by 0.134 from 1 year to one and a half years but increases only 0.035 from one and a half years to 2 years. Although the coefficient takes on a slightly declining trend, the findings still indicate the concern that the air quality improvement effects have weakened after the assessment ends.
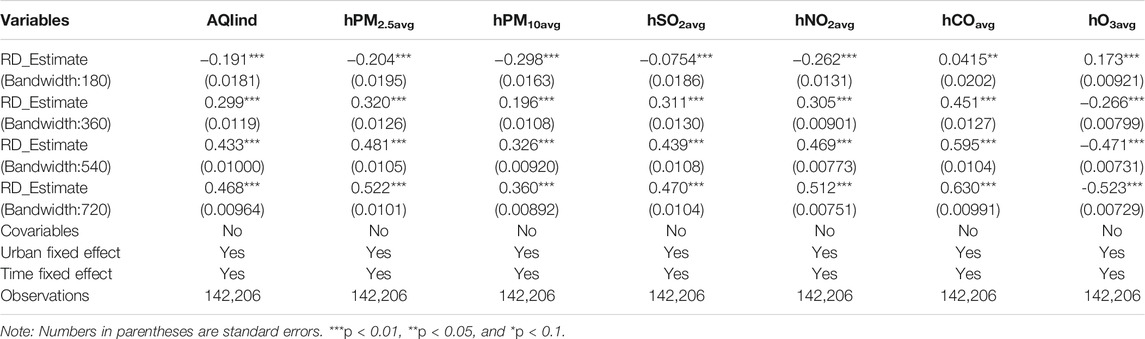
TABLE 8. Persistence analysis of the Method.
Heterogeneity Effects
It is known that China has a vast territory with discrepancies of air pollution control among different regions, which might result in varied effects from the Method. Regional disparity should also be taken into consideration (Wu et al., 2021). To do so, we have classified the country into seven regions as East, South, Central, North, Northwest, Southwest, and Northeast China according to the locations. Then, the AQI and the six air pollution indicators by the sharp RD design on these groups are estimated, and the policy persistence analysis is performed as well.
Table 9 and Table 10 illustrate the evidence for the heterogeneity of the policy effect on AQIind and the other indicators along with the results of the policy effect persistence analysis across regions with different air pollution levels. In the model with a bandwidth of 30, the treatment effect in the seven regions is significant overall, which indicates that the remarkable and sudden reduction in air pollutant concentration should be attributed to the fact that the local government of different regions actively responded to the Method and strengthened the regulations. Especially, the Method allows local governments to decompose the assessment targets scientifically and reasonably according to the regional discrepancy factors including the economic development level, resources, natural endowment, and other factors of all regions.
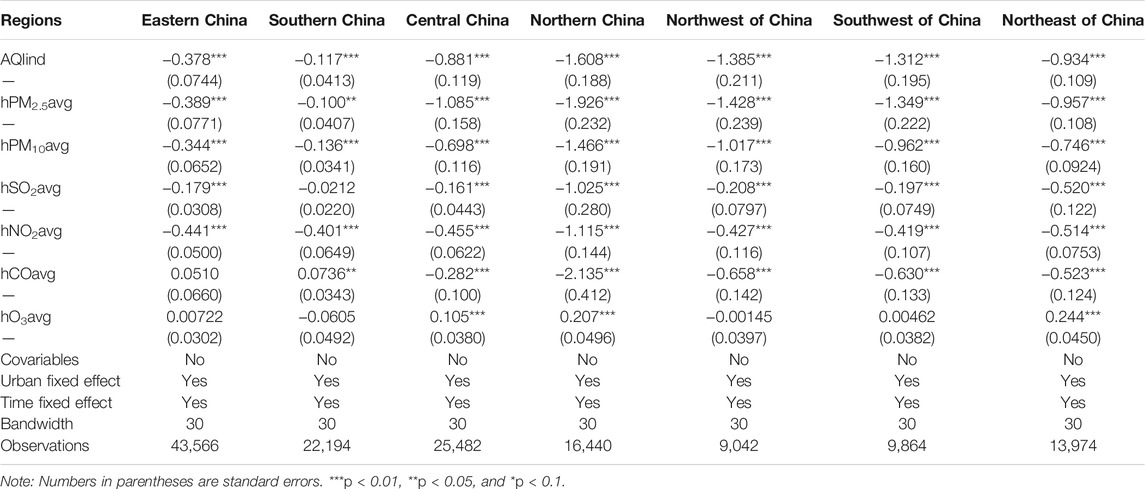
TABLE 9. Sharp RD design results for the seven regions of China.
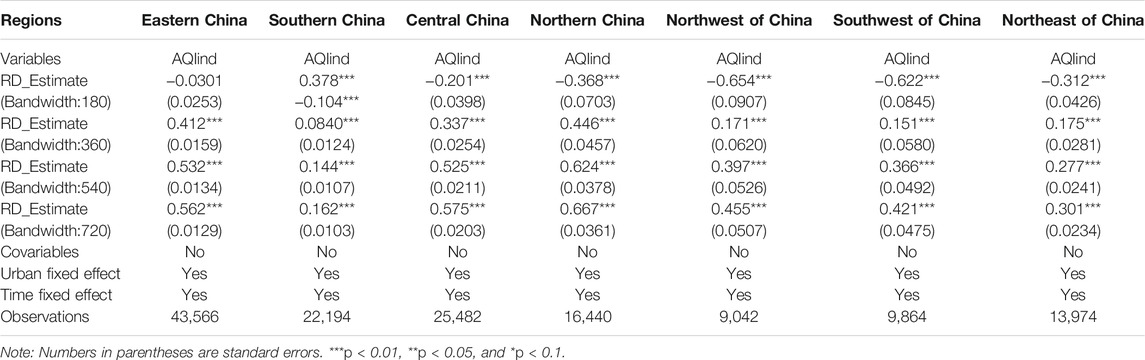
TABLE 10. Persistence analysis for the seven regions of China.
However, the result presented in Table 10 also reveals that 1 year after the Method’s release, the coefficients of AQIind in each region have become positive, which reaffirms that the effect of the Method decayed throughout the months and years afterward. Although the coefficient has decreased relatively a little, the necessities for a more sustainable air pollution control system are still suggested.
Conclusion and Discussion
This study uses environmental big data on seven air quality indicators from 173 Chinese cities at the prefecture level to construct a Sharp RD design and evaluates the effectiveness of the top-down environmental governance instrument, namely, Assessment and Appraisal Method for Ecological Civilization Construction Targets (the Method) on air quality across the country and the regions. The persistence effect is tested, and heterogeneity effects are analyzed further. The empirical analysis results include the following:
1) In the short term, the Method has had an overall significant treatment effect on various indicators nationally, which is consistent with the findings from many other relevant studies that one policy released by the central government will be very effective in the short term. This article examines the changes of air pollutant concentration 30 days before and after the release of the Method, and almost all single-pollutant indicators had significantly negative coefficients, except for the concentration of O3 having a positive one. In addition, the national AQI decreased significantly by 0.683 units, indicating that the Method meets the expectations of improving overall national air quality in the short term.
2) In the long term, the Method has a less significant effect of improvement. The treatment effect remains significant nationwide half a year after the Method promulgated. The regression coefficients of all indicators become positive when taking intervals of a year, a year and a half, and 2 years after the Method though. Although the coefficient has declined slightly in the long run, the findings still illustrate that the air quality improvement effects lessen as time goes on.
3) The Method’s effect on air quality improvement and its persistency are generally similar across different regions. Especially, compared with some previous studies which did not show significant impacts on all the regions, in a short period, East, South, Central, North, Northwest, Southwest, and Northeast China all show a significant improvement in air quality in this study. However, the Method’s effect is also found to decline over time according to the regional persistence analysis.
Based on this study’s empirical results, the following suggestions are proposed for the further improvement of air quality: first, considering effects of the environmental policies, which are effective at the beginning but decay as time goes by, it is necessary to formulate continuous and dynamic regulations for long-term air pollution control. The air pollution treatment is a vast but precise systematic project, and its success requires top-level institutions, effective execution, and good coordination with other relative regulations. Second, local governments of some regions should support innovations and optimizations in the technology, equipment, and service modes and improve related policies and mechanisms so as to facilitate the sustainable development of energy-efficient and environmentally friendly industries. Third, an optimized system of incentives for improved pollution control should be upgraded. The Government should encourage research and development on the industrial application of new technologies and equipment, such as those for low-grade waste heat power generation, fine particular matter control, and coordinated multi-pollutant treatment.
This study expounds on the effectiveness of the Method at the first stage and implies that a more sustainable air pollution governance system is necessary. Some recommendations on the formulation and improvement of environmental policies for governments are suggested. Several future research directions for this study are likewise presented. The continuous effect can be analyzed through empirical research based on a longer period, which may provide more precise and practical results. How to establish an effective and robust long-term environmental protection mechanism replacing traditional campaign-style policy enforcement could also be a challenging and meaningful direction for future research.
Data Availability Statement
The data analyzed in this study are subject to the following licenses/restrictions: all data generated or analyzed during this study will be made available by the authors. Further inquiries can be directed to the corresponding author. Requests to access these data sets should be directed to xux@th.btbu.edu.cn.
Author Contributions
RW conceived of the presented idea and supervised the findings. JH and LZ collected data and performed the computations. YX, XX, and TN revised them critically. All authors have made a substantial and intellectual contribution to this article and approved it for publication.
Funding
This research was funded by the National Social Science Foundation of China (Grant No. 19BJY161), the Key program Provincial Education Department of Hunan Province (Grant No. 20A122 and No.15A191), and the Natural Science Foundation of Hunan Province Information (Grant No.2021JJ30197).
Conflict of Interest
The authors declare that the research was conducted in the absence of any commercial or financial relationships that could be construed as a potential conflict of interest.
Publisher’s Note
All claims expressed in this article are solely those of the authors and do not necessarily represent those of their affiliated organizations or those of the publisher, the editors, and the reviewers. Any product that may be evaluated in this article or claim that may be made by its manufacturer is not guaranteed or endorsed by the publisher.
Acknowledgments
We gratefully acknowledge the helpful comments and suggestions of the reviewers, which have improved the article.
References
Al_Janabi, S., Yaqoob, A., and Mohammad, M. (2019). “Pragmatic Method Based on Intelligent Big Data Analytics to Prediction Air Pollution,” in Big Data and Networks Technologies. BDNT 2019. Lecture Notes in Networks and Systems. Editor Y. Farhaoui (Cham: Springer), Vol. 81, 84–109. doi:10.1007/978-3-030-23672-4_8
Barreca, A. I., Guldi, M., Lindo, J. M., and Waddell, G. R. (2011). Saving Babies? Revisiting the Effect of Very Low Birth Weight Classification. Q. J. Econ. 126 (4), 2117–2123. doi:10.1093/qje/qjr042
Calkins, C., Ge, C., Wang, J., Anderson, M., and Yang, K. (2016). Effects of Meteorological Conditions on Sulfur Dioxide Air Pollution in the North China plain during winters of 2006-2015. Atmos. Environ. 147, 296–309. doi:10.1016/j.atmosenv.2016.10.005
Chang, C.-P., Wen, J., Dong, M., and Hao, Y. (2018). Does Government Ideology Affect Environmental Pollutions? New Evidence from Instrumental Variable Quantile Regression Estimations. Energy Policy 113, 386–400. doi:10.1016/j.enpol.2017.11.021
Chen, L., Wan, P. B., and Xu, Y. Y. (2019). The Ownership Structure and Innovation Behavior of Mixed Ownership Enterprises—Based on the Empirical Test of Natural experiment and Regression Discontinuity. Management World 35 (10), 186–205. doi:10.19744/j.cnki.11-1235/f.2019.0141
Chen, S., Oliva, P., and Zhang, P. (2018). Air Pollution and Mental Health: Evidence from china. Nber Working Pap. doi:10.3386/w24686
Chen, S., Zhang, Y., Zhang, Y., and Liu, Z. (2019). The Relationship Between Industrial Restructuring and China’s Regional Haze Pollution: A Spatial Spillover Perspective. J. Clean. Prod. 239, 115808. doi:10.1016/j.jclepro.2019.02.078
Chen, X., Yi, N., Zhang, L., and Li, D. (2018). Does Institutional Pressure Foster Corporate Green Innovation? Evidence From China’s Top 100 Companies. J. Clean. Prod. 188, 304–311. doi:10.1016/j.jclepro.2018.03.257
Fan, D., and Sun, X. T. (2020). Environmental Regulation, green Technological Innovation and green Economic Growth. China Popul. Resour. Environ. 30 (6), 105–115. doi:10.12062/cpre.20200123
Farhaoui, Y., Sossi Alaoui, S., and Aksasse, B. (2019). Air Pollution Prediction through Internet of Things Technology and Big Data Analytics. Ijcistudies 8 (3), 177–191. doi:10.1504/IJCISTUDIES.2019.10024282
Heckman, J. (1997). Instrumental Variables: A Study of Implicit Behavioral Assumptions Used in Making Program Evaluations. J. Hum. Resour. 32, 441–462. doi:10.2307/146178
Hou, X., Chan, C. K., Dong, G. H., and Yim, S. H. L. (2019). Impacts of Transboundary Air Pollution and Local Emissions on PM2. 5 Pollution in the Pearl River Delta Region of China and the Public Health, and the Policy Implications. Environ. Res. Lett. 14 (3), 034005. doi:10.1088/1748-9326/aaf493
Jebaraj, S., and Iniyan, S. (2006). A Review of Energy Models. Renew. Energ. 10 (4), 281–311. doi:10.1016/j.rser.2004.09.004
Jia, K., and Chen, S. (2019). Could Campaign-Style Enforcement Improve Environmental Performance? Evidence from China's central Environmental protection Inspection. J. Environ. Manage. 245, 282–290. doi:10.1016/j.jenvman.2019.05.114
Kai-guang, Z., Ming-Ting, B., Hong-ling, M., and Yan-min, S. (2019). An Air Quality Composite index Based on Pollutant Concentration Factor Analysis. Afr. J. Math. Comput. Sci. Res. 12 (2), 10–16. doi:10.5897/AJMCSR2019.0788
Lee, D. S., and Lemieux, T. (2010). Regression Discontinuity Designs in Economics. J. Econ. Lit. 48 (2), 281–355. doi:10.1257/jel.48.2.281
Lee, D. S. (2008). Randomized Experiments from Non-random Selection in US House Elections. J. Econom. 142 (2), 675–697. doi:10.1016/j.jeconom.2007.05.004
Li, D., Zheng, M., Cao, C., Chen, X., Ren, S., and Huang, M. (2017). The Impact of Legitimacy Pressure and Corporate Profitability on Green Innovation: Evidence From China Top 100. J. Clean. Prod. 141, 41–49. doi:10.1016/j.jclepro.2016.08.123
Li, N., Zhang, X., Shi, M., and Hewings, G. J. D. (2019). Does China's Air Pollution Abatement Policy Matter? an Assessment of the Beijing-Tianjin-Hebei Region Based on a Multi-Regional CGE Model. Energy Policy 127, 213–227. doi:10.1016/j.enpol.2018.12.019
List, J. A., Millimet, D. L., Fredriksson, P. G., and McHone, W. W. (2003). Effects of Environmental Regulations on Manufacturing Plant Births: Evidence from a Propensity Score Matching Estimator. Rev. Econ. Stat. 85 (4), 944–952. doi:10.1162/003465303772815844
Neves, S. A., Marques, A. C., and Patrício, M. (2020). Determinants of CO2 Emissions in European Union Countries: Does Environmental Regulation Reduce Environmental Pollution? Econ. Anal. Pol. 68, 114–125. doi:10.1016/j.eap.2020.09.005
Niu, Y., Chen, R., and Kan, H. (2017). “Air Pollution, Disease burden, and Health Economic Loss in China,” in Ambient Air Pollution and Health Impact in China. Advances in Experimental Medicine and Biology. Editor G. H. Dong (Singapore: Springer), Vol. 1017. doi:10.1007/978-981-10-5657-4_10
Ouyang, X., Shao, Q., Zhu, X., He, Q., Xiang, C., and Wei, G. (2019). Environmental Regulation, Economic Growth and Air Pollution: Panel Threshold Analysis for OECD Countries. Sci. Total Environ. 657, 234–241. doi:10.1016/j.scitotenv.2018.12.056
Rohde, R. A., and Muller, R. A. (2015). Air Pollution in China: Mapping of Concentrations and Sources. PLoS One 10 (8), e0135749. doi:10.1371/journal.pone.0135749
Shou, M. H., Wang, Z. X., Li, D. D., and Wang, Y. (2020). Assessment of the Air Pollution Emission Reduction Effect of the Coal Substitution Policy in China: an Improved Grey Modelling Approach. Environ. Sci. Pollut. Res. Int. 27 (27), 34357–34368. doi:10.1016/j.envpol.2017.01.060
Song, C., He, J., Wu, L., Jin, T., Chen, X., Li, R., et al. (2017). Health burden Attributable to Ambient PM2.5 in China. Environ. Pollut. 223, 575–586. doi:10.1016/j.envpol.2017.01.060
Tan, Y., and Mao, X. (2021). Assessment of the Policy Effectiveness of Central Inspections of Environmental Protection on Improving Air Quality in China. J. Clean. Prod. 288, 125100. doi:10.1111/j.1477-2574.2009.00087.x
Tu, Z. G., Deng, H., Shen, R. J., and Gan, T. Q. (2020). The Environmental and Economic Benefits of the central Environmental protection Supervision: Evidence from Policy Pilot in Hebei. Econ. Rev. 221 (01), 5–18. doi:10.19361/j.er.2020.01.01
Wang, L., Liu, X. F., and Xiong, Y. (2019). Central Environmental protection Inspector and Air Pollution Governance—An Empirical Analysis Based on Micro-panel Data of Prefecture-Level Cities. China Ind. Economy 379 (10), 7–24.
Wang, Y., and Wang, J. (2020). Tropospheric SO2 and NO2 in 2012–2018: Contrasting Views of Two Sensors (OMI and OMPS) from Space. Atmospheric Environment 223, 117214. doi:10.1016/j.atmosenv.2019.117214
Wu, W.-p., Chen, Z.-g., and Yang, D.-x. (2020). Do internal Migrants Crowd Out Employment Opportunities for Urban Locals in China?-Reexamining under the Skill Stratification. Physica A: Stat. Mech. its Appl. 537, 122580. doi:10.1016/j.physa.2019.122580
Wu, W.-p., Zeng, W.-k., Gong, S.-w., and Chen, Z.-g. (2021). Does Energy Poverty Reduce Rural Labor Wages? Evidence from China's Rural Household Survey. Front. Energ. Res. 9, 163. doi:10.3389/fenrg.2021.670026
Wu, W. P., and He, Q. (2017). “Forced Pollution Reduction” or “Regressive”? —Threshold Characteristic and Spatial Spillover of Pollution Reduction Effect from Environmental Regulation. Econ. Management 39 (02), 20–34. doi:10.19616/j.cnki.bmj.2017.02.002
XinChun, L., YuTing, Z., Qing, H., XingHua, Y., Ali, M., Wen, H., et al. (2013). Vertical Distribution Characteristics of Dust Aerosol Mass Concentration in the Taklimakan Desert Hinterland. Sci. Cold Arid Regions 5 (6), 745–0754. doi:10.3724/SP.J.1226.2013.00745
Xu, Y., Liu, H., and Duan, Z. (2020). A Novel Hybrid Model for Multi-step Daily AQI Forecasting Driven by Air Pollution Big Data. Air Qual. Atmos. Health 13 (2), 197–207. doi:10.1007/s11869-020-00795-w
Yang, W., Yuan, G., and Han, J. (2019). Is China's Air Pollution Control Policy Effective? Evidence from Yangtze River Delta Cities. J. Clean. Prod. 220, 110–133. doi:10.1016/j.jclepro.2019.01.287
Yu, X., and Wang, P. (2021). Economic Effects Analysis of Environmental Regulation Policy in the Process of Industrial Structure Upgrading: Evidence from Chinese Provincial Panel Data. Sci. Total Environ. 753, 142004. doi:10.1016/j.scitotenv.2020.142004
Zhang, D., Pan, S. L., Yu, J., and Liu, W. (2019). Orchestrating Big Data Analytics Capability for Sustainability: A Study of Air Pollution Management in China. Inf. Management 103231, 103231. doi:10.1016/j.im.2019.103231
Keywords: policy assessments, big data, air quality, pollutant concentration, sharp regression discontinuity design
Citation: Wang R, Huang J, Zhang L, Xia Y, Xu X and Nong T (2021) Assessments of Air Pollution Control Effectiveness Based on a Sharp Regression Discontinuity Design —Evidence From China’s Environmental Big Data . Front. Environ. Sci. 9:724716. doi: 10.3389/fenvs.2021.724716
Received: 14 June 2021; Accepted: 09 August 2021;
Published: 30 September 2021.
Edited by:
Tsun Se Cheong, Hang Seng University of Hong Kong, ChinaReviewed by:
Jun Wang, University of Iowa, United StatesYongran Lin, Henan Administration Institute, China
Copyright © 2021 Wang, Huang, Zhang, Xia, Xu and Nong. This is an open-access article distributed under the terms of the Creative Commons Attribution License (CC BY). The use, distribution or reproduction in other forums is permitted, provided the original author(s) and the copyright owner(s) are credited and that the original publication in this journal is cited, in accordance with accepted academic practice. No use, distribution or reproduction is permitted which does not comply with these terms.
*Correspondence: Xu Xu, xux@th.btbu.edu.cn