 Yuanxin Zhai1,2
- 1State Key Laboratory of Eco-Hydraulics in North West Arid Region, Xi'an University of Technology, Xi'an, China
- 2Beijing Waterworks Group Co., Ltd, Beijing, China
In this study, an E. coli whole-cell microarray assay was used to evaluate the impact of sucralose (SUC) on 110 selected genes under different exposure concentrations. Furthermore, toxicity caused by SUC under five disinfection processes was explored. Our results revealed detailed transcriptional information for gaining insights into the toxicity mechanism. SUC at lower concentrations tends to induce more protein response, whereas greater DNA damage occurs at higher concentrations. In addition, SUC could induce changes in the expression of various genes, with the DNA damage exhibiting an obvious concentration dependence. As the exposure concentration of SUC increases, stress is transformed from a single-type level to the entire system, which could enhance cellular ability to resist damage and survive. Exposure–recovery tests show that long-term exposure (24 h) to SUC causes irreversible damage, and at SUC concentrations of 103–104 mg/L, short-term exposure (2 h) exerts the same effect. Furthermore, SUC toxicity is enhanced on disinfection, with ultraviolet light causing particularly serious DNA damage.
Highlights
• The hazardous effects of sucralose (SUC) and its disinfection byproducts were evaluated.
• The toxic mechanism of pollutants was identified by toxicogenomic approach.
• DNA damage under SUC exposure is concentration dependent.
• Short-term exposure at a high concentration will cause irreversible damage.
• The toxicity of SUC increased drastically after ultraviolet disinfection.
Introduction
The artificial sweetener sucralose (SUC) is widely used as a sugar substitute in food, beverage, personal care, and animal feed because of its low calorie content, high strength, and pure sweetness (Lange et al., 2012; Magnuson et al., 2017; dos Santos Filho et al., 2019; Fu et al., 2019). The global annual consumption of SUC exceeds 4,000 tons (Rodearmel et al., 2007; Pepino et al., 2013; Sharma et al., 2014). Due to its low digestibility, a large amount of SUC is excreted into the sewage system, which cannot be effectively degraded by traditional sewage treatment processes (Chen et al., 2016; Xu et al., 2018). This has resulted in its presence in various aquatic environments at a concentration ranging from 10−5 to 102 mg/L (Richardson, 2009; Wu et al., 2014; Cantwell et al., 2019). SUC is presently listed as an emerging pollutant by the United States Environmental Protection Agency due to its high polarity, high stability, and durability (Ankley et al., 2007; Subedi et al., 2014; Yang et al., 2021). Nevertheless, evidence of quantified ecological health risks of SUC and relevant mechanistic analysis remain rare (Buerge et al., 2009; Zhang et al., 2019). In addition, the widespread presence of SUC in aquatic environments increases concerns regarding the toxicity of relevant disinfection byproducts (DBPs) formed during disinfection processes in water treatment plants (Gou, 2015).
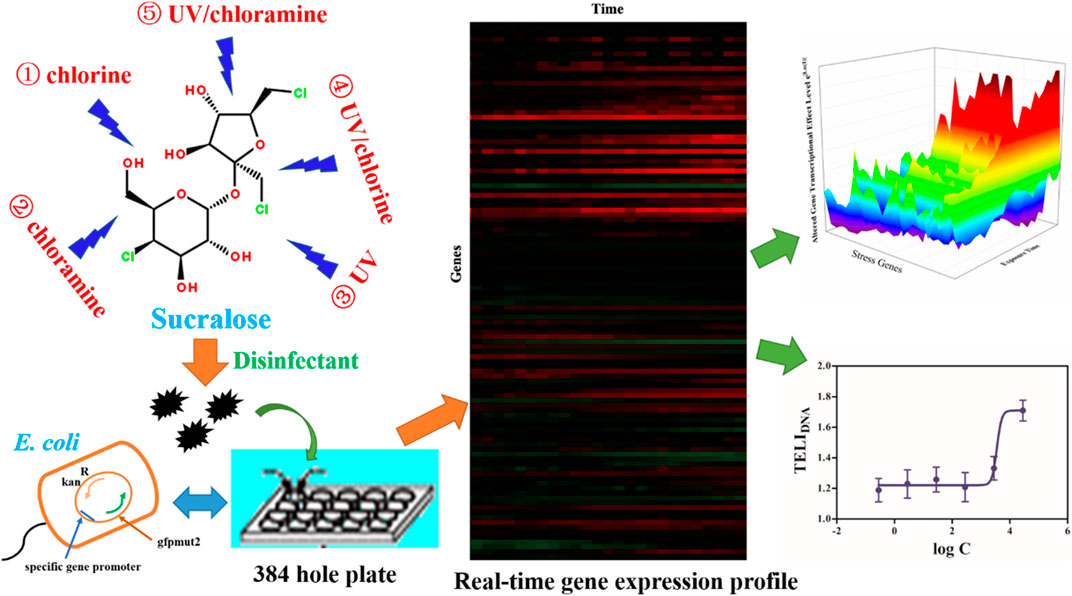
GRAPHICAL ABSTRACT
Standard ecotoxicological endpoints and protocols in invertebrates have been used to evaluate the potential ecotoxicity of SUC (Kille et al., 2000; Mitchell, 2008; Huggett and Stoddard, 2011). Huggett and Stoddard (2011) examined 21-day-old Daphnia magna and 28-day-old Americamysis bahia (mysid shrimp) samples and reported that SUC concentrations lower than 800 mg/L resulted in a nonsignificant reduction in D. magna survival or reproduction. There is often a threshold between the no observed effect concentration (NOEC) and the lowest observed effect concentration (LOEC). This threshold for D. magna was determined as 1800 mg/L in that study. On the other hand, survival, growth, and reproduction of mysid shrimps were unaffected when SUC concentration was less than or equal to 93 mg/L, which represents the threshold between NOEC and LOEC for the mysid shrimp. Heredia-García et al. (2019) reported that SUC is capable of inducing DNA alterations, apoptosis, and oxidative damage in blood cells of Cyprinus carpio on SUC exposure at two environmentally relevant concentrations (0.05 and 155 μg/L) for a 96-h period, with higher SUC concentrations resulting in more severe damage. Liu et al. (2019) used isotope-labeled quantitative proteomics to explore the effects of SUC on liver proteome functions of male C57BL/6J mice for 6 months and found differential expression of 113 protein groups (among the 5,700 detected proteins). Further bioinformatics analysis showed that the protein metabolism system was dysregulated after SUC exposure and the ribosomes in the liver were inactivated, possibly triggering increased inflammation. Furthermore, multiple long-term mammalian exposure experiments have shown that SUC has no specific toxic effects because too many external factors influence these outcomes (Buerge et al., 2009; Zhang et al., 2019). Fortunately, the SUC acute stress test can be used to circumvent the influence of uncontrollable external factors in long-term exposure tests.
In addition, Wang et al. (2019) recently reported that some emerging pollutants generate more toxic DBPs on treatment with chlorine or ultraviolet (UV) light. Therefore, it is essential to analyze the toxicity of DBPs generated from SUC to comprehensively understand the possible adverse effects of SUC. Nevertheless, few systematic investigations on the side effects of DBPs generated from SUC are available. Apparently, due to different objectives and a variety of measures used by researchers, it could be extremely challenging to compare results across independent studies and draw a clear picture regarding the effect of SUC and its DBPs. Logically, a whole-cell microarray assay was suggested to explore the effect of SUC disinfection processes on genetic damage, to achieve a more thorough understanding of relevant mechanisms of SUC-induced toxicity.
Whole-cell microarray assay has been widely used to obtain qualitative and quantitative measures of genetic stress responses induced by various emerging environmental pollutants. The transcriptional effect level index (TELI) was used to evaluate toxicity induced by endocrine-disrupting chemicals such as hexachlorobenzene, bisphenol A, and 17β-estradiol (Gou and Gu, 2011). In addition, Lan et al. (2018) used a yeast whole-cell microarray assay to evaluate the genotoxicity induced by 20 emerging DBPs in drinking water. These studies showed that whole-cell microarray assay could effectively deliver abundant genomic information and provide a theoretical basis for studying potential mechanisms of the hazardous effects caused by pollutants.
In this study, an E. coli whole-cell microarray assay was used to explore the potential impacts of SUC, with certain stress responses analyzed at the gene level using the established TELI (Gou et al., 2010; Gou and Gu, 2011). In addition, a more systematic and quantitative understanding regarding cellular responses at different SUC concentrations was attempted. The TELI gene expression library consists of each targeted promoter fused to a gene encoding the green fluorescent protein (GFP) on a low-copy plasmid. The TELI analysis has been used for characterizing specific functional-impairment stress in cells exposed to different drug concentrations (Gou et al., 2014; Hayes and Dalton, 2015). Therefore, this analysis provides information on the number and identity of genes with altered expression, the magnitude of the alteration, and the temporal pattern of gene expression change in response to toxicant exposure (Muenter et al., 2019). Furthermore, cellular responses of SUC after different disinfection processes were evaluated.
Materials and Methods
Preparation of Sucralose Standard Solution
The SUC (1,6-dichloro-1,6-dideoxy-β-D-fructofuranosyl-4-chloro-4-deoxy-α-D-galactopyranoside) standard was purchased from Sigma-Aldrich (St. Louis, MO). All other solvents and reagents were of analytical grade.
A solution of SUC was prepared based on its solubility. About 14.1000 g of SUC was accurately weighed (to one-hundred-thousandth of error) by a balance and dissolved in 50-ml of phosphate-buffered saline (PBS) to prepare a standard stock solution with a concentration of 2.82 × 10⁵ mg/L. The working solutions were then prepared by 10-times stepwise gradient dilution using PBS.
Disinfection Tests
SUC was treated with five disinfection processes: chlorine, chloramine, UV, UV/chlorine, and UV/chloramine. Sodium hypochlorite (NaClO) and monochloramine (NH2Cl) disinfectants were used in chlorine and chloramine disinfection processes, respectively, and disinfection was carried out so that a value of 5 (mg/mg-C) of Cl2/DOC could be maintained to ensure residual chlorine. The disinfection reaction was performed in sealed 1-L brown glass bottles at room temperature for 3 days. Three replicates were set up for each test. After disinfection, 1 mol/L sodium thiosulfate was used for quenching, which removes residual chlorine for subsequent sample processing.
Each sample after disinfection was concentrated by solid-phase extraction according to the method described in previous studies (Tran et al., 2013; Kadmi et al., 2014a; Kadmi et al., 2014b; Wu et al., 2019). Briefly, each sample was adjusted to a pH of 2 by using H2SO4 (2 mol/L), then passed through a 6-ml Oasis hydrophilic–lipophilic balance resin cartridge (Waters, MA, USA) at a flow rate of 5 ml/min. The resin was dried by passing nitrogen, followed by elution with 5 ml methanol, 2 ml acetone, and 2 ml dichloromethane in turns. The extracted material was dried under a stream of nitrogen and stored at 4°C. This method can recover some nonvolatile organic components in water samples to a higher degree. Total organic carbon determination showed that the recovery rate of each sample was in the range of 50–60%. However, the pure aqueous phase system (without any ions) that has an adverse effect on E. coli cells due to osmotic pressure could be replaced by other systems (culture medium or 5% dimethyl sulfoxide) that have no adverse effect on the cells. Specifically, the recovered components were dissolved in a 5% dimethyl sulfoxide or PBS solution (previous studies have shown that these do not interfere with toxicity assays (Gou and Gu 2011)), followed by the relevant toxicity test.
E. coli Whole-Cell Microarray Assay
The SUC standard and disinfected samples were evaluated for toxicity using an E. coli whole-cell microarray assay based on toxicological genomics. The whole-cell assay library, including 110 genes with GFP reporter (Supplementary Table S1) of the E. coli K-12 MG1655 strain, was used for toxicity assay. The 110 genes chosen are involved in different cellular stress responses, including oxidative stress, DNA stress, protein stress, general stress, and membrane stress. Each fusion was expressed by a low-copy plasmid pUA66 (Supplementary Figure S1), which contained a kanamycin resistance gene and a fast-folding GFPmut2, allowing for real-time measurement of changes in gene expression levels (Du et al., 2017; Lan et al., 2018). The E. coli strains were cultivated in LB medium with 25 mg/L kanamycin in 384-well plates (CoStar, Bethesda, MD, USA) at 37°C in dark to avoid GFP photobleaching till the early exponential growth stage (characterized by an OD600 value of 0.1–0.3). After sample addition, the plate was placed in a microplate reader (Cytation, Neo2, BioTek, USA) for cell growth measurement (at a wavelength of 600 nm) and fluorescence data acquisition (at excitation and emission wavelengths of 485 and 528 nm, respectively) at 5-min intervals for 2 h at 37°C. Three replicate samples were used for each test.
Long-Term (24-h) Stress and Recovery After 2-h Stress
Considering that longer exposure to SUC may have different toxic effects on E. coli cells, a long-term stress test (24 h) was conducted. At the same time, a more in-depth study was conducted on stress recovery after a short time (2 h) of exposure. The protocol for the 24-h long-term stress test method is exactly the same as the 2-h stress test, and only the exposure time is different. It is worth mentioning that in the 2-h stress recovery experiment, E. coli cells exposed to SUC solution were washed five times with PBS by centrifugation and supernatant discarding. At this time, the SUC solution was assumed to have been removed completely. Then, M9 minimal medium was added to make up the original solution volume, and continuous culture was carried out for 22 h. During this period, the microplate reader was used for data collection, as descried in the E. coli whole-cell microarray assay.
Data Processing
According to previous studies, the TELI induced by SUC and other samples was measured according to the published protocol (Zaslaver et al., 2006). The quantitative endpoint of the time-series response of a given gene, termed as TELI, was obtained by aggregating the induction of altered gene expression level normalized over exposure time (Gou and Gu, 2011). The TELI values indicated a relative change in expression of a given promotor in exposed samples compared to the untreated control. The values of TELI were calculated as follows. The GFP and optical density (OD) data were first smoothed using a five-point moving average, which was then corrected for the control group (with and without chemical exposure). The population-normalized GFP signal was calculated as P = GFP/OD and corrected against the background (E. coli strains without GFP infusion) at the same OD with and without chemical exposure. The induction factor (I) was calculated as the ratio of normalized expression levels (Eq. 1) between experimental (with chemical exposure) and control (without chemical exposure) groups to measure the alteration in gene expressions, as:
where Pe and Pc represent normalized expression levels in experimental and control groups, respectively.
The induction factor I was then used for TELI calculation (Eqs 2, 3), where a gene was considered to be upregulated if I > 1 and downregulated if I < 1, as:
where t (h) was the exposure time, i was the number of genes in the assay library, and wi was the weighting factor for gene i. In this study, all weighting factors were assigned a value of 1. Toxicity mechanisms could, therefore, be elucidated with changes in genes associated with specific stress response pathways.
Results and Discussion
Evaluation of Genotoxicity
Determination of Sucralose Tolerance Concentration Using Survival Assay
First, an experiment was performed to determine the maximum SUC tolerance concentration threshold of E. coli. As a host for foreign gene expression, the E. coli cells had a clear genetic background, simple technical operation, simple cultivation conditions, and low cost of large-scale cultivation (Zaslaver et al., 2006). In the experiment, the control group included an equal volume of medium, a test drug control, and blank control. The results are shown in Figure 1. The concentration that exerts a less than 5% lethality in the E. coli strains was 2.82 × 10⁴ mg/L. Therefore, this concentration was used as the upper limit. The six TELI assay concentrations were determined to be 2.82 × 10⁻¹, 2.82 × 100, 2.82 × 101, 2.82 × 10², 2.82 × 10³, and 2.82 × 10⁴ mg/L, respectively. An ultra-high performance liquid chromatography mass spectrometer (LCMS-8040, Shimadzu, Japan) was used to measure the true concentration of SUC solution, and the corresponding test concentrations were estimated to be 2.70 × 10⁻¹, 2.71 × 100, 2.79 × 101, 2.81 × 10², 2.82 × 10³, and 2.82 × 10⁴ mg/L, respectively (specific test conditions are listed in the Supplementary Materials). Consistent with previous studies (Gou et al., 2010; Gou and Gu 2011; Lan et al., 2018), this study aimed to study the different stress response types of E. coli exposed to different dose ranges of SUC, so that a series of serial dilutions were next carried out.
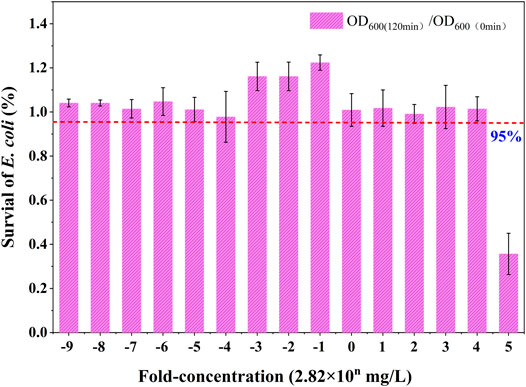
FIGURE 1. Survival of E. coli (average values) at different concentrations of SUC.
The concentration range of SUC in aquatic environments is known to be in the range of 10−5–102 mg/L. However, due to biological enrichment, leakage, and diffusion, SUC concentrations could reach even higher values. Therefore, a higher concentration of SUC toxicity assessment was deemed necessary for this study. On the other hand, if SUC concentration was too low, the test target would not be able to exhibit a clear stress response. Therefore, based on practical considerations, the above concentrations were selected for toxicity assessment to reveal the types and mechanisms of stress response under the influence of different SUC concentrations.
Transcriptional Effect Level Index Assay
The whole-cell microarray assay was used to estimate TELI values of specific functional genes in E. coli on SUC exposure (Supplementary Table S2). The TELI responses for 110 genes associated with various stress pathways on SUC exposure are shown in Figure 2. The differences in expression levels were obvious for E. coli treated with different SUC concentrations. In this study, a TELI value of 1.5 was set as the toxicity limit, with TELI > 1.5 considered to be significantly toxic, in line with previous literature (Hayes and Dalton, 2015; Muenter et al., 2019).
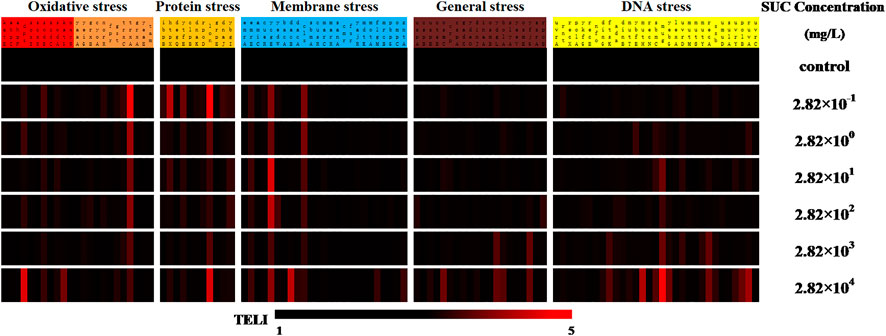
FIGURE 2. The TELI values corresponding to each genetic stress response upon exposure of E. coli to various SUC concentrations.
From Figure 2, the change in TELI was inferred to be concentration dependent, with higher concentrations resulting in a more significant change in gene expression. On exposure to the highest SUC concentration (2.82 × 10⁴ mg/L), the number of genes with a TELI value greater than 1.5 was 28, which is almost double of that identified on SUC exposure at the lowest concentration (2.82 × 10⁻¹ mg/L). This result suggested that exposure to higher SUC concentrations could induce more serious damage in E. coli. Specifically, the trxA gene in the oxidative stress pathway, the lon gene in the protein stress pathway, the mug gene in the DNA damage pathway, and the genes ycgE and cls in the membrane stress pathway showed the greatest TELI under the six exposure concentrations of SUC tested here.
The main function of the trxA gene is to increase and activate cellular redox potentials, indicating that exposure to SUC could perturb cellular redox pathways. Studies by Liu et al. have also shown that SUC exposure could cause redox stress in carp blood cells (Liu et al., 2019). The lon gene is known to regulate ATP-dependent proteases, which are mainly responsible for degrading misfolded proteins. This indicated that protein misfolding could be affected by SUC exposure, which is similar to an earlier work by Gou et al. (2010), showing that SUC affects protein expression. The main function of the mug gene is controlling DNA repair after damage, suggesting that SUC exposure may cause DNA damage, which is in overall agreement with earlier reports by Heredia-García et al. (2019). The ycgE gene regulates the secretion of substances related to biofilm formation and inhibitors of acid-resistant genes, while the cls gene is mainly related to the formation of cell membranes and phospholipid synthesis, implying that cell membranes could be destroyed on SUC exposure. To the best of our knowledge, the present work is the only report on the impact of SUC on cell membrane damage. This implies that the toxicological genomics method used here could identify unknown or novel toxic mechanisms or pathways which need to be further investigated in detail.
The TELI of overall gene response with various pathways upon exposure to different SUC concentrations is shown in Figure 3 (data points in Supplementary Table S3). As shown in the figure, the protein stress pathway was the most severely affected compared to other types of stress pathways on exposure to low SUC concentrations (2.82 × 10⁻¹ mg/L). On the other hand, exposure to high SUC concentrations (2.82 × 10⁴ mg/L) majorly affected the DNA repair pathway. Protein damage is often phenotypic and could be repaired easily, whereas DNA damage is more fatal to cells (Lombard et al., 2005). This implied greater damage in E. coli with increasing SUC concentrations, which is consistent with an earlier study by Huggett and Stoddard (2011) that apparently severe growth effects are only caused by high SUC concentrations.
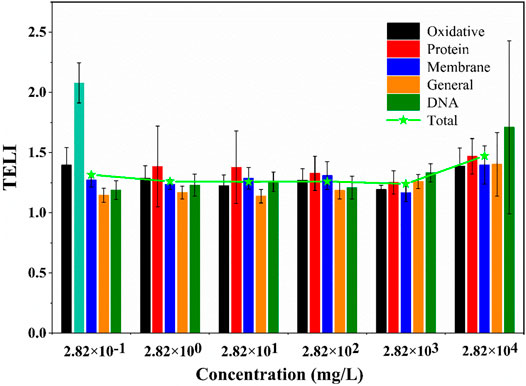
FIGURE 3. Overall stress response TELI values of E. coli exposed to various SUC concentrations.
Additionally, it is obvious that, compared with the lowest concentration (2.82 × 10⁻¹ mg/L), the other five SUC concentrations did not result in significant changes in a particular pathway (Figure 3). With the increase in SUC concentration, the initial single-cell stress was transformed into overall stress. Due to the variety of stress damage caused by exposure to high SUC concentration, it is necessary to repair the damage through overall stress pathways, so that normal survival of E. coli is ensured.
Quantitatively, there was no significant difference among the expression levels in these six groups, which indicated that there was no obvious dependence between SUC concentration and the expression levels of genes associated with any stress pathways (Figure 3). Therefore, the toxicity of exogenous chemicals was not only correlated with its dosage, but also influenced by some other factors (Faber et al., 2005). Based on previous studies (Heredia-García et al., 2019), the degree of DNA damage was closely related to the concentration of chemicals. Therefore, a specific model was selected to fit the relationship between SUC concentration and DNA damage. To further analyze the values of TELIDNA, an SUC dose–effect curve based on TELIDNA was fitted by a four-parameter nonlinear model (Figure 4).
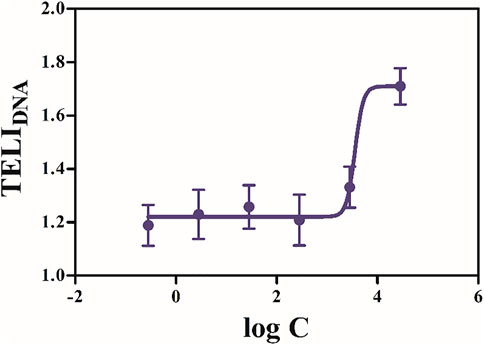
FIGURE 4. SUC dose–effect curve based on TELIDNA was fitted to a four-parameter model.
As shown in Figure 4, the dose–response curve of TELIDNA and log C (of SUC) exhibited an “S” shape. The degree of DNA damage increased with SUC concentration. The accumulation of a high concentration of SUC causes more serious DNA damage to organisms, and as the concentration increases, the damage becomes stronger. Therefore, sewage treatment plants should adopt corresponding treatment processes to effectively degrade SUC, such as advanced oxidation (Sharma et al., 2014).
Real-time gene expression profiles could depict a complementary set of genes and cell or tissue abundances under specific conditions (Yang et al., 2021). Then, gene transcription, regulation, signal transduction pathways, and gene interactions could be explored through bioinformatics analysis. Figure 5 shows the real-time gene expression map of 110 different stress-related genes that were activated on SUC exposure. It was obvious that the upregulated genes included most genes associated with regulating oxidative and protein stress, whereas the membrane, general, and DNA stress-related genes were all downregulated. With the increase in SUC concentration, the expression of membrane and general stress-related genes changed from downregulation (positive regulation) to upregulation (negative regulation). This may be because of a shift from specific cellular effects to subcellular nonspecific cellular stress responses (O'Connor et al., 2013).

FIGURE 5. Real-time gene expression profiles at different SUC concentrations. Red and green indicates upregulation and downregulation, respectively; values exceeding ±1.5 are according to ±1.5.
Gene expression levels were upregulated or downregulated on SUC exposure. For downregulated genes, absolute Ln(I) values ([Ln(I)]abs) were applied to convert all altered transcriptional effect level to positive values. For TELI determination, to quantify and compare the level of differentially expressed genes, absolute change fold values were used in this study. For example, upregulation by twofold (Ln(I) = 0.69) would be considered the same magnitude of change as for downregulation of 50% (Ln(I) =0.69, [Ln(I)]abs = 0.69) (Onnis-Hayden et al., 2009). Control gene expression level (I = 1) was subtracted from each data point (Gou et al., 2010). Figure 6 represents a cumulative transcriptional effect level integration 3D map for genes with more than twofold changes in expression. The expression of 28 genes (including dps and sodB) changed more than twofold on exposure to different SUC concentrations. The degree of changes in expression for the selected genes varied, depending on the SUC concentration.

FIGURE 6. 3D altered TELI profile compiled from altered gene expression levels for all genes in the test library for different SUC concentrations. Note that only selected genes are shown on the x-axis.
Figure 7 describes the time evolution and specific stress-related pathways of genes whose expression changed more than twofold (i.e., Ln(I)abs > 0.69). The number of genes with Ln(I)abs > 0.69 showing altered expression was the highest for the SUC concentration of 2.82 × 10⁻¹ mg/L, with the stress pathway being more abundant. The number of genes with more than twofold expression change on exposure to the highest SUC concentration (2.82 × 10⁴ mg/L) was less than that on exposure to low SUC concentrations. In addition, the degree of stress at high SUC concentration was also lower compared with that at low SUC exposure. However, compared with the TELI values of other genes in the detection library, the number of genes with altered expression was higher for both high and low SUC concentrations (Ln(I)abs≤0.69). This suggested that SUC could induce overall stress in E. coli, irrespective of the exposure level.
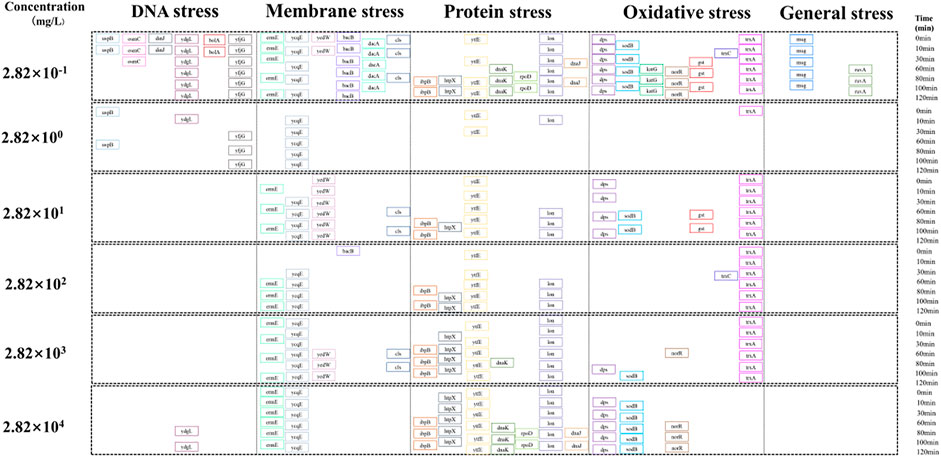
FIGURE 7. Altered expression of genes involved in the different stress pathways.
Long-Term (24-h) Stress and Recovery After 2-h Stress
From the results of the 2-h SUC exposure experiment, five genes (trxA, lon, emrE, ycgE, and cls) were identified, whose TELIgene value was more than 1.5 at all six SUC concentrations. Recovery experiments after the 2-h SUC exposure were then conducted and compared with a 24-h long-term exposure experiment. In the recovery experiment, SUC was removed from the system after 2-h exposure, and a microplate reader was used to record OD600 (once every 15 min for 22 h).
As shown in Figure 8, the gene trxA was selected for further analysis, and the results for the other genes are shown in Supplementary Figures S2–S5. Compared with the long-term (24-h) SUC exposure, normal growth of E. coli was restored in some time after SUC removal, especially on exposure to low SUC concentrations (2.82 × 10⁻¹–2.82 × 10² mg/L). However, once the SUC concentration reached 2.82 × 10³–2.82 × 10⁴ mg/L, E. coli growth was hardly recovered, even after SUC removal. This was observed for all five genes. These results indicate that the damage caused by low-level SUC exposure was superficial and recoverable, while high doses of SUC could cause substantial damage to E. coli. This is consistent with previous studies reporting that SUC causes substantial damage to cells only when SUC concentrations exceed a certain threshold (Kille et al., 2000).
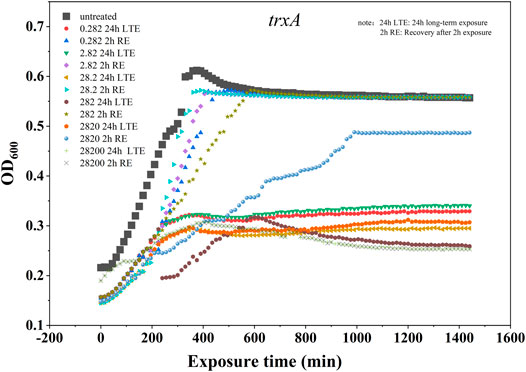
FIGURE 8. E. coli growth curve including trxA reporter in 24-h long-term exposure and recovery after 2-h exposure.
Variation in Sucralose Toxicity After Different Disinfection Processes
The extent of SUC degradation in different disinfection processes is shown in Figure 9 (SUC concentration test method being consistent with the foregoing study). SUC degradation during UV-based disinfection was extremely weak (only 2%), and that in chlorination and chloramination processes was also not good (7 and 9%, respectively). The degradation of SUC in the UV/chlorination and UV/chloramination processes was better, reaching 22 and 17%, respectively. Our results show that SUC still exists in large quantities after terminal disinfection in the sewage treatment system, and the discharge into the receiving water body would continue to accumulate and enrich SUC, causing potential harm to the aquatic environment. Therefore, it is extremely necessary and relevant to explore how SUC toxicity changes on disinfection.
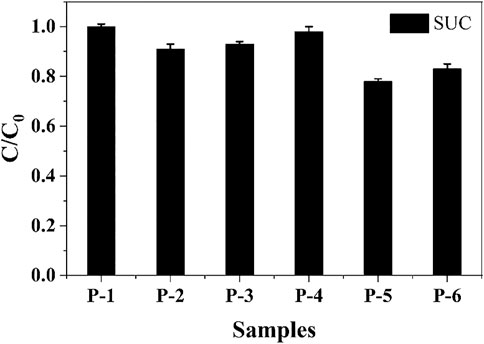
FIGURE 9. Disinfection process–dependent degradation of SUC. P-1, P-2, P-3, P-4, P-5, and P-6 are SUC (2.82 × 10⁴ mg/L), chlorine, chloramine, UV, UV/chlorine, and UV/chloramine, respectively.
The toxicity evaluation results (overall stress TELI value) of SUC after 3 days of disinfection in each system are shown in Figure 10. The most significant effects on oxidative, protein, and membrane stress pathways were associated with the chloramine disinfection system, followed by UV/chloramine. The chlorine disinfection system showed the strongest impact on general stress, followed by chloramine. The UV system showed the most obvious stress damage on DNA. The impact of the UV disinfection system on total TELI was the most significant.
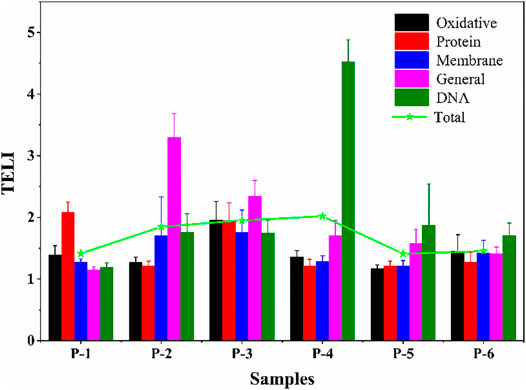
FIGURE 10. Overall stress TELI responses in E. coli exposed to SUC treated in different disinfection processes (P-1, P-2, P-3, P-4, P-5, and P-6 are the same as in Figure 9).
In summary, a combined analysis of SUC degradation in different disinfection processes and the total stress TELI response values in these conditions showed that the decreased SUC concentration achieved using the UV/chlorination and UV/chloramination processes leads to a similarly diminishing effect on the total TELI. However, SUC toxicity after chlorination, chloramination, and UV treatment not only did not decrease but also increased, especially for UV-based disinfection. This hints at a more complicated reaction occurring during these disinfection processes, resulting in more toxic intermediates; therefore, more specific investigations and discussions are needed to clarify these aspects.
The stress map of the 110 identified genes under the five disinfection systems is shown in Figure 11. Compared with exposure to pure SUC, varying extents of changes in gene expression patterns were induced after disinfection. Among them, the most obvious change was associated with the UV system and mainly involved the DNA stress pathways. Except for three genes (namely, mutH, mug, and mutM), the TELI values of all other genes increased. Specifically, the TELI value of seven genes was higher than 5 for the chlorine and UV/chlorine disinfection systems, which induced significant changes in individual gene expression during oxidative and general stress responses. Meantime, UV/chlorine disinfection also affected gene expression in the membrane stress pathway. The chloramine system affected gene expression in all five major types of stress. UV/chloramine was found to cause the most significant effect on gene expression changes in general stress and DNA stress pathways.
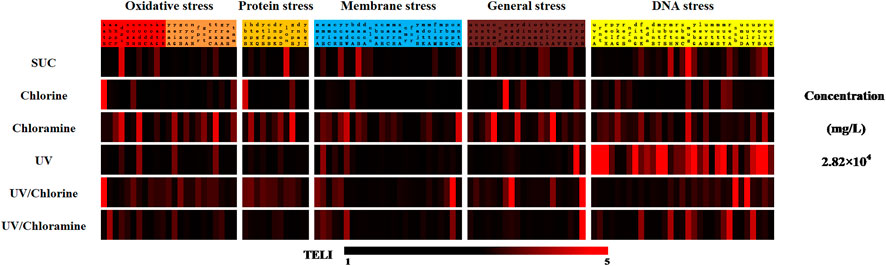
FIGURE 11. TELI for each change in gene response to SUC exposure and different disinfection processes.
The number of genes with TELIgene value more than 1.5 under the different disinfection processes are shown in Figure 12. The highest number of genes with TELI value greater than 1.5 was associated with chloramine-treated SUC, followed by UV/chlorine, UV, and UV/chloramine, and finally, chlorine treated SUC. Notably, under all five disinfection processes, the DNA damage category accounts for the largest proportion of genes with TELI value greater than 1.5.
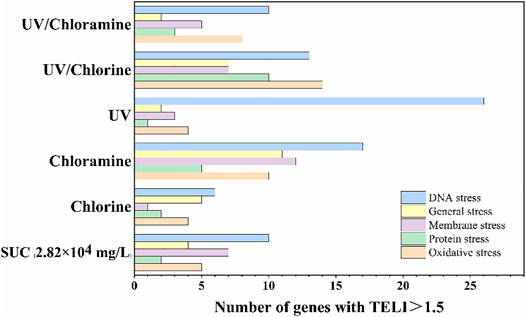
FIGURE 12. Number of genes with TELI > 1.5 under different disinfection conditions.
Measuring the concentrations of residual SUC (Figure 9) indicated that there was a certain difference in the degradation of SUC under oxidation and UV conditions. In general, more SUC was removed during oxidation processes, whereas little was eliminated during just UV disinfection. Simultaneously, it was found that the residues after chlorination treatment mainly lead to oxidative stress and general stress on E. coli (Figure 11), whereas the UV treatment induced more DNA damage. The above results proved that SUC underwent different reactions in the oxidation and UV radiation processes. This should lead to different conversion pathways, formation of different byproducts, and thus different types of stress responses. These results are consistent with our previous knowledge (Gou, 2015). More in-depth researches are needed to understand the formation of byproducts during treatment, in addition to the mechanism of toxicity changes caused by these substances.
In general, we speculated that SUC toxicity increased after some disinfection processes, which may be due to various DBPs generated during disinfection (Liao et al., 2015; Zhong et al., 2019) or some other more toxic substances and the possible interactions between toxic substances (such as accumulation and additive effects of toxicity). The major objective of the present study was to analyze the effect of different disinfection treatments on SUC toxicity. The shortcoming of these experiments is that specific toxicity caused by SUC is unclear. In this context, LC/MS has been used to carry out detailed analysis, especially to understand generation of DBPs from SUC during the disinfection processes (Yang et al., 2019).
Conclusion
In this study, the whole-cell microarray assay was used to evaluate gene expression (toxicity) of E. coli in response to SUC exposure and changes in SUC-induced toxicity under different disinfection processes, which was different from toxicity assessment tests previously reported for SUC. The present study identified a variety of gene expression pathways influenced by SUC exposure. A relationship between SUC concentration and induced DNA damage was constructed, showing concentration-dependent toxicity of SUC. In addition, the exposure–recovery test showed irreparable damage during high concentrations of SUC exposure or long-term exposure. Furthermore, the toxicity of SUC was found to increase after the different disinfection processes, with UV treatment inducing the greatest toxicity, followed by chloramine and chlorine disinfections. It is worth noting that the toxicity of UV disinfection was mainly manifested as DNA damage, whereas that of chloramine and chlorine disinfection processes was predominantly in terms of general damage.
Data Availability Statement
The original contributions presented in the study are included in the article/Supplementary Material; further inquiries can be directed to the corresponding author.
Author Contributions
YZ organized the database. DB wrote the first draft of the manuscript. HY, XgL, and DZ wrote sections of the manuscript. XC, HM, and XnL carried out relevant experiments and analysis. XZ was responsible for the conceptualization, project administration, and funding acquisition. All authors contributed to manuscript revision, and read and approved the submitted version.
Funding
The National Natural Science Foundation of China supports the test material (Grant numbers: 51738012, 51878555, and 52100104). The scientific research plan projects of the Department of Education, and Shanxi Province (19JS049) support the activities conducted by the authors.
Conflict of Interest
Author YZ is employed by Beijing Waterworks Group Co., Ltd.
The remaining authors declare that the research was conducted in the absence of any commercial or financial relationships that could be construed as a potential conflict of interest.
Publisher’s Note
All claims expressed in this article are solely those of the authors and do not necessarily represent those of their affiliated organizations, or those of the publisher, editors, and reviewers. Any product that may be evaluated in this article, or claim that may be made by its manufacturer, is not guaranteed or endorsed by the publisher.
Supplementary Material
The Supplementary Material for this article can be found online at: https://www.frontiersin.org/articles/10.3389/fenvs.2021.724685/full#supplementary-material
References
Ankley, G. T., Brooks, B. W., Huggett, D. B., and Sumpter, a. J. P. (2007). Repeating History: Pharmaceuticals in the Environment. Environ. Sci. Technol. 41 (24), 8211–8217. doi:10.1021/es072658j
Buerge, I. J., Buser, H.-R., Kahle, M., Müller, M. D., and Poiger, T. (2009). Ubiquitous Occurrence of the Artificial Sweetener Acesulfame in the Aquatic Environment: an Ideal Chemical Marker of Domestic Wastewater in Groundwater. Environ. Sci. Technol. 43 (12), 4381–4385. doi:10.1021/es900126x
Cantwell, M. G., Katz, D. R., Sullivan, J., and Kuhn, A. (2019). Evaluation of the Artificial Sweetener Sucralose as a Sanitary Wastewater Tracer in Narragansett Bay, Rhode Island, USA. Mar. Pollut. Bull. 146, 711–717. doi:10.1016/j.marpolbul.2019.07.036
Chen, S., Zhang, H., and Li, S. (2016). Investigation of Mechanism Involved in TiO2 and Photo-Fenton Photocatalytic Degradation of Emerging Contaminant Sucralose in Aqueous Media. Proced. Environ. Sci. 31, 753–757. doi:10.1016/j.proenv.2016.02.064
Du, Y., Wu, Q.-Y., Lu, Y., Hu, H.-Y., Yang, Y., Liu, R., et al. (2017). Increase of Cytotoxicity during Wastewater Chlorination: Impact Factors and Surrogates. J. Hazard. Mater. 324, 681–690. doi:10.1016/j.jhazmat.2016.11.042
Faber, M. S., Jetter, A., and Fuhr, U. (2005). Assessment of CYP1A2 Activity in Clinical Practice: Why, How, and when?. Basic Clin. Pharmacol. Toxicol. 97 (3), 125–134. doi:10.1111/j.1742-7843.2005.pto_973160.x
Fu, Y., Wu, G., Geng, J., Li, J., Li, S., and Ren, H. (2019). Kinetics and Modeling of Artificial Sweeteners Degradation in Wastewater by the UV/persulfate Process. Water Res. 150, 12–20. doi:10.1016/j.watres.2018.11.051
Gou, N. (2015). Developing of a Quantitative Toxicogenomics-Based Approach for Water Quality Monitoring and Toxicity Evaluation. Boston, United States: Northeastern University.
Gou, N., and Gu, A. Z. (2011). A New Transcriptional Effect Level index (TELI) for Toxicogenomics-Based Toxicity Assessment. Environ. Sci. Technol. 45 (12), 5410–5417. doi:10.1021/es200455p
Gou, N., Onnis-Hayden, A., and Gu, A. Z. (2010). Mechanistic Toxicity Assessment of Nanomaterials by Whole-Cell-Array Stress Genes Expression Analysis. Environ. Sci. Technol. 44 (15), 5964–5970. doi:10.1021/es100679f
Gou, N., Yuan, S., Lan, J., Gao, C., Alshawabkeh, A. N., and Gu, A. Z. (2014). A Quantitative Toxicogenomics Assay Reveals the Evolution and Nature of Toxicity during the Transformation of Environmental Pollutants. Environ. Sci. Technol. 48 (15), 8855–8863. doi:10.1021/es501222t
Hayes, C. J., and Dalton, T. M. (2015). Microfluidic Droplet-Based PCR Instrumentation for High-Throughput Gene Expression Profiling and Biomarker Discovery. Biomol. Detect. quantification 4, 22–32. doi:10.1016/j.bdq.2015.04.003
Heredia-García, G., Gómez-Oliván, L. M., Orozco-Hernández, J. M., Luja-Mondragón, M., Islas-Flores, H., SanJuan-Reyes, N., et al. (2019). Alterations to DNA, Apoptosis and Oxidative Damage Induced by Sucralose in Blood Cells of Cyprinus carpio. Sci. Total Environ. 692, 411–421. doi:10.1016/j.scitotenv.2019.07.165
Huggett, D. B., and Stoddard, K. I. (2011). Effects of the Artificial Sweetener Sucralose on Daphnia magna and Americamysis Bahia Survival, Growth and Reproduction. Food Chem. Toxicol. 49 (10), 2575–2579. doi:10.1016/j.fct.2011.06.073
Kadmi, Y., Favier, L., Lotfi, M., Nasrallah, N., and Wolbert, D. (2014a). A Highly Sensitive Liquid Chromatography-Tandem Mass Spectrometry Method for the Analysis of a Toxic Water Disinfection By-Product, N-Nitrosomethylethylamine. Anal. Methods 6 (10), 3231–3234. doi:10.1039/c4ay00146j
Kadmi, Y., Favier, L., Soutrel, I., Lemasle, M., and Wolbert, D. (2014b). Ultratrace-level Determination of N-Nitrosodimethylamine, N-Nitrosodiethylamine, and N-Nitrosomorpholine in Waters by Solid-phase Extraction Followed by Liquid Chromatography-Tandem Mass Spectrometry. Cent. Eur. J. Chem. 12 (9), 928–936. doi:10.2478/s11532-014-0537-z
Kille, J., Tesh, J., McAnulty, P., Ross, F., Willoughby, C., Bailey, G., et al. (2000). Sucralose: Assessment of Teratogenic Potential in the Rat and the Rabbit. Food Chem. Toxicol. 38, 43–52. doi:10.1016/s0278-6915(00)00027-2
Lan, J., Rahman, S. M., Gou, N., Jiang, T., Plewa, M. J., Alshawabkeh, A., et al. (2018). Genotoxicity Assessment of Drinking Water Disinfection Byproducts by Dna Damage and Repair Pathway Profiling Analysis. Environ. Sci. Technol. 52 (11), 6565–6575. doi:10.1021/acs.est.7b06389
Lange, F. T., Scheurer, M., and Brauch, H.-J. (2012). Artificial Sweeteners-A Recently Recognized Class of Emerging Environmental Contaminants: a Review. Anal. Bioanal. Chem. 403 (9), 2503–2518. doi:10.1007/s00216-012-5892-z
Liao, X., Liu, J., Yang, M., Ma, H., Yuan, B., and Huang, C.-H. (2015). Evaluation of Disinfection By-Product Formation Potential (DBPFP) during Chlorination of Two Algae Species - Blue-green Microcystis Aeruginosa and Diatom Cyclotella Meneghiniana. Sci. Total Environ. 532, 540–547. doi:10.1016/j.scitotenv.2015.06.038
Liu, C.-W., Chi, L., Tu, P., Xue, J., Ru, H., and Lu, K. (2019). Quantitative Proteomics Reveals Systematic Dysregulations of Liver Protein Metabolism in Sucralose-Treated Mice. J. Proteomics 196, 1–10. doi:10.1016/j.jprot.2019.01.011
Lombard, D. B., Chua, K. F., Mostoslavsky, R., Franco, S., Gostissa, M., and Alt, F. W. (2005). DNA Repair, Genome Stability, and Aging. Cell 120 (4), 497–512. doi:10.1016/j.cell.2005.01.028
Magnuson, B. A., Roberts, A., and Nestmann, E. R. (2017). Critical Review of the Current Literature on the Safety of Sucralose. Food Chem. Toxicol. 106, 324–355. doi:10.1016/j.fct.2017.05.047
Mitchell, H. (2008). Sweeteners and Sugar Alternatives in Food Technology. New Jersey, United States: John Wiley & Sons.
Muenter, M. M., Aiken, A., Akanji, J. O., Baig, S., Bellou, S., Carlson, A., et al. (2019). The Response of Escherichia coli to the Alkylating Agents Chloroacetaldehyde and Styrene Oxide. Mutat. Res. Genet. Toxicol. Environ. Mutagenesis. 840, 1–10. doi:10.1016/j.mrgentox.2019.02.001
O'Connor, S. T., Lan, J., North, M., Loguinov, A., Zhang, L., Smith, M. T., et al. (2012). Genome-Wide Functional and Stress Response Profiling Reveals Toxic Mechanism and Genes Required for Tolerance to Benzo[a]pyrene in S. cerevisiae. Front. Genet. 3, 316. doi:10.3389/fgene.2012.00316
Onnis-Hayden, A., Weng, H., He, M., Hansen, S., Ilyin, V., Lewis, K., et al. (2009). Prokaryotic Real-Time Gene Expression Profiling for Toxicity Assessment. Environ. Sci. Technol. 43 (12), 4574–4581. doi:10.1021/es803227z
Pepino, M. Y., Tiemann, C. D., Patterson, B. W., Wice, B. M., and Klein, S. (2013). Sucralose Affects Glycemic and Hormonal Responses to an Oral Glucose Load. Dia Care 36 (9), 2530–2535. doi:10.2337/dc12-2221
Richardson, S. D. (2009). Water Analysis: Emerging Contaminants and Current Issues. Anal. Chem. 81 (12), 4645–4677. doi:10.1021/ac9008012
Rodearmel, S. J., Wyatt, H. R., Stroebele, N., Smith, S. M., Ogden, L. G., and Hill, J. O. (2007). Small Changes in Dietary Sugar and Physical Activity as an Approach to Preventing Excessive Weight Gain: the America on the Move Family Study. Pediatrics 120 (4), e869–79. doi:10.1542/peds.2006-2927
Santos Filho, A. L. d., Freitas, H. V., Rodrigues, S., Abreu, V. K. G., Lemos, T. d. O., Gomes, W. F., et al. (2019). Production and Stability of Probiotic cocoa Juice with Sucralose as Sugar Substitute during Refrigerated Storage. LWT 99, 371–378. doi:10.1016/j.lwt.2018.10.007
Sharma, V. K., Oturan, M., and Kim, H. (2014). Oxidation of Artificial Sweetener Sucralose by Advanced Oxidation Processes: a Review. Environ. Sci. Pollut. Res. 21 (14), 8525–8533. doi:10.1007/s11356-014-2786-y
Subedi, B., Lee, S., Moon, H.-B., and Kannan, K. (2014). Emission of Artificial Sweeteners, Select Pharmaceuticals, and Personal Care Products through Sewage Sludge from Wastewater Treatment Plants in Korea. Environ. Int. 68, 33–40. doi:10.1016/j.envint.2014.03.006
Tran, N. H., Hu, J., and Ong, S. L. (2013). Simultaneous Determination of PPCPs, EDCs, and Artificial Sweeteners in Environmental Water Samples Using a Single-step SPE Coupled with HPLC-MS/MS and Isotope Dilution. Talanta 113, 82–92. doi:10.1016/j.talanta.2013.03.072
Wang, C., Moore, N., Bircher, K., Andrews, S., and Hofmann, R. (2019). Full-scale Comparison of UV/H2O2 and UV/Cl2 Advanced Oxidation: The Degradation of Micropollutant Surrogates and the Formation of Disinfection Byproducts. Water Res. 161, 448–458. doi:10.1016/j.watres.2019.06.033
Wu, M., Qian, Y., Boyd, J. M., Hrudey, S. E., Le, X. C., and Li, X.-F. (2014). Direct Large Volume Injection Ultra-high Performance Liquid Chromatography-Tandem Mass Spectrometry Determination of Artificial Sweeteners Sucralose and Acesulfame in Well Water. J. Chromatogr. A 1359, 156–161. doi:10.1016/j.chroma.2014.07.035
Wu, Q.-Y., Zhou, Y.-T., Li, W., Zhang, X., Du, Y., and Hu, H.-Y. (2019). Underestimated Risk from Ozonation of Wastewater Containing Bromide: Both Organic Byproducts and Bromate Contributed to the Toxicity Increase. Water Res. 162, 43–52. doi:10.1016/j.watres.2019.06.054
Xu, Y., Wu, Y., Zhang, W., Fan, X., Wang, Y., and Zhang, H. (2018). Performance of Artificial Sweetener Sucralose Mineralization via UV/O3 Process: Kinetics, Toxicity and Intermediates. Chem. Eng. J. 353, 626–634. doi:10.1016/j.cej.2018.07.090
Yang, Y., Liu, Z., Zheng, H., Zhu, S., Zhang, K., Li, X., et al. (2021). Sucralose, a Persistent Artificial Sweetener in the Urban Water Cycle: Insights into Occurrence, Chlorinated Byproducts Formation, and Human Exposure. J. Environ. Chem. Eng. 9 (4), 105293. doi:10.1016/j.jece.2021.105293
Yang, Y. Z., Peleato, N. M., Legge, R. L., and Andrews, R. C. (2019). Towards Real-Time Detection of Wastewater in Surface Waters Using Fluorescence Spectroscopy. J. Environ. Sci. 86, 195–202. doi:10.1016/j.jes.2019.06.002
Zaslaver, A., Bren, A., Ronen, M., Itzkovitz, S., Kikoin, I., Shavit, S., et al. (2006). A Comprehensive Library of Fluorescent Transcriptional Reporters for Escherichia coli. Nat. Methods 3 (8), 623–628. doi:10.1038/nmeth895
Zhang, Y., An, Y., Liu, C., Wang, Y., Song, Z., Li, Y., et al. (2019). Catalytic Ozonation of Emerging Pollutant and Reduction of Toxic By-Products in Secondary Effluent Matrix and Effluent Organic Matter Reaction Activity. Water Res. 166, 115026. doi:10.1016/j.watres.2019.115026
Keywords: sucralose, disinfection byproducts, E. coli whole-cell microarray assay, toxicogenomics, toxicity mechanism
Citation: Zhai Y, Bai D, Yang H, Li X, Zhu D, Cao X, Ma H, Li X and Zheng X (2021) Hazardous Effects of Sucralose and Its Disinfection Byproducts Identified From an E. coli Whole-Cell Array Analysis. Front. Environ. Sci. 9:724685. doi: 10.3389/fenvs.2021.724685
Received: 14 June 2021; Accepted: 06 August 2021;
Published: 20 October 2021.
Edited by:
Yongjun Zhang, Nanjing Tech University, ChinaCopyright © 2021 Zhai, Bai, Yang, Li, Zhu, Cao, Ma, Li and Zheng. This is an open-access article distributed under the terms of the Creative Commons Attribution License (CC BY). The use, distribution or reproduction in other forums is permitted, provided the original author(s) and the copyright owner(s) are credited and that the original publication in this journal is cited, in accordance with accepted academic practice. No use, distribution or reproduction is permitted which does not comply with these terms.
*Correspondence: Xing Zheng, zhengxingde@yahoo.de