 Mingyue Lu
 Yadong Zhang
 Zaiyang Ma
 Manzhu Yu
 Min Chen
 Jianqin Zheng6
- 1Collaborative Innovation Center on Forecast and Evaluation of Meteorological Disasters, Nanjing University of Information Science and Technology, Nanjing, China
- 2Key Laboratory of Virtual Geographic Environment (Ministry of Education of PRC), Nanjing Normal University, Nanjing, China
- 3State Key Laboratory Cultivation Base of Geographical Environment Evolution (Jiangsu Province), Nanjing, China
- 4Jiangsu Center for Collaborative Innovation in Geographical Information Resource Development and Application, Nanjing, China
- 5Department of Geography, The Pennsylvania State University, University Park, University Park, IL, United States
- 6Wenzhou Meteorological Bureau, Wenzhou, China
Lightning is an instantaneous, intense, and convective weather phenomenon that can produce great destructive power and easily cause serious economic losses and casualties. It always occurs in convective storms with small spatial scales and short life cycles. Weather radar is one of the best operational instruments that can monitor the detailed 3D structures of convective storms at high spatial and temporal resolutions. Thus, extracting the features related to lightning automatically from 3D weather radar data to identify lightning strike locations would significantly benefit future lightning predictions. This article makes a bold attempt to apply three-dimensional radar data to identify lightning strike locations, thereby laying the foundation for the subsequent accurate and real-time prediction of lightning locations. First, that issue is transformed into a binary classification problem. Then, a suitable dataset for the recognition of lightning strike locations based on 3D radar data is constructed for system training and evaluation purposes. Furthermore, the machine learning methods of a convolutional neural network, logistic regression, a random forest, and k-nearest neighbors are employed to carry out experiments. The results show that the convolutional neural network has the best performance in identifying lightning strike locations. This technique is followed by the random forest and k-nearest neighbors, and the logistic regression produces the worst manifestation.
Instruction
Lightning is a spark of electricity in the atmosphere between clouds, the air, or the ground (Maggio et al., 2009). Its high voltage, high temperature, and other physical effects can produce great destructive power in an instant, which is prone to damaging the personal safety of ground personnel. In particular, lightning can easily cause damage to commercial buildings, electrical equipment, homes. Due to the rapid economic development and the massive increase in the amount of electrical equipment, lightning disasters have become one of the ten most serious natural disasters announced by the International Decade for Natural Disaster Reduction (NOAA National Severe Storms Laboratory, 2021). Moreover, lightning is a small-scale strong convective weather phenomenon, which makes it difficult to predict accurately. Since lightning always occurs in convective storms with small spatial scales and short life cycles, weather radar is one of the best operational instruments that can monitor the detailed 3D (Three dimensional) structures of such storms at high spatial and temporal resolutions. Thus, extracting the features related to lightning automatically from 3D weather radar data to identify lightning strike locations would significantly benefit future lightning predictions.
The current research on lightning can be roughly divided into two categories: numerical analysis and statistical methods. Numerical analysis is a mesoscale numerical weather prediction system that mainly uses the Weather Research and Forecasting (WRF) Model and other models to simulate strong convection processes and discusses the influence of different physical parameterization schemes on the simulation effect (NCAR Mesoscale & Microscale Meteorology Laboratory, 2021). Barthe et al. (2010) estimated total lightning by the WRF model according to the correlation between the flash speed and the available model parameters (e.g., ice water path, ice mass flux product). Zepka et al. (2014) used the WRF model to study potential lightning locations based on the probability of lightning occurrence within the location of interest. Giannaros et al. (2016) used lightning to improve convective representations by controlling the triggers of model convection parameterization schemes on the basis of WRF-LTNGDA. Gharaylou et al. (2020) used the WRF-ELEC model to predict the impact of initial conditions on lightning activity. However, the coarse temporal and spatial resolutions used in numerical analysis method limit their utility in accurate lightning strike location recognition tasks.
Statistical methods are usually applied to study lightning based on prior knowledge. Combining the density-based spatial clustering of applications with noise (DBSCAN) algorithm and the kernel density algorithm, Chen et al. (2017) eliminated insignificant locations with rare lightning strikes. The National Oceanic and Atmospheric Administration (NOAA) and the Cooperative Institute for Meteorological Satellite Studies (CIMSS) developed the empirical probability of severe (ProbSevere) model in 2018. It extracts information related to thunderstorm development from several data sources automatically to produce timely, short-term, statistical forecasts of thunderstorm intensity (Cintineo et al., 2018). Wang et al. (2019) established a probabilistic warning model for strong convective weather, such as hail and lightning, by multiple logistic linear regression. Zhang et al. (2020) presented a density-based convective storm identification method for weather radar data. North et al. (2020) used the heat equation to define a redistribution kernel, and a simple linear advection scheme was shown to work well in a lightning prediction example. Yücelbaş et al. (2021) used effective meteorological parameters to pre-estimate distance-based lightning. Mostajabi et al. (2019) used machine learning techniques to successfully hindcast nearby and distant lightning hazards by looking at single-site observations of meteorological parameters. Karami et al. (2020) presented a machine learning-based method to locate lightning flashes using calculations of lightning-induced voltages on a transmission line. Zhu et al. (2021) presented a machine-learning approach (support vector machines) to classify cloud-to-ground and intracloud lightning. Nevertheless, these methods use a limited number of data factors to analyze the relationships with lightning strike locations, and the recognition effects are often unsatisfactory.
Weather radar is one of the most effective instruments for monitoring the occurrence of lightning. It can be used to indirectly identify the electrification process within a developing thunderstorm because grapples and hail particles return large reflectivity echoes (Wei and Hsieh, 2020). As highly reliable data in the field of meteorological detection, radar data have been widely considered by meteorologists, and many explorations and practices have been carried out. Lu et al. (2017) presented a spatial lattice model based on sampling particles that was proposed to support both the representation and analysis of meteorological information. A 3D modeling strategy was used for weather radar data analysis (Lu et al., 2018). Based on the data of nine weather radar slices at different elevations, Wang et al. (2018) used a convolutional neural network model to identify the spatial structures of three-dimensional abnormal clouds when hail lands. Jiang et al. (2019) utilized multisource convolutional neural networks to extract the features of various weather-related data obtained from Doppler radar to identify thunderstorms and gales. Ling et al. (2020) proposed a new method based on stacked autoencoders to identify abnormal weather radar echo images. Li et al. (2020a) built a dataset from weather radar echo images using different depth models, such as a simple convolutional neural network (CNN), a recurrent neural network (S-RCNN), and a spatiotemporal recurrent convolutional neural network (ST-RCNN). The recognition performances of the learning models on thunderstorms and gales were compared. Zhou et al. (2020) proposed a new semantic segmentation-based deep learning network for cloud-to-ground lightning nowcasting named LightningNet. This model conducts reliable lightning nowcasting by using multisource data.
As mentioned above, the current related experiments are largely based on two-dimensional projection radar data or regenerated product radar data. In fact, when weather radar equipment is working, it scans in the surrounding three-dimensional space, and the obtained radar data have obvious three-dimensional characteristics. These studies ignore the potential three-dimensional characteristics in radar data. It is difficult to restore the real three-dimensional spatial data scene around a target, which has caused relevant research to have certain deficiencies. Machine learning can extract hidden feature information from multidimensional data, and the recognition of lightning strike locations based on three-dimensional radar detection data has become possible.
In this article, we first transform the problem of identifying lightning strike locations into a classification problem. Then, a sliding window is used to construct a lightning feature dataset based on three-dimensional weather radar data and lightning location data. Furthermore, logistic regression, a random forest, k-nearest neighbors, and a convolutional neural network are employed to identify lightning strike locations. The contribution of this paper is a first attempt to apply deep learning methods to the identification of lightning strike locations based on 3D radar data, thereby laying the foundation for subsequent accurate and real-time lightning location predictions. This work is expected to provide a new method for mitigating and preventing meteorological and lightning disasters.
The rest of this paper is organized as follows. In Data, we introduce the utilized data and the study area. In Methodology, we provide the details of establishing the dataset based on lightning location data and three-dimensional weather radar data and briefly introduce the classification algorithms used, including logistic regression, a random forest, k-nearest neighbors and a convolutional neural network. In Experiments, we present the experimental setup and results. Finally, we conclude and discuss future research directions in. Conclusions and suggestions for future work.
Data
Data and Preprocessing
Lightning location data and three-dimensional weather radar data are provided by the Ningbo Meteorological Bureau. Lightning location data is obtained by the ADTD (Advanced TOA and Direction system) lightning location systems, and ADTD is ground-based advanced time of arrival and direction systems cloud-to-ground lightning detection sensors. At present, the system in the meteorological department has been widely used in China. Its detection efficiency is between 80 and 90%, and the error is generally several hundred meters to several kilometers. The single station detection radius of the lightning positioning system is approximately 300 km (Shi, 2016; Xu and Zhou, 2017). The lightning data contain fields denoting the time, location (latitude and longitude), polarity effect, peak intensity, steepness, and other information of the ground flash return process, providing great help when studying lightning activity. In this article, lightning data with intensities less than 10 KA are removed, and those whose corresponding radar combined reflectance (CR) grid values are less than 10 DBZ are also eliminated to ensure data accuracy. After preprocessing, the lightning location data are used as the ground truth. There is a clear correlation between the occurrence of lightning and radar echoes top heights and echo intensity (Michimoto, 1991; Futyan and Del Genio, 2007). At the same time, weather radar data is considered to be reliable detection data in the meteorological field. Some scholars have used radar data to predict lightning data. Therefore, we used radar echo data to identify lightning, hoping to provide preliminary research for lightning prediction based on radar data.
The weather radar data used in this paper are scanned and generated by the S-band Doppler weather radar system. Doppler weather radar has a high temporal-spatial resolution (1 km/6 min). It provides information about the positions and intensities of precipitation particles and particle motion information. Therefore, it is an effective tool for monitoring microscale and mesoscale convective systems and plays an essential role in detecting severe weather. Weather radars perform a 3D scan of the atmosphere. A radar system scans a full volume every 5–6 min. It scans starting from the lowest elevation angle and then increases the scanning angle gradually. Finally, it provides data at nine elevation angles according to a certain scanning strategy. Each elevation scan forms a cone with an output of 2D raster data of the same size, and all 2D raster data created at different elevation angles constitute 3D raster data with a strict vertical alignment (Han et al., 2019). In this article, 3D weather radar data are used as input data to identify lighting strike locations.
Study Area
Ningbo is a sub-provincial city in northeastern Zhejiang Province, People’s Republic of China, as shown in Figure 1. The spatial extent is (28° 51' - 30° 33′ N; 120° 55' - 122° 16′ E). It is bounded on the east by the East China Sea and the Zhoushan Archipelago, on the north by Hangzhou Bay (across which it faces Jiaxing and Shanghai), on the west by Shaoxing, and on the south by Taizhou. Thunderstorms frequently occur in Ningbo, and the direct economic losses caused by lightning strikes are as high as millions of yuan each year. Therefore, Ningbo is selected as the study area in this article.
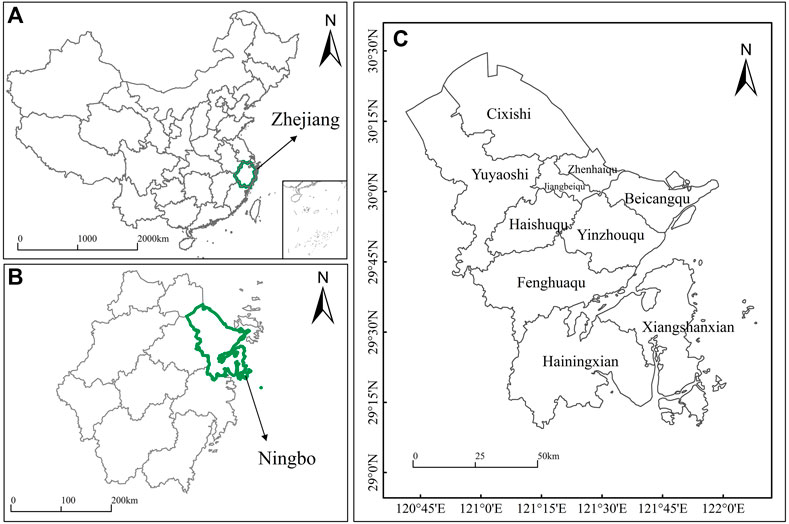
FIGURE 1. Geographical locations of Ningbo.
Methodology
Establishing the Dataset
First, the lightning data and radar data should be matched spatially and temporally. A full radar scan generates one complete set of radar volume data, consuming approximately 5–6 min. Thus, for a specific complete radar volume dataset, the lightning data that occur during the period of the radar data scan are selected, and those beyond the spatial extent of the specific radar data are removed to ensure spatial consistency. Then, the final selected lightning data and the specific radar data form one group in which the lightning data and the radar data are well matched spatially and temporally. Therefore, the dataset in this article is constructed based on groups by the sliding window strategy. First, based on the radar reflectivity raster data, a sliding window with a size of M ×N (M is the size of the row, N is the size of the column) is set up to obtain the feature samples. Each feature sample contains nine layers of radar reflectivity raster data within the sliding window (with a size of M×N). Second, if one or more lightning data points are located on the center grid of the sliding window, the sample in this sliding window is labeled 1 (with lightning). Otherwise, the corresponding sample is labeled 0 (without lightning). Figure 2 illustrates the extraction of feature data with lightning (samples labeled 1). After the traversal of the sliding window, a dataset with labels of 1 or 0 is established.
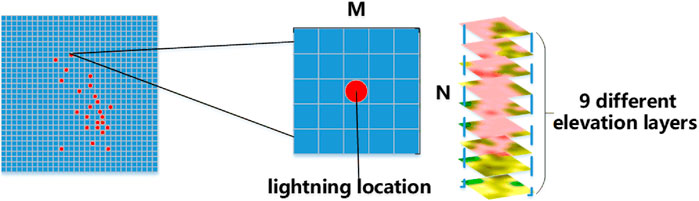
FIGURE 2. Extraction of feature data with lightning.
We collect 30,447 samples labeled 1 and 493,557 samples labeled 0 for a total of 524,004 samples from July to September. These data are processed and packaged to build a 3D spatial dataset. We divide into training sets and test sets, and were randomly scrambled during the training. The test subset contained samples for the second half of September 2018 (104,800 samples), whereas the training set included the remaining samples.
During the training period, the extracted feature data (samples labeled 1 or 0) are fed into various classification algorithms to train a two-class classification model. Furthermore, the trained model is applied to identify the new samples. If the output of the classification result is 1, it proves that there is lightning in the sample. If the output is 0, there is no lightning in the sample. Figure 3 shows an overview of the solution used in this paper. It should be noted that this M×N sliding window can be set according to the specific application. For example, in this article, we set this sliding window size to 5 × 5 (5 columns and five rows).
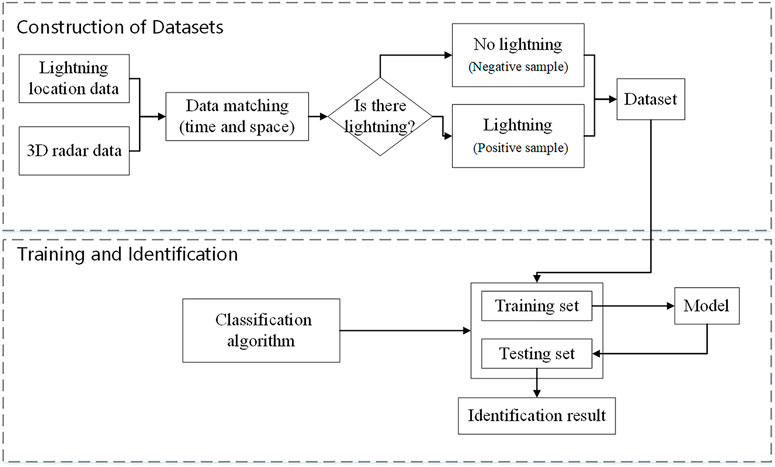
FIGURE 3. Flowchart of the lightning identification solution used in this article.
Classification Algorithms
The identification of lightning strike locations by weather radar data is regarded as a classification problem. We utilize some frequently-used binary classification algorithms, namely, logistic regression (LR) (Wright, 1995; Kleinbaum et al., 2002), K-nearest neighbors (KNN) (Dudani, 1976; Kramer, 2013), a random forest (RF) (Liaw and Wiener, 2002; Pal, 2005) and a convolutional neural network (CNN) (Wang, et al., 2019; Sothe et al., 2020), to conduct our experiments based on the dataset constructed in the previous section. The following is a brief introduction of these approaches.
Logistic regression (LR): LR is essentially a classification method (Cheng et al., 2006). To solve a classification problem, the model is trained according to some known training sets, and then the classes of the new data are predicted. The goal of LR is to find a decision boundary with a sufficient degree of discrimination so that the two categories can be well separated. In this paper, the parameters we used in LR are set as follows, penalty is L2 regularization, Inverse of regularization strength is 1, the maximum number of iterations for the solver to converge is 500, and a binary problem fits for each label.
K-nearest neighbors (KNN): KNN is a classification algorithm (Liu et al., 2019). To determine the category of an unknown sample, KNN uses all the samples of the known categories as references and calculates the distances between the unknown sample and all the known samples. The K known samples that are closest to the unknown sample are selected. According to the majority-voting rule, the unknown sample and the K-nearest samples are classified into one category. The parameters of KNN are we set to: the number of neighbors is 9, leaf size is 5, the number of parallel jobs to run for neighbors search is 1.
Random forest (RF): RFs are commonly used in regression and classification, as they improve the prediction accuracy of the resulting model without significantly increasing the amount of required calculations (Gao et al., 2019; Li et al., 2020b). An RF is not sensitive to multivariate common linearity, the results are relatively robust to missing data and unbalanced data, and it can effectively predict the effects of up to thousands of explanatory variables. The parameters of the RF in this article are we set as: the number of trees in the forest is 100, the maximum depth of the tree is 5, random_state is the seed used by the random number generator set to 2.
Convolutional neural network (CNN): A CNN is a type of feedforward neural network that includes convolution calculations and has a deep structure (Lei et al., 2019; Wan et al., 2019). In deep learning, CNNs have achieved great success in image classification. CNNs possess the ability to characterize learning; they can classify input information according to its hierarchical structure and identify similar features at different locations in space. In this paper, the CNN structure contains three parts: an input layer, a hidden layer, and an output layer. The input layer can handle multidimensional data. We put the training dataset into the input layer. The hidden layer is the core of the CNN, including the convolutional layer, pooling layer and fully connected layer. For classification problems, the output layer returns the probability that the input image belongs to a certain category. For us, the output of the output layer is the probability of a lightning strike location.
Figure 4 shows the overall CNN architecture used in this article. The CNN has seven layers, two convolutional layers and two pooling layers that appear alternately. There are three fully connected (FC) layers connected to the last feature map. Finally, the fully connected layers output the final classification results. The size of the dataset input into the CNN is 9 × 5×5, and the filter size is set to 9 × 1×1 (here, nine refers to the weather radar data at nine different heights). 9 × 5×5 in the first layer means that this layer has nine different elevation radars and that each level has a size of 5 × 5.9 × 4×4 in the second layer means that the feature map generated after sample pooling has a size of 9 × 4×4. Other layers are similar ultimately fully connected layer (FC) output results. We use the cross-entropy loss as the objective function for training the CNN. For optimization, the Adam optimizer is leveraged to train the network, the batch size is 64, and the number of epochs is set to 100. The learning rate is 0.001. Note that different from conventional machine learning approaches, CNNs can be directly applied to radar images without needing the handcrafted features above.
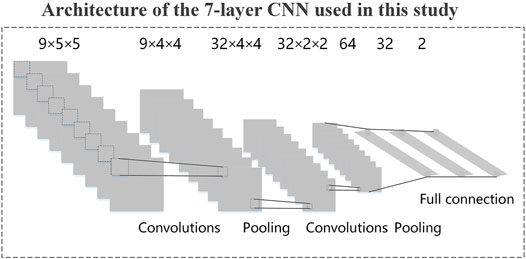
FIGURE 4. Architecture of the CNN used in this study.
Experiments
Experimental Setup
In this paper, we conduct comparative experiments with the dataset generated in Methodology. For these classification methods, the training set is employed for model training, and the test set is used to verify the lightning classification results. In brief, the purpose is to explore the classification outcomes, which are regarded as the identification results of the lightning strike locations.
In addition, all classification algorithms utilized in this article are executed in the python37 environment. These machine learning methods (LR, the RF and KNN) are developed using the scikit-learn (sklearn) library. Sklearn is a simple and efficient tool for predictive data analysis. PyTorch’s is used to efficiently implement the CNN approach. The CNN uses a GPU to accelerate the computation process. Moreover, the hardware environment contains a Core i7-9500 (2.6 GHz) CPU and a GeForce GTX 1065 GPU.
Performance Criteria
A confusion matrix can be used to assess the accuracy of binary classification results (Stehman, 1997). The confusion matrix shown in Table 1 is used. In Table 1, Tp and TN represent the numbers of true positive and true negative cases, respectively, while FP and FN denote the numbers of false positive and false negative cases, respectively (Pakdaman et al., 2020). In Table 1, ‘‘strike’’ and ‘‘nonstrike’’ indicate the lightning strike and non-lightning-strike events, respectively.

TABLE 1. Confusion matrix.
Based on Table 1, to evaluate the performance of the proposed algorithms, seven conventional criteria are considered: precision, false positive rate (FPR), recall, accuracy, F-measure, area under the curve (AUC), and precision-recall (P-R) (Pakdaman et al., 2020; Luque et al., 2019; Sofaer et al., 2019). Precision is intuitively the ability of a classifier to not label a negative sample as positive and can be calculated by:
False positive rate (FPR): The proportion of real negative examples predicted to be positive can be calculated by:
Recall is the ability of the classifier to find all the positive samples and can be calculated by:
Accuracy is the proportion of the correct predictions to the total number of predictions:
The F-measure can be interpreted as a weighted average of the precision and recall, where the best F-measure is 1 and at the worst is 0. The relative contributions of precision and recall to the F-measure are equal. The formula for the F-measure is:
The area under the receiver operating characteristic curve (ROC AUC) is defined as the area enclosed by the coordinate axes under the ROC curve (Luque et al., 2019). The value of this area cannot be greater than 1. The value range of the AUC is between 0.5 and 1. The closer the AUC is to 1.0, the higher the authenticity of the detection method; when it is equal to 0.5, the authenticity is lowest, and the method has no application value.
Precision-recall (P-R) is a useful measure of prediction success when the classes are very imbalanced (Sofaer et al., 2019; Saito and Rehmsmeier, 2015). When the number of positive samples is seriously less than the number of negative samples, the P-R curve can more intuitively express the differences between models than other metrics, which is more appropriate. Since the collected dataset contains unbalanced data, P-R is required. In this paper, we use the area under the P-R curve to express the P-R curve.
Results Analysis
We conduct experiments using the constructed dataset to compare the performance of the four models, namely, LR, KNN, RF, and a CNN. The precision, false positive rate (FPR), recall, accuracy, F-measure, area under the curve (AUC), and precision recall (P-R) values of the test samples produced by the three models are recorded as the final results. For these indicators, smaller FPRs are better, and the larger the other metrics are, the better they are.
Table 2 shows that the model with the best performance in term of recognizing the lightning strike locations is the CNN, followed by the RF and KNN, and LR has the worst performance. The CNN has the best precision, recall, accuracy, and F-measure, and it has the lowest FPR at 0.158. More importantly, the AUC and P-R performance of the CNN is far superior to that of other models. P-R is an important model identification indicator. The area under the PR curve yielded by the CNN is 0.534, which is 0.059 higher than those of the other best-performing models. This shows that CNN can not only better obtain the hidden data features among the multilayer radar data but also has better model ability and can adapt to complex multidimensional data. Notably, the RF performs best aside from the CNN. Its P-R and other criteria (except Recall and AUC) are the best among the three machine learning methods, indicating that the RF is also an effective algorithm and has a certain effect on identifying lightning strikes. Among all the methods, LR performs worst. Not only are its AUC and P-R the worst, but its FPR is the highest among those of all the models, which shows that LR has difficulty dealing with the identification of lightning strike locations.

TABLE 2. The results are shown in different models.
In addition, all models have high accuracy, but the PR values of the LR model, DT model, and KNN model do not perform well. This means that when identifying lightning strikes, accuracy alone cannot measure the true accuracy of the given model. This may be due to the imbalance between positive and negative samples in the created dataset. It is undeniable that the CNN model has the best recognition effect, and we use it for a subsequent case analysis.
Case Study 1–September 20, 2018
To verify the CNN model, we apply the model in a real environment. Under the influence of convective cloud clusters, intense lightning activities occurred in Ningbo in northeastern Zhejiang Province of China on September 20, 2018. The China Meteorological Administration (CMA) Public Meteorological Service Centre issued a lightning warning. Therefore, the weather radar data obtained from Ningbo at 10:54 (Universal Time) on that day are selected for use.
Lightning is not particularly stable and normally drifts. The deviation of the thunderstorm center is less than 5%, and the accuracy of the identification location is within the acceptable (Huang et al., 2019). In order to better quantify and evaluate the recognition results of the model, we believe that the identified lightning strike location within 1 km around the lightning strike location is also effective.
Figure 5 shows the observed lightning strike position and the result identified by the CNN model. The upper part of the figure is the distribution of the observed lightning strike position, and the lower part is the result of the CNN model identification. The average probability of correct hit, miss identified, false identified for this case amounted to 0.763, 0.235, 0.237. It can be seen that the CNN can identify the approximate locations of lightning, and the model has a good recognition effect with respect to concentrated lightning, which proves that it is feasible to use a CNN combined with radar data in a real environment to identify lightning. However, the disadvantage is that the range of lightning strike locations identified by the CNN is larger than the actual landing area. These situations may be due to the fact that the model training samples are not sufficient or that some lightning cannot be detected by lightning positioning equipment. It is also possible that we have overlooked certain parameters that have important impacts on lightning recognition. Furthermore, another shortcoming is that the CNN model is not ideal for the recognition of discrete lightning location data. Some scattered lightning bolts are not recognized.
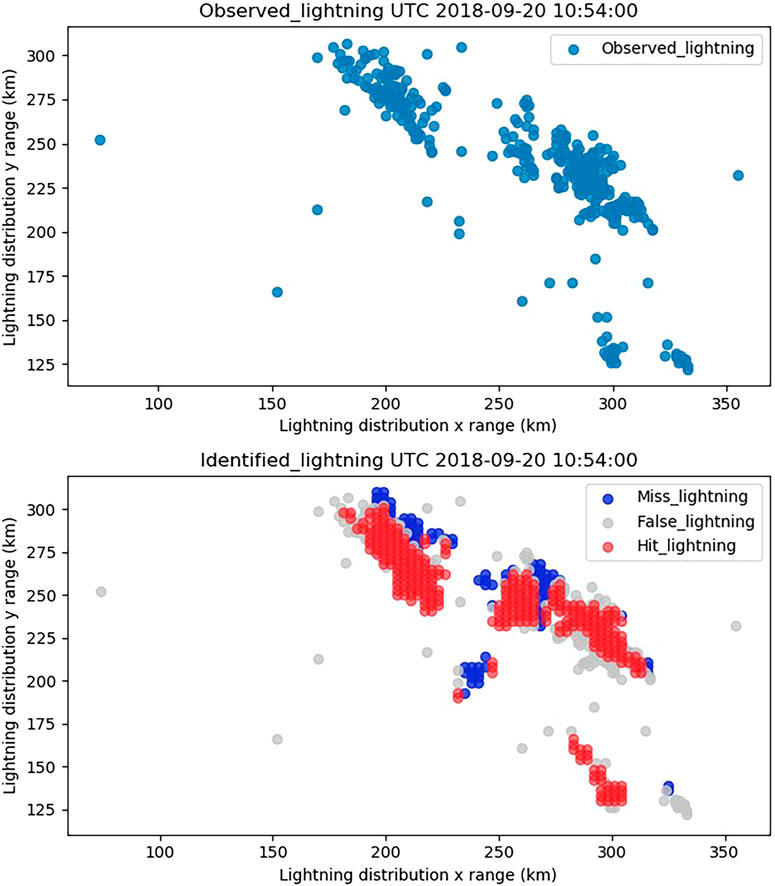
FIGURE 5. Lightning locations observed and identified by the CNN model on September 20, 2018 (In upper, the blue dot represents the observed lightning. In lower, the dark blue dot (Miss_lightning) is miss identified lightning, the gray dot (False_lightning) represents the falsely reported lightning, and the red dot represents the correctly identified lightning.).
Case Study 2–September 21, 2018
On August 23, 2018, a few thunderstorms occurred in south ningbo. We chose the radar data at 06:48 UTC that day for the examination. Figure 6 shows Lightning locations observed and identified by the CNN model. Figure 6A shows the observed lightning strike locations. and Figure 6B shows the results of lightning strikes identified by the CNN. The average probability of correct hit, miss identified, false identified for this case amounted to 0.725, 0.271, 0.275. In this case, the CNN model also can identify the approximate location of the lightning strike locations, but the identification results of the discretely distributed lightning points are poor and cannot be prepared for identification. Nevertheless, it is possible to use the CNN model to identify lightning strike locations.

FIGURE 6. Lightning locations observed and identified by the CNN model on September 21, 2018 (In Figure 6A, the blue dot represents the observed lightning. In Figure 6B, the dark blue dot (Miss_lightning) is miss identified lightning, the gray dot (False_lightning) represents the falsely reported lightning, and the red dot represents the correctly identified lightning).
Conclusions and Suggestions for Future Work
In this article, we convert the problem of identifying lightning strike locations into a binary classification problem, and a sliding window strategy is utilized to construct a dataset suitable for the identification of lightning strike locations based on 3D weather radar data. Then, based on the constructed dataset, four common classification algorithms (LR, an RF, KNN and a CNN) are applied to explore the identification of lightning strike locations. The results show that the CNN has the best performance in terms of the identification of lightning strike locations. Its precision is 0.842, the recall is 0.604, the accuracy is 0.967, the FPR is 0.158, and the area under the P-R curve is also outstanding at 0.534. The CNN is followed by the RF and KNN, LR has the worst performance. This proves that a deep learning method can conduct autonomous learning of spatial feature data with the support of a large amount of multidimensional data and can obtain more hidden data information relationships than other approaches. Lightning strike location recognition based on three-dimensional radar detection data is efficient and can be used to a certain extent. However, because the occurrence of lightning is a relatively low-probability event, it is difficult to identify with weather radar data. The essence of this situation is an imbalanced classification problem. When constructing the dataset, we lack the consideration of a balanced sampling design, which to a certain extent causes the problem of too large a lightning strike location to being identified by the CNN model. In the future, the impact of unbalanced samples on the identification of lightning strike locations will be considered. In addition, with the rapid development of deep learning, an increasing number of methods and technologies can be applied to the recognition of lightning strikes. Other modeling methods may be able to obtain better results with respect to the recognition of lightning strikes. We need to evaluate these numerous methods in the future. We hope to obtain a more accurate method for identifying lightning strike locations and reduce the false positive rate of lightning detection to provide certain decision-making support for disaster prevention and mitigation.
Data Availability Statement
Publicly available datasets were analyzed in this study. This data can be found here: https://github.com/zyd530/Data.
Author Contributions
Conceptualization and design of study, ML, YZ, and MC; Data Collection, ML and JZ; Data analysis and interpretation, ML, YZ, MY, ZM, and MW; Writing and preparation of original draft, ML, YZ, MY, and ZM; Funding acquisition, ML and MC. All authors contributed to article revision, read and approved the submitted version.
Funding
The NSCF Project (41871285).
Conflict of Interest
The authors declare that the research was conducted in the absence of any commercial or financial relationships that could be construed as a potential conflict of interest.
Publisher’s Note
All claims expressed in this article are solely those of the authors and do not necessarily represent those of their affiliated organizations, or those of the publisher, the editors and the reviewers. Any product that may be evaluated in this article, or claim that may be made by its manufacturer, is not guaranteed or endorsed by the publisher.
Acknowledgments
Many thanks to reviewers for their valuable comments. This paper was supported by the NSCF Project (41871285).
References
Barthe, C., Deierling, W., and Barth, M. C. (2010). Estimation of Total Lightning from Various Storm Parameters: A Cloud-Resolving Model Study. J. Geophys. Res. Atmos. 115 (D24). doi:10.1029/2010jd014405
Chen, J. P., Tan, B., and Lian, S. Z. (2017). Data Mining for Correlation Rules of Lightning in Hubei Province. J. Appl. Sci. 35 (1), 42–50. doi:10.3969/j.issn.0255-8297.2017.01.005
Cheng, Q., Varshney, P. K., and Arora, M. K. (2006). Logistic Regression for Feature Selection and Soft Classification of Remote Sensing Data. IEEE Geosci. Remote Sensing Lett. 3 (4), 491–494. doi:10.1109/lgrs.2006.877949
Cintineo, J. L., Pavolonis, M. J., Sieglaff, J. M., Lindsey, D. T., Cronce, L., Gerth, J., et al. (2018). The NOAA/CIMSS ProbSevere Model: Incorporation of Total Lightning and Validation. Weather Forecast. 33 (1), 331–345. doi:10.1175/waf-d-17-0099.1
Dudani, S. A. (1976). The Distance-Weighted K-Nearest-Neighbor Rule. IEEE Trans. Syst. Man. Cybern. SMC-6 (4), 325–327. doi:10.1109/tsmc.1976.5408784
Futyan, J. M., and Del Genio, A. D. (2007). Relationships between Lightning and Properties of Convective Cloud Clusters. Geophys. Res. Lett. 34 (15), L15705. doi:10.1029/2007gl030227
Gao, S., Li, M., Liang, Y., Marks, J., Kang, Y., and Li, M. (2019). Predicting the Spatiotemporal Legality of On-Street Parking Using Open Data and Machine Learning. Ann. GIS 25 (4), 299–312. doi:10.1080/19475683.2019.1679882
Gharaylou, M., Farahani, M. M., Mahmoudian, A., and Hosseini, M. (2020). Prediction of Lightning Activity Using WRF-ELEC Model: Impact of Initial and Boundary Conditions. J. Atmos. Solar-Terrestrial Phys. 210, 105438. doi:10.1016/j.jastp.2020.105438
Giannaros, T. M., Kotroni, V., and Lagouvardos, K. (2016). WRF-LTNGDA: A Lightning Data Assimilation Technique Implemented in the WRF Model for Improving Precipitation Forecasts. Environ. Model. Softw. 76, 54–68. doi:10.1016/j.envsoft.2015.11.017
Han, L., Sun, J., and Zhang, W. (2019). Convolutional Neural Network for Convective Storm Nowcasting Using 3-D Doppler Weather Radar Data. IEEE Trans. Geosci. Remote Sensing 58 (2), 1487–1495. doi:10.1109/TGRS.2019.2948070
Huang, L., Sheng, S. U., Yang, X., Jun, H. U., and Liu, Z. (2019). Forecasting of Lightning Trending Improved Density-Based Lls. Insulators and Surge Arresters (01), 76–83. doi:10.16188/j.isa.1003-8337.2019.01.013
Jiang, Y., Yao, J., and Qian, Z. (2019). A Method of Forecasting Thunderstorms and Gale Weather Based on Multisource Convolution Neural Network. IEEE Access 7, 107695–107698. doi:10.1109/access.2019.2932027
Karami, H., Mostajabi, A., Azadifar, M., Rubinstein, M., Zhuang, C., and Rachidi, F. (2020). Machine Learning-Based Lightning Localization Algorithm Using Lightning-Induced Voltages on Transmission Lines. IEEE Trans. Electromagn. Compat. 62 (6), 2512–2519. doi:10.1109/temc.2020.2978429
Kleinbaum, D. G., Dietz, K., Gail, M., Klein, M., and Klein, M. (2002). Logistic Regression. New York: Springer-Verlag.
Kramer, O. (2013). “K-nearest Neighbors”. in Dimensionality Reduction with Unsupervised Nearest Neighbors. Berlin: Heidelberg Springer, 13–23. doi:10.1007/978-3-642-38652-7_2
Lei, B., Yang, L., and Xu, Z. (2019). “Using Convolutional Neural Network to Classify Convective Cloud on Radar Echoes.” in ICMO 2019: International Conference on Meteorology Observations; December 2019. Chengdu: IEEE, 1–3.
Li, X., Yang, C., Huang, W., Tang, J., Tian, Y., and Zhang, Q. (2020a). Identification of Cotton Root Rot by Multifeature Selection from Sentinel 2 Images Using Random Forest. Remote Sensing 12 (21), 3504. doi:10.3390/rs12213504
Li, Y., Li, H., Li, X., Li, X., and Xie, P. (2020b). On Deep Learning Models for Detection of Thunderstorm Gale. J. Internet Tech. 21 (4), 909–917. doi:10.3966/160792642020072104001
Liaw, A., and Wiener, M. (2002). Classification and Regression by random Forest. R. News 2 (3), 18–22.
Liu, P., Du, J. Z., Lyu, W. G., and Dou, M. W. (2019). A Modified KNN Classifier for Unbalanced Dataset (In Chinese). J. Northeast. Univ. (Natural Science) 40 (7), 932. doi:10.12068/j.issn.1005-3026.2019.07.004
Lu, M., Chen, M., Wang, X., Min, J., and Liu, A. (2017). A Spatial Lattice Model Applied for Meteorological Visualization and Analysis. Ijgi 6 (3), 77. doi:10.3390/ijgi6030077
Lu, M., Chen, M., Wang, X., Yu, M., Jiang, Y., and Yang, C. (2018). 3D Modelling Strategy for Weather Radar Data Analysis. Environ. Earth Sci. 77 (24), 1–10. doi:10.1007/s12665-018-7985-2
Luque, A., Carrasco, A., Martín, A., and de las Heras, A. (2019). The Impact of Class Imbalance in Classification Performance Metrics Based on the Binary Confusion Matrix. Pattern Recognition 91, 216–231. doi:10.1016/j.patcog.2019.02.023
Maggio, C. R., Marshall, T. C., and Stolzenburg, M. (2009). Estimations of Charge Transferred and Energy Released by Lightning Flashes. J. Geophys. Res. Atmos. 114 (D14). doi:10.1029/2008jd011506
Michimoto, K. (1991). A Study of Radar Echoes and Their Relation to Lightning Discharge of Thunderclouds in the Hokuriku District. J. Meteorol. Soc. Jpn. 69 (3), 327–336. doi:10.2151/jmsj1965.69.3_327
Mostajabi, A., Finney, D. L., Rubinstein, M., and Rachidi, F. (2019). Nowcasting Lightning Occurrence from Commonly Available Meteorological Parameters Using Machine Learning Techniques. Npj Clim. Atmos. Sci. 2 (1), 1–15. doi:10.1038/s41612-019-0098-0
NCAR Mesoscale and Microscale Meteorology Laboratory (2021). WRF User Support & Contributor Information. Available at: https://www.mmm.ucar.edu/wrf-user-support-contributor-information (Accessed April 5, 2021).
NOAA National Severe Storms Laboratory (2021). SEVERE WEATHER 101 - Lightning Basics. Available at: https://www.nssl.noaa.gov/education/svrwx101/lightning/ (Accessed April 1, 2021).
North, J., Stanley, Z., Kleiber, W., Deierling, W., Gilleland, E., and Steiner, M. (2020). A Statistical Approach to Fast Nowcasting of Lightning Potential fields. Adv. Stat. Clim. Meteorol. Oceanogr. 6 (2), 79–90. doi:10.5194/ascmo-6-79-2020
Pakdaman, M., Naghab, S. S., Khazanedari, L., Malbousi, S., and Falamarzi, Y. (2020). Lightning Prediction Using an Ensemble Learning Approach for Northeast of Iran. J. Atmos. Solar-Terrestrial Phys. 209, 105417. doi:10.1016/j.jastp.2020.105417
Pal, M. (2005). Random forest Classifier for Remote Sensing Classification. Int. J. remote sensing 26 (1), 217–222. doi:10.1080/01431160412331269698
Saito, T., and Rehmsmeier, M. (2015). The Precision-Recall Plot Is More Informative Than the ROC Plot when Evaluating Binary Classifiers on Imbalanced Datasets. PloS one 10 (3), e0118432. doi:10.1371/journal.pone.0118432
Shi, X. (2016). Comparative Analysis on Detection Efficiency of Two ADTD Lightning Location Systems (In Chinese). Meteorol. Hydrological Mar. Instr. 33 (3), 6–12. doi:10.19441/j.cnki.issn1006-009x.2016.03.002
Sofaer, H. R., Hoeting, J. A., and Jarnevich, C. S. (2019). The Area under the Precision-Recall Curve as a Performance Metric for Rare Binary Events. Methods Ecol. Evol. 10 (4), 565–577. doi:10.1111/2041-210x.13140
Sothe, C., De Almeida, C. M., Schimalski, M. B., La Rosa, L. E. C., Castro, J. D. B., Feitosa, R. Q., et al. (2020). Comparative Performance of Convolutional Neural Network, Weighted and Conventional Support Vector Machine and Random forest for Classifying Tree Species Using Hyperspectral and Photogrammetric Data. GIScience & Remote Sensing 57 (3), 369–394. doi:10.1080/15481603.2020.1712102
Stehman, S. V. (1997). Selecting and Interpreting Measures of Thematic Classification Accuracy. Remote sensing Environ. 62 (1), 77–89. doi:10.1016/s0034-4257(97)00083-7
Wan, L., Zhang, H., Lin, G., and Lin, H. (2019). A Small-Patched Convolutional Neural Network for Mangrove Mapping at Species Level Using High-Resolution Remote-Sensing Image. Ann. GIS 25 (1), 45–55. doi:10.1080/19475683.2018.1564791
Wang, L., Wang, H., and Heng, Z. (2019). A Rapid Identification and Warning Method for Severe Weather via Doppler Radar Based on an Improved TITAN Algorithm. J. Atmos. Solar-Terrestrial Phys. 193, 105080. doi:10.1016/j.jastp.2019.105080
Wang, P., Lv, W., Wang, C., and Hou, J. (20182018). “Hail Storms Recognition Based on Convolutional Neural Network.” in WCICA 2018: 13th World Congress on Intelligent Control and Automation. Changsha: IEEE, 1703–1708.
Wei, C.-C., and Hsieh, P.-Y. (2020). Estimation of Hourly Rainfall during Typhoons Using Radar Mosaic-Based Convolutional Neural Networks. Remote Sensing 12 (5), 896. doi:10.3390/rs12050896
Wright, R. E. (1995). “Logistic Regression,” In Reading and Understanding Multivariate Statistics. Editor L. G. Grimm, and P. R. Yarnold (American Psychological Association), 217–244.
Xu, H., and Zhou, M. (2017). Evaluation and Analysis of Detecting Efficiency Based on ADTD Lightning Location Network. Henan Sci. Tech. (01), 126–128.
Yang, L., Wang, Y., Wang, Z., Qi, Y., Li, Y., Yang, Z., et al. (2020). A New Method Based on Stacked Auto-Encoders to Identify Abnormal Weather Radar echo Images. EURASIP J. Wireless Com Netw. 2020 (1), 1–15. doi:10.1186/s13638-020-01769-3
Yücelbaş, Ş., Erduman, A., Yücelbaş, C., and Yildiz, F. (2021). Pre-estimation of Distance-Based Lightning Using Effective Meteorological Parameters. Arabian J. Sci. Eng. 46 (2), 1529–1539. doi:10.1007/s13369-020-05257-0
Zepka, G. S., Pinto, O., and Saraiva, A. C. V. (2014). Lightning Forecasting in southeastern Brazil Using the WRF Model. Atmos. Res. 135-136, 344–362. doi:10.1016/j.atmosres.2013.01.008
Zhang, Z., Yang, J., and He, Z. (2020). “A Density Based Convective Storm Identification Method for Radar Data.” in CIYCEE 2020: IEEE 1st China International Youth Conference on Electrical Engineering. Wuhan: IEEE, 1–6.
Zhou, K., Zheng, Y., Dong, W., and Wang, T. (2020). A Deep Learning Network for Cloud-To-Ground Lightning Nowcasting with Multisource Data. J. Atmos. Oceanic Tech. 37 (5), 927–942. doi:10.1175/jtech-d-19-0146.1
Keywords: lightning strike location, identification, convolutional neural network, 3D weather radar, machine learning
Citation: Lu M, Zhang Y, Ma Z, Yu M, Chen M, Zheng J and Wang M (2021) Lightning Strike Location Identification Based on 3D Weather Radar Data. Front. Environ. Sci. 9:714067. doi: 10.3389/fenvs.2021.714067
Received: 24 May 2021; Accepted: 26 July 2021;
Published: 04 August 2021.
Edited by:
Peng Liu, Institute of Remote Sensing and Digital Earth (CAS), ChinaReviewed by:
Jan Szturc, Institute of Meteorology and Water Management - National Research Institute, PolandIvica Petrović, Josip Juraj Strossmayer University of Osijek, Croatia
Copyright © 2021 Lu, Zhang, Ma, Yu, Chen, Zheng and Wang. This is an open-access article distributed under the terms of the Creative Commons Attribution License (CC BY). The use, distribution or reproduction in other forums is permitted, provided the original author(s) and the copyright owner(s) are credited and that the original publication in this journal is cited, in accordance with accepted academic practice. No use, distribution or reproduction is permitted which does not comply with these terms.
*Correspondence: Zaiyang Ma, enlfbWEzMjdAMTI2LmNvbQ==