 Mobeen Ur Rehman
 Muhammad Kashif2
 Syed Jawad Hussain Shahzad
- 1Shaheed Zulfikar Ali Bhutto Institute of Science and Technology (SZABIST), Islamabad, Pakistan
- 2Shaheed Zulfikar Ali Bhutto Institute of Science and Technology (SZABIST), Karachi, Pakistan
- 3Imam Muhammad ibn Saud Islamic University, Riyadh, Saudi Arabia
- 4Higher School of Business Administration, University of Sfax, Sfax, Tunisia
- 5Montpellier Research in Management, Montpellier Business School, University of Montpellier, Montpellier, France
- 6South Ural State University, Chelyabinsk, Russia
Our work examines the relationship between socially responsible funds and the traditional energy market over daily returns data ranging from December 2015 to April 2019. We apply quantile cross-spectral analysis to measure returns correlation under different market conditions in the short, medium, and long run to measure the connectedness between both markets. Our results highlight that correlation based on different quantile distributions yields different investment opportunities. In the short run, investors can benefit from diversifying assets under extreme market conditions. No significant diversification opportunities are available in the medium- and long-run periods. Our findings provide implications for individual investors making investments under different horizons and dynamic market conditions.
Introduction
During the last couple of decades, the international investment community has seen a steady shift in investment patterns around the globe. This shift reflects the inclusion of more recently financialized commodities such as precious metals and energy (Rehman and Apergis, 2019). Investors have Rehman et al. (2018) focused more on socially responsible investments and the environment (Reboredo, 2018). Consequently, investors shift towards an optimal portfolio mix consisting of a wide variety of stocks (Uddin et al., 2018; Shahzad et al., 2019). Though research on energy investment structuring from the global perspective has gained more popularity, existing literature has also documented specific energy sources that focus on both global and local energy situations, e.g., in terms of energy supply (Balat and Balat, 2009) and energy production (Armaroli and Balzani, 2007), energy consumption (Guo and Fu, 2010), energy security (Yergin, 2006), energy use (Neto et al., 2014), energy market (Kleit, 2001), and energy trade (Wälde and Gunst, 2002).
The importance of energy has been on the rise in terms of not only its real-world applications but also the financial and investment perspectives, considering its recent escalated financialization and acceptance by the international investment community. Though energy finance has received considerable attention in recent literature, the avenue for further research regarding its financial aspect stands still. Due to its commercial importance and financial attributes, the demand for energy has increased tremendously, representing its potential for long-run strategic investment. Recent literature has witnessed the notable contribution of energy stocks as financial commodities (see Ghorbel and Trabelsi, 2014; Pan et al., 2014) and their combination with traditional asset class in a portfolio (Rehman 2019; Shahzad et al., 2019). Such energy commodities are traded not only in spot markets that are capable of providing leverage (Chng, 2009) but also in the form of different futures contracts like Exchange Traded Commodities (ETC). Therefore, in the case of high capital market integration, the energy-equity combination presents itself as an optimal choice for hedging risk resulting from any asset class (Khalfaoui et al., 2015; Basher and Sadorsky, 2016). The emergence of energy stocks as a new asset class and their increased financialization have opened several new avenues for investment and research. However, investment in energy stocks also entails risk and needs a combination of suitable heterogeneous stocks to hedge risk or provide safe haven properties.
Few studies have demonstrated the relationship between different energy stocks. For example, Kumar et al. (2012) have reported that fuel prices affect clean energy stock returns. Similarly, Broadstock et al. (2012) have employed a time-varying correlation to report the effect of fossil fuel prices on Chinese energy equities following the subprime crisis of 2007–2008. Though the energy sector presents potential investment opportunities, careful selection of different assets is inevitable given the volatile nature of energy commodities and the inclusion of new asset classes with less profit and more social concerns.
In the last decade, we have witnessed the escalation of an investment trend in socially responsible firms based on the financial and non-financial attributes of firms. The non-financial aspect of socially responsible investing has attracted the investors’ attention over time because the market capitalization of such stocks has notably increased. We have also witnessed enormous growth in socially responsible mutual funds due to their social initiatives not being completely isolated from financial motives. Socially responsible stocks have emerged as comparatively new asset classes for the investment community. These socially responsible funds are like mutual funds comprising many other stocks; however, the selection of those stocks is based on the socially responsible behavior of the company. These socially responsible behaviors mainly include concern for environmental degradation, social justice, women empowerment, gender equality, and awareness about carbon emission. The stocks comprising these funds are not totally devoid of the financial aspect; rather, these companies either invest or act in socially responsible initiatives and ways or at least show concern about the social issues. Details about the companies that are included in our sampled socially responsible funds are provided in Table 1. Hence, these socially responsible funds are profit-oriented, yet the selection of companies within these SRI funds is based on socially responsible initiatives.
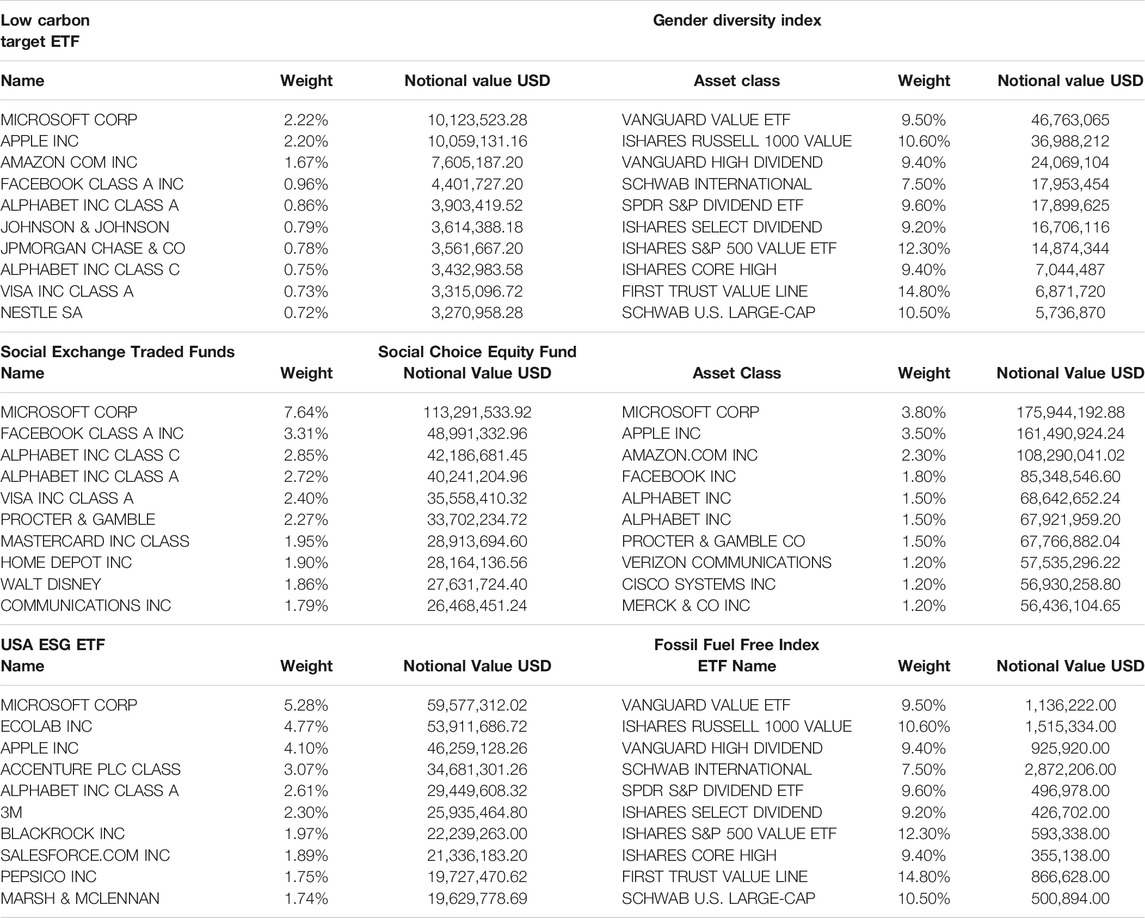
TABLE 1. Sample funds statistics.
Bialkowski and Starks (2016) have reported that in recent literature, differences between traditional stocks and socially responsible investment stocks have gradually diminished, based on low returns and high volatility. Similarly, Bauer et al. (2005) have found that the risk-adjusted returns on SRI stocks in Germany, UK, and the US are not different from conventional stock returns. However, despite the acceptability of socially responsible stocks by the investment community, comparing returns between SRI and traditional stocks hovers around the argument about ethical penalties. According to Renneboog et al. (2008), investment in SRI funds of North-American, European, and Asia-Pacific countries underperforms compared to traditional stocks investments, suggesting an additional cost for investors for their investments in socially responsible stocks. Nevertheless, Reidl and Smeets (2017) have highlighted that social reference tends to be a major factor despite expecting low returns. This is because investing in socially responsible stocks implies a long-term effect on equity pricing. Similarly, Hong and Kacperczyk (2009) have suggested that many policymakers and academics may contradict the trade-off between bad and good returns though some believe that significant implications may result from the return attributes of socially responsible investments. Nilsson (2009) has believed that a specific class of investors believes that such socially responsible investments provide average if not above-average returns besides altruistic motives. However, despite such heterogeneous findings of superior or average returns of socially responsible stocks, there still exists an investors’ class willing to bear this extra risk.
Existing literature on socially responsible investments has documented that the performance of SRI stocks is either greater or at least equal to the overall market performance (Guerard, 1997; Goldreyer and Diltz, 1999; Bauer et al., 2005; Brzeszczynski et al., 2009). According to Kempf and Osthoff (2007), SRI stocks have the potential to give abnormal returns even after considering their trading costs. On a different note, the increasing financialization of the energy market has attracted the interest of the investment community as a new investment option (see Tang and Xiong, 2012). The energy futures provide optimal returns not only as a standalone investment but in a portfolio together with conventional assets. However, given the turbulent economic and financial environment, it is always better to make safe investments in portfolios. Our work is the first of its type, which examines the comovement between SRI and energy stocks. The SRI stocks can not only outperform markets despite their ethical and social concerns but also can hedge returns of the turbulent energy futures. With the increasing financialization of energy commodities, the relationship between energy and non-energy commodities has increased significantly. Therefore, low returns comovement between energy and SRI stocks can provide optimal diversification benefits based on their less integration with each other (Rehman et al., 2019).
Therefore, based on the above discussion, our work investigates integration between energy markets and socially responsible funds to highlight portfolio diversification opportunities between these two asset classes. Though integration among different asset markets can be measured using linear estimation techniques, existing literature has also highlighted the presence of a non-linear relationship between different asset classes (see Shahzad et al., 2019). Furthermore, linear regression is not capable of measuring integration under varying market conditions. Therefore, for this purpose, we employ a quantile cross-spectral approach that provides separate correlation results under different return distributions rather than taking an average across all quantiles. The resulting hypotheses are that socially responsible investments (SRI) exhibit significant coherence with the energy stocks under extreme (both bearish and bullish) and normal market conditions in the short-, medium-, and long-run investment periods. This helps investors in identifying correlation patterns between two assets under varying market conditions, i.e., either bearish or bullish. Furthermore, it is possible to identify correlation under the condition that each market experiences different market conditions, i.e., one market in the bearish and the other in bullish state. Therefore, results provided by the quantile cross-spectral approach help estimate integration under heterogeneous market behaviors.
The advantage of the quantile cross-spectral approach is that it has the capability of detecting any common type of dependence structure. Furthermore, the resultant output of this approach is far more colorful than that of the traditional measures of dependence, clearly identifying heterogeneous correlation patterns across different quantiles. The results are quite indicative of the fact that returns correlation between any two assets is not based on average values but rather is presented on a quantile basis. Further elaborations in this quantile cross-connectedness approach include the quantile coherence matrices for three separate quantile ranges, i.e., 0.05., 0.50, and 0.95, together with all the combinations. By allowing such asymmetries between the returns of two assets, clear information is available about the dependence between extreme positive and extreme negative returns. Another feature of this approach is the separate presentation of returns connectedness for the short- (2 days), medium- (22 days), and long-run (250 days) investment periods.
Based on the above-highlighted discussion, our contributions in this work are as follows. First, our study identifies diversification opportunities within the energy asset class comprising socially responsible funds and the energy market. Second, we apply the quantile cross-spectral approach, which is capable of identifying returns’ opportunities for investors under different market conditions, i.e., extreme negative (bearish), neutral, and extreme positive (bullish). Finally, our results carry implications for investors under different investment horizons, i.e., short-run, medium-run, and long-run periods. Particularly, our results highlight diversification opportunities for investors in the short run under extreme market conditions; however, such opportunities do not exist in either the medium and long run.
The rest of the paper has the following structure. Data and Methodology discusses details about data and methodology. Analysis and Discussion presents analysis with a discussion of the results. Finally, Conclusion provides a conclusion including implications for international investors.
Data and Methodology
Data
We use a sample of six socially responsible funds covering the daily frequency of data spanning from March 2016 to April 2019. These indices comprise SRI funds, including Low Carbon Exchange Traded Funds (Low Carbon), USA ESG, Fossil Fuel Reserve Free ETF Index, Social Choice Equity Funds (Social ETF), Social Exchange Traded Funds (Social Choice Equity), and Gender Diversity Index. Low Carbon Exchange Traded Funds (ETFs) consist of more than 1,200 stocks within and outside the US, comprising companies with less carbon exposure compared with the rest of the markets. Among the largest shareholders are Apple, Microsoft, and Amazon, making up almost 6 percent of the entire portfolio. USA ESG funds consist of companies emphasizing ethical and moral aspects and do not include companies, for example, with tobacco holdings. Within this fund, low-profile stocks usually make up to the top 25 percent with prospects in long-run investments. The Fossil Fuel Reserve Fund presents itself as a new addition to the ETF industry with the goal of replicating returns of S&P 500; however, it does not include companies holding fossil fuel reserves. This fund provides an annual average return of 14 percent. Social Exchange Traded Funds include companies with positive social, environmental, and governance characteristics. There are almost 400 stocks holdings with more than 30 percent portfolios in the technology sector. Gender Diversity Index follows the performance of companies with the aim of women's career advancement at the top management positions. There are almost 170 well-diversified positions, mainly including Johnson & Johnson, Coca-Cola, Home Depot, and PepsiCo. Finally, the Social Choice Equity Fund replicates Russell 3000 performance following high social, environmental, and governance standards. There are almost $3.8 billion holdings with a minimum investment of $2500. This fund differentiates itself from conventional funds by excluding companies with ethically and morally irresponsible businesses like tobacco, alcohol, and weapons. Data for all the variables are extracted from Data Stream. Table 1 presents details about the complete description of each index, its weight, and respective notional value.
Methodology
Quantile Unit Root Test
To apply the unit root test under varying quantile distributions, we follow the work of Galvao (2009) based on the quantile autoregression framework, which adds stationary covariates. This is an extension of an earlier work by Xiao and Koenker (2009). The speed of adjustment for any variable within a quantile framework depends on both the sign and size of a shock. Therefore, this process allows us to test a time series for unit root across different quantiles. Therefore, the quantile covariates unit root process is superior to the traditional unit root tests, which takes an average value rather than considering the coefficients at each quantile distribution. We test the null hypothesis of unit root a1 = 1 against the alternative hypothesis a1 < 1.
The expression for the resultant model is as follows:
In the above equation,
Quantile Cross-Spectral Test
To investigate the relationship between socially responsible funds and traditional energy markets under different returns distribution, we make use of the quantile cross-spectral approach proposed earlier by Barunik and Kley (2015) to highlight dynamic dependence between the series (Xt,j1) and (Xt,j2) as follows:
In the above equation,
with
In Equation 4,
where
To estimate quantile coherency, we apply smoothed quantile cross-periodograms, as proposed by Barunik and Kley (2015). In our work, we use three separate quantiles at 0.05, 0.50, and 0.95 (i.e., at 5th, 50th, and 95th quantile), respectively, to extract the quantile coherency matrix.
Analysis and Discussion
We start our analysis by presenting details on socially responsible funds, which are used as a sample in our study. Table 1 presents the complete composition of each sampled index with companies’ weightage and the notional US dollar value.
Table 2 presents descriptive statistics of socially responsible funds and energy indices. Among socially responsible indices, USA ESG and Fossil Fuel have the highest daily returns values; however, among energy markets, crude oil provides the maximum daily returns. Social Choice Equity exhibits the maximum variance along with Natural Gas over the period under study. Returns for all socially responsible funds are negatively skewed, such as World Alternate Energy markets; however, Crude Oil and Natural Gas exhibit positively skewed returns. Social Choice and Gender Diversity indices demonstrate high kurtosis values, thereby indicating a fat-tailed distribution. Among all series, Natural Gas highlights the maximum variance in returns since maximum and minimum values are the highest among the rest, i.e., 16% and 18%, respectively. Figure 1 highlights the pricing trend of each socially responsible and energy market index over the sample period. For all socially responsible funds, we report steady daily pricing patterns over the last five years; however, energy indices exhibit a volatile pattern. These dynamics suggest that socially responsible indices can provide optimal diversification opportunities along with the energy market, which exhibit more sensitivity in prices.
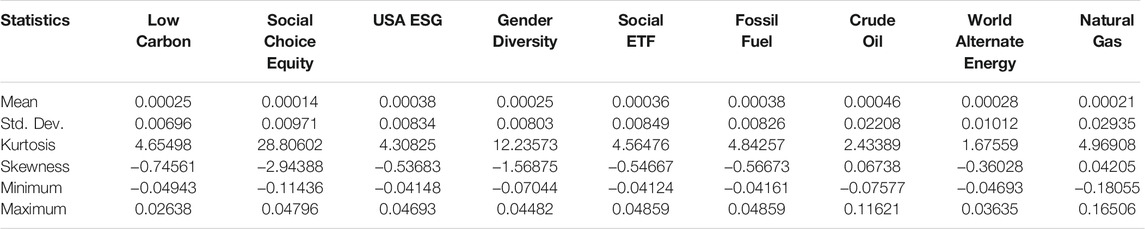
TABLE 2. Descriptive statistics.

FIGURE 1. Pricing trends.
Figure 2 presents the results of an unconditional correlation based on color indicators varying with the magnitude of correlation (dark red = −1 to dark blue = +1). We witness no traces of negative correlation neither within the socially responsible or energy markets (within group) nor between these two markets (across groups). These results based on unconditional correlation suggest potential cointegration between socially responsible indices and energy markets and therefore require further analysis based on different quantile distributions.
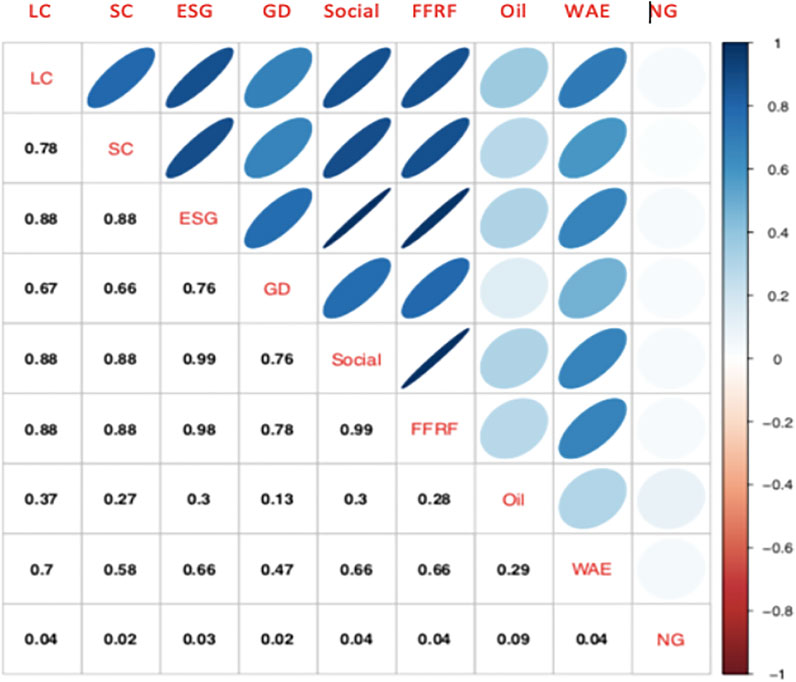
FIGURE 2. Unconditional returns correlation.
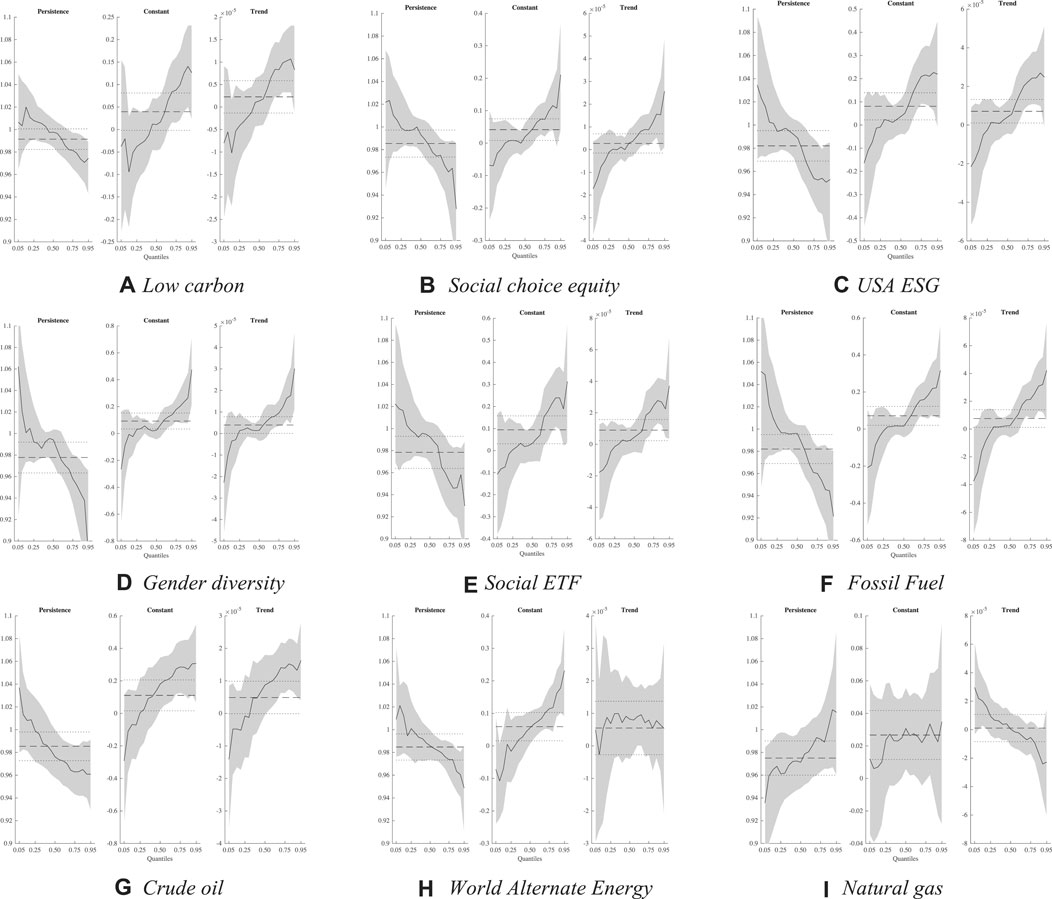
Our results for quantile unit root tests are reported in Tables 3, 4. Traditional unit root tests are based on the conditional mean of the data and therefore are capable of detecting the presence of a unit root in linear time series. The application of quantile unit root tests considers quantile distribution for presenting unit root results not only for mean but also for extreme tail distribution. A graphical depiction of each sampled index is presented in Appendix A1.
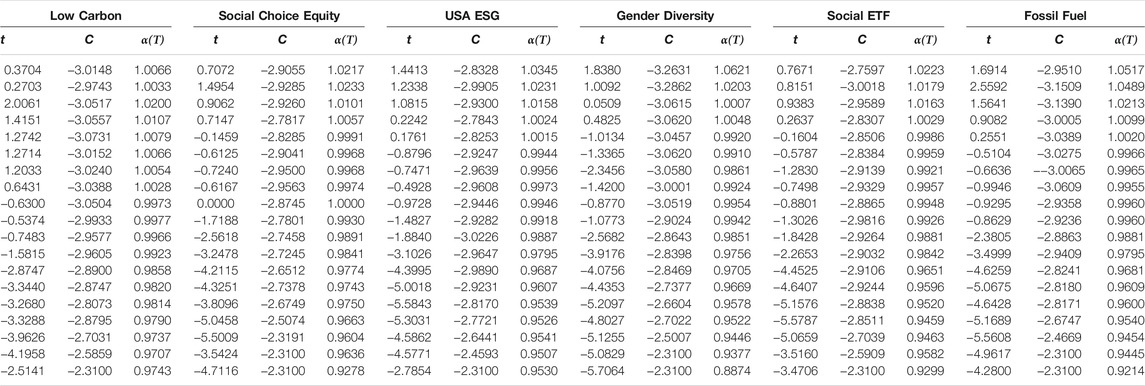
TABLE 3. Quantile unit root tests, socially responsible funds.
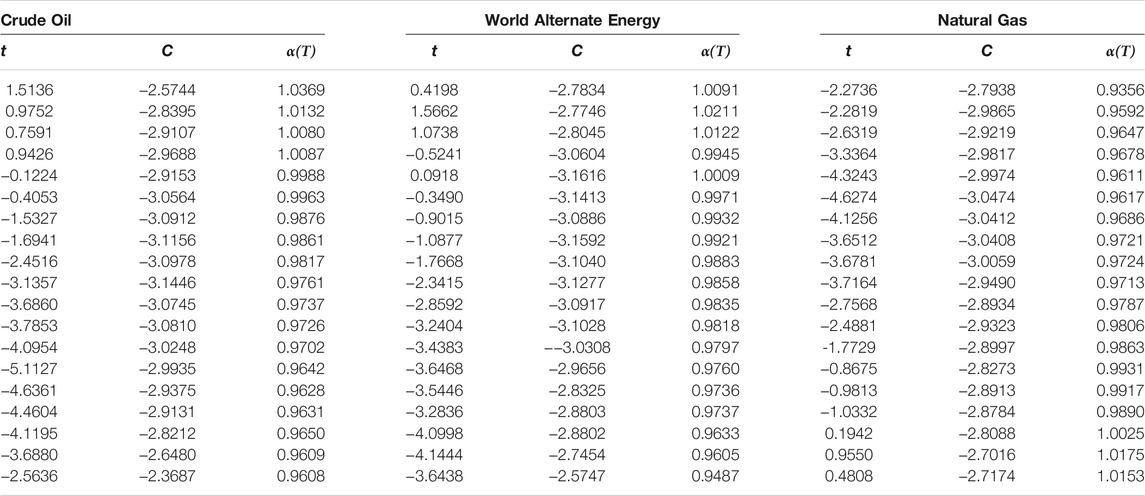
TABLE 4. Quantile unit root tests, Energy Funds.
We present quantile covariate results in the form of coefficients α(τ), t(τ), and C, representing persistence parameter, t statistics, and the critical value for distribution ranging from 5th to 95th quantile. We can see a clear variation in unit root coefficients for all series under different quantile distributions. The persistence parameter α(τ) highlights values greater than unity at lower quantiles; however, these values tend to keep increasing across higher quantiles suggesting the presence of asymmetry in series. Though all series highlight value of the persistence parameter greater than 1 across lower quantiles, the persistence parameter for Natural Gas remains less than 1 across all quantiles. To confirm the rejection of the null hypothesis of a unit root in a series, we use a formal test statistic t(τ) across different quantiles. For all series, the value t(τ) is greater than the critical value across lower quantiles suggesting that the null hypothesis of unit root cannot be rejected. However, at higher quantiles, this null hypothesis is rejected, suggesting the presence of unit root at higher-order quantiles. Therefore, these results highlight the mean reverting behavior for all the sampled series; therefore, any shocks are likely to persist for a longer period. Such a situation makes it difficult to predict future values and tests based on a wide quantile distribution are more likely to yield robust results.
Figures 3A–C depict the quantile cross-spectral approach for the short, medium, and long run to highlight the presence of returns cointegration between socially responsible stocks and the energy market across a wide distribution of quantiles. The quadrants in the quantile cross-spectral diagram highlight the returns correlation under different quantile distributions. These distributions are divided into 0.05, 0.50, and 0.95 quantiles corresponding to bearish, normal, and bullish market conditions. The first upper left quadrant presents correlation results when both markets experience bearish conditions, whereas the lower extreme right quadrant presents correlation results when both markets experience bullish conditions. The color indicator on the right side of the diagram highlights correlation magnitude ranging from −1 (high negative correlation) to +1 (high positive correlation). Figure 3A underlines results for the short-run investment horizon, which are quite different from the unconditional correlation results presented earlier in Figure 2. In the first quadrant under bearish conditions for both markets, i.e., 0.05|0.05 quantile arrangement, we witness very few traces of positive correlation (for example, LC with WAE, ESG with Social and FFRF, and Social with FRFF), whereas, for most of the cases, diversification opportunities seem to exist. Hence, under extreme negative returns, we witness significant diversification opportunities. Under extreme positive returns for both markets, i.e., 0.95|0.95 quantile arrangement, we witness only a single case of high correlation between the Social-ESG market pair. Besides this pair, low or negative correlation between all markets indicates potential for diversification. Therefore, under extreme market conditions (both positive and negative), our results support earlier findings by Balcilar et al. (2017) that the performance of a portfolio comprising socially responsible stocks and conventional stocks can be improved. For all other quantile combinations, low correlation values again signify the potential for diversification between socially responsible stocks and the energy market.
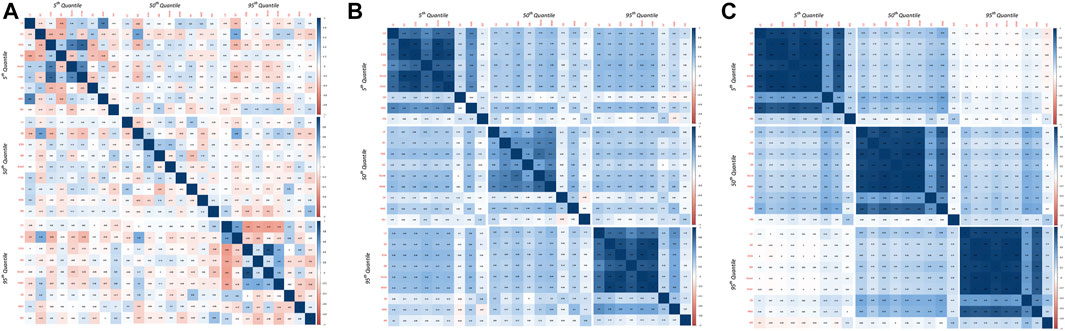
FIGURE 3. (A) Quantile cross-spectral correlations (short run). (B) Quantile cross-spectral correlations (medium run). (C) Quantile cross-spectral correlations (long run).
Figure 3B reflects the correlation pattern under different quantile distributions for the medium-run investment horizon. We observe that for all quantile arrangements, high correlation coefficients dominate for all assets. Though these high correlation values are evident for most of the market combinations, bearish and bullish market conditions, i.e., 0.05|0.05 and 0.95|0.95, respectively, highlight high positive correlation. Such high values between both asset classes suggest an increasing return integration under extreme market conditions. Therefore, diversification benefits are hard to achieve under different market conditions in the medium-run investment perspective. Figure 3C presents results for the quantile cross-spectral approach for the long-run investment horizon, which are quite similar to the previous results in Figure 3B. For bearish, normal, and bullish conditions in both markets, i.e., 0.05|0.05, 0.50|0.50, and 0.95|0.95, respectively, the correlation appears quite high, suggesting no opportunities for optimal returns by formulating a diversified portfolio between socially responsible funds and energy market. However, returns’ correlation under quantile arrangements of 0.05|0.95 appears feasible in terms of correlation coefficients when either of the markets faces bearish (bullish) conditions with the other being in the bullish (bearish) state.
Conclusion
Our study examines returns integration between samples of socially responsible funds and energy markets. Recently, both these asset classes are have received attention from international investors and researchers. Among other parameters, our selection of SRI funds is based on a recent United Nations climate change conference held in Paris, 2015, which focused on investing in the stocks of the clean energy sector in order to develop and face the increasing challenges of climate change. Though private investments in the renewable energy sector have gained popularity among the investment community over time, the interest of investors with long-run investment goals in renewable energy stocks calls for careful evaluation of the financial risk and profitability of these companies.
The energy market has witnessed a sharp increase in its financialization process, which, as a result, offers investors an additional asset class backed by rising global energy needs and demands. However, price volatility of energy stocks is considered an important determinant of low financial performance of the energy projects (Kumar et al., 2012; Reboredo, 2018), thereby suggesting their holdings together with hedging instruments in a portfolio. Interestingly, increasing financialization of commodities and stocks in recent years has increased the level of returns correlation between energy and non-energy commodities, making the portfolio allocation decision more challenging (Rehman 2019).
Our results highlight the presence of fewer diversification benefits in light of traditional unconditional correlation; however, the result of quantile cross-spectral analysis presents different findings. By investigating the returns correlation under different quantile arrangements, we witness different results under varying market conditions. For the short-run investment horizon, diversification benefits between both asset classes exist reflected by low correlation values when both asset classes face bearish market conditions. These low values are also witnessed within these asset classes in most of the cases. These results are similar to the findings for bullish market conditions, suggesting that in the short-run investment perspective, both markets tend to provide optimal returns by offering a low underlying correlation pattern under extreme market conditions. Along with extreme market conditions, this low correlation pattern is evident for all market combinations between these socially responsible funds and the energy market. However, for the medium- and long-run investment horizons, we see no diversification benefits under any market condition, suggesting that these assets are not capable of offering returns in medium- and long-run investments without significant risk attributable to high correlation values.
Our results carry implications for investors in the following aspects. Short-run investment opportunities exist between socially responsible funds and the energy market but under extreme market conditions. These statistics suggest an opportunity for investment in these two asset classes since energy markets are documented to exhibit volatile behavior. Therefore, the presence of low returns’ integration between socially responsible funds and the energy market provides hedging for energy markets’ volatile behavior by adding socially responsible funds in a portfolio.
Our results for the short-run investment period carry implications for investors as returns correlation across extreme quantiles highlight potential for diversification. However, we also see high correlation values between few assets, i.e., between WAE and LC, FFRF and ESG, Social and ESG, and FFRF and Social. Therefore, investing in these asset pairs can result in spillover; therefore, investors should consider investing in assets with low correlation values. Likewise, a high correlation value is evident between Social and ESG stocks during bullish market conditions; however, we witness asymmetry in results. This is because the correlation between Social and ESG is 0.68 during bearish market conditions, whereas increases up to 0.91 under bullish market conditions. This is good for investors as downside risk is less than the upside risk in case of extreme returns. However, investing only in these two stocks within a single portfolio can result in a returns spillover. In the medium and long run, results are quite different from those in the short run because of the high correlation values across the majority of the quantiles. Results appear quite interesting since correlation values within similar asset classes remain quite high, thus suggesting minimal diversification benefits. These results carry important implications as the sampled SRI indices comprise heterogeneous stocks but with socially responsible behavior. Nevertheless, all these indices exhibit high correlation values in the medium-run investment horizon. Therefore, these SRI stocks should be combined with other energy stocks as returns comovement between these two asset classes is quite low. This situation gets more intensified in the long run, suggesting that all the socially responsible funds converge in the long run and, therefore, should not be combined in a single portfolio under extreme market conditions.
Our study also includes implications for investors with different investment horizon preferences. In the short run, diversification opportunities can be exploited by investors; however, medium- and long-run investors hardly find diversification benefits. Therefore, short-run investors under all market conditions, i.e., bearish, normal, and bullish, can reap diversification benefits; however, more benefits are witnessed under extreme returns distribution.
Data Availability Statement
The original contributions presented in the study are included in the article/Supplementary Materials; further inquiries can be directed to the corresponding author.
Author Contributions
MR was responsible for conceptualization, writing of the original draft, data curation, methodology, and software. MK contributed to the writing of the original draft and reviewed and edited the manuscript. NN supervised the work and reviewed and edited the manuscript. SS had a contributor role in supervision, visualization, and reviewing and editing process.
Funding
The authors NN and SS extend their appreciation to the Deanship of Scientific Research at Imam Mohammad Ibn Saud Islamic University for funding and supporting this work through Research Partnership Program no. RP-21-10-02.
Conflict of Interest
The authors declare that the research was conducted in the absence of any commercial or financial relationships that could be construed as a potential conflict of interest.
The reviewer (MAN) declared a past collaboration with several of the authors (MUR, SJHS) to the handling editor.
Publisher’s Note
All claims expressed in this article are solely those of the authors and do not necessarily represent those of their affiliated organizations, or those of the publisher, the editors and the reviewers. Any product that may be evaluated in this article, or claim that may be made by its manufacturer, is not guaranteed or endorsed by the publisher.
References
Armaroli, N., and Balzani, V. (2007). The Future of Energy Supply: Challenges and Opportunities. Angew. Chem. Int. Ed. Engl. 46 (1‐2), 52–66. doi:10.1002/anie.200602373
Balat, M., and Balat, H. (2009). Recent Trends in Global Production and Utilization of Bio-Ethanol Fuel. Appl. Energ. 86 (11), 2273–2282. doi:10.1016/j.apenergy.2009.03.015
Balcilar, M., Bouri, E., Gupta, R., and Roubaud, D. (2017). Can Volume Predict Bitcoin Returns and Volatility? A Quantiles-Based Approach. Econ. Model. 64, 74–81. doi:10.1016/j.econmod.2017.03.019
Barunık, J., and Kley, T. (2015). Quantile Cross-Spectral Measures of Dependence between Economic Variables. arXiv preprint arXiv:1510.06946.
Basher, S. A., and Sadorsky, P. (2016). Hedging Emerging Market Stock Prices with Oil, Gold, VIX, and Bonds: A Comparison between DCC, ADCC and GO-GARCH. Energ. Econ. 54, 235–247. doi:10.1016/j.eneco.2015.11.022
Bauer, R., Koedijk, K., and Otten, R. (2005). International Evidence on Ethical Mutual Fund Performance and Investment Style. J. Banking Finance 29 (7), 1751–1767. doi:10.1016/j.jbankfin.2004.06.035
Bialkowski, J., and Starks, L. T. (2016). Sri Funds: Investor Demand, Exogenous Shocks and Esg Profiles.
Broadstock, D. C., Cao, H., and Zhang, D. (2012). Oil Shocks and Their Impact on Energy Related Stocks in China. Energ. Econ. 34 (6), 1888–1895. doi:10.1016/j.eneco.2012.08.008
Brzeszczynski, J., Gajdka, J., and Schabek, T. (2009). Sustainable Investing. Polish J. Environ. Stud. 18 (5 (B)), 56–62.
Chng, M. T. (2009). Economic Linkages across Commodity Futures: Hedging and Trading Implications. J. Banking Finance 33 (5), 958–970. doi:10.1016/j.jbankfin.2008.10.006
Ferreira Neto, A. B., Perobelli, F. S., and Bastos, S. Q. A. (2014). Comparing Energy Use Structures: An Input-Output Decomposition Analysis of Large Economies. Energ. Econ. 43, 102–113. doi:10.1016/j.eneco.2014.02.001
Galvao, A. F. (2009). Unit Root Quantile Autoregression Testing Using Covariates. J. Econom. 152 (2), 165–178. doi:10.1016/j.jeconom.2009.01.007
Ghorbel, A., and Trabelsi, A. (2014). Energy Portfolio Risk Management Using Time-Varying Extreme Value Copula Methods. Econ. Model. 38, 470–485. doi:10.1016/j.econmod.2013.12.023
Goldreyer, E. F., and Diltz, J. D. (1999). The Performance of Socially Responsible Mutual Funds: Incorporating Sociopolitical Information in Portfolio Selection. Managerial Finance.
Guerard, J. B. (1997). Is There a Cost to Being Socially Responsible in Investing? J. Forecast. 16 (7), 475–490. doi:10.1002/(sici)1099-131x(199712)16:7<475::aid-for668>3.0.co;2-x
Guo, Z. C., and Fu, Z. X. (2010). Current Situation of Energy Consumption and Measures Taken for Energy Saving in the Iron and Steel Industry in China. Energy 35 (11), 4356–4360. doi:10.1016/j.energy.2009.04.008
Hong, H., and Kacperczyk, M. (2009). The price of Sin: The Effects of Social Norms on Markets. J. Financial Econ. 93 (1), 15–36. doi:10.1016/j.jfineco.2008.09.001
Kempf, A., and Osthoff, P. (2007). The Effect of Socially Responsible Investing on Portfolio Performance. Eur. Financial Manag. 13 (5), 908–922. doi:10.1111/j.1468-036x.2007.00402.x
Khalfaoui, R., Boutahar, M., and Boubaker, H. (2015). Analyzing Volatility Spillovers and Hedging between Oil and Stock Markets: Evidence from Wavelet Analysis. Energ. Econ. 49, 540–549. doi:10.1016/j.eneco.2015.03.023
Kleit, A. N. (2001). Are Regional Oil Markets Growing Closer Together?: An Arbitrage Cost Approach. Energ. J. 2, 1–15.
Kumar, S., Managi, S., and Matsuda, A. (2012). Stock Prices of Clean Energy Firms, Oil and Carbon Markets: A Vector Autoregressive Analysis. Energ. Econ. 34 (1), 215–226. doi:10.1016/j.eneco.2011.03.002
Nilsson, J. (2009). Segmenting Socially Responsible Mutual Fund Investors. Intl Jnl of Bank Marketing 27 (1), 5–31. doi:10.1108/02652320910928218
Pan, Z., Wang, Y., and Yang, L. (2014). Hedging Crude Oil Using Refined Product: A Regime Switching Asymmetric DCC Approach. Energ. Econ. 46, 472–484. doi:10.1016/j.eneco.2014.05.014
Reboredo, J. C. (2018). Green Bond and Financial Markets: Co-movement, Diversification and price Spillover Effects. Energ. Econ. 74, 38–50. doi:10.1016/j.eneco.2018.05.030
Rehman, M. U., and Apergis, N. (2019). Determining the Predictive Power between Cryptocurrencies and Real Time Commodity Futures: Evidence from Quantile Causality Tests. Resour. Pol. 61, 603–616. doi:10.1016/j.resourpol.2018.08.015
Rehman, M. U., Bouri, E., Eraslan, V., and Kumar, S. (2019). Energy and Non-energy Commodities: An Asymmetric Approach towards Portfolio Diversification in the Commodity Market. Resour. Pol. 63, 101456. doi:10.1016/j.resourpol.2019.101456
Rehman, M. U. (2019). Energy Shocks Pricing Model: A Non-linear US Sectoral Based Analysis. Physica A: Stat. Mech. its Appl. 535, 122278. doi:10.1016/j.physa.2019.122278
Rehman, M. U., Shahzad, S. J. H., Uddin, G. S., and Hedström, A. (2018). Precious Metal Returns and Oil Shocks: A Time Varying Connectedness Approach. Resour. Pol. 58, 77–89. doi:10.1016/j.resourpol.2018.03.014
Renneboog, L., Ter Horst, J., and Zhang, C. (2008). Socially Responsible Investments: Institutional Aspects, Performance, and Investor Behavior. J. Banking Finance 32 (9), 1723–1742. doi:10.1016/j.jbankfin.2007.12.039
Riedl, A., and Smeets, P. (2017). Why Do Investors Hold Socially Responsible Mutual Funds?. J. Finance 72 (6), 2505–2550. doi:10.1111/jofi.12547
Shahzad, S. J. H., Rehman, M. U., and Jammazi, R. (2019). Spillovers from Oil to Precious Metals: Quantile Approaches. Resour. Pol. 61, 508–521. doi:10.1016/j.resourpol.2018.05.002
Tang, K., and Xiong, W. (2012). Index Investment and the Financialization of Commodities. Financial Analysts J. 68 (6), 54–74. doi:10.2469/faj.v68.n6.5
Uddin, G. S., Rahman, M. L., Shahzad, S. J. H., and Rehman, M. U. (2018). Supply and Demand Driven Oil price Changes and Their Non-linear Impact on Precious Metal Returns: A Markov Regime Switching Approach. Energ. Econ. 73, 108–121. doi:10.1016/j.eneco.2018.05.024
Wälde, T. W., and Gunst, A. J. (2002). International Energy Trade and Access to Energy Networks. J. World Trade 36 (2), 191–218. doi:10.1023/a:1015519820718
Xiao, Z., and Koenker, R. (2009). Conditional Quantile Estimation for Generalized Autoregressive Conditional Heteroscedasticity Models. J. Am. Stat. Assoc. 104 (488), 1696–1712. doi:10.1198/jasa.2009.tm09170
Appendix A1
Keywords: socially responsible funds, energy commodities, quantile cross-spectral, energy finance, non-linear methods
Citation: Rehman MU, Kashif M, Naifar N and Shahzad SJH (2021) Socially Responsible Funds and Traditional Energy Commodities: A Diversification Perspective for Investments. Front. Environ. Sci. 9:709990. doi: 10.3389/fenvs.2021.709990
Received: 14 May 2021; Accepted: 17 August 2021;
Published: 24 September 2021.
Edited by:
Elias T. Ayuk, Independent Researcher, Accra, GhanaReviewed by:
Sevda Kuşkaya, Erciyes University, TurkeyMuhammad Abubakr Naeem, Massey University Business School, New Zealand
Copyright © 2021 Rehman, Kashif, Naifar and Shahzad. This is an open-access article distributed under the terms of the Creative Commons Attribution License (CC BY). The use, distribution or reproduction in other forums is permitted, provided the original author(s) and the copyright owner(s) are credited and that the original publication in this journal is cited, in accordance with accepted academic practice. No use, distribution or reproduction is permitted which does not comply with these terms.
*Correspondence: Mobeen Ur Rehman, TW9iZWVuLnJlaG1hbkBzemFiaXN0LWlzYi5lZHUucGs=