 Giampiero Grossi
 Andrea Vitali
 Umberto Bernabucci
 Nicola Lacetera*
- Department of Agriculture and Forest Sciences (DAFNE), University of Tuscia, Viterbo, Italy
Natural parks (NPs) have a primary role in supporting people’s welfare by maintaining natural and cultural resources. Various activities, such as those related to conservation of flora and fauna, forestry, agriculture and livestock, residential, and tourism, coexist within the boundaries of NPs. All these activities may contribute as a source or sink of carbon dioxide and, despite some NPs having started to promote their environmental services, there is currently a lack of information on their carbon footprint (CF). Although various international standards have provided guidelines to assess the CF of organizations, a lack of explicit formulation and procedure in these standards makes them difficult to apply, especially when the organizations to be evaluated embed a wide range of biological and anthropogenic activities. The framework proposed in this paper provides for the first time a holistic methodological approach to quantitatively and qualitatively estimate the annual greenhouse gas (GHG) emissions and removals occurring in NPs. The main data needed for the NP’s GHG inventory were directly collected on-site. The activity data and emissions factors as well as the methodologies involved were all referenced to their data sources, including the use of a biogeochemical model, IPCC equations, Ecoinvent database, and a literature review. This method highlighted that, by emitting 0.55 Mg CO2e ha−1 year−1, the NP generates an annual CF of about 3,300 Mg of CO2e. The agricultural activities with 43.4% of share showed the largest incidence, followed by wild fauna (17.8%), tourism (15.1%), and, to a lesser extent, all the other sectors considered in the assessment. On the other hand, when the annual soil and forest C sequestration rates were included in the balance, the NP contributes to sequester about 3.7 Mg CO2e ha−1 year−1, thus resulting in it being an important C-sink site (i.e., about 22,000 Mg CO2e year−1). By providing granular information on GHG emissions and carbon removals trend, the methodological approach involved in this study could help NPs in both planning effective mitigation strategies and supporting environmental certification processes. CF of NPs could increase tourists’ awareness of the important role that these protected natural areas have in climate change mitigation and adaptation.
Introduction
Human activities such as those related to industries, transport, energy, and agriculture have led to the release of anthropogenic greenhouse gases (GHGs) into the atmosphere (Malyan et al., 2016; IPCC, 2019). Fortunately, as society prospers, there is an increasing awareness of the environmental impact of these activities. The Carbon Footprint (CF) is a term used to describe the measurement of GHG emissions generated by a product or an organization. Wiedmann and Minx (2008) define the CF as a measure of the total amount of CO2 emissions that are directly and indirectly caused over the life stages of a product or activity. However, as most of the anthropogenic activities emit other GHGs than CO2 (e.g., CH4, N2O, HFCs, etc.), the term carbon dioxide equivalent (CO2e) is commonly used in CF assessments. Specifically, the term equivalent means that the global warming factor of every GHG is calculated using CO2 as means of comparison (Tjandra et al., 2016). CF assessment may have a wide range of applications in the development of products, environmental policies, and marketing. The applications that, among others, can be highlighted are decision making, research and development, identification of areas of improvement, environmental labeling, and ecological product statement (Calderón et al., 2010).
The ISO 14064–1 is an international standard for quantifying and reporting GHG emissions and removals at the organization level (ISO, 2019). The ISO broadly classified GHG emissions as direct and indirect. The direct GHG emissions are the ones resulting from sources that are owned and controlled by the organization, while the indirect are those that are a consequence of the company’ activities but occur from sources owned or controlled by a different entity. A further classification is represented by the GHG removals. The ISO 14064–1 defines the C stocks as the quantity of C stored in soil organic matter (SOC), above and below-ground biomass, dead organic matter, and harvested wood products. Due to the reversibility of these C stock reservoirs (i.e., these could be re-emitted into the atmosphere), the ISO standards recommends reporting the GHG removals separately from the other GHG emissions, and, in doing so, it suggests expressing the net annual GHG flux as the net sum of CO2e emissions and C-sink from the atmosphere. This reporting aspect became particularly important when assessing CFs of NPs. Indeed, these protected areas, by both increasing C stock reservoirs and preventing the loss of C that is already present in forest biomass and soil organic matter, play an important role in regulating GHG concentrations in the atmosphere and became perfect candidates for mitigation strategies aimed at enhancing forest and land C-sinks.
To the best of our knowledge, there is not a specific methodological approach to assess CF of NPs. Although a study (Villalba et al., 2013) aimed to evaluate the CF of an NP was found in literature, the GHG emissions generated from soil and animals (i.e., wild and domestic) biological processes, as well soil and forest C-sinks dynamics, were outside the scope of that study. The present work aimed (i) to develop a methodological approach based on ISO 14064–1 to assess the CFs of NPs and (ii) to test its applicability on a practical case study.
Material and Methods
Greenhouse Gas Inventory Boundaries of National Park
The system boundary (SB) is the basis used to delimitate the processes included within the assessment of CF based on ISO 14064–1. Within the SB of an NP there are several sectors/activities that could take place, such as (i) nature-based tourism activities (e.g., camping, hiking, fishing, birdwatching, etc.), (ii) tourist facilities (e.g., restaurant, gift shops, hotel, etc.), (iii) construction and maintenance of infrastructure (e.g., buildings, roads, etc.), (iv) residential sector, (v) fauna and flora preservation and, (vi) agricultural and farming activities. The case study was conducted on Castelporziano Nature Reserve (Reserve hereinafter), a residence of the President of the Italian Republic1 that extends from the south-southwest of Rome towards the Tyrrhenian Sea and covers 5,980 ha of land (Figure 1).
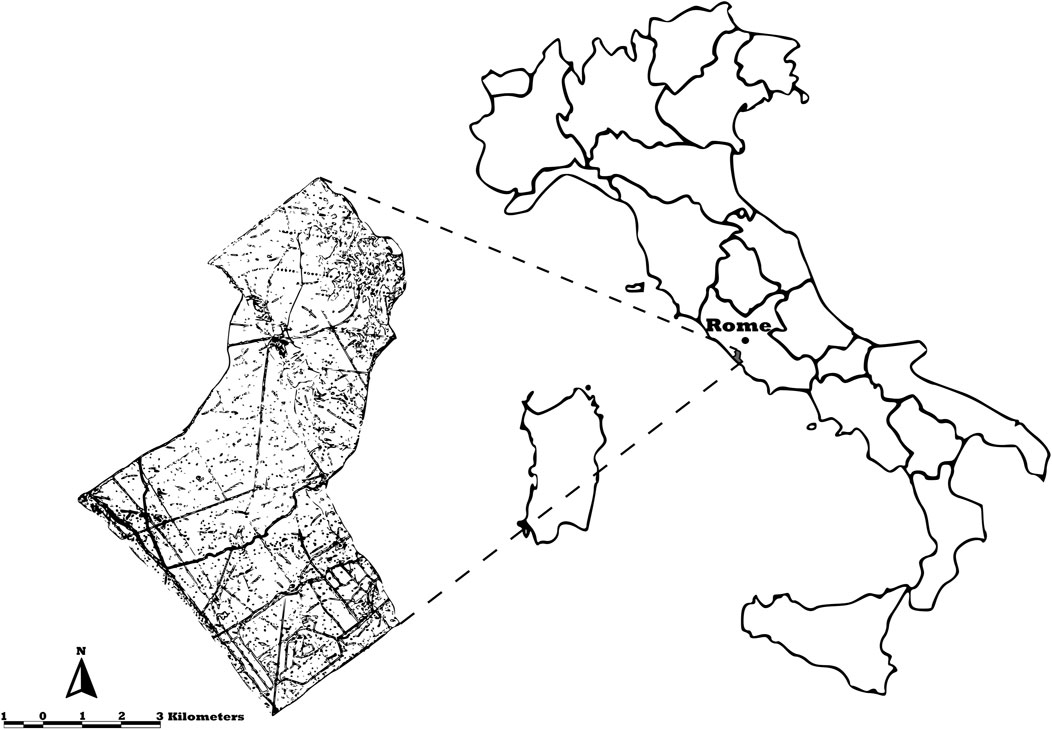
FIGURE 1. Study area, Castelporziano Nature Reserve (Central Italy).
The largest part of the Reserve is covered with natural or semi-natural vegetation, and the area classified as woodland reaches 4,511 ha (i.e., 75.7% of the total). The Reserve can be considered a unique environment in the Mediterranean area since it includes uncontaminated beaches, recent and old stabilized sand dunes, ample back dune wetlands, Mediterranean scrubland, and thickets featuring typical evergreen and aromatic species. Recent investigations show that, within the Reserve, about 90% of the forest areas have maintained their destination use without changes since 1950 (Pignatti et al., 2015). Besides the great range of vegetation, the Reserve hosts native wild boars, fallow deer (Dama), and deer (Cervus elaphus). Small fauna (e.g., foxes, badgers, porcupines, etc.) is also present. Large predators are absent, and no sport hunting is allowed. Within the Reserve, native Maremmana beef cattle and Maremmano horses are bred in pureness, and about 620 ha of the Reserve are dedicated to the pasture and related cropping activities. As regards the touristic attractions, in addition to the several natural routes that can be enjoyed, the Reserve includes buildings from the 14th century, such as the castle and the historical residence. A naturalistic museum, an archaeological museum, and a carriages hall can also be visited. A canteen is open during lunchtime to tourists and Reserve employees/workers. Unless invited to the events organized during the year, tourists visiting the Reserve are not allowed to go inside using their own transportation, and a shuttle bus service is provided during the opening season (from March 14 to June 21). A small residential hamlet (i.e., 24 households) is present within the Reserve, and it is mainly composed of people who are in different ways involved in the activities taking place within the NP. Mechanical and carpentry workshops are also present. Within the Reserve, there are firefighters who patrol the area during the summer season, and security forces, which guarantees the safety of the Presidential Estate all year round. Finally, the Reserve promotes the implementation of scientific research programs aimed at enhancing its environmental and agroforestry-pastoral heritage. In fact, numerous researchers are involved in projects concerning sustainable development, conservation of biodiversity, climate change (CC), and desertification.
Quantification of the Greenhouse Gas Emissions
The boundary system setting involves the categorization of direct and indirect GHG emissions and removals (ISO, 2019). Specifically, direct GHG emissions and removals occur from GHG sources or sinks which are placed inside the boundaries that are owned or controlled by the Reserve. The indirect GHG emissions are those related to the Reserve’s activities but that are generated outside the boundaries of NP’s direct control. The boundary system of the Reserve with the direct, indirect, and GHG removals is shown in Figure 2. A comprehensive inventory of the primary and secondary data involved within each sector can be consulted in the supplementary material (Supplementary Table S1–S8).
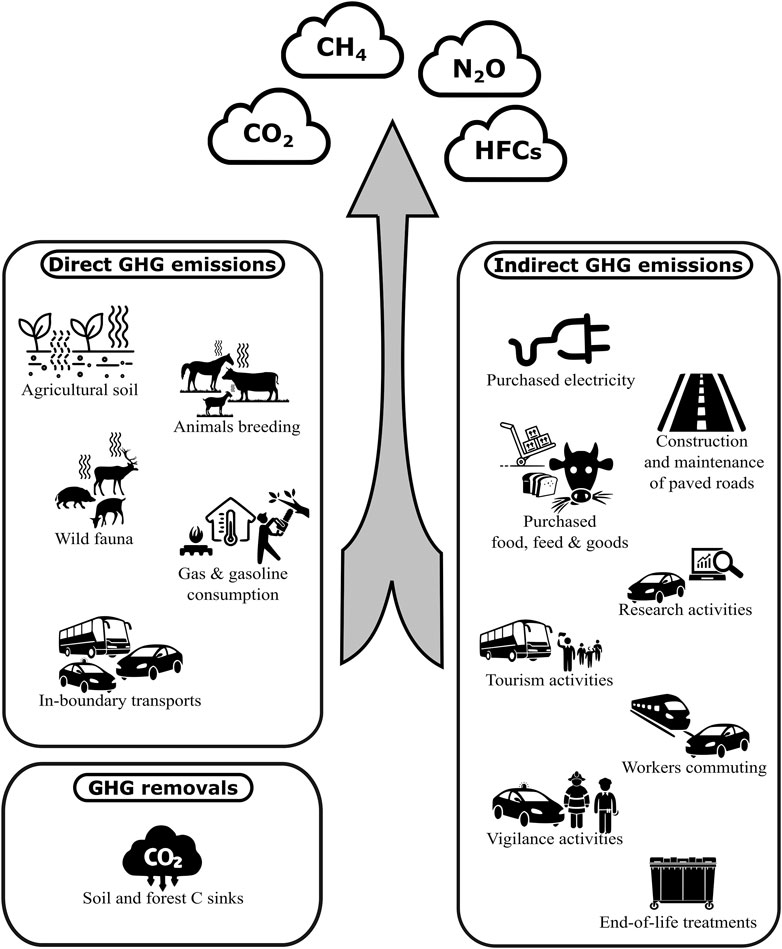
FIGURE 2. System boundaries of the direct, indirect, and GHG removals considered within the Reserve carbon footprint assessment.
Direct Greenhouse Gas Emissions and Removals
The direct GHG emissions within the Reserve’s boundary have included those arising from (i) agricultural soils and animal’s (i.e., wild and domestic) biological processes (ii) energy combustion (i.e., fuel and gas); for farming, forestry, residential, offices, museum, and canteen and transport activity; and (iii) refrigerant gas leaks. Within the direct GHG removals were included the C-sinks related to the agricultural soil and the above-ground forest biomass growth. Below are indicated the methods adopted for accounting for the emissions sources. Further details were reported in the supplementary materials: emission factors (EFs) in Supplementary Table S9, and numbered [1–10] equations in Supplementary Table S10.
Different methods were involved for the estimations of the enteric methane emitted annually by cattle, horses, and wild fauna living within the Reserve. Specifically, the Tier 2 equation (Supplementary Table S10 [1]) proposed by IPCC (IPCC, 2019) was adopted for cattle. The IPCC Tier 1 EF (Supplementary Table S1) was involved for horses, while the equation (Supplementary Table S10 [2]) proposed by Smith et al. (2015) was used for wild animals (i.e., wild boars, fallow deer, and deer).
A Tier 3 approach involving the use of a process-based model named the Denitrification-Decomposition (DNDC) model (Li et al., 2000) was used for the assessment of GHG emissions (i.e., CH4, direct and indirect N2O) coming from the manure deposited on pasture by cattle (Grossi et al., 2020). A Tier 1 (Velthof, 2014; IPCC, 2019) approach was used for the estimations of the GHG from both horses and wild fauna’ manure (Supplementary Table S10 [3–4]).
The GHG emissions generated from the use of fuels (i.e., tillage and motor pumps) and natural gas (i.e., cooking in the canteen and heating office), were accounted for based on the annual consumptions provided by the Reserve and the EFs (Supplementary Table S9) provided by the Ecoinvent database (Wernet et al., 2016) and Bradbury et al. (2015), respectively. The estimation of the natural gas consumption of the several offices and museums placed inside the Reserve was estimated by a combination of primary data, equation (Supplementary Table S10 [5]) proposed by Moreci et al. (2016), and parameters indicated in De Rosa et al. (2015).
The GHG generated during the construction and maintenance of the paved road networks was accounted based on the area occupied by the Reserve’s roads and the EFs (Supplementary Table S9) proposed by Araújo et al. (2014).
The in-boundary transports have considered the use of vehicles inside the Reserve for (i) wild fauna monitoring and census (i.e., by cars), (ii) tourists (i.e., by shuttlebus and cars), (iii) food for canteens (i.e., lorries), (iv) commuting of employees and workers (i.e., by cars and buses), (v) policemen and firefighters’ patrols (i.e., by cars and lorries), and (vi) residents’ and other vehicles’ recorded activity (i.e., by cars). Annual distances traveled inside the Reserve were estimated for all types of in-boundary transports and different EFs (Supplementary Table S9) from the Ecoinvent database, and a bibliography was adopted in relation to the vehicle declared (Wernet et al., 2016; To et al., 2019).
The annual GHG emissions resulting from the refrigerant gas leaked from the fridges (i.e., canteen) and air conditioners (e.g., offices, museums, workshops, etc.) were accounted for based on the total number of devices, and the specific equipment’ gas leaks rates (Cowan et al., 2010; EPA, 2014) (Supplementary Table S10 [9]).
The annual GHG removals attributable to the agricultural soil C-sinks were quantified by using the DNDC model (Grossi et al., 2020). Differently, by assuming an equilibrium state (Demertzi et al., 2016; Peñaloza et al., 2019), the forest soil C-dynamics were not included in the CF. Ultimately, the annual C-sinks related to the annual above-ground forest biomass growth were estimated starting from the Reserve’s forest inventory data provided by Scrinzi et al. (2019).
Indirect Greenhouse Gas Emissions of Reserve
This category includes the GHG for the production, transportation, and end-of-life of goods (durable, and non-durable) functional to the Reserve activities but emitted outside its boundary. As for the direct ones, further details regarding EFs and equations involved in the assessment were reported in the Supplementary Tables S9, S10, respectively.
The GHG emissions generated by the electricity consumption from the Reserve activities (e.g., touristic attractions, offices, workshops, etc.) were calculated using the EF (Supplementary Table S9) referring to the Italian electricity mix provided by the Italian National Inventory of emissions (ISPRA, 2020).
The annual amount of electricity (kWh) was provided directly by the Reserve when available or estimated starting from the inventory of the electronic devices inside the building (e.g., lighting bulbs, air conditioners, PC, etc.) by following the approach (Supplementary Table S10 [6-7-8]) proposed by Tjandra et al. (2016). The annual amount of electricity (kWh) consumed by the residential sector (Supplementary Table S5) was extrapolated from average National statistics data (ISTAT, 2019).
The GHG emissions arising from the life cycle of the durable goods such: agricultural buildings and machinery (Wernet et al., 2016), paved roads (Araújo et al., 2014.), electronic devices (Wernet et al., 2016), and air conditioners (De Kleine, 2009) were accounted considering their potential lifespans. Regarding the non-durable goods, were included the GHG arising from the production of fossil fuel (Wernet et al., 2016), feed for livestock, seeds, and organic fertilizers for cropping (Adom et al., 2013; Wernet et al., 2016; Havukainen, 2018), meals (Wernet et al., 2016; Hanssen et al., 2017; Espinoza-Orias and Azapagic, 2018), kraft paper, and Low-Density Polyethylene (LDPE) used for the packaging (Wernet et al., 2016), printer paper (Wernet et al., 2016), and toners (Kara, 2010) (Supplementary Table S9).
All the GHG emissions generated by the out-boundary transports related to non-durable goods (including their disposal) were estimated considering the type of transports used, the weight carried, the distance driven, and the EFs (Supplementary Table S9) provided by Wernet et al. (2016). Furthermore, working with assumptions, it was possible to estimate the annual GHG emissions generated by the out-boundary transports related to the bus, minibus (Shorter, 2011), and cars involved in tourist activities (Supplementary Table S10 [10]). Particularly, because of the large involvement of organized excursions (e.g., school groups, elderly centers, etc.), it was assumed that all the visiting tourists reach the entrance of the Reserve by tour buses, which have a transporting capacity of 30 people transported for an average distance of 500 km (roundtrip). Regarding the out-boundary transport’ emissions associated with the cars, it was instead assumed that each car arriving at the park carries 2.5 people and drives for 300 km (roundtrip). The GHG emissions associated with the workers and employees commuting were accounted for as well. It was assumed an average commuting distance of 30 km, and that 75% of the employees/workers use their own car, and the remaining use public transport (i.e., bus). Finally, since the distance separating the security and firefighters’ headquarters from the Reserve was already accounted for within the annual kilometers provided by the related representatives, it was assumed that 85% of that distance was driven within the Reserve and the remaining 25% outside the boundary.
The GHG emissions arising from the end-of-life of durable goods, such as air conditioners (De Kleine, 2009), agricultural buildings and tractors (Wernet et al., 2016), and paved roads (Araújo et al., 2014), were assessed considering the associated lifespans. The end-of-life GHG contribution of non-durable goods like toners (Kara, 2010), Kraft papers and LDPE (Turner et al., 2015) to pack meals, and meal waste (Hanssen et al., 2017; Moult et al., 2018) were also accounted for.
Inventory Analysis and Impact Assessment
The annual emissions of CO2, CH4, and N2O were converted according to CO2e (equivalent) using the IPCC 100 years global warming characterization factors (IPCC, 2013), while characterization factors (100 years) provided by Tian et al. (2015) and EPA (2014) were used to convert in terms of CO2e gas leaks of the hydrofluorocarbons (HFCs).
The GHG sinks generated by the Reserve (reported separately from the active emissions) were quantified from the annual C-sinks related to both agricultural soils, and above-ground forest biomass growth. Specifically, the annual C-sinks were converted in CO2e considering the atomic weight of C and the molecular weight of CO2, therefore multiplying the amount of C by 3.67. The use of a DNDC model allowed us to account for soil GHG emissions and annual SOC dynamics (Grossi et al., 2020). Due to lack of data, the forest soil C stock changes were not accounted for and were assumed, according to the Tier 1 IPCC (2019) approach, to currently be in equilibrium (Demertzi et al., 2016; Peñaloza et al., 2019).
Nevertheless, the annual C stored by the growth of the aboveground woody biomass was included. Specifically, from the findings of Project ELITE/SIFTeC, which involved the use of Laser Imaging Detection and Ranging (LIDAR) and Geographical Information System (GIS), it was possible to obtain a detailed inventory of the whole forest area of the Reserve. Particularly, the live epigean biomass of the Reserve’ forest (given by the weight of the significant wood volume and the weight of the twig and foliage) exceeds 800,000 tons (in dry weight), and one million tons in fresh weight (Scrinzi et al., 2019). Therefore, by considering an average amount of 50% C content on wood dry biomass (Thomas and Martin, 2012), and an annual overall forest growth rate of 1.7% (value based on expert opinion), it was possible to account for the annual C sequestered by the aboveground forest biomass growth.
Uncertainty Assessment
According to the GHG protocol and Frischknecht et al. (2007), in all cases where measured single parameter uncertainties are unknown, a pedigree matrix (Weidema and Wesnaes, 1996) can be used to calculate uncertainties. Specifically, the data sources are assessed according to five Data Quality Indicators (DQIs): precision, completeness, temporal representativeness, geographic representativeness, and technological representativeness. Subsequently, each DQI is assigned a data quality rate (i.e., very good, good, fair, and poor), which is then used to estimate quantitatively the overall level of uncertainty.
The approach used in this case study has included a pedigree matrix for quantifying single parameter uncertainty, while a Taylor series expansion (Hong et al., 2010) has been adopted to propagate individual parameter uncertainties and to determine the overall system uncertainty (Bravo et al., 2017). The Taylor series expansion method requires the assumption that the uncertainty distribution for each input parameter is log-normally distributed.
An open-source tool2 developed by the WRI has been used for the quantitative uncertainty assessment of the annual GHG emission arising from the Reserve. Differently, the uncertainty range provided for the annual C-sinks rates coming from the agricultural soil (Grossi et al., 2020) and the aboveground forest growth (Scrinzi et al., 2019) were those reported by the authors of the estimations.
Results
The Natural Reserve of Castelporziano generated a total CF of about 3,300 Mg of CO2e in 2018. The agricultural sector, with a 43.4% share, showed the largest incidence of overall CF (Figure 3). The GHG emissions generated from wild fauna (17.8%) and tourism activities (15.1%) were the second and third sources of GHG, respectively. Lower contributions accounted for paved road networks (5.6%); office, workshops and canteen activities (5.2%); residential sector (4.5%); security/vigilance services (4.1%); research activities (3.6%); and forest management (i.e., pruning) (0.7%).
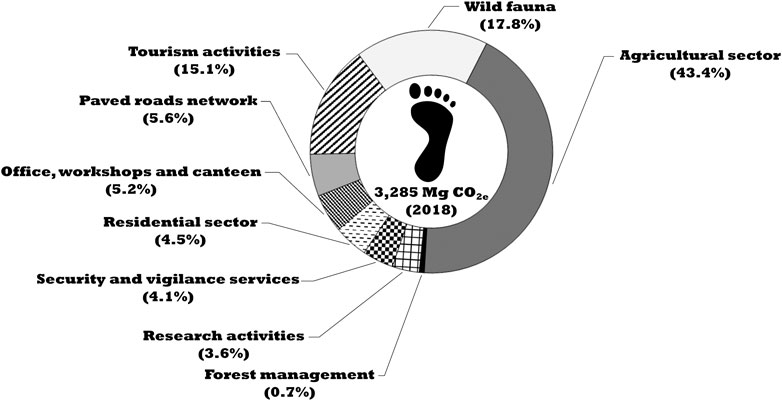
FIGURE 3. Carbon footprint of the whole Reserve area including the incidence (%) of all sectors considered during the reporting year (2018).
Figure 4 shows the shares, both within the total and within each sector, of the direct and indirect GHG emissions, while Table 1 provides detailed information regarding the framework of the overall Reserve’s annual GHG emissions and removals.
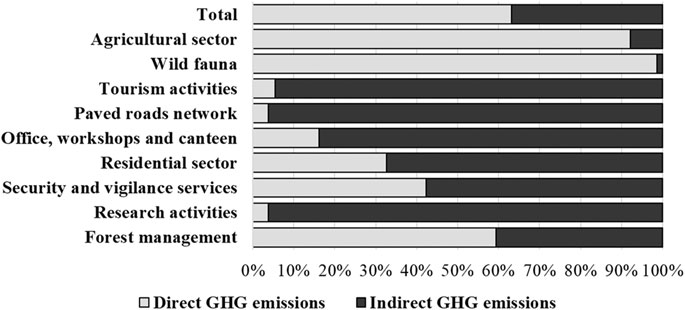
FIGURE 4. Breakdown of the direct and indirect GHG emissions on the total Reserve’ carbon footprint and within each sector considered.
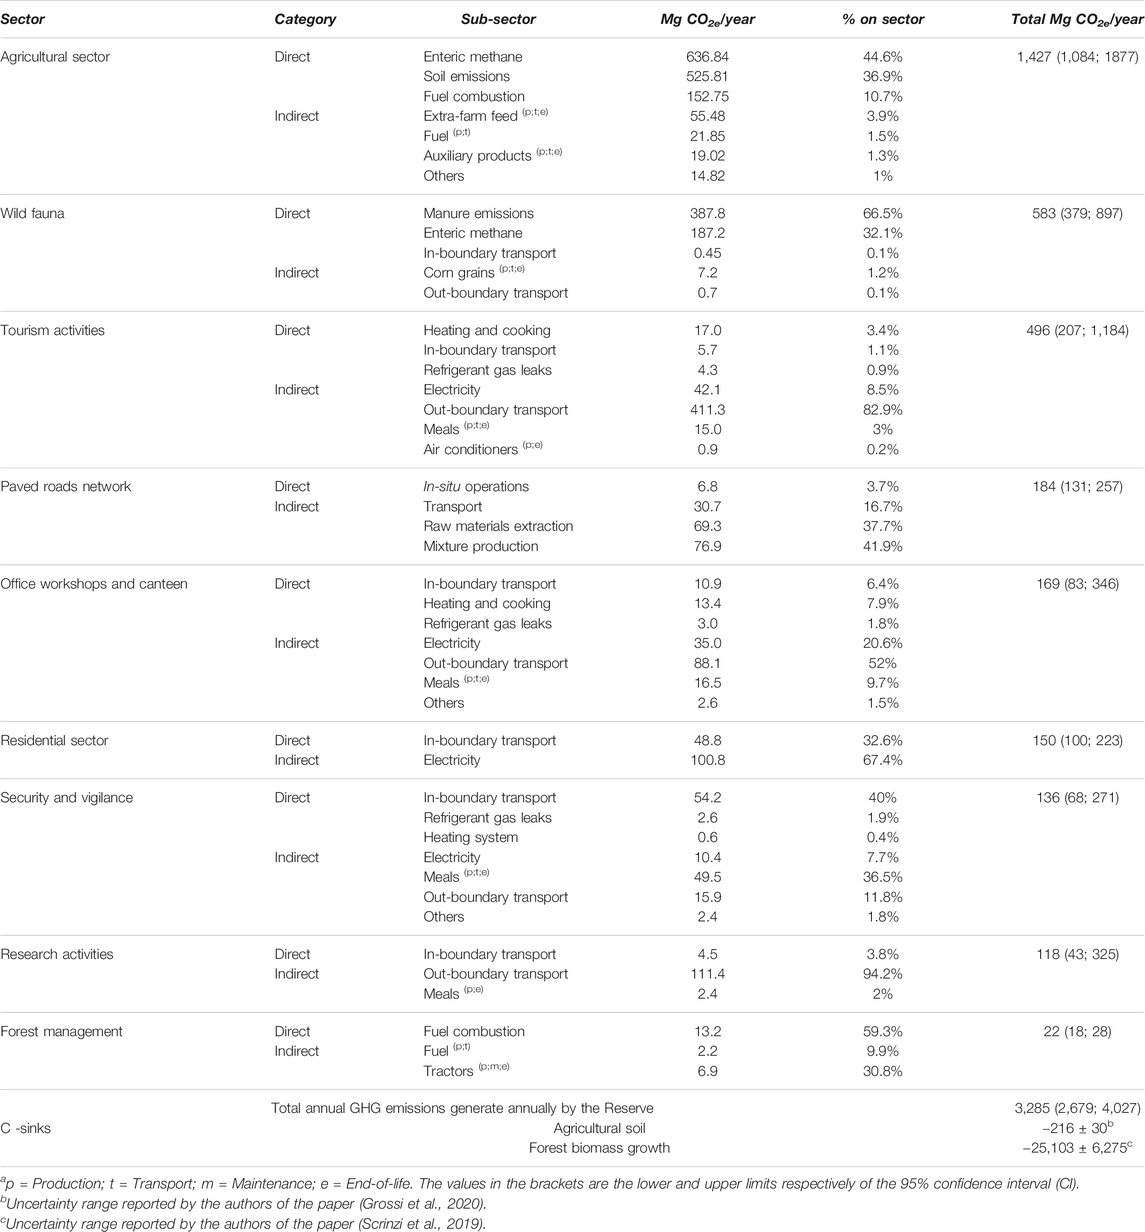
TABLE 1. Overall GHG emissions and sink of the Reserve and incidence of the main emitting sources within each sector.
Greenhouse Gas Emissions From Direct Sources
The annual GHG emissions directly connected to the activities controlled by the Reserve accounted for 63% of the total CF. Specifically, wild fauna (99%), agricultural and livestock activities (92%), and forest management (59%) were the sectors where the direct GHG emissions contribute to the largest share (Figure 4).
Emissions generated by the agricultural sector were about 1,500 Mg CO2e, and, within it, enteric methane (44.6%) from cattle and N2O from soil (36.9%) were the main GHG contributors. Those arising from the wild fauna sector amounted to about 600 Mg CO2e year−1 and were almost totally (99%) attributable to the CH4 and N2O generated by the biological processes involving manure decomposition, and wild ruminant’ enteric methane (Table 1). Lastly, the forest sector generated about 22 Mg CO2e year−1, the combustion of the fossil fuel used for the pruning activities resulted as the main GHG source of the sector.
Greenhouse Gas Emissions From Indirect Sources
The annual GHG emissions indirectly connected to the Reserve’s activities accounted for 37% of the total CF. Individually, research activities (96%), paved roads network (96%), tourism activities (86%), residential sector (67%), and office, workshops, and canteens (63%) were the sectors where the indirect GHG emissions showed the largest incidence (Figure 4).
The GHG (i.e., about 500 Mg CO2e) from the touristic activities came mainly (about 82%) from the out-boundary transports. The raw materials extraction and mixtures production were the main (about 80%) hotspots of the total GHG emissions (180 Mg CO2e) arising from the life cycle of the paved roads (i.e., pre-construction, construction, maintenance, and end-of-life).
The overall activities related to the office, workshops, and canteen accounted for about 170 Mg CO2e. More than 50% of these emissions came from the out-boundary transports associated with the commuting of employees and business trips.
The GHG emissions arising annually from the residential sector were about 150 Mg CO2e, with the domestic’ electricity consumption being responsible for about 67% of this amount.
The whole annual activities associated with the security and vigilance services accounted for about 140 Mg CO2e. The in-boundary transports accounted for 40% of the sector, followed by the homemade meals consumed by the policemen (about 36%).
The out-boundary transports were the main GHG contributor (about 94% of 120 Mg CO2e) of the sector related to the research activities taking place within the Reserve.
Carbon Sinks
The C-sinks resulting from the annual forest above-ground biomass growth accounted for 6,840 Mg of C year−1, corresponding to about 25,000 Mg CO2e year−1. The oak wood (2,353 ha) and pinewoods (1,008 ha), due to the wide area taken within the Reserve, were the tree species showing the largest C- sinks contributions (Supplementary Table S8). The soil organic carbon (SOC) sequestered annually within the Reserve’s agricultural area (620 ha) due to the current soil management and grazing pasture was about 220 Mg of CO2e (Table 1).
Discussion
The GHG emissions generated in 2018 from the whole Castelporziano Reserve sectors were about 0.55 Mg CO2e hectare−1. When including the agricultural soil and forest C-sinks in the CF assessment, the Reserve could be considered as an important CO2 sink that, in terms of net GHG emissions, in 2018 has stored about 3.7 Mg CO2e hectare−1, corresponding to a total of about 22,000 Mg CO2e removed from the atmosphere.
To successfully implement a green marketing strategy that engages the final consumers (tourists in this case) and makes it easier to understand the Reserve’ progress towards the environmental targets, the organizations need to effectively communicate and report their current achievements and future GHG reduction commitments. In this context, the GHG reporting standards defined by the ISO 14064–1, which propose to relate the GHG emissions and removals at organization levels (i.e., occurring within the system boundaries), are an effective way to communicate the progress achieved toward the sustainability. Nevertheless, this type of reporting becomes less suitable when comparing GHG emissions and removals generated by NPs characterized by different sizes. For this reason, in this paper, the GHG results were presented referring also to one representative hectare of the Reserve, a reference unit that lends itself well to cases where GHG comparations between parks different in size are needed.
According to Villalba et al. (2013), a different referring unit (i.e., GHG emissions/visitor-day) could potentially reflect better the annual CF, and the efficiency of the NPs in servicing the tourists. However, it is also true that, because of its potential large year-to-year variability, the application of this unit could fail in representing the effectiveness of specific mitigation strategies implemented during the year. Therefore, although other referring units can be developed and integrated to the one proposed by the ISO 14064–1, the authors agreed that the organization-level and the representative-hectare are the most effective in communicating the environmental goals and in comparing GHG results, respectively.
By providing both a general and a detailed picture of the GHG annually emitted by a system embedding a wide range of physical, chemical, and biological activities, the methodological approach proposed in this study has proved to be suitable in evaluating the CFs of such complex environments. Although characterized by different sizes and incidence, the sectors (e.g., residential, agriculture, public transportations, offices, etc.) included in the CF of the Reserve can be treated similarly to other systems different from NPs. Indeed, due to their analogies, the methodological approaches and the guideline proposed in this study could be suitable also for an estimation of the GHG sources/sinks, which are normally associated with cities and/or productive districts.
Greenhouse Gas Emissions From Direct Sources
When looking at the possible mitigation strategies that could be implemented, the direct GHG emissions are the ones where organizations should focus more considering the larger control exercised on them. However, in the specific case of the Reserve, where the main direct GHG emissions sources have biological origins (i.e., enteric and soil emissions), the reduction strategies need to consider complex interactions between climate, soil, and livestock in order to be really effective.
The losses in gross energy intake associated with the enteric methane of cattle resulted in a consistent contribution (19.4%) to the overall Reserve GHG emissions (Vitali et al., 2018). In pasture-based cattle farming like that investigated in this study, the adoption of adequate pasture management combined with the provision of high-quality hay (when grazing is not feasible) could potentially reduce the enteric CH4 emissions. The lignin content of the forage, which increases during plant maturity, is an aspect that severely affects enteric methane production by reducing plant digestibility and altering nutrient density (Thompson and Rowntree, 2020). Therefore, harvesting forage at an earlier stage of maturity is a practice that could effectively contribute to the reduction of this GHG emission source.
As concern the pasture management instead, the adoption of continuous grazing systems could potentially lead to overgrazing issues, which in turn could reduce plant diversity and increase undesirable or low-quality forages (Thompson and Rowntree, 2020). On the contrary, low-to-moderate grazing density prolonged for a limited time (i.e., rotational grazing) can directly stimulate biomass regrowth, carbon sequestration, and better land utilization (Byrnes et al., 2018). Indeed, the more uniform nitrogen excreta distribution resulting from greater control of the stocking density and grazing duration has been demonstrated to reduce soil N2O emissions (Eckard et al., 2010).
Greenhouse Gas Emissions From Indirect Sources
The out-boundary transports represented about 19% of the overall annual Reserve CF and more than 50% of the total indirect GHG emissions. Generally, within the sectors where transports are the biggest source of GHG emission, exploring a flexible way of working, and engaging people (e.g., tourists, workers, and employees) in reducing travel and commuting, could represent a good mitigation opportunity (McKinnon and Piecyk, 2012). This source of emission is a complex task to reduce and can only be accomplished with the agreement and participation of the stakeholders. For example, the organizations can encourage the use of public transport by offering free shuttle bus from nearby stations to their offices, or a discount on the entrance ticket to the tourists that reach the park using sustainable transports (e.g., public transport, electric vehicle, bicycle, etc.).
The Reserve’s electricity consumption accounted for 16% of the Reserve’s indirect GHG emissions. In this regard, a greater use of energy-saving light bulbs (e.g., in the office, museums, etc.), an optimal thermostat temperature setting of the air-conditioning in the office rooms (Mardookhy et al., 2014), or the switch to a totally renewable energy supply (Amponsah et al., 2014), are just some examples that could be effective in reducing the overall contribution of this scope. However, to reliably quantify the effectiveness of these sector-specific GHG mitigation strategies, attention shall be given to the inventory data collection.
In this context, an effective data lifecycle management based on the digitalization of the key input and output data could help NPs in both keeping track of the information that might make a significant difference in terms of environmental performance and in evaluating the effect of minor sector-specific mitigation strategies that otherwise could remain undetected. In presence of detailed and granular data (e.g., out-boundary distance driven, type of meals, number and type of lighting bulbs, etc.) it becomes then possible to quantify the benefits of equally detailed and granular mitigation strategies (e.g., a more efficient commuting, pattern diet shifts, greater use of energy-saving light bulbs, etc.). This is especially important when assessing those activities resulting in a significant contribution within each sector.
Carbon Sinks
The incidence of the forest sector on the overall Reserve’s CF becomes extremely significant when considering the related GHG sinks dynamics. Indeed, the forest plays a strategic role in carbon balance (Nunes et al., 2019), and protected natural areas can be effective in both preventing conversion of land uses and implementing mitigation strategies. For instance, providing sufficient time for forests to recover, reducing the intensity of each cut (Zhou et al., 2013), replacing dying or low productivity stands, protecting young sprouts from damage after harvest, and planting tree mixes that are more resilient (Bellassen and Luyssaert, 2014) are just some examples of managements that could help enhancing forest C storages.
Wildlife is integral to the life of the forest, and it is therefore normal for animals to feed there and leave signs of their presence. However, animals can cause damage to their environment, ranging from few minor depredations to severe ecological damage that reflects an overall imbalance. Wild boars are effective soil disturbers since, if soil conditions are favorable, they can root to a depth of 1 m (Tyler and Long, 2009). This bioturbation, by breaking up aggregates and aerating the soil, may have negative consequences for forest SOC stocks and can thus cause side effects for the global C cycle and climate change (Liu et al., 2020). Browsing (removal and consumption of young shoots) by cervidae (e.g., deer and fallow deer) is another problem that may affect forest regeneration (Moore et al., 2000), and then the aboveground C-sinks potential of trees. In this context, using a fencing system to prevent wild animals from reaching vulnerable areas is an effective way to prevent damage. Fencing can be permanent or temporary depending on the severity of the damage and seasonal patterns. Furthermore, a reliable census is crucial for any effective resource management or wild animal population control (Franzetti et al., 2012).
In terms of agricultural soil management instead, the adoption of less soil-invasive tillage practices could increase the current annual agricultural soil C-sink rates, which in turn could decrease the overall incidence of this sector on the total. In fact, a switch from the current Reserve’ soil tillage practices (i.e., 30 cm plowing) to no-tillage ones, showed a significant potential reduction (26%) of the GHG emissions arising from the beef cattle rearing (Grossi et al., 2020), which in turn has the potential to reduce the overall Reserve CF by about 8.5%.
Conclusion
To the best of our knowledge, the present study could be considered the first cradle-to-grave Carbon Footprint of a National Park. The proposed methodology is both feasible and suitable in terms of providing a granular picture of the main GHG emission sources and sinks of the Castelporziano Natural Reserve. Although anthropogenic activities such as agriculture and tourism are the main GHG sources within National Parks, mitigating solutions are possible to improve their sustainability. Moreover, the contribution to the C-sink of the protected natural areas may be considered strategic in planning adaptation and mitigation strategies at the country level.
The National Parks, by providing annual Carbon Footprint reports, may both effectively inform public opinion of their contribution to Climate Change and monitor the impact of the adoption of new specific mitigation policies. Finally, the guideline proposed in this paper could be the starting point for developing a widely accepted standard procedure to be followed to obtain environmental declarations (i.e., eco-labeling) for National parks.
Data Availability Statement
The original contributions presented in the study are included in the article/Supplementary Material, further inquiries can be directed to the corresponding authors.
Author Contributions
GG: acquisition, analysis, and interpretation of the data and drafting of the manuscript. AV: Study conception and design, interpretation of the data, and drafting manuscript. UB, NL, and AN: Study conception and design, critical revision.
Conflict of Interest
The authors declare that the research was conducted in the absence of any commercial or financial relationships that could be construed as a potential conflict of interest.
Publisher’s Note
All claims expressed in this article are solely those of the authors and do not necessarily represent those of their affiliated organizations, or those of the publisher, the editors and the reviewers. Any product that may be evaluated in this article, or claim that may be made by its manufacturer, is not guaranteed or endorsed by the publisher.
Acknowledgments
The research was carried out in the frame of the MIUR (MInistry for education, University and Research) initiative “Department of excellence” (Law 232/2016). The authors would like to express their gratitude to the General Secretariat of the Presidency of the Republic, to the Accademia Nazionale delle Scienze “detta dei XL”, to the management of the Estate of Castelporziano, and to the Scientific-Technical Commission of Castelporziano that enabled this study and the publication of the data.
Supplementary Material
The Supplementary Material for this article can be found online at: https://www.frontiersin.org/articles/10.3389/fenvs.2021.706880/full#supplementary-material
Footnotes
1https://palazzo.quirinale.it/residenze/c_porziano_en.html
2https://ghgprotocol.org/calculation-tools
References
Adom, F., Workman, C., Thoma, G., and Shonnard, D. (2013). Carbon Footprint Analysis of Dairy Feed from a Mill in Michigan, USA. Int. Dairy J. 31, S21–S28. doi:10.1016/j.idairyj.2012.09.008
Amponsah, N. Y., Troldborg, M., Kington, B., Aalders, I., and Hough, R. L. (2014). Greenhouse Gas Emissions from Renewable Energy Sources: A Review of Lifecycle Considerations. Renew. Sustainable Energ. Rev. 39, 461–475. doi:10.1016/j.rser.2014.07.087
Araújo, J. P. C., Oliveira, J. R. M., and Silva, H. M. R. D. (2014). The Importance of the Use Phase on the LCA of Environmentally Friendly Solutions for Asphalt Road Pavements. Transp. Res. D: Transport Environ. 32, 97–110. doi:10.1016/j.trd.2014.07.006
Bellassen, V., and Luyssaert, S. (2014). Carbon Sequestration: Managing Forests in Uncertain Times. Nature 506, 153–155. doi:10.1038/506153a
Bradbury, J., Clement, Z., and Down, A. (2015). Greenhouse Gas Emissions and Fuel Use within the Natural Gas Supply Chain - Sankey Diagram Methodology. off. Energy Policy Syst. Anal. 1–22. Available at: https://www.energy.gov/sites/prod/files/2015/07/f24/QER%20Analysis%20-%20Fuel%20Use%20and%20GHG%20Emissions%20from%20the%20Natural%20Gas%20System,%20Sankey%20Diagram%20Methodology_0.pdf (last access April 30, 2020).
Bravo, G., López, D., Vásquez, M., and Iriarte, A. (2017). Carbon Footprint Assessment of Sweet Cherry Production: Hotspots and Improvement Options. Pol. J. Environ. Stud. 26 (2), 559–566. doi:10.15244/pjoes/65361
Byrnes, R. C., Eastburn, D. J., Tate, K. W., and Roche, L. M. (2018). A Global Meta-Analysis of Grazing Impacts on Soil Health Indicators. J. Environ. Qual. 47, 758–765. doi:10.2134/jeq2017.08.0313
Calderón, L. A., Iglesias, L., Laca, A., Herrero, M., and Díaz, M. (2010). The Utility of Life Cycle Assessment in the Ready Meal Food Industry. Resour. Conserv. Recycl. 54 (12), 1196–1207. doi:10.1016/j.resconrec.2010.03.015
Cowan, D., Gartshore, J., Chaer, I., Francis, C., and Maidment, G. (2010). “REAL Zero - Reducing Refrigerant Emissions & Leakage - Feedback from the IOR Project,” in Proc. Inst. Refrig, 1–16. Available at: https://openresearch.lsbu.ac.uk/item/879xq (last access January 17, 2021). doi:10.1093/oxfordhb/9780199542475.013.0015
De Kleine, R. (2009). Life Cycle Optimization of Residential Air Conditioner Replacement. A Report of the Centre for Sustainable Systems. Report no. CSS09-12. Ann Arbor, Michigan. Available at: http://css.umich.edu/sites/default/files/css_doc/CSS09-12.pdf (last access, April 30, 2020).
De Rosa, M., Bianco, V., Scarpa, F., and Tagliafico, L. A. (2015). Historical Trends and Current State of Heating and Cooling Degree Days in Italy. Energ. Convers. Manage. 90, 323–335. doi:10.1016/j.enconman.2014.11.022
Demertzi, M., Paulo, J. A., Arroja, L., and Dias, A. C. (2016). A Carbon Footprint Simulation Model for the Cork Oak Sector. Sci. Total Environ. 566-567, 499–511. doi:10.1016/j.scitotenv.2016.05.135
Eckard, R. J., Grainger, C., and de Klein, C. A. M. (2010). Options for the Abatement of Methane and Nitrous Oxide from Ruminant Production: a Review. Livestock Sci. 130, 47–56. doi:10.1016/j.livsci.2010.02.010
EPA (2014). Direct Fugitive Emissions from Refrigeration, Air Conditioning, Fire Suppression, and Industrial Gases. Washington. Available at: https://www.epa.gov/sites/production/files/2015-07/documents/fugitiveemissions.pdf (last access, April 30, 2020).
Espinoza-Orias, N., and Azapagic, A. (2018). Understanding the Impact on Climate Change of Convenience Food: Carbon Footprint of Sandwiches. Sustainable Prod. Consumption 15, 1–15. doi:10.1016/j.spc.2017.12.002
Franzetti, B., Ronchi, F., Marini, F., Scacco, M., Calmanti, R., Calabrese, A., et al. (2012). Nocturnal Line Transect Sampling of Wild Boar (Sus scrofa) in a Mediterranean forest: Long-Term Comparison with Capture-Mark-Resight Population Estimates. Eur. J. Wildl. Res. 58, 385–402. doi:10.1007/s10344-011-0587-x
Frischknecht, R., Jungbluth, N., Althaus, H. J., Doka, G., Heck, T., Hellweg, S., et al. (2007). Overview and Methodology. Ecoinvent Report No. 1. (Dübendorf: Swiss Centre for Life Cycle Inventories). Available at: https://www.ecoinvent.org/files/200712_frischknecht_jungbluth_overview_methodology_ecoinvent2.pdf (last access, June 21, 2020).
Grossi, G., Vitali, A., Lacetera, N., Danieli, P. P., Bernabucci, U., and Nardone, A. (2020). Carbon Footprint of Mediterranean Pasture-Based Native Beef: Effects of Agronomic Practices and Pasture Management under Different Climate Change Scenarios. Animals 10, 415–417. doi:10.3390/ani10030415
Hanssen, O. J., Vold, M., Schakenda, V., Tufte, P.-A., Møller, H., Olsen, N. V., et al. (2017). Environmental Profile, Packaging Intensity and Food Waste Generation for Three Types of Dinner Meals. J. Clean. Prod. 142, 395–402. doi:10.1016/j.jclepro.2015.12.012
Havukainen, J., Uusitalo, V., Koistinen, K., Liikanen, M., and Horttanainen, M. (2018). Carbon Footprint Evaluation of Biofertilizers. Int. J. SDP 13, 1050–1060. doi:10.2495/SDP-V13-N8-1050-1060
Hong, J., Shaked, S., Rosenbaum, R. K., and Jolliet, O. (2010). Analytical Uncertainty Propagation in Life Cycle Inventory and Impact Assessment: Application to an Automobile Front Panel. Int. J. Life Cycle Assess. 15, 499–510. doi:10.1007/s11367-010-0175-4
IPCC (2013). Climate Change 2013: The Physical Science Basis. Contribution of Working Group I to the Fifth Assessment Report of the Intergovernmental Panel on Climate Change. Editors T.F. Stocker, D. Qin, G.-K. Plattner, M. Tignor, S.K. Allen, J. Boschunget al. (Cambridge, United Kingdom and New York, NY, USA: Cambridge University Press), 1–1535. doi:10.1017/CBO9781107415324
IPCC (2019). Refinement to the 2006 IPCC Guidelines for National Greenhouse Gas Inventories. Editors E. Calvo Buendia, K. Tanabe, A. Kranjc, J. Baasansuren, M. Fukuda, S. Ngarizeet al. (Switzerland: Published: IPCC). Available at: https://www.ipcc.ch/report/2019-refinement-to-the-2006-ipcc-guidelines-for-national-greenhouse-gas-inventories/ (last access January 9, 2021).
ISO (2019). Greenhouse Gases - Part 1: Specification with Guidance at the Organization Level for Quantification and Reporting of Greenhouse Gas Emissions and Removals. Available at: https://www.iso.org/standard/66453.html (last access January 7, 2021).
ISPRA (2020). Italian Greenhouse Gas Inventory 1990-2018. Institute for Environmental Protection and Research Environmental Assessment. ISBN 978-88-448-0993-5. Available at: http://www.isprambiente.gov.it/ (last access April 30, 2020).
ISTAT (2019). Italian National Institute of Statistics. Available at: https://www.istat.it/ (last access, April 30, 2020).
Kara, H. (2010). Comparative Carbon Footprint Analysis of New and Remanufactured Inkjet Cartridges. London: Centre for Remanufacturing and Reuse. Available online at: http://www.ebpgroup.eu/wp-content/uploads/pdf/CCFreport.pdf (last access April 30, 2020).
Li, C., Aber, J., Stange, F., Butterbach-Bahl, K., and Papen, H. (2000). A Process-Oriented Model of N2O and NO Emissions from forest Soils: 1. Model Development. J. Geophys. Res. 105, 4369–4384. doi:10.1029/1999JD900949
Liu, Y., Liu, X., Yang, Z., Li, G., and Liu, S. (2020). Wild Boar Grubbing Causes Organic Carbon Loss from Both Top- and Sub-soil in an oak forest in central China. For. Ecol. Manage. 464, 118059. doi:10.1016/j.foreco.2020.118059
Malyan, S. K., Bhatia, A., Kumar, A., Gupta, D. K., Singh, R., Kumar, S. S., et al. (2016). Methane Production, Oxidation and Mitigation: A Mechanistic Understanding and Comprehensive Evaluation of Influencing Factors. Sci. Total Environ. 572, 874–896. doi:10.1016/j.scitotenv.2016.07.182
Mardookhy, M., Sawhney, R., Ji, S., Zhu, X., and Zhou, W. (2014). A Study of Energy Efficiency in Residential Buildings in Knoxville, Tennessee. J. Clean. Prod. 85, 241–249. doi:10.1016/j.jclepro.2013.09.025
McKinnon, A., and Piecyk, M. (2012). Setting Targets for Reducing Carbon Emissions from Logistics: Current Practice and Guiding Principles. Carbon Manage. 3 (6), 629–639. doi:10.4155/cmt.12.62
Moore, N. P., Hart, J. D., Kelly, P. F., and Langton, S. D. (2000). Browsing by Fallow Deer (Dama Dama) in Young Broadleaved Plantations: Seasonality, and the Effects of Previous Browsing and Bud Eruption. Forestry 73 (5), 437–445. doi:10.1093/forestry/73.5.437
Moreci, E., Ciulla, G., and Lo Brano, V. (2016). Annual Heating Energy Requirements of Office Buildings in a European Climate. Sustainable Cities Soc. 20, 81–95. doi:10.1016/j.scs.2015.10.005
Moult, J. A., Allan, S. R., Hewitt, C. N., and Berners-Lee, M. (2018). Greenhouse Gas Emissions of Food Waste Disposal Options for UK Retailers. Food Policy 77, 50–58. doi:10.1016/j.foodpol.2018.04.003
Nunes, L. J. R., Meireles, C. I. R., Pinto Gomes, C. J., and Almeida Ribeiro, N. M. C. (2019). Forest Management and Climate Change Mitigation: A Review on Carbon Cycle Flow Models for the Sustainability of Resources. Sustainability 11, 5276–5285. doi:10.3390/su11195276
Peñaloza, D., Røyne, F., Sandin, G., Svanström, M., and Erlandsson, M. (2019). The Influence of System Boundaries and Baseline in Climate Impact Assessment of forest Products. Int. J. Life Cycle Assess. 24, 160–176. doi:10.1007/s11367-018-1495-z
Pignatti, S., Capanna, E., and Porceddu, E. (2015). Castelporziano, Research and Conservation in a Mediterranean Forest Ecosystem: Presentation of the Volume. Rend. Fis. Acc. Lincei 26, 265–266. doi:10.1007/s12210-015-0463-9
Scrinzi, G., Colle, G., Presutti Saba, E., Clementel, F., Maffei, L., Tinelli, A., et al. (2019). L'approccio LiDAR/GIS per la realizzazione dell'inventario forestale e del piano selvicolturale della Foresta Presidenziale di Castelporziano. Ifm 74, 341–356. Available at: http://ojs.aisf.it/index.php/ifm/article/view/1172 (last access June 30, 2020). doi:10.4129/ifm.2019.6.01
Shorter, B. (2011). Guidelines on Greenhouse Gas Emissions for Various Transport Types. Winchester Action on Climate Change. Hampshire. Available at: https://www.winacc.org.uk/downloads/STAP/Shorter_Transport%20Emissions%20Report_110328.pdf (last access, April 30, 2020).
Smith, F. A., Lyons, S. K., Wagner, P. J., and Elliott, S. M. (2015). The Importance of Considering Animal Body Mass in IPCC Greenhouse Inventories and the Underappreciated Role of Wild Herbivores. Glob. Change Biol. 21, 3880–3888. doi:10.1111/gcb.12973
Thomas, S. C., and Martin, A. R. (2012). Carbon Content of Tree Tissues: A Synthesis. Forests 3, 332–352. doi:10.3390/f3020332
Thompson, L. R., and Rowntree, J. E. (2020). Invited Review: Methane Sources, Quantification, and Mitigation in Grazing Beef Systems. Appl. Anim. Sci. 36, 556–573. doi:10.15232/aas.2019-01951
Tian, Q., Cai, D., Ren, L., Tang, W., Xie, Y., He, G., et al. (2015). An Experimental Investigation of Refrigerant Mixture R32/R290 as Drop-In Replacement for HFC410A in Household Air Conditioners. Int. J. Refrig. 57, 216–228. doi:10.1016/j.ijrefrig.2015.05.005
Tjandra, T. B., Ng, R., Yeo, Z., and Song, B. (2016). Framework and Methods to Quantify Carbon Footprint Based on an Office Environment in Singapore. J. Clean. Prod. 112, 4183–4195. doi:10.1016/j.jclepro.2015.06.067
To, S., Coughenour, C., and Pharr, J. (2019). The Environmental Impact and Formation of Meals from the Pilot Year of a Las Vegas Convention Food Rescue Program. Ijerph 16, 1718–1727. doi:10.3390/ijerph16101718
Turner, D. A., Williams, I. D., and Kemp, S. (2015). Greenhouse Gas Emission Factors for Recycling of Source-Segregated Waste Materials. Resour. Conserv. Recycl. 105, 186–197. doi:10.1016/j.resconrec.2015.10.026
Tyler, A., and Long, D. B. (2009). Feral Swine Damage and Damage Management in Forested Ecosystems. For. Ecol. Manag. 257, 2319–2326. doi:10.1016/j.foreco.2009.03.036
Velthof, G. L. (2014). Report Task 1 of Methodological Studies in the Field of Agro-Environmental Indicators. Lot 1 excretion factors. Final draft. Alterra, Part of Wageningen UR. Available at: https://ec.europa.eu/eurostat/documents/2393397/8259002/LiveDate_2014_Task1.pdf/e1ac8f30-3c76-4a61-b607-de99f98fc7cd (last access, April 30, 2020).
Villalba, G., Tarnay, L., Campbell, E., and Gabarrell, X. (2013). A Life-Cycle Carbon Footprint of Yosemite National Park. Energy Policy 62, 1336–1343. doi:10.1016/j.enpol.2013.07.024
Vitali, A., Grossi, G., Martino, G., Bernabucci, U., Nardone, A., and Lacetera, N. (2018). Carbon Footprint of Organic Beef Meat from Farm to fork: a Case Study of Short Supply Chain. J. Sci. Food Agric. 98, 5518–5524. doi:10.1002/jsfa.9098
Weidema, B. P., and Wesnæs, M. S. (1996). Data Quality Management for Life Cycle Inventories-An Example of Using Data Quality Indicators. J. Clean. Prod. 4, 167–174. doi:10.1016/S0959-6526(96)00043-1
Wernet, G., Bauer, C., Steubing, B., Reinhard, J., Moreno-ruiz, E., and Weidema, B. (2016). The Ecoinvent Database Version 3 (Part I): Overview and Methodology. Int. J. Life Cycle Assess. 21, 1218–1230. doi:10.1007/s11367-016-1087-8
Wiedmann, T., and Minx, J. (2008). “A Definition of “Carbon Footprint,”,” in Ecological Economics Research Trends. Editor C. C. Pertsova (Hauppauge NY, USA: Nova Science Publishers), 1–11. Available at: http://citeseerx.ist.psu.edu/viewdoc/download?doi=10.1.1.467.6821&rep=rep1&type=pdf (last access, April 30, 2020).
Keywords: national parks, LCA, carbon footprint, carbon sequestration, mitigation
Citation: Grossi G, Vitali A, Bernabucci U, Lacetera N and Nardone A (2021) Greenhouse Gas Emissions and Carbon Sinks of an Italian Natural Park. Front. Environ. Sci. 9:706880. doi: 10.3389/fenvs.2021.706880
Received: 08 May 2021; Accepted: 21 June 2021;
Published: 09 August 2021.
Edited by:
Amit Kumar, Central Muga Eri Research and Training Institute (CMERTI), IndiaReviewed by:
Sandeep K. Malyan, Agricultural Research Organization (ARO), IsraelAshish K. Chaturvedi, Centre for Water Resources Development and Management, India
Copyright © 2021 Grossi, Vitali, Bernabucci, Lacetera and Nardone. This is an open-access article distributed under the terms of the Creative Commons Attribution License (CC BY). The use, distribution or reproduction in other forums is permitted, provided the original author(s) and the copyright owner(s) are credited and that the original publication in this journal is cited, in accordance with accepted academic practice. No use, distribution or reproduction is permitted which does not comply with these terms.
*Correspondence: Andrea Vitali, dml0YWxpQHVuaXR1cy5pdA==; Nicola Lacetera, bmljZ2lvQHVuaXR1cy5pdA==