Corrigendum: A New Method for Standardizing Inland Fish Community Surveys: Characterizing Habitat Associated With Small-Bodied Fish Species, Abundance, and Size Distribution in a Highly Modified Estuary
 Joseph E. Merz
 Meghan J. Camp
 Juniper L. Simonis
 Whitney Thorpe1
- 1Cramer Fish Sciences, West Sacramento, CA, United States
- 2University of California, Santa Cruz, Santa Cruz, CA, United States
- 3DAPPER Stats, Portland, OR, United States
Monitoring fish assemblages in estuary environments is often difficult to standardize due to habitat complexity and gear-specific selectivity. This is further compounded by conventional sampling methods which require fish handling that might cause stress or mortality. To ameliorate these issues, we developed the Single-Platform Aquatic Species and Habitat Sampling System (Platform), an integrated and mobile concentrator net and live box prototype, coupled with a range of physical monitoring equipment. The long-term goal of the Platform is to employ non-invasive sampling techniques such as video and eDNA; however, our aim in this study was to test the Platform’s ability to sample across different habitat types and detect differences in fish assemblages. We investigated the utility of the Platform over a short time period (2 mo) in a relatively small and complex embayment within the highly modified San Francisco Estuary, California. We were able to identify clear physical distinctions among estuary/delta habitat types and detect habitat segregation by ecological groups of sampled fishes with the Platform. The Platform also detected discernable ontogenetic shifts (i.e., size differences) within estuary habitats of commonly observed fish species. These initial results demonstrate the Platform’s ability to contrast fish density, size, and species diversity, which sets the stage to advance more passive monitoring techniques, including video and eDNA methods. The Platform has the potential to fill a methodological gap in non-invasive surveying of small-bodied fish across a range of estuarine habitats, warranting further investigation of potential applications.
Introduction
Estuaries are semi-confined waterbodies occurring where landward freshwater mixes with marine-ward salt water (Pritchard 1967; Moyle et al., 2010). These physically complex systems are naturally exposed to pronounced seasonal environmental variability including salinity and temperature gradients associated with mixed diurnal-semidiurnal tides, seasonal freshwater inflow, wind stress, solar radiation, and atmospheric pressure. As a result, the life cycle of many estuarine organisms have distinct seasonal patterns of migration, growth, reproduction, abundance, and habitat relationships (Stone et al., 1992; Piccoli 2003; Hosack et al., 2006; Bond et al., 2008). Given the immense commercial and recreational value of their ecosystem services and the range of anthropogenic pressures threatening their function, there has been increased efforts put toward restoring impaired estuaries (Baird 2005; Barbier et al., 2011; França et al., 2012). This includes substantial expenditure toward shallow-water and wetland habitat rehabilitation and the challenges associated with such efforts (Rozas et al., 2005; Simenstad et al., 2005). Because significant investment has been made toward largescale estuary restoration, there is a pressing need to define restoration success and quantify habitat use by target organisms over space and time (Zedler and Callaway 2003; Simenstad et al., 2006; DiGenarro et al., 2012), especially where alien plant and animal introductions may reduce potential restoration benefits to native organisms (Brown 2003; Herbold et al., 2014). Monitoring of fish communities, including assessments of biodiversity, stock biomass, and population structure (i.e., genetic structure, size and age frequencies), afford important measures of aquatic environment health at a given point in time (e.g., Babcock et al., 2010; Izzo et al., 2016), providing a potential measurement of estuary restoration success. However, this requires the ability to effectively standardize fish community monitoring across habitats.
Similar to surveys of lentic systems, accurate surveys of estuarine fish communities are difficult because they have distinct physicochemical zones (e.g., littoral, pelagic), often requiring multiple sampling methods (Merz et al., 2011; Pérez-Domínguez et al., 2012; Fischer and Quist 2014a). Use of disparate sampling techniques has often resulted in research focused on describing fish assemblages within individual zones (e.g., offshore: McQueen et al., 1986; Gido and Matthews 2000; littoral: Weaver et al., 1993; Ruetz et al., 2007), rather than whole-waterbody assemblages based on representative sampling with a single gear type across ecotones. Reliance on habitat-specific methodologies limits our ability to quantify and qualify ontogenetic species shifts in estuary habitat use over space and time and our ability to quantify habitat alteration effects on fish behavior and population response (Kjelson and Colby 1977; Layman and Smith 2001; Franco et al., 2012).
Specific sampling gears are often selected based on habitat characteristics, such as sampling area, water depth, temperature, or methodology limitations (e.g., Pierce et al., 1990; Bonar et al., 2009; Baran et al., 2021). For example, the efficacy of beach seining is higher with macrophyte cover, lower over boulders or snags compared to homogeneous substrates, and lower for benthic compared to midwater fishes (Lyons 1986; Pierce et al., 1990; LaPointe et al., 2006). Requiring sparsely vegetated, gently sloping banks for retrieval, seines are also restricted in where they can be effectively deployed. Trawls lack maneuverability, can alter fish behavior, or cause fish injury, making them inappropriate for sampling shallow, complex lentic habitats (Engås et al., 1998; Kaartvedt et al., 2012; Davis 2002). Thus, the composition of captured fish assemblages depends on the gear used and the environmental conditions of the sampling site, which may limit our ability to interpret and compare results across habitat types (Eggleton et al., 2010; Fischer and Quist 2014b).
Lack of standardized sampling methods across habitat types also impairs our ability to monitor fish species across multiple life stages and size classes because different methods are often biased for different life stages and sizes (Pope and Willis 1996; Lucena and O’Brien 2001; Rountree and Able, 2007). Freshwater and estuarine environments are commonly sampled with different gears at specific times of the year due to temporal shifts in fish habitat use (e.g., summer offshore fish movement, spawning) and variable fish recruitment to different sampling gears. For instance, young cohorts of small-bodied lentic species that hatch in spring may not be susceptible to standard sampling methods until the following year, whereas age-0 large-bodied species hatched during spring may be collected during their first fall (Fischer and Quist 2014a; Lankowicz et al., 2020). Furthermore, sensitive early life stages of many fish species require off-channel or vegetated littoral habitats, but these life stages are often under-sampled due to limitations of traditional monitoring techniques, which limits our ability to track how environmental conditions influence ontogenetic habitat shifts (Rozas and Minello 1997). Habitat-specific gear deployment and size-specific capture limitations of gear might cause under- or over-representation of certain life history strategies in fish monitoring data (Miller et al., 2010). Therefore, the ability to standardize sampling across habitats, especially open water (pelagic) and shallow, complex, nearshore (littoral) habitats, is particularly important for accurate biological assessments and could strengthen our ability to measure habitat restoration success and improve the adaptive management process (Bonar et al., 2009; Fisher and Quist 2014b).
Thus, the need to increase estuary sampling standardization requires development of methods that can feasibly sample in and across shallow, complex, and open water habitats. However, this is further complicated when focal species are endangered because most conventional sampling methods require fish capture and handling, which is stressful to fish and can cause mortality to target species or by-catch (Romero, 2004; Ellender et al., 2016; Castañeda et al., 2020). To overcome these challenges, we developed the Single-Platform Aquatic Species and Habitat Sampling System (hereafter, “Platform”; US Patent Numbers 9,776,692 and 10,259,541B2; seeMerz et al., 2021), an integrated and mobile concentrator net and live box prototype. The Platform was developed to 1) improve sampling representation and catch efficiency across aquatic habitats; 2) minimize or prevent lethal take of sensitive fish species, and 3) simultaneously collect additional biotic (e.g., zooplankton and larval fish) and abiotic data (e.g., water quality and depth) by combining new technologies that integrate fish sampling with key ecological attributes of occupied habitats.
In this study, we conducted a preliminary investigation of the Platform’s ability to detect habitat use, species assemblages, and ontogenetic shifts of small-bodied estuarine fish. We sampled during the dry, hot summer period when we assumed biotic pressures of relatively high fish densities, competition, and predation would drive habitat associations (Gasith and Resh 1999; Bonada and Resh 2013). This allowed us to address the following questions: 1) Can the Platform detect clear physical distinctions between estuary/delta habitat types? 2) Can the Platform standardize fish sampling across habitats, especially open water (pelagic) and shallow, complex, nearshore (littoral) habitats? 3) Can the Platform detect habitat segregation by important ecological groups of estuary/delta fishes? 4) Can the Platform detect ontogenetic shifts by fish among sampled habitat types? Our goal was to test the Platform’s ability to answer these questions and thereby set the stage to advance passive monitoring techniques. Our hope was that once these questions were answered, future Platform applications, including passive video monitoring and eDNA methods could be tested, which could reduce fish handling and stress (Castañeda et al., 2020).
Materials and Methods
Study Area: Sacramento-San Joaquin Delta and Mildred Island
The San Francisco Estuary (37° 51′ N, 122° 22′ W) is the largest estuary (approximately 1,235 km2) on the west coast of the United States (Lehman et al., 2004; Oros and Ross 2005; Figure 1). It is formed by the confluence of ocean water transported into the estuary by tides and freshwater runoff from California Coast Range streams and the Sacramento-San Joaquin Watershed. The Sacramento-San Joaquin Watershed collectively drains approximately 163,000 km2 (40% of California’s surface area), including the western slope of the Sierra Nevada and the Central Valley, into the San Francisco Bay, Suisun Bay, and the Sacramento-San Joaquin Delta (hereafter, “Delta;” Van Geen and Luoma 1999; Moyle 2002; Sommer et al., 2007). The estuary has been heavily modified since California’s Gold Rush in the mid-19th century (Atwater et al., 1979; Nichols et al., 1986). Over the past 170 yr, large-scale conversion of marshes fringing south San Francisco Bay, Suisun Marsh, and the Delta to agriculture, municipal, and industrial uses has removed 95% of historical estuary wetlands (Sommer et al., 2007). Other principal changes to the estuary included river channelization and dredging, levee stabilization, large woody debris removal, substantial flow regime alteration, and introductions of alien organisms. The levels and effects of invasive species are so pronounced in the estuary that it has been called the most invaded habitat on the planet (Cohen and Carlton 1998).
FIGURE 1
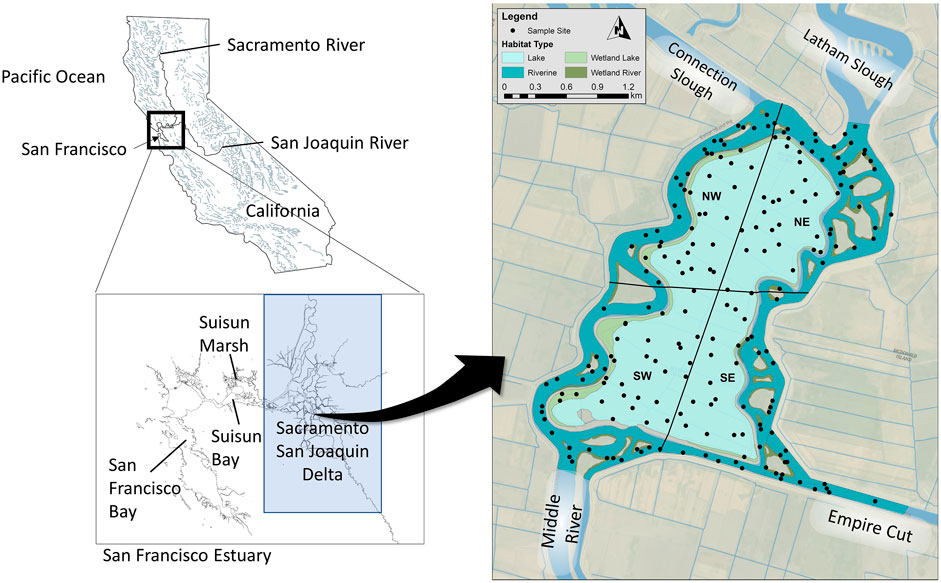
FIGURE 1. Sampling locations within Mildred Island in relationship to the Sacramento-San Joaquin Delta, and San Francisco Estuary of California.
The Delta is a complex physical system that transitions from a strictly riverine regime at its landward margin to a tidally oscillating interconnected network of channels, leveed islands, and open water areas (Lucas et al., 2006). The mostly freshwater Delta ecosystem is subject to numerous physical influences. Operating over time scales ranging from hours to months, these influences are both natural and anthropogenic and include: mixed diurnal-semidiurnal tides, river and stream inflow, wind stress, solar radiation, density variations due to salinity and temperature gradients, fluctuations in atmospheric pressure, large-scale water removal in the southern Delta via pumping by the federal Central Valley Project and State Water Project, within-Delta agricultural diversions and returns, and operation of within-Delta gates and barriers (Lucas et al., 2006). Before the California Gold Rush of the 1850s, the Delta (Figure 1) was composed of about 1,400 km2 of marshes and swamps that were subjected to tidal inundation (Gilbert 1917; Rojstaczer and Deverel 1995). Beginning in the late 19th Century, levees were constructed, and lowlands drained for agriculture. By the 1930’s, hundreds of islands and tracts were drained and ∼2,250 km of levees were constructed (Thompson 1957). Island water levels are generally maintained at 1–2 m below land surface by drainage ditch networks and this drainage caused island soils to oxidize and subside.
Our study was performed at Mildred Island (MI), a flooded and subsided central Delta farm tract (Figure 1). Mildred Island is an example of shallow water habitat resulting from levee breaches adjacent to subsided lands. Flooded in 1983, this open water habitat has an average depth of 5 m, tidal range of 1 m, surface area of 4.1 km2, length of 3 km, width of approximately 1 km, and maximum tidal currents of order 0.1 m s−1 (Monsen et al., 2002). Irregular boundaries create relatively calm coves and perimeter levee breaks provide local hydrodynamic connections with adjacent river channels (Lucas et al., 2002). A major levee opening in the north (Figure 1) allows tides to move into MI from northern Middle River and Connection Slough, with a peak tidal discharge of 300 m3 s−1 (Monsen et al., 2002). Smaller southern and eastern openings (peak tidal discharge of 8 m3 s−1) provide weaker tidal connections with southern Middle River, Empire Cut, and Latham Slough (Monsen et al., 2002).
Mildred Island consists of still-water habitat, dominated by alien aquatic vegetation, invertebrates, and fish species introduced primarily from the eastern and central United States (Nobriga and Feyrer 2007; Hestir 2010). Sharp spatial chlorophyll a (chl a) gradients have been observed in previous MI studies, with increasing concentrations toward the south, which were partially attributed to north-south hydrodynamic differences (Lucas et al., 2002). A numerical model of tidally driven hydrodynamics showed currents were most intense in northern MI due to the larger, deeper opening there (Monsen et al., 2002). The southeast corner, where chl a concentrations were consistently highest, experienced much weaker currents. The consequent spatial difference in tidal excursion and hydraulic residence time appeared to contribute to greater phytoplankton biomass in the south than north (Monsen et al., 2002).
Mildred Island provides a tractable setting to test the Platform’s ability to study habitat-fish interactions relevant to other estuary environments. Its relatively small size and simple geometry permits spatially intense water quality measurements (Lucas et al., 2006) and sampling of fish communities (Young et al., 2018) throughout the habitat and outside its boundaries. MI is like other shallow embayments subjected to tides, wind, and heating; therefore, the variability, processes, implications, and techniques discussed here are relevant to countless other systems (e.g., coastal lagoons, marshes, deltas) where these effects are present. Other similar habitats are expected to be created in the Delta, either intentionally through large-scale ecosystem restoration (CALFED 2000; Lucas et al., 2002; Jacobs et al., 2003; California Bay-Delta Authority, 2004), or unintentionally through unplanned and unanticipated levee failures (Mount and Twiss 2005). Thus, this short-term study of habitat variability and fish community interaction within a flooded farm tract enhances our understanding of how future Delta habitats may function, while testing the Platform’s utility.
Habitat Typing and Site Selection
We selected our study sites using the U.S. Fish and Wildlife Service (USFWS) habitat classification and mapping tool (http://dx.doi.org/10.1007/BF00045196), which is based on Cowardin et al. (1979) definition of wetlands, the National Standard for wetland mapping, monitoring, and data reporting as determined by the Federal Geographic Data Committee in 2013. We identified and mapped four habitat types (Esri™ ArcMap 10.2.2) for the MI study area: openwater lake habitat (Lake), Lake Wetland, openwater riverine (Riverine), and Riverine Wetland. Due to spatial differences in the environment, we divided the study area into four quadrants: northeast (NE), northwest (NW), southeast (SE), and southwest (SW). Each quadrant contained all four habitat types. It should be noted that “river” and “riverine” reflect a naming convention common to the study area. These channels have the physical characteristics of deep tidal sloughs, not rivers.
A total of 25 sites were randomly placed within the polygons of each quadrant by habitat permutation using the Random Point tool in ArcMap (Figure 1). We selected 25 sites because we had 18 days budgeted for field sampling and we anticipated sampling a total of 16 sites per day, or roughly two per hour. Therefore, we estimated that 288 sites could potentially be sampled, equating to 22.15 sites within each of the 16 quadrant and habitat type combinations. Three additional sites were added to the sampling scheme to account for the possibility that some sites would be inaccessible due to shallow depth or dense cover. A total of 325 random sampling sites were generated as points in ArcMap, given a 15.2 m buffer radius, and converted to polygons. The buffer allowed transect inclusion even when the precise starting point was inaccessible (e.g., piling, tree, land, rocks, etc.).
On each sampling day, we sampled each of the four habitat types within a single quadrant at least once. The four habitat types within a quadrant were sampled cyclically so that habitat sites were not clustered in time within a sampling day (i.e., sites within a quadrant were visited as follows: lake wetland, riverine, lake, riverine wetland, riverine, lake, etc.). Upon reaching a site, the direction of travel was determined by heading roughly parallel to the nearest bank with the bank on the vessel’s starboard side. This was the priority direction to begin the transect but was only intended to serve as a general starting direction because the platform is designed to contour habitats, and not simply travel in straight lines. The continued Platform direction was determined by the shape of the polygon within which it was sampling.
At each site, we aimed to perform a 5-min transect (5 min, maximum). In areas where the transect was within a relatively small habitat polygon, a shorter transect time was performed, and the transect ended before the Platform ran outside the habitat type within which it was sampling. Quadrants were sampled four times each over the 6-wk sampling period. Visits to each quadrant were scheduled to remain as cyclical as possible so that they were spread equally over the sampling period. Transects were sampled on 18 days between 26 July and 31 August 2018, with 3–18 transects on a given day.
Sampling
Single-Platform Aquatic Species and Habitat Sampling System
The Platform was designed to simultaneously collect fish and an array of coincident biotic and abiotic data in a variety of habitats (Figure 2). It is a modified pontoon boat with a concentrator net attached at its front that runs between two 7.3 m pontoons and attaches to a removable livebox mounted underneath the boat’s deck where sampled water and associated fish can be accessed during operation (Merz et al., 2021). The net is approximately 5.5 m long and is composed of two mesh size sections, 38 mm toward the mouth and 6 mm toward the cod end. The rigid net mouth is 2.4 m wide by 1.2 m high and is hydraulically controlled from the steering console to lower and raise the net mouth depending on desired sampling depth. The current prototype samples depths of approximately 0.4–3 m from the water surface. The boat is propelled by two independently controlled, 50 hp outboard motors, providing the handling and turning radius required for sampling along structure and in shallow water conditions (Figure 2). During this study, the Platform was operated at approximately 1.5 m s−1 (water velocity). The Platform operator skirted the edge of hard objects, such as rock outcroppings and tree trunks greater than approximately 0.1 m.
FIGURE 2
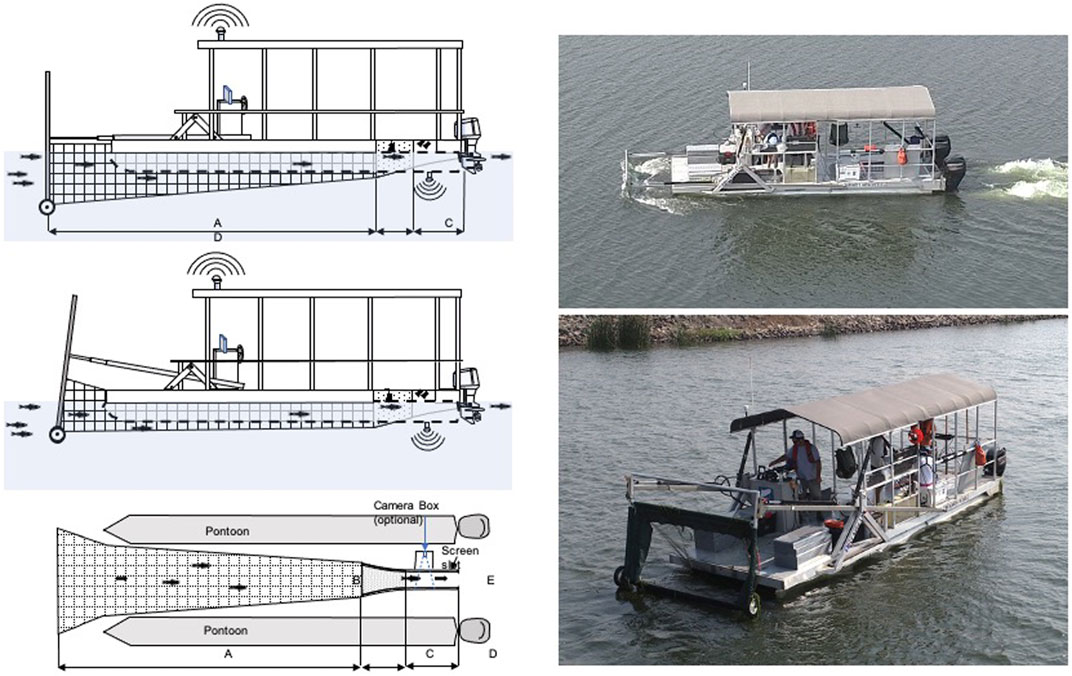
FIGURE 2. Left Top: Diagram of the Single-Platform Aquatic Species and Habitat Sampling System (Platform). Vertically adjustable fyke net (surface to 3 m) fits between two pontoons (transparent in illustration to show live box) and terminates at live box near vessel aft where video images, captured fish, and water quality parameters are recorded. Wheels at the rigid net frame bottom allow rolling over benthos in shallow water. Left Middle: Hydraulic net frame can be adjusted to compensate for water depth and net tension. Left Bottom: Top-down diagram of Platform (work deck removed) displaying the concentrator net (A length = 5.5 m), and live box [B opening = 68.6 cm wide; C perforated aluminum (6 mm holes) section = 105.9 cm long; D solid aluminum plate section = 83.5 cm long, and E live box exit = 32.9 cm wide]. Screen is mounted into slot for active fish capture but can be removed for passive flow through in conjunction with optional camera box (not used in this study). Right Top: Platform operating with net fully submerged within Mildred Island. Right Bottom: Platform with net fully retracted from water.
Physical Conditions
Spatial data were collected using a Lowrance® HDS Gen2 GPS unit connected to an 83/200 kHz transducer mounted to the Platform (Figure 2). Transducer sonar and GPS spatial data were recorded at approximately 5–15 records per second over each transect. These data included date (Y:M:D), time (HH:MM:SS), latitude (DD), longitude (DD), water depth (m), vessel speed over ground (knots), and water temperature (°C). We used a Trimble® GeoExplorer (GeoXH) 6,000 and accompanying TerraSync (v5.11) and Pathfinder Office (v5.30) software to record latitude (DD), longitude (DD), and altitude (m) at 1 s intervals for the duration of each transect. These additional spatial data were recorded if the Lowrance® failed to collect this information accurately or completely.
The length (linear meters) of each transect sampled was estimated using a General Oceanics mechanical flowmeter (Model 2030). Total revolutions per transect was counted by the flow meter and converted to linear distance through the water using standard equations (General Oceanics reference manual; Brandis and McLain 2001). Water volume sampled was calculated by multiplying the number of linear meters traveled per transect by net mouth opening. When shallow water prevented the Platform’s net from being completely submerged, the proportion of net submerged was considered when estimating water volume sampled.
Water quality data were collected using a YSI®/Xylem® Inc., EXO2 multiparameter sonde, recording information at one second intervals for the entire duration of each transect. The sonde was mounted at the front of the boat immediately behind the entrance/opening of the net (approximately 30 cm below water surface) to collect water quality data as water passed through the net and over the sonde. This water represented environmental conditions fish were exposed to as they were funneled through the net. Sonde data included: date (Y:M:D), time (HH:MM:SS), latitude (DD), longitude (DD), temperature (°C), atmospheric pressure (mmHg), dissolved oxygen [(DO) mg/L and percent saturation], specific conductivity (µScm), conductivity (µScm), total dissolved solids (mg/L), salinity (ppm), pH, turbidity (NTU), total suspended solids (mg/L), and total chl a (µg/L).
Biological Conditions
All captured fish were identified to the most resolved taxonomic level and enumerated. Fork lengths (FL, mm) of the first 20 randomly selected individuals of each taxon were measured to reduce time expended on fish processing. All captured fish were released following data collection at each capture site. Each sample transect took three people approximately 25–30 min to sample and process fish. Total number of fish captured, relative taxa abundance, and water volume sampled were enumerated for each sample. To standardize catch data, we calculated catch-per-unit-effort (CPUE) by dividing catch by estimated water volume for each sample.
Fish identification in the Delta presented some challenges. The presence of non-native species in the Delta that are capable of hybridizing with closely related congeners has created a “melting pot” of genetic variation that makes species identification based on visual morphological characteristics challenging (Whitmore and Hellier 1988; Pierce and Van Den Avyle 1997). Morphological identification can also be difficult for juvenile fish, which are encountered at a small size and with underdeveloped physical characteristics.
To mitigate some of the visual identification uncertainty, tissue samples (caudal fin clip) from 11 unidentified juvenile and/or cryptic species were collected during the surveys and analyzed genetically using an iterative sequencing process. We used a Qiagen Blood and Tissue Kit (Qiagen, Valencia, CA, United States) to extract DNA from collected tissues. Each sample was subsequently Sanger sequenced at the Cytochrome Oxidase Subunit I (COI) region, using primers designed by Ivanova et al. (2007). Resulting sequences were compared with sequence data in the public National Center for Biotechnology Information (NCBI) database to determine genus. All sequence data available in NCBI for members of the relevant genus were downloaded into Geneious PrimeⓇ v.2019.2.3. Subsequently, MUSCLE alignment (Edgar 2004) was used to determine if identification to species was possible with the available COI data. If COI was incapable of confirming a sample to species, then two additional mitochondrial regions were Sanger sequenced (12S, Cytochrome Oxidase B (Cyt B)) (Kocher et al., 1989; Koepfli and Wayne 1998). These additional data were evaluated as described for COI. A species determination was made when the sequenced region was >97% identical to the reference sequences for a given species.
Statistical Analyses
Environmental Conditions
As an integrated measure, we used the mean value of each habitat parameter (chl a, temperature, TDS, depth, DO, salinity, and µScm) measured continuously over each transect. To determine if there were differences in mean chl a, temperature, TDS, depth, DO, salinity, and µScm among the habitat types and quadrants, we conducted a mixed-effects multivariate analysis of variance (MANOVA), with the seven habitat parameters as the response variables; habitat type, quadrant, and the interaction between habitat type and quadrant as fixed effects; and sample date as the random effect. We constructed the three orthogonal contrasts for habitat type as Riverine vs. Lake, Riverine Wetland vs. Lake Wetland, and Wetland (both lake and riverine types) vs. non-wetland (both riverine and lake types). We used the standard three treatment contrasts for quadrant effects.
Prior to the MANOVA, we standardized (mean 0, standard deviation 1) each habitat variable to put them on the same scale for comparison purposes. We conducted a classic Principal Components Analysis (PCA) on the standardized variables and plotted the results of the first two axes to visually compare each habitat variable. We also measured the Pearson’s correlation coefficient between pairs of variables to determine how related they were to each other. Two Riverine transects were missing habitat data due to equipment malfunction and were removed from these analyses. We fit the MANOVA, conducted the PCA, and measured correlations using the manova, princomp, and cor.test functions (respectively) in the stats package of base R (v3.6.1; R Core Team, 2019).
Fish Communities
Most captured fish were identified to one of 16 species, although some individuals were identified as unknown within a taxonomic grouping (specifically, “unknown Micropterus,” “unknown Lepomis,” “unknown Alosinae,” and “unidentified”). We probabilistically allocated these individuals among the constituent taxa according to their proportions across all identified individuals on that day. On days when no individuals were identified among the constituent taxa, the proportions across the whole data set were used. Allocation was done using a multinomial distribution, and we repeated the procedure 1,000 times to obtain a distribution of the possible species-level counts across the data set. For simplicity, we focus on the mean or a representative draw from the distribution; full results are available in the Supplementary Material.
We characterized fish assemblages using species richness, total abundance, and species composition (considering presence-absence and accounting for relative abundances of species). We modeled the number of species present and the total number of individual fish using mixed effects linear models. For each model, we fit transect-level data as a Poisson variable in a generalized mixed effects linear model with a log link. We included habitat type, chl a, temperature, total dissolved solids (TDS), and depth as fixed effects; sample date and quadrant as random effects; and the sample volume as the observation weights in both models. We fit models using the glmer function in R (v3.6.1; R Core Team, 2019) package lme4 (v1.1-21; Bates et al., 2015), using the same contrasts for habitat type as outlined for the MANOVA. All continuous variables were standardized prior to model fitting.
Dissimilarity was measured using the Bray-Curtis metric (Bray and Curtis 1957) for both presence-absence and abundance data. Transects with no fish present were removed prior to analyses because they are not defined under the Bray-Curtis metric. The PerMANOVA models were fit using the adonis function in the vegan (v2.5-6; Oksanen et al., 2019) package in R (v3.6.1; R R Core Team, 2019) with 9,999 permutations. We graphically represented the composition using two-dimension non-metric multidimensional scaling (NMDS) with each version of the data (presence-based and abundance-based). The NMDS plots were constructed using the metaMDS function in the vegan (v2.5-6; Oksanen et al., 2019) package in R (v3.6.1; R Core Team, 2019) with a maximum of 10,000 model runs; no auto-transformation; and convergence criteria of 10,000 iterations, scale factor 1–10, and stress ratio 1-1−10. These settings allowed the NMDS algorithm to search longer within a run and more quickly arrive at convergent solutions among runs.
Focal Species
Finally, we evaluated size distributions of three common species (i.e., American Shad (Alosa sapidissima), Bluegill Sunfish (Lepomis macrochirus), and Mississippi Silverside (Meniia audens) sampled from across the four main habitat types. To reduce potential bias introduced from sub-sampling, each subsample was extrapolated to the sample and the statistics calculated for the entire sample for each method and habitat (Bettoli and Miranda 2001). We used generalized linear mixed models with log-scale fork-length as the response, habitat type (with above-defined contrasts) as a fixed effect and quadrant and date as random effects. We fit a comparison model without habitat type but with the random effects to allow for an omnibus evaluation of the effect of habitat type on length. Models were fit using the lmer function in the lme4 (v1.1-21; Bates et al., 2015) R package (v3.6.1; R Core Team, 2019).
Results
Physical Conditions
From 26 July to 31 August 2018, 205 transects totaling an estimated 77.1 km of habitat (227,176 m3 of water) were sampled. Individual transects ranged from 39.2 to 1,815.5 m3 (mean 1,118.6 m3). The measured environmental variables displayed notable correlation, especially among TDS, salinity, and SPC (∼1.0; Table 1). Therefore, we condensed those three covariates into TDS (the most relevant and directly measured of the three). The resulting set of habitat variables that we used for the analyses included TDS, chl a, depth, temperature, and DO.
TABLE 1
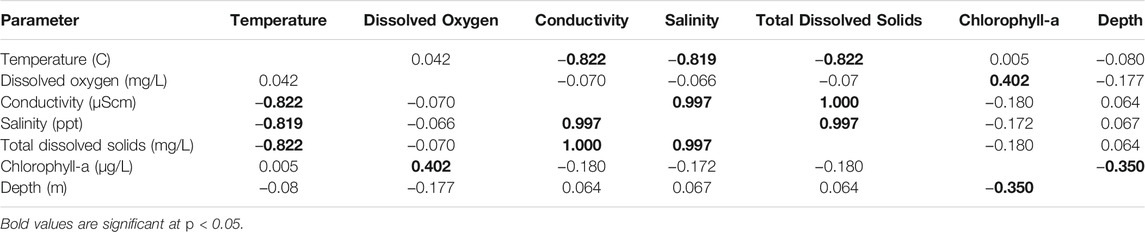
TABLE 1. Correlation matrix for physical covariates measured at Mildred Island, within the Sacramento-San Joaquin River Delta, 26 July to 31 August 2018.
The MANOVA results indicated significant variation in physical habitat based on habitat type (p < 0.0001; Pillai’s trace: 1.31; approximate F: 18.47; degrees of freedom: 3, 21/498), quadrant (p < 0.0001; Pillai’s trace: 0.37; approximate F: 3.30; degrees of freedom: 3, 21/498), and the interaction (p < 0.0001; Pillai’s trace: 0.96; approximate F: 2.99; degrees of freedom: 9, 63/1190). This was reflected in the PCA plot (Figure 3), which displayed consistent patterning among habitat types and quadrants. In particular, Axis 1 was positively associated with temperature and negatively associated with TDS and Axis 2 was positively associated with depth and negatively associated with DO and chl a. The habitat types segregated along both axes, Lake habitat tended to be less variable along Axis 1 (positively associated with temperature, negatively with TDS) than Riverine and Wetland habitats. Wetlands were substantially more variable along Axis 2 (positively associated with depth, negatively with DO and chl a), indicating wetlands were shallower and more productive than the other two habitat types. The PCA also showed clustering of samples based on quadrant, highlighting the spatial component of the physical variability.
FIGURE 3
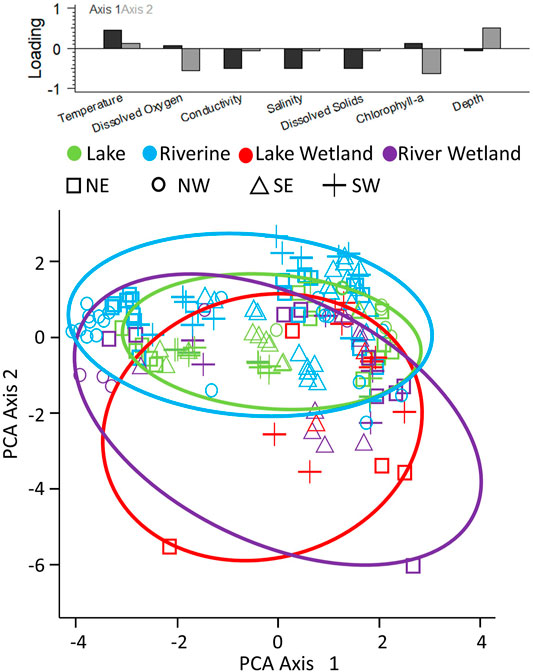
FIGURE 3. Principal Components Analysis plot, with the two major axes depicted. Points are color-coded by habitat type and different point types show different regions. Ellipses are drawn to encompass all points within each habitat type and are color-coded to match the points. The top plot shows the loading of each variable on each of the two major axes.
In general, the variables that differed consistently across habitat types were depth and chl a concentration, with wetland samples coming from shallower, more chl a-rich water (Table 2). Although there was substantial variation among samples, those from the southern quadrants tended to be from warmer water and those from the eastern quadrants tended to be from water with higher chl a concentrations (Table 2). Further, the NW quadrant had distinctively higher TDS, salinity, and conductivity, possibly due to proximity to more brackish components of the system (Figure 1).
TABLE 2
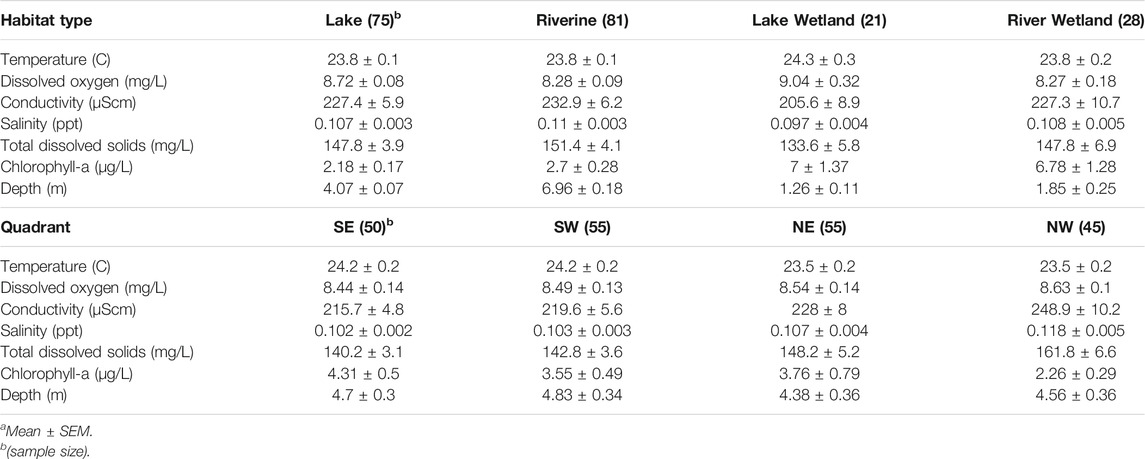
TABLE 2. Covariate valuesa across habitat types and quadrants of Mildred Island within the Sacramento-San Joaquin River Delta, California.
Biological Conditions
Across all 205 transects, 24,213 fish were sampled (representing 16 species), with individual transects containing between zero and 3,410 fish (Table 3). Accounting for volume differences among transects, the average fish density (CPUE) was 0.495 fish/m3 (range: 0–16.72 fish/m3). The number of individuals was negatively and significantly related to chl a, temperature, TDS, and depth (all p < 0.0001) (Table 4). The highest relative CPUE was observed in the NW quadrant (32.5%) and lowest in the SE quadrant (15.6%). Wetlands were, on average, the most fish-dense habitats, which manifested as a significant non-wetland-vs.-wetland contrast (p < 0.0001) (Table 4). Lake Wetland habitats also tended to be more fish-dense than Riverine Wetland habitats (p < 0.0001), but that was not the case for non-wetland lakes and rivers (p = 0.80). There was notable variation in species richness among dates and quadrants (random effects standard deviations: 1.276 and 0.989, respectively).
TABLE 3
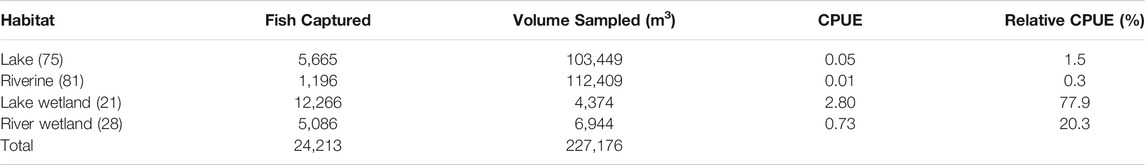
TABLE 3. Fish catch per unit effort by habitat type (sample number) within Mildred Island, Sacramento–San Joaquin Delta, 1 July to 31 August 2018.
TABLE 4
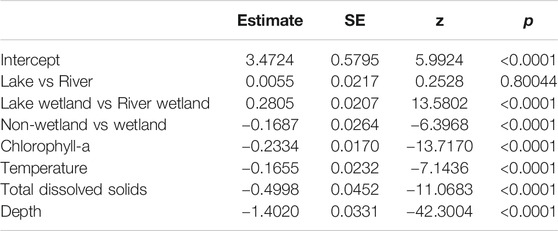
TABLE 4. Fixed effects from the statistical model of total abundance within Mildred Island, Sacramento-San Joaquin River Delta, California.
Of 16 fish species collected, 94% (15) were non-native (i.e., alien) (Figure 4). Sample richness ranged from zero to nine species (of the 16 possible), with a mean of 2.6 species/transect or 0.008 species/m3 (range: 0 to 0.111 species/m3). The number of species was significantly negatively related to TDS (p = 0.019) and depth (p = 0.029), but not affected by chl a (p = 0.75) or temperature (p = 0.43) (Table 5). Wetlands were more species-rich than non-wetlands (p = 0.021), whereas Lake and Riverine did not differ for either non-wetland (p = 0.306) or wetland (p = 0.625) habitats (Table 5). There was modest variation in species richness among dates and quadrants (random effects standard deviations: 0.278 and 0.137, respectively); in general, species richness decreased over the relatively short sampling period.
FIGURE 4
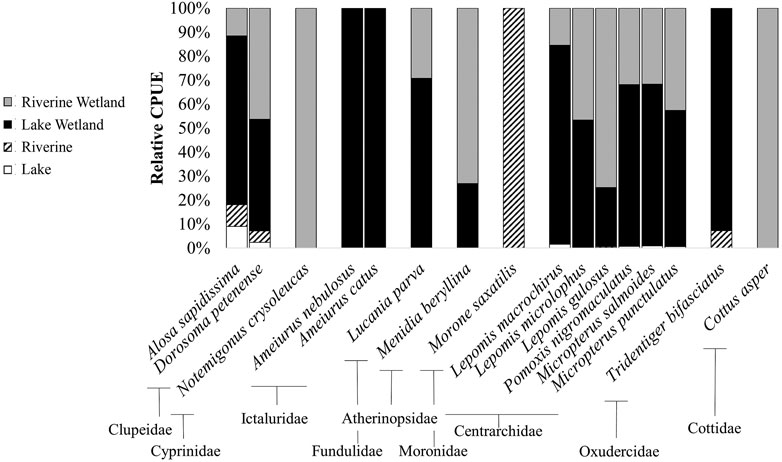
FIGURE 4. Relative Catch Per Unit Effort (CPUE) for 16 fish species, depicting overall habitat use patterns in Mildred Island within the Sacramento-San Joaquin Delta, California, 26 July to 31 August 2018.
TABLE 5
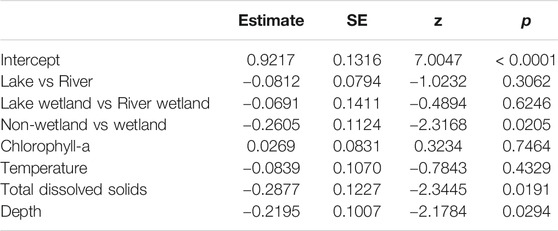
TABLE 5. Fixed effects from the statistical model of species richness within Mildred Island, Sacramento-San Joaquin River Delta, California.
Fish assemblage composition varied in systematic and significant ways (Figure 4). From a presence-perspective, species composition was significantly influenced by habitat type (p < 0.0001), temperature (p = 0.030), TDS (p = 0.038), and depth (0.010), but not chl a (p = 0.21) (Table 6; Figure 5). Comparatively, when also considering relative species abundances, only habitat type (p < 0.0001) and depth (p = 0.007) significantly influenced composition (Table 7; Figure 5).
TABLE 6

TABLE 6. ANOVA table for the permutational statistical model of presence-based species composition.
FIGURE 5

FIGURE 5. Non-metric Multidimensional Scaling plots for the presence-based (left; stress: 0.085) and abundance-based (right; stress: 0.128) community composition data. Colors and shapes of points match the Principal Components Analysis plot (Figure 3), as do the colors of the ellipses, which are drawn to enclose all observations within the habitat types. The two axes in each plot are on the same scale, allowing plotting in space without axis lines. Oval size indicates relative number of species observed. Species are: American Shad (AS), Black Crappie (BC), Bluegill Sunfish (BS), Brown Bullhead (BB), Golden Shiner (GS), Inland Silverside (IS), Largemouth Bass (LB), Prickly Sculpin (PS), Rainwater Killifish (RK), Redear Sunfish (RS), Spotted Bass (SPB), Striped Bass (STB), Threadfin Shad (TS), Warmouth (WM), White Catfish (WC), Shimofuri Gobi (SG).
TABLE 7
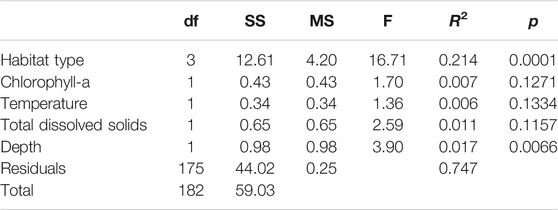
TABLE 7. ANOVA table for the permutational statistical model of abundance-based species composition.
The presence/absence and abundance figures were similar, indicating abundance information did not provide additional differentiating characteristics among samples (Figure 5). The first NMDS axis was the direction of most differentiation and demonstrated species composition segregated by habitat type. However, habitat types did not show consistent variability in distributions across wetland groupings. For instance, Lake and Riverine Wetland were more variable than Lake Wetland and Riverine. There was also differentiation along the second axis, but it appeared to be grouped less by habitat type and more by general variability. Species/taxa grouped in a few notable ways (Figure 5). First, along the primary axis three or four groups were observed, with Striped Bass being the farthest, followed by clupeids. A relatively large species cluster occurred to the right of the first axis in the area of overlap for all four habitat types, indicating that many species used all habitat types.
There were notable differences in lengths of the three focal species among habitat types. American Shad (χ2 = 24.84, df = 3, p < 0.0001), Bluegill Sunfish (χ2 = 48.39, df = 3, p < 0.0001), and Inland Silverside (χ2 = 27.40, df = 3, p < 0.0001) showed significant variation in length among habitat types (Table 8; Figure 6). Further, while all three species showed among-date length variance, only American Shad had non-0 variance among quadrants (Table 8).
TABLE 8
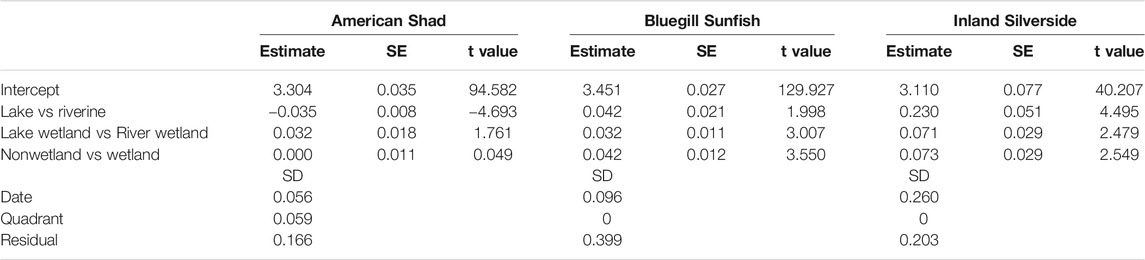
TABLE 8. Statistical model results for fixed and random effects in the length analyses for all three species.
FIGURE 6
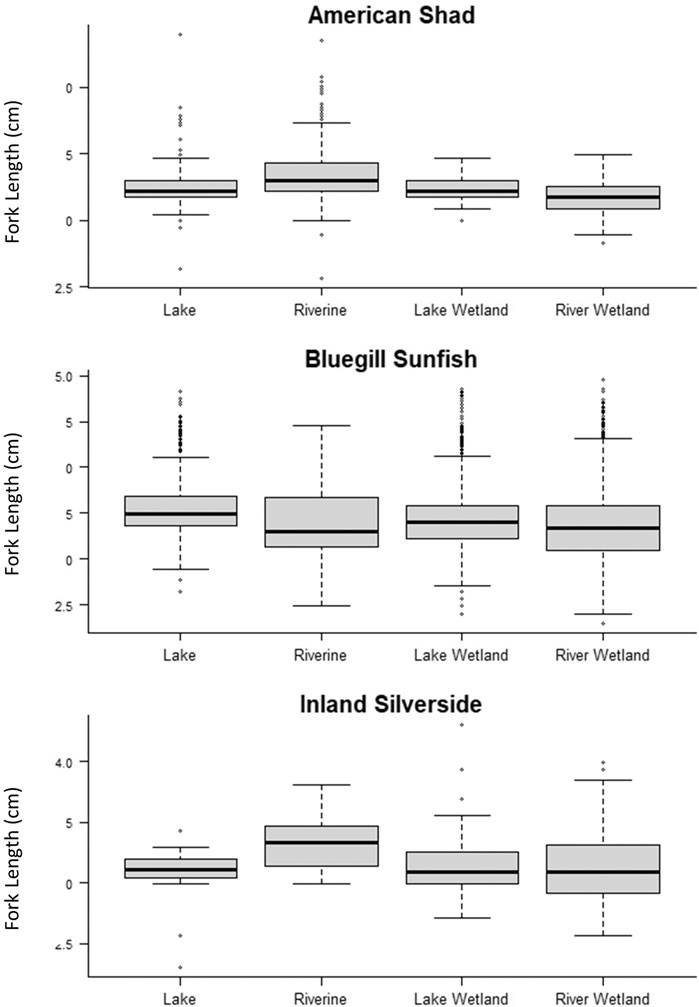
FIGURE 6. Boxplots of fork lengths of individual fish sampled in the different habitat types for the three focal species.
Discussion
Our study demonstrated the Platform can collect standardized environmental and fish species data within predetermined habitat types. The accurate detection and description of habitat-specific physical and biological data is critical to predicting and monitoring changes in ecosystem function that may result from habitat modifications (Craft et al., 2009). Fish community assessments are often based on sampling with multiple gear-types. However, multivariate methods used to assess community structure and composition are sensitive to differences in the relative scale of indices or abundance measures produced by disparate sampling techniques, making data combination from different methods a serious challenge (Gibson-Reinemer et al., 2017). Within this relatively short and intensive study, we demonstrated how this challenge can be overcome by using the Platform for sampling, which allows for the evaluation of general shifts in small-bodied estuary fish community attributes with environmental conditions.
Can the Platform Detect Clear Physical Distinctions Among Estuary/Delta Habitat Types?
The Platform successfully detected differences in physical conditions among estuary/delta habitat types. Depth and chl a differed consistently across habitat types. In general, wetlands were relatively shallower and more chl a-rich, while Lake and Riverine habitats had higher conductivity. Southern quadrant habitats tended to be relatively warmer, while eastern quadrants demonstrated higher relative chl a concentrations. Our findings are consistent with the research of Monsen et al. (2002), who found strong north–south residence time gradients in MI, suggesting that heat, plankton, and dissolved substances accumulate in the southeastern region because of slow tidal mixing, but not in the northeast region where tidal exchanges with the outer channel system are rapid. However, they found higher conductivity in the southern MI quadrants in June 2002. In contrast, we observed distinctively higher TDS/salinity/conductivity within the NW quadrant compared to other quadrants, likely due to its proximity to the more brackish components of the system and because our study took place primarily in August. Similarly, Feyrer and Healey (2003) observed higher conductivity in July and August within the San Joaquin River. It is important to note that Delta outflow is dramatically lower in late summer and this may explain the clear difference in conductivity between June and August (Knowles 2002).
Furthermore, the Platform was able to detect subtle differences in physical conditions among habitat types. Even though wetland habitats from both riverine and lake areas were relatively shallower and more productive than Lake and Riverine habitats, the Platform was able to differentiate Riverine Wetland from Lake Wetland, with Lake Wetland relatively shallower and more productive. Our results generally agree with previous monitoring results within the MI habitat complex and demonstrate the Platform’s ability to measure differences in environmental conditions known to influence fish communities (Lucas et al., 2006). This suggests that the Platform is capable of tracking and monitoring incremental changes in primary productivity and other habitat conditions as a result of future planned or unplanned modifications to the estuary environment. This is especially important in the Delta because it is an inherently low productivity ecosystem (Jassby et al., 2002). Phytoplankton is the main food supply to primary consumers but has been on the decline in the Delta (Jassby and Cloern 2000; Jassby et al., 2002). Declines in Delta fish abundance are a result of multiple interacting stressors, one of which is the decline in primary productivity in the pelagic food web that provides forage for early feeding stages (Nobriga, 1998; Kurth and Nobriga, 2001). Recovery of endemic fishes could be facilitated by the creation of new Delta habitats designed to increase primary production in the pelagic food web. Mildred Island is a flooded, subsided farm tract, which represents potential habitats expected to be created through future modification or restoration to the San Francisco Estuary (Lucas et al., 2002; Jacobs et al., 2003; Mount and Twiss 2005). The Platform provides a potential method to monitor spatial and temporal variability in physical conditions within and among habitats. This is essential for designing and monitoring restoration strategies most appropriate for individual ecosystems.
Can the Platform Standardize Fish Sampling Across Habitats, Especially Open Water (Pelagic) and Shallow, Complex, Nearshore (Littoral) Habitats?
In this study we were able to sample small-bodied fish in a range of habitats using a single method and collect comparable results to those from boat electrofishing, a more conventional and invasive method (Dolan and Miranda 2004). Over an 18-day sampling period, we observed 16 fish species within MI. Comparatively, Young et al. (2018) captured 27 species using boat electrofishing within four tidal San Francisco Estuary Lakes (Sherman Lake, Big Break, Franks Tract, and Mildred Island) over 4–5 mo for 2 yr, and 23 of those species were caught in MI. Non-native centrarchids (e.g., Largemouth Bass, Redear Sunfish (Lepomis microlophus), and Bluegill (Lepomis macrochirus) comprised roughly 80% of their samples and Largemouth Bass was the most abundant species observed in MI (Young et al., 2018). Similarly, centrarchids made up approximately 82% of the fish we captured; however, Bluegill Sunfish was the numerically dominant fish in our study as opposed to Largemouth Bass. This was potentially due to the differences in the size of fish captured by the Platform versus boat electrofishing. However different sampling periods cannot be ruled out as an explanation for the differences observed. We only detected one native fish, the Prickly Sculpin (Cottus asper). This is not surprising considering the relatively short sampling period during the stressfully warm summer season in a highly invaded area of the Delta (Brown and May 2006). Furthermore, we specifically chose this sampling window to avoid catch of sensitive native fishes. While this did hinder our ability to evaluate the Platform’s ability to catch native fishes, we were still able to demonstrate its utility for standardized sampling of small-bodied fishes across habitat types known to influence fish distributions.
Can the Platform Detect Habitat Segregation by Important Ecological Groups of Estuary/Delta Fishes?
The Platform detected habitat segregation by ecological groups of estuary/delta fish based on the effects of both environmental conditions and habitat classification. Salinity was relatively low and the fish community we observed in MI was dominated by alien centrarchids with relatively low salinity tolerances (Peterson 1988; Wootton 1998). In general, we observed greater species richness and relative CPUE in the northern MI regions, which also had generally higher TDS. However, overall, we saw a negative relationship between TDS and species abundance. It is important to note that similar to other San Francisco Estuary research (e.g., Feyrer and Healey 2003), conductivity, TDS, and salinity co-varied, making it difficult to determine which condition or interactions between conditions might have influenced fish distribution and abundance. For instance, Peterson and Meador (1994) articulated that salinity cannot be viewed as the sole factor influencing freshwater fish within the Southeastern United States (the regional source for many of the alien species we observed in this study); several other factors in saline environments could contribute to fish responses, including habitat complexity, competition, and predator-prey interactions (Orth et al., 1984). In the present top-level study, the degree of correlation prevented us from disentangling potential differences between salinity and turbidity. However, the Platform collects fine-scale environmental data and future studies can more thoroughly explore potential differentiation among these variables.
We also detected differences in fish densities among habitat types. Wetlands, on average, had the highest fish densities, likely because wetlands were shallower and relatively more productive than Lake and Riverine habitats (Mullin 1995).We also observed greater fish densities in nearshore compared to open water habitats, which is consistent with previously observed trends of increases in abundance and diversity of fish species in response to increased submerged aquatic vegetation (Scott and Angermeier 1998; Hudon et al., 2000). Nearshore habitats tend to have relatively greater structural and vegetative community complexity compared to deep water habitats and therefore tend to have higher species abundance and diversity (Brooks et al., 2004; Willis et al., 2005). The pattern we observed appears to occur throughout the Sacramento-San Joaquin Delta; fish are able to use food resources derived from the expanding submerged and floating aquatic macrophytes, and littoral fish biomass, particularly fishes in the Centrarchidae family, have increased compared to pelagic, open water fishes (Thomson et al., 2010; Mahardja et al., 2017; Young et al., 2021).
Furthermore, the Platform detected distinct differences in fish densities between Riverine and Lake Wetlands. Lake Wetlands tended to be more fish-dense than River Wetlands. The differences we observed in small-bodied fish habitat use between Lake and Riverine Wetlands are likely due to a range of factors such as water residence time, salinity, temperature, sediment and nutrient loads, migration corridors, and predator-prey interactions (Cyrus 1992; Eby and Crowder, 2002; Martino and Able, 2003; Attrill and Power, 2004; Zhang et al., 2009; DeMartini et al., 2013).
The Platform was able to detect clear trends of fish assemblage composition, which varied in systematic and expected ways among and within habitat types. The NMDS plots logically grouped more pelagic fish (i.e., Striped Bass, Threadfin Shad, and American Shad) together along the x-axis (the primary axis of variation; Figure 5). We observed a second, large grouping along the x-axis of numerous ubiquitous invaders, including centrarchids (e.g., Bluegill and Redear Sunfish, Spotted and Largemouth Bass, etc.). This is a logical grouping because these fish generally show similar habitat preferences of slower moving, warm water with adequate submerged vegetation (Berra 2007). The only native species sampled, the Prickly Sculpin, was grouped alone to the far right on the x-axis (Figure 5). Inland Silversides fell between the pelagic and ubiquitous invaders group along the x-axis. They tended to be more prevalent in Riverine Wetland habitat (e.g., shallow and vegetated) and less in open water habitats than the two shad species or Striped Bass, yet preferred moderate to fast tidal currents, differentiating them from the other species observed (Weinstein 1986). The large separation of Golden Shiner and Brown Bullhead along the y-axis (the secondary axis of variation) is likely due to differences in their morphology and ecology compared to the other groupings. The Brown Bullhead is an ictalurid with a markedly different body form and feeding adaptations (i.e., mouth shape and position) than centrarchids, which could explain its separation from the other groupings (Wootton 1998). The Golden Shiner is a deep-bodied minnow and shoaling bait fish, which could explain its separation along the y-axis.
Was the Platform Able to Detect Ontogenetic Shifts Among Habitats?
We observed significant variation in fork length among habitat types for all three of our focal species (i.e., American Shad, Bluegill Sunfish, Inland Silverside). Both Inland Silversides and American Shad were generally larger in open water areas of the Riverine habitat compared to other habitats, and Bluegill Sunfish tended to be largest in open water Lake habitat. This is likely because smaller individuals are generally weaker swimmers so they might avoid the faster, deeper water of the Riverine habitat or the open Lake habitat to avoid predation (Werner and Hall 1988). The lack of quadrant effect on the size of fish we measured might be because variables within habitat types were a stronger driver of how these three species perceive habitat as they grow and develop than quadrant-specific variables (seeTable 2). Nevertheless, the Platform was able to detect relatively small differences in fish size as it related to environmental variables.
Platform Utility, Limitations, and Next Steps
The results of this initial Platform test demonstrate the potential value of this novel and comparatively benign sampling method for collecting standardized small-bodied fish community and environmental data across a variety of estuarine habitats. Changes within a dynamic system, such as the Delta, with scarce and declining endemic species, numerous biotic invasions, and chronic anthropogenic disturbance, requires nimble, low-impact monitoring equipment that can articulate fish assemblages among habitats and locations (Castañeda et al., 2020). The ability to identify fish species and relative density associations more precisely with quantifiable habitat and environmental variables can help us determine how future conditions might influence ecosystem function. For example, submerged aquatic vegetation has expanded to nuisance levels in the Delta (Jassby and Cloern, 2000; Brown and Michniuk, 2007). While we did not specifically measure habitat complexity due to the preliminary nature of this study, areas with complex structure have long been recognized as important habitat for small-bodied fish, including juveniles (Laegdsgaard and Johnson 1995; Beck et al., 2001; Heck et al., 2003; Gratwicke and Speight 2005) and the Platform has the potential to collect standardized fish data across structured and adjacent unstructured areas. It is important to note that this study was preliminary in nature, and there are inherent weaknesses in performing a relatively short and intense survey. The limited duration and timing of the sampling (i.e., during the hottest period of the summer) limits our ability to make conclusive observations about fish-habitat associations in MI. As such, the fish assemblage and habitat association results from this study should be viewed with caution.
Although not the focus of this study, unlike traditional fish sampling methods, the Platform can also collect water quality, eDNA, plankton and invertebrate assemblages, video and sonar, and other biotic and abiotic data in tandem with fish observations, thereby saving project resources and providing a more complete quantitative ecological context for interpreting various types of fisheries data. Though not specifically addressed in this initial study, live box access during sampling can reduce sample processing time, providing additional field crew efficiency. This is facilitated by clearing the live box of debris and fish and passing them behind the boat during sampling, while moving along a transect. In this study and a previous study, we were able to process fish directly from the live box using dip nets and release them from the back of the boat (Merz et al., 2021). While we did not quantitatively assess processing time, this appeared to reduce fish handling and the required constraining of fish in the net along the shore, like in beach seining. Furthermore, the Platform eliminates steps associated with fish handling (i.e., secondary and tertiary holding locations for fish), thereby reducing handling time. However, this needs to be more fully evaluated.
Initial evaluation of the Platform utility in this study suggests there are additional opportunities to expand continuous sampling and reduce or eliminate downtime for organism handling and field processing, including the complete elimination of organism handling by using video imaging in a pass-through system. Passive fish observation is critical when sampling areas where threatened and endangered species are known to exist to minimize or eliminate their stress (Castañeda et al., 2020). Demonstration of the Platform’s ability to contrast fish density, size, and species diversity sets the stage to advance more passive monitoring techniques, including video and eDNA methods, within the flowthrough live box configuration.
The Platform has some potential limitations that require further investigation. While we did not specifically evaluate this in our study, the Platform appears to be biased against larger fish. Although, we did see adult black bass (>300 mm FL) and Black Crappie (>190 mm FL), among others, in our samples, many of our observations were of fish smaller than ∼200 mm. Potential biases or limits in the size or swimming abilities of fish captured by the Platform warrants further investigation. Another potential Platform limitation is that it can only sample to a depth of about 2.5 m with the current prototype. Future modification of the net attachment angle along with a greater net height could potentially extend sampling depth range. Finally, the pontoon boat, as tested, has insufficient flotation and freeboard to allow safe operation with swells greater than ∼0.6 m. Clearly, a single sampling method cannot sample all habitat types well. That is why a diversity of sampling gears is useful for monitoring and understanding a system like the Bay-Delta. Only a small fraction of the water can be sampled at a time and fish are constantly moving. A greater diversity in gears, including the Platform, will allow us to sample a greater diversity of habitat types, which will improve our ability to monitor fish communities and better understand management and restoration action effects.
The natural next step in Platform testing is to compare it against other common methods for sampling fish in different estuarine habitat types. We recently performed an evaluation of the Platform against two common methods used to sample small-bodied fish (beach seine and Kodiak trawl) in two distinct lentic habitats (i.e., nearshore littoral habitat and open water pelagic habitat; Merz et al., 2021). We found the Platform surveys could reduce gear bias by representatively sampling multiple habitat types traditionally sampled by different gear, reducing potential gear-specific bias. Nevertheless, the Platform should continue to be tested against other sampling methods to further identify limitations.
The Platform is a promising new tool that can be used to monitor estuary fish communities. A growing body of scientific literature acknowledges the patchy nature of freshwater ecosystems, emphasizing the spatial and temporal context of lotic fishes and their habitats (Malard et al., 2000; Ward et al., 2002; Wiens 2002; Le Pichon et al., 2017). Yet, it has been difficult to test the influence of estuary management decisions on fish communities due to the limitations of available habitat-specific sampling methods in collecting standardized, comparable fish community data across habitat types (Weaver et al., 1993; Jackson and Harvey 1997; Olin and Malinen 2003; Han et al., 2016). This study demonstrates the Platform provides a single, integrated, efficient method for sampling small-bodied fish assemblages across estuary habitat types. The Platform provides an exciting new fisheries science and management tool for evaluating anthropogenic impacts on ecosystems, assessing the effectiveness of estuary restoration efforts, and monitoring the effects of lotic system/estuary management activities on fish communities in a more informative ecological context compared to more conventional sampling methods. These results are timely given the increased interest in reducing physical handling of fishes, which may cause stress, harm, and mortality–all undesirable side effects for rare endemic fishes (Castañeda et al., 2020).
Data Availability Statement
The datasets presented in this study can be found in online repositories. The names of the repository/repositories and accession number(s) can be found in the article/supplementary material.
Ethics Statement
Ethical review and approval was not required for the animal study because all applicable institutional and/or national guidelines for the care and use of animals were followed.
Author Contributions
JM conceived of the idea, conducted field work and analyses, and wrote the manuscript. JS conducted analyses. MC contributed to manuscript writing, and WT conducted field work and contributed to manuscript writing.
Funding
We gratefully acknowledge funding support from the United States Department of Interior, Bureau of Reclamation (contract number R18AP00053).
Conflict of Interest
The authors declare that the research was conducted in the absence of any commercial or financial relationships that could be construed as a potential conflict of interest.
Publisher’s Note
All claims expressed in this article are solely those of the authors and do not necessarily represent those of their affiliated organizations, or those of the publisher, the editors and the reviewers. Any product that may be evaluated in this article, or claim that may be made by its manufacturer, is not guaranteed or endorsed by the publisher.
Acknowledgments
We thank J. Anderson, K. Horvath, E. Skiles, P. Moniz, B. Hollaway, K. Sellheim, and K. Karpenko for supporting the Platform build out, field surveys, data upload, and analysis. The Genidaqs Lab of Cramer Fish Sciences provided genetic validation of visual species identification. We appreciate helpful input from the Interagency Ecological Program on study design and supporting successful completion of federal and state permitting requirements. We thank N. Kogut for design discussion and review of an earlier draft. Finally, we thank P. Anders, M. Beakes and E. Van Nieuwenhuyse for significant input on earlier drafts of this manuscript, along with helpful comments from B. Cavallo and B. Mahardja.
Supplementary Material
The Supplementary Material for this article can be found online at: https://www.frontiersin.org/articles/10.3389/fenvs.2021.698210/full#supplementary-material
References
Attrill, M. J., and Power, M. (2004). Partitioning of Temperature Resources Amongst an Estuarine Fish Assemblage. Estuar. Coast. Shelf Sci. 61 (4), 725–738.
Atwater, B. F., Conrad, S. G., Dowden, J. N., Hedel, C. W., MacDonald, R. L., and Savage, W. (1979). “History, Landforms, and Vegetation of the Estuary’s Tidal Marshes,” in San Francisco Bay: The Urbanized Estuary. Editor T. J. Conomos (San Francisco, CA: American Association for the Advancement of Science), 347–386. doi:10.21236/ada080490
Babcock, R. C., Shears, N. T., Alcala, A. C., Barrett, N. S., Edgar, G. J., Lafferty, K. D., et al. (2010). Decadal Trends in Marine Reserves Reveal Differential Rates of Change in Direct and Indirect Effects. Proc. Natl. Acad. Sci. USA 107 (43), 18256–18261. doi:10.1073/pnas.0908012107
Baird, R. C. (2005). On Sustainability, Estuaries, and Ecosystem Restoration: The Art of the Practical. Restor Ecol. 13, 154–158. doi:10.1111/j.1526-100x.2005.00019.x
Baran, R., Blabolil, P., Čech, M., Draštík, V., Frouzová, J., Holubová, M., et al. (2021). New Way to Investigate Fish Density and Distribution in the Shallowest Layers of the Open Water. Fish. Res. 238, 105907. doi:10.1016/j.fishres.2021.105907
Barbier, E. B., Hacker, S. D., Kennedy, C., Koch, E. W., Stier, A. C., and Silliman, B. R. (2011). The Value of Estuarine and Coastal Ecosystem Services. Ecol. Monogr. 81 (2), 169–193. doi:10.1890/10-1510.1
Bates, D., Maechler, M., Bolker, B., and Walker, S. (2015). Fitting Linear Mixed-Effects Models Using Lme4. J. Stat. Softw. 67, 1–48. doi:10.18637/jss.v067.i01
Beck, M. W., Heck, K. L., Able, K. W., Childers, D. L., Eggleston, D. B., Gillanders, B. M., et al. (2001). The Identification, Conservation, and Management of Estuarine and Marine Nurseries for Fish and Invertebrates. Bioscience 51 (8), 633–641. doi:10.1641/0006-3568(2001)051[0633:ticamo]2.0.co;2
Berra, T. (2007). Freshwater Fish Distribution. Chicago and London: The University of Chicago Press. doi:10.7208/chicago/9780226044439.001.0001
Bettoli, P. W., and Miranda, L. E. (2001). Cautionary Note about Estimating Mean Length at Age with Subsampled Data. North Am. J. Fish. Manag. 21, 425–428. doi:10.1577/1548-8675(2001)021<0425:cnaeml>2.0.co;2
Bonada, N., and Resh, V. H. (2013). Mediterranean-climate Streams and Rivers: Geographically Separated but Ecologically Comparable Freshwater Systems. Hydrobiologia 719, 1–29. doi:10.1007/s10750-013-1634-2
Bonar, S. A., Contreras-Balderas, S., and Iles, A. C. (2009). Standard Methods for Sampling North American Freshwater Fishes. Bethesda, MD: American Fisheries Society.
Bond, M. H., Hayes, S. A., Hanson, C. V., and MacFarlane, R. B. (2008). Marine Survival of Steelhead (Oncorhynchus mykiss) Enhanced by a Seasonally Closed Estuary. Can. J. Fish. Aquat. Sci. 65, 2242–2252. doi:10.1139/f08-131
Bray, J. R., and Curtis, J. T. (1957). An Ordination of the Upland Forest Communities of Southern Wisconsin. Ecol. Monogr. 27 (4), 325–349. doi:10.2307/1942268
Brooks, A. P., Gehrke, P. C., Jansen, J. D., and Abbe, T. B. (2004). Experimental Reintroduction of Woody Debris on the Williams River, NSW: Geomorphic and Ecological Responses. River Res. Applic. 20, 513–536. doi:10.1002/rra.764
Brown, L. R., and May, J. T. (2006). Variation in Spring Nearshore Resident Fish Species Composition and Life Histories in the Lower San Joaquin Watershed and Delta. San Francisco Estuary Watershed Sci. 4 (2). doi:10.15447/sfews.2006v4iss2art1
Brown, L. R., and Michniuk, D. (2007). Littoral Fish Assemblages of the Alien-Dominated Sacramento-San Joaquin Delta, California, 1980–1983 and 2001–2003. Estuar. Coast. 30 (1), 186–200.
Brown, L. R. (2003). Will Tidal Wetland Restoration Enhance Populations of Native Fishes? San Francisco Estuary Watershed Sci. 1 (1). doi:10.15447/sfews.2003v1iss1art2
CALFED (2000). California’s Water Future: A Framework for Action. Sacramento, CA: CALFED Bay-Delta Program.
California Bay-Delta Authority (2004). Ecosystem Restoration Program Multi-Year Program Plan. Sacramento, CA: CALFED Bay-Delta Program.
Castañeda, R. A., Van Nynatten, A., Crookes, S., Ellender, B. R., Heath, D. D., MacIsaac, H. J., et al. (2020). Detecting Native Freshwater Fishes Using Novel Non-invasive Methods. Front. Environ. Sci. 8, 29–45. doi:10.3389/fenvs.2020.00029
Cohen, A. N., and Carlton, J. T. (1998). Accelerating Invasion Rate in a Highly Invaded Estuary. Science 279 (5350), 555–558. doi:10.1126/science.279.5350.555
Cowardin, L., Carter, V., Golet, F., and LaRoe, E. (1979). Classification of Wetlands and Deepwater Habitats of the United States. Washington, DC: US Department of the Interior, Fish and Wildlife Service.
Craft, C., Clough, J., Ehman, J., Joye, S., Park, R., Pennings, S., et al. (2009). Forecasting the Effects of Accelerated Sea-Level Rise on Tidal Marsh Ecosystem Services. Front. Ecol. Environ. 7, 73–78. doi:10.1890/070219
Cyrus, D. P. (1992). Turbidity Gradients in Two Indo-Pacific Estuaries and Their Influence on Fish Distribution. South. Afr. J. Aquat. Sci. 18 (1-2), 51–63. doi:10.1080/10183469.1992.9631324
Davis, M. W. (2002). Key Principles for Understanding Fish Bycatch Discard Mortality. Can. J. Fish. Aquat. Sci. 59, 1834–1843. doi:10.1139/f02-139
DeMartini, E., Jokiel, P., Beets, J., Stender, Y., Storlazzi, C., Minton, D., et al. (2013). Terrigenous Sediment Impact on Coral Recruitment and Growth Affects the Use of Coral Habitat by Recruit Parrotfishes (F. Scaridae). J. Coast Conserv 17 (3), 417–429. doi:10.1007/s11852-013-0247-2
DiGennaro, B., Reed, D., Swanson, C., Hastings, L., Hymanson, Z., Healey, M., et al. (2012). Using Conceptual Models in Ecosystem Restoration Decision Making: An Example from the Sacramento-San Joaquin River Delta, California. San Franc. Estuary Watershed Sci. 10 (3).
Dolan, C. R., and Miranda, L. E. (2004). Injury and Mortality of Warmwater Fishes Immobilized by Electrofishing. North Am. J. Fish. Manag. 24, 118–127. doi:10.1577/m02-115
Eby, L. A., and Crowder, L. B. (2002). Hypoxia-based Habitat Compression in the Neuse River Estuary: Context-dependent Shifts in Behavioral Avoidance Thresholds. Can. J. Fish. Aquat. Sci. 59 (6), 952–965. doi:10.1139/f02-067
Edgar, R. C. (2004). MUSCLE: Multiple Sequence Alignment with High Accuracy and High Throughput. Nucleic Acids Res. 32 (5), 1792–1797. doi:10.1093/nar/gkh340
Eggleton, M. A., Jackson, J. R., and Lubinski, B. J. (2010). Comparison of Gears for Sampling Littoral‐Zone Fishes in Floodplain Lakes of the Lower White River, Arkansas. North Am. J. Fish. Manag. 30, 928–939. doi:10.1577/m09-127.1
Ellender, B. R., Wasserman, R. J., Ndaleni, P. M., Mofu, L., Wu, Y., and Weyl, O. L. F. (2016). Reporting By-Catch and Mortalities in Targeted Biological Field Surveys on Fishes. Aquat. Conserv: Mar. Freshw. Ecosyst. 26, 596–601. doi:10.1002/aqc.2613
Engås, A., Jørgensen, T., and West, C. W. (1998). A Species-Selective Trawl for Demersal Gadoid Fisheries. ICES J. Mar. Sci. 55 (5), 835–845.
Feyrer, F., and Healey, M. P. (2003). Fish Community Structure and Environmental Correlates in the Highly Altered Southern Sacramento-San Joaquin Delta. Environ. Biol. Fishes 66 (2), 123–132. doi:10.1023/a:1023670404997
Fischer, J. R., and Quist, M. C. (2014a). Characterizing Lentic Freshwater Fish Assemblages Using Multiple Sampling Methods. Environ. Monit. Assess. 186, 4461–4474. doi:10.1007/s10661-014-3711-z
Fischer, J. R., and Quist, M. C. (2014b). Gear and Seasonal Bias Associated with Abundance and Size Structure Estimates for Lentic Freshwater Fishes. J. Fish Wildl. Manag. 5 (2), 394–412. doi:10.3996/082013-jfwm-054
Franco, A., Pérez-Ruzafa, A., Drouineau, H., Franzoi, P., Koutrakis, E. T., Lepage, M., et al. (2012). Assessment of Fish Assemblages in Coastal Lagoon Habitats: Effect of Sampling Method. Estuarine, Coastal Shelf Sci. 112, 115–125. doi:10.1016/j.ecss.2011.08.015
França, S., Vasconcelos, R. P., Fonseca, V. F., Tanner, S. E., Reis-Santos, P., Costa, M. J., et al. (2012). Predicting Fish Community Properties Within Estuaries: Influence of Habitat Type and Other Environmental Features. Estuarine, Coastal Shelf Sci. 107, 22–31. doi:10.1016/j.ecss.2012.04.013
Gasith, A., and Resh, V. H. (1999). Streams in Mediterranean Climate Regions: Abiotic Influences and Biotic Responses to Predictable Seasonal Events. Annu. Rev. Ecol. Syst. 30, 51–81. doi:10.1146/annurev.ecolsys.30.1.51
Gibson-Reinemer, D. K., Ickes, B. S., and Chick, J. H. (2017). Development and Assessment of a New Method for Combining Catch Per Unit Effort Data from Different Fish Sampling Gears: Multigear Mean Standardization (MGMS). Can. J. Fish. Aquat. Sci. 74 (1), 8–14. doi:10.1139/cjfas-2016-0003
Gido, K. B., and Matthews, W. J. (2000). Dynamics of the Offshore Fish Assemblage in a Southwestern Reservoir (Lake Texoma, Oklahoma-Texas). Copeia 2000, 917–930. doi:10.1643/0045-8511(2000)000[0917:dotofa]2.0.co;2
Gilbert, G. K. (1917). Hydraulic-Mining Debris in the Sierra Nevada. U.S. Geological Survey Professional Paper 105 (Washington, DC: Washington Government Printing Office). doi:10.3133/pp105
Gratwicke, B., and Speight, M. R. (2005). The Relationship between Fish Species Richness, Abundance and Habitat Complexity in a Range of Shallow Tropical Marine Habitats. J. Fish Biol. 66 (3), 650–667. doi:10.1111/j.0022-1112.2005.00629.x
Han, J.-H., Paek, W. K., and An, K.-G. (2016). Efficiency Comparisons of Fish Sampling Gears for a Lentic Ecosystem Health Assessments in Korea. J. Asia-Pacific Biodiversity 9 (4), 412–421. doi:10.1016/j.japb.2016.10.001
Heck, K. L., Hays, G., and Orth, R. J. (2003). Critical Evaluation of the Nursery Role Hypothesis for Seagrass Meadows. Mar. Ecol. Prog. Ser. 253, 123–136.
Herbold, B., Baltz, D. M., Brown, L. R., Grossinger, R. M., Kimmerer, W. J., Lehman, P., et al. (2014). The Role of Tidal Marsh Restoration in Fish Management in the San Francisco Estuary. San Francisco Estuary Watershed Sci. 12 (1), 1–6. doi:10.15447/sfews.2014v12iss1art1
Hestir, E. L. (2010). Trends in Estuarine Water Quality and Submerged Aquatic Vegetation Invasion. Davis, CA: University of California.
Hosack, G. R., Dumbauld, B. R., Ruesink, J. L., and Armstrong, D. A. (2006). Habitat Associations of Estuarine Species: Comparisons of Intertidal Mudflat, Seagrass (Zostera marina), and Oyster (Crassostrea gigas) Habitats. Estuaries and Coasts 29, 1150–1160. doi:10.1007/bf02781816
Hudon, C., Lalonde, S., and Gagnon, P. (2000). Ranking the Effects of Site Exposure, Plant Growth Form, Water Depth, and Transparency on Aquatic Plant Biomass. Can. J. Fish. Aquat. Sci. 57 (S1), 31–42. doi:10.1139/f99-232
Ivanova, N. V., Zemlak, T. S., Hanner, R. H., and Hebert, P. D. N. (2007). Universal Primer Cocktails for Fish DNA Barcoding. Mol. Ecol. Notes 7 (4), 544–548. doi:10.1111/j.1471-8286.2007.01748.x
Izzo, C., Doubleday, Z. A., Grammer, G. L., Gilmore, K. L., Alleway, H. K., Barnes, T. C., et al. (2016). Fish as Proxies of Ecological and Environmental Change. Rev. Fish. Biol. Fish. 26, 265–286. doi:10.1007/s11160-016-9424-3
Jackson, D. A., and Harvey, H. H. (1997). Qualitative and Quantitative Sampling of lake Fish Communities. Can. J. Fish. Aquat. Sci. 54, 2807–2813. doi:10.1139/f97-182
Jacobs, K. L., Luoma, S. N., and Taylor, K. A. (2003). Calfed: An Experiment in Science and Decisionmaking. Environ. Sci. Pol. Sust. Develop. 45, 30–41. doi:10.1080/00139150309604521
Jassby, A. D., Cloern, J. E., and Cole, B. E. (2002). Annual Primary Production: Patterns and Mechanisms of Change in a Nutrient‐rich Tidal Ecosystem. Limnol. Oceanogr. 47, 698–712. doi:10.4319/lo.2002.47.3.0698
Jassby, A. D., and Cloern, J. E. (2000). Organic Matter Sources and Rehabilitation of the Sacramento-San Joaquin Delta (California, USA). Aquat. Conserv: Mar. Freshw. Ecosyst. 10, 323–352. doi:10.1002/1099-0755(200009/10)10:5<323::aid-aqc417>3.0.co;2-j
Kaartvedt, S., Staby, A., and Aksnes, D. (2012). Efficient Trawl Avoidance by Mesopelagic Fishes Causes Large Underestimation of Their Biomass. Mar. Ecol. Prog. Ser. 456, 1–6. doi:10.3354/meps09785
Kjelson, M. A., and Colby, D. R. (1977). “The Evaluation and Use of Gear Efficiencies in the Estimation of Estuarine Fish Abundance,” in Estuarine Processes: Circulation, Sediments, and Transfer of Material in the Estuary. Editor M. Wiley (Amsterdam, Netherlands: Elsevier), 416–424. doi:10.1016/b978-0-12-751802-2.50039-4
Knowles, N. (2002). Natural and Management Influences on Freshwater Inflows and Salinity in the San Francisco Estuary at Monthly to Interannual Scales. Water Resour. Res. 25, 1–11. doi:10.1029/2001wr000360
Kocher, T. D., Thomas, W. K., Meyer, A., Edwards, S. V., Pääbo, S., Villablanca, F. X., et al. (1989). Dynamics of Mitochondrial DNA Evolution in Animals: Amplification and Sequencing with Conserved Primers. Proc. Natl. Acad. Sci. 86, 6196–6200. doi:10.1073/pnas.86.16.6196
Koepfli, K.-P., and Wayne, R. K. (1998). Phylogenetic Relationships of Otters (Carnivora: Mustelidae) Based on Mitochondrial Cytochrome B Sequences. J. Zoolog. 246, 401–416. doi:10.1111/j.1469-7998.1998.tb00172.x
Kurth, R., and Nobriga, M. (2001). Food Habits of Larval Splittail. Interagency Ecol. Program Newsl. 14, 40–41.
Laegdsgaard, P., and Johnson, C. (1995). Mangrove Habitats as Nurseries:unique Assemblages of Juvenile Fish in Subtropical Mangroves in Eastern Australia. Mar. Ecol. Prog. Ser. 126, 67–81. doi:10.3354/meps126067
Lankowicz, K. M., Bi, H., Liang, D., and Fan, C. (2020). Sonar Imaging Surveys Fill Data Gaps in Forage Fish Populations in Shallow Estuarine Tributaries. Fish. Res. 226, 105520. doi:10.1016/j.fishres.2020.105520
LaPointe, N. W. R., Corkum, L. D., and Mandrak, N. E. (2006). A Comparison of Methods for Sampling Fish Diversity in Shallow Offshore Waters of Large Rivers. North Am. J. Fish. Manag. 26, 503–513. doi:10.1577/m05-091.1
Layman, C. A., and Smith, D. E. (2001). Sampling Bias of Minnow Traps in Shallow Aquatic Habitats on the Eastern Shore of Virginia. Wetlands 21, 145–154. doi:10.1672/0277-5212(2001)021[0145:sbomti]2.0.co;2
Le Pichon, C., Tales, É., Belliard, J., and Torgersen, C. E. (2017). Spatially Intensive Sampling by Electrofishing for Assessing Longitudinal Discontinuities in Fish Distribution in a Headwater Stream. Fish. Res. 185, 90–101. doi:10.1007/bf02803387
Lehman, P. W. (2004). The Influence of Climate on Mechanistic Pathways that Affect Lower Food Web Production in Northern San Francisco Bay Estuary. Estuaries 27 (2), 311–324. doi:10.1007/bf02803387
Lucas, L. V., Cloern, J. E., Thompson, J. K., and Monsen, N. E. (2002). Functional Variability of Habitats within the Sacramento-San Joaquin Delta: Restoration Implications. Ecol. Appl. 12, 1528–1547. doi:10.2307/3099989
Lucas, L. V., Sereno, D. M., Burau, J. R., Schraga, T. S., Lopez, C. B., Stacey, M. T., et al. (2006). Intradaily Variability of Water Quality in a Shallow Tidal Lagoon: Mechanisms and Implications. Estuaries and Coasts 29, 711–730. doi:10.1007/bf02786523
Lucena, F. M., and O'Brien, C. M. (2001). Effects of Gear Selectivity and Different Calculation Methods on Estimating Growth Parameters of Bluefish, Pomatomus saltatrix (Pisces: Pomatomidae), from Southern Brazil. Fish. Bull. 99 (3), 432.
Lyons, J. (1986). Capture Efficiency of a Beach Seine for Seven Freshwater Fishes in a North-Temperate Lake. North Am. J. Fish. Manag. 6, 288–289. doi:10.1577/1548-8659(1986)6<288:ceoabs>2.0.co;2
Mahardja, B., Farruggia, M. J., Schreier, B., and Sommer, T. (2017). Evidence of a Shift in the Littoral Fish Community of the Sacramento-San Joaquin Delta. PLOS ONE 12 (1), e0170683. doi:10.1371/journal.pone.0170683
Malard, F., Tockner, K., and Ward, J. V. (2000). Physico-chemical Heterogeneity in a Glacial Riverscape. Landscape Ecol. 15, 679–695. doi:10.1023/a:1008147419478
Martino, E. J., and Able, K. W. (2003). Fish Assemblages across the marine to Low Salinity Transition Zone of a Temperate Estuary. Estuarine, Coastal Shelf Sci. 56 (5-6), 969–987. doi:10.1016/s0272-7714(02)00305-0
McQueen, D. J., Post, J. R., and Mills, E. L. (1986). Trophic Relationships in Freshwater Pelagic Ecosystems. Can. J. Fish. Aquat. Sci. 43, 1571–1581. doi:10.1139/f86-195
Merz, J. E., Anderson, J. T., Wiesenfeld, J., and Zeug, S. C. (2021). Comparison of Three Sampling Methods for Small-Bodied Fish in Lentic Nearshore and Open Water Habitats. Environ. Monit. Assess. 193, 1–20. doi:10.1007/s10661-021-09027-9
Merz, J. E., Hamilton, S., Bergman, P. S., and Cavallo, B. (2011). Spatial Perspective for Delta Smelt: A Summary of Contemporary Survey Data. Calif. Fish Game 97, 164–189.
Miller, J., Gray, A., and Merz, J. (2010). Quantifying the Contribution of Juvenile Migratory Phenotypes in a Population of Chinook salmon Oncorhynchus tshawytscha. Mar. Ecol. Prog. Ser. 408, 227–240. doi:10.3354/meps08613
Monsen, N. E., Cloern, J. E., Lucas, L. V., and Monismith, S. G. (2002). A Comment on the Use of flushing Time, Residence Time, and Age as Transport Time Scales. Limnol. Oceanogr. 47, 1545–1553. doi:10.4319/lo.2002.47.5.1545
Mount, J., and Twiss, R. (2005). Subsidence, Sea Level Rise, and Seismicity in the Sacramento–San Joaquin Delta. San Francisco Estuary Watershed Sci. 3 (1). doi:10.15447/sfews.2005v3iss1art7
Moyle, P. B. (2002). Inland Fishes of California: Revised and Expanded. Berkelely, CA: Univ of California Press.
Moyle, P. B., Lund, J. R., Bennett, W. A., and Fleenor, W. E. (2010). Habitat Variability and Complexity in the Upper San Francisco Estuary. San Francisco Estuary Watershed Sci. 8 (3). doi:10.15447/sfews.2010v8iss3art1
Mullin, S. J. (1995). Estuarine Fish Populations Among Red Mangrove Prop Roots of Small Overwash Islands. Wetlands 15, 324–329. doi:10.1007/bf03160886
Nichols, F. H., Cloern, J. E., Luoma, S. N., and Peterson, D. H. (1986). The Modification of an Estuary. Science 231 (4738), 567–573. doi:10.1126/science.231.4738.567
Nobriga, M. L., and Feyrer, F. (2007). Shallow-water Piscivore-Prey Dynamics in California's Sacramento–San Joaquin Delta. San Francisco Estuary Watershed Sci. 5 (2). doi:10.15447/sfews.2007v5iss2art4
Nobriga, M. L. (1998). Trends in the Food Habits of Larval Delta Smelt, Hypomesus Transpacificus, 1991 – 1994. MS Thesis. Sacramento (CA):California State University.
Oksanen, J. F. G., Blanchet, M. F., Kindt, R., Legendre, P., McGlinn, D., Minchin, P. R., et al. (2019). Vegan: Community Ecology Package. Available at: https://CRAN.R-project.org/package=vegan.
Olin, M., and Malinen, T. (2003). Comparison of Gillnet and Trawl in Diurnal Fish Community Sampling. Hydrobiologia 506 (1-3), 443–449. doi:10.1023/b:hydr.0000008545.33035.c4
Oros, D. R., and Ross, J. R. M. (2005). Polycyclic Aromatic Hydrocarbons in Bivalves from the San Francisco Estuary: Spatial Distributions, Temporal Trends, and Sources (1993-2001). Mar. Environ. Res. 60, 466–488. doi:10.1016/j.marenvres.2005.02.001
Orth, R. J., Heck, K. L., and van Montfrans, J. (1984). Faunal Communities in Seagrass Beds: A Review of the Influence of Plant Structure and Prey Characteristics on Predator: Prey Relationships. Estuaries 7, 339–350. doi:10.2307/1351618
Pérez-Domínguez, R., Maci, S., Courrat, A., Lepage, M., Borja, A., Uriarte, A., et al. (2012). Current Developments on Fish-Based Indices to Assess Ecological-Quality Status of Estuaries and Lagoons. Ecol. Indicators 23, 34–45. doi:10.1016/j.ecolind.2012.03.006
Peterson, M. S. (1988). Comparative Physiological Ecology of Centrarchids in Hyposaline Environments. Can. J. Fish. Aquat. Sci. 45, 827–833. doi:10.1139/f88-100
Peterson, M. S., and Meador, M. R. (1994). Effects of Salinity on Freshwater Fishes in Coastal plain Drainages in the southeastern U.S. Rev. Fish. Sci. 2, 95–121. doi:10.1080/10641269409388554
Piccoli, P. M. (2003). Estuarine Habitat Use by Hudson River American Eels as Determined by Otolith Strontium: Calcium Ratios. Am. Fish. Soc. Symp. 33, 87–99.
Pierce, C. L., Rasmussen, J. B., and Leggett, W. C. (1990). Sampling Littoral Fish with a Seine: Corrections for Variable Capture Efficiency. Can. J. Fish. Aquat. Sci. 47 (5), 1004–1010. doi:10.1139/f90-115
Pierce, P. C., and Van Den Avyle, M. J. (1997). Hybridization between Introduced Spotted Bass and Smallmouth Bass in Reservoirs. Trans. Am. Fish. Soc. 126 (6), 939–947. doi:10.1577/1548-8659(1997)126<0939:hbisba>2.3.co;2
Pope, K. L., and Willis, D. W. (1996). Seasonal Influences on Freshwater Fisheries Sampling Data. Rev. Fish. Sci. 4 (1), 57–73. doi:10.1080/10641269609388578
Pritchard, D. W. (1967). What Is an Estuary: Physical Viewpoint. Washington, DC: American Association for the Advancement of Science.
R Core Team (2019). R: A Language and Environment for Statistical Computing. Vienna, Austria: R Foundation for Statistical ComputingAvailable at: https://www.R-project.org/.
Rojstaczer, S., and Deverel, S. J. (1995). Land Subsidence in Drained Histosols and Highly Organic mineral Soils of California. Soil Sci. Soc. America J. 59, 1162–1167. doi:10.2136/sssaj1995.03615995005900040031x
Romero, L. M. (2004). Physiological Stress in Ecology: Lessons from Biomedical Research. Trends Ecol. Evol. 19 (5), 249–255.
Rountree, R. A., and Able, K. W. (2007). Spatial and Temporal Habitat Use Patterns for Salt Marsh Nekton: Implications for Ecological Functions. Aquat. Ecol. 41 (1), 25–45.
Rozas, L. P., Caldwell, P., and Minello, T. J. (2005). The Fishery Value of Salt Marsh Restoration Projects. J. Coastal Res. 40, 37–50.
Rozas, L. P., and Minello, T. J. (1997). Estimating Densities of Small Fishes and Decapod Crustaceans in Shallow Estuarine Habitats: A Review of Sampling Design with Focus on Gear Selection. Estuaries 20 (1), 199–213. doi:10.2307/1352731
Ruetz, C. R., Uzarski, D. G., Krueger, D. M., and Rutherford, E. S. (2007). Sampling a Littoral Fish Assemblage: Comparison of Small-Mesh Fyke Netting and Boat Electrofishing. North Am. J. Fish. Manag. 27 (3), 825–831. doi:10.1577/m06-147.1
Scott, M. C., and Angermeier, P. L. (1998). Resource Use by Two Sympatric Black Basses in Impounded and Riverine Sections of the New River, Virginia. North Am. J. Fish. Manag. 18, 221–235. doi:10.1577/1548-8675(1998)018<0221:rubtsb>2.0.co;2
Simenstad, C., Reed, D., and Ford, M. (2006). When Is Restoration Not? Ecol. Eng. 26, 27–39. doi:10.1016/j.ecoleng.2005.09.007
Simenstad, C., Tanner, C., Crandell, C., White, J., and Cordell, J. (2005). Challenges of Habitat Restoration in a Heavily Urbanized Estuary: Evaluating the Investment. J. Coastal Res. 40, 6–23.
Sommer, T., Armor, C., Baxter, R., Breuer, R., Brown, L., Chotkowski, M., et al. (2007). The Collapse of Pelagic Fishes in the Upper San Francisco Estuary: El Colapso de los Peces Pelagicos en La Cabecera Del Estuario San Francisco. Fisheries 32, 270–277. doi:10.1577/1548-8446(2007)32[270:tcopfi]2.0.co;2
Stone, R. P., O'Clair, C. E., and Shirley, T. C. (1992). Seasonal Migration and Distribution of Female Red king Crabs in a Southeast Alaskan Estuary. J. Crustacean Biol. 12, 546–560. doi:10.2307/1548836
Thompson, J. (1957). The Settlement Geography of the Sacramento-San Joaquin Delta, California. Stanford, CA: Stanford University.
Thomson, J. R., Kimmerer, W. J., Brown, L. R., Newman, K. B., Nally, R. M., Bennett, W. A., et al. (2010). Bayesian Change point Analysis of Abundance Trends for Pelagic Fishes in the Upper San Francisco Estuary. Ecol. Appl. 20 (5), 1431–1448. doi:10.1890/09-0998.1
Van Geen, A., and Luoma, S. N. (1999). The Impact of Human Activities on Sediments of San Francisco Bay, California: An Overview. Mar. Chem. 64, 1–6. doi:10.1016/s0304-4203(98)00080-2
Ward, J. V., Malard, F., and Tockner, K. (2002). Landscape Ecology: AFramework for Integrating Pattern and Process in River Corridors. Landscape Ecol. 17, 35–45. doi:10.1023/a:1015277626224
Weaver, M. J., Magnuson, J. J., and Clayton, M. K. (1993). Analyses for Differentiating Littoral Fish Assemblages with Catch Data from Multiple Sampling Gears. Trans. Am. Fish. Soc. 122 (6), 1111–1119. doi:10.1577/1548-8659(1993)122<1111:afdlfa>2.3.co;2
Weinstein, M. P. (1986). Habitat Suitability index Models: Inland Silverside. Washington, DC: National Wetlands Research Center, Vol. 82.
Werner, E. E., and Hall, D. J. (1988). Ontogenetic Habitat Shifts in Bluegill: The Foraging Rate-Predation Risk Trade-Off. Ecology 69 (5), 1352–1366. doi:10.2307/1941633
Whitmore, D. H., and Hellier, T. R. (1988). Natural Hybridization between Largemouth and Smallmouth Bass (Micropterus). Copeia 1988 (2), 493–496. doi:10.2307/1445895
Wiens, J. A. (2002). Riverine Landscapes: Taking Landscape Ecology into the Water. Freshw. Biol 47, 501–515. doi:10.1046/j.1365-2427.2002.00887.x
Willis, S. C., Winemiller, K. O., and Lopez-Fernandez, H. (2005). Habitat Structural Complexity and Morphological Diversity of Fish Assemblages in a Neotropical Floodplain River. Oecologia 142 (2), 284284–295295. doi:10.1007/s00442-004-1723-z :
Young, M., Howe, E., O’Rear, T., Berridge, K., and Moyle, P. (2021). Food Web Fuel Differs Across Habitats and Seasons of a Tidal Freshwater Estuary. Estuaries and Coasts 44 (1), 286–301. doi:10.1007/s12237-020-00762-9
Young, M. J., Feyrer, F. V., Colombano, D. D., Louise Conrad, J., and Sih, A. (2018). Fish-habitat Relationships Along the Estuarine Gradient of the Sacramento-San Joaquin Delta, California: Implications for Habitat Restoration. Estuaries and Coasts 41 (8), 2389–2409. doi:10.1007/s12237-018-0417-4
Zedler, J. B., and Callaway, J. C. (2003). “Adaptive Restoration: A Strategic Approach for Integrating Research into Restoration Projects,” in Managing for Healthy Ecosystems (Boca Raton: CRC Press), 167, 167–174. ROUTLEDGE in association with GSE Research.
Keywords: delta, fish monitoring, estuary, sampling platform, fish sampling gear
Citation: Merz JE, Camp MJ, Simonis JL and Thorpe W (2021) A New Method for Standardizing Inland Fish Community Surveys: Characterizing Habitat Associated with Small-Bodied Fish Species, Abundance, and Size Distributions in a Highly Modified Estuary. Front. Environ. Sci. 9:698210. doi: 10.3389/fenvs.2021.698210
Received: 21 April 2021; Accepted: 12 July 2021;
Published: 28 July 2021.
Edited by:
Francisco Barros, Federal University of Bahia, BrazilReviewed by:
Susana França, Center for Marine and Environmental Sciences (MARE), PortugalJosé Amorim Reis-Filho, Federal University of Pará, Brazil
Copyright © 2021 Merz, Camp, Simonis and Thorpe. This is an open-access article distributed under the terms of the Creative Commons Attribution License (CC BY). The use, distribution or reproduction in other forums is permitted, provided the original author(s) and the copyright owner(s) are credited and that the original publication in this journal is cited, in accordance with accepted academic practice. No use, distribution or reproduction is permitted which does not comply with these terms.
*Correspondence: Joseph E. Merz, am1lcnpAZmlzaHNjaWVuY2VzLm5ldA==