 Giulio Zuccaro
 Mattia Federico Leone
- 1Department of Structures for Engineering and Architecture, PLINIVS-LUPT Study Centre, University of Naples Federico II, Naples, Italy
- 2Department of Architecture, PLINIVS-LUPT Study Centre, University of Naples Federico II, Naples, Italy
Climate services are emerging worldwide as an essential tool to bridge the advancement in climate science and meteo/earth observations with a variety of operational fields in the domains of Disaster Risk Reduction (DRR) and Climate Change Adaptation (CCA). It is multidisciplinary study area with promising applications in the field of urban microclimate simulations, supporting climate-resilient redevelopment actions at both the city and neighborhood levels. The CLARITY CSIS (Climate Services Information System, available at https://csis.myclimateservice.eu/), developed within the H2020 CLARITY project, is an innovative hazard/impact modeling tool that takes into account short- to long-term climate change scenarios and urban microclimate variability. Disaster risks associated with climate change, such as heat waves and floods, are concentrated in limited periods of the year and therefore not adequately represented by annually averaged values. To this aim, new datasets have been extracted from Regional Climate Models to estimate the frequency of extreme temperatures and precipitation events until 2100, and a novel modeling methodology has been developed to capture the effect on the urban microclimate due to specific built environment features. The wide amount of data generated by satellite earth observations and made available at pan-European level through the Copernicus datasets (e.g., Urban Atlas, European Settlement Map, etc.) has been processed through specific algorithms and GIS spatial analysis tools to extract detailed information related to key parameters linked to urban morphology and surface types. In addition to the “screening service” available at the pan-European level through the CLARITY CSIS, an “expert service” workflow allows increasing the resolution of hazard and impact simulations at 250 m, by exploiting detailed land use datasets provided by local end-users and assessing the DRR/CCA potential of city-wide adaptation plans, as well as of specific district redevelopment projects. This paper will present the features of CLARITY CSIS and the results of Expert Services implemented for the City of Naples, focusing on the methods adopted to implement hazard/impact assessments and how information from climate services is tailored to support the integration of different DRR/CCA strategies within urban plans and projects.
Introduction
Climate services, intended as IT tools enabling the integration of information related to the effects of climate change in various strategic sectors to support decision-making processes, are emerging in recent years as an essential instrument to link the progress in the field of climate science and meteo/earth observation within policymaking and resilient planning, also in view of integrating the converging domains of Disaster Risk Reduction (DRR) and Climate Change Adaptation (CCA).
In the European context, the issue of climate resilience is promoted by encouraging the Member States to develop climate mitigation and adaptation plans at the national and local levels (Delbeke and Vis, 2015), as well as by implementing operational tools capable of incorporating climate analyses into hazard/impact assessments to support sectoral policies, including those related to urban infrastructure (European Commission, 2013).
The intensity and impact of extreme weather events induced by climate change in cities, such as heat waves or floods, are largely determined by the local characteristics of the built environment. Local hazard conditions are in fact aggravated by the profound transformations linked to the growth of settlements, changes in land use, and the effects of the various activities that are concentrated in urbanized areas (construction, industry, transport, waste, etc.) that over time have strongly affected the disaster risk vulnerability and climate resilience of the territories. Therefore, DRR and CCA measures aimed at reducing the impacts on urban systems must be identified and designed locally starting from the understanding of how specific aspects, such as urban morphology, gray/green/blue infrastructure networks, and materials used for the construction of buildings and open spaces, affect local microclimatic conditions, determining a different response capacity to climate-related hazards.
The CLARITY CSIS (Climate Services Information System)1, is an innovative hazard/impact modeling tool that takes into account short- to long-term climate change scenarios and urban microclimate variability.
Disaster risks associated with climate change, such as heat waves and floods, are concentrated in limited periods of the year and therefore not adequately represented by annually averaged values. To this aim, new datasets have been extracted from Regional Climate Models to estimate the frequency of extreme temperature and precipitation events until 2100, and a novel modeling methodology has been developed to capture the effect on the urban microclimate due to specific built environment features.
To support urban decision-makers and planners in the choice of adequate intervention strategies, it is in fact necessary to integrate the information that can be deduced from large-scale climate projections with the variations at urban/district scale, identifying specific impact indicators and the relationship between the urban environment features and the effect of both extreme events and slow-onset changes. This refinement can be obtained by integrating the analysis of the urban microclimate in the conventional downscaling approach of climate projections.
The CLARITY CSIS is configured as an open-access IT platform able to measure hazard conditions and impacts related to heat waves and flooding impacts for more than 400 European cities, with on-demand simulations performed automatically and almost in real time. The platform exploits the potential offered by the large amount of data generated by satellite observations and made available at the pan-European level through public datasets (e.g., Copernicus Land Monitoring Services), processed through specific algorithms and GIS spatial analysis tools to extract detailed information related to key parameters linked to urban morphology and surface types, such as albedo, emissivity, Sky View Factor, green fraction, and runoff coefficient. This allows refining the information derived from Regional Climate Models, with a typical maximum resolution of 10–12 km (such as EURO-CORDEX), to a 500 m resolution, suitable for defining climate-resilient urban design strategies (Figure 1).
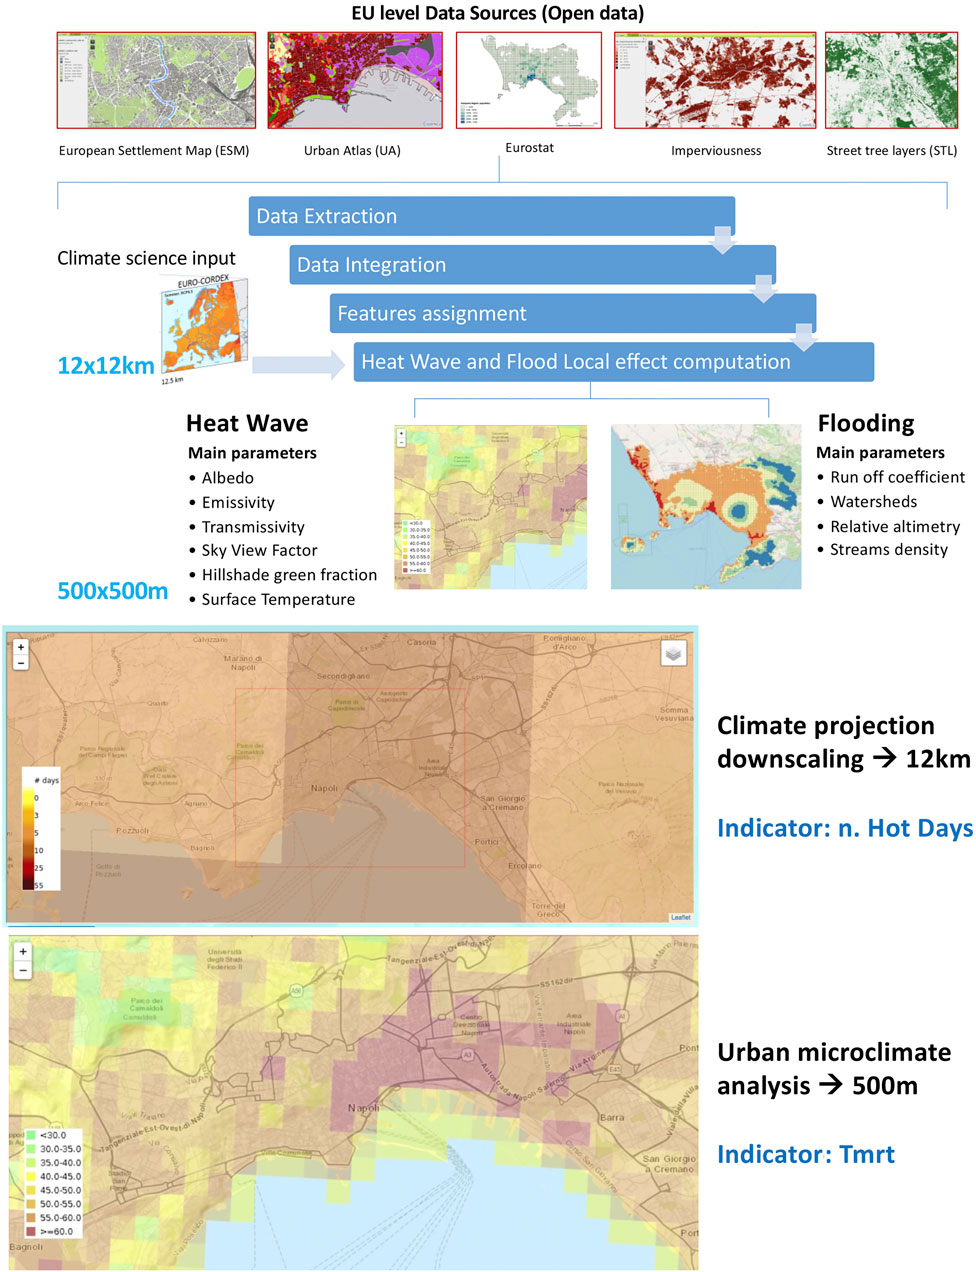
FIGURE 1. CLARITY CSIS approach to determine parameters affecting heat and flood hazard at urban level (top); difference in resolution of projections from Regional Climate Models and CSIS urban microclimate analysis.
The platform’s general approach follows the seven-step approach2 outlined in the “Climate Resilience Toolkit” developed by the European Commission in the document “Non-Paper Guidelines for Project Managers: Making Vulnerable Investments Climate Resilient” (European Commission, 2013) amended and integrated (Goler, 2020) according to the risk assessment methodology and terminology introduced by IPCC AR5-Fifth Assessment Report (IPCC, 2014b), which realigns climate risk and impact assessments to the conventional approach of risk modeling, identifying risk as a product of hazard (H), exposure (E), and vulnerability (V), according to the well-known relationship R = HxExV.
In particular, the tool allows performing impact assessments in relation to selected reference events of variable intensity derived by climate projections. This approach allows a detailed quantification of the impact on selected elements at risk (population in the case of heat waves, buildings, and transport infrastructures in the case of flooding), complemented by an evaluation of the expected economic impacts, as a starting point for the definition of adaptation strategies suitable for the local context.
Hazard characterization refers to a series of possible climate change scenarios, for a total of ten datasets (one of which referred to the “historical” climate) for each hazard category (heat waves and floods). Impact indicators include human health morbidity and mortality increase during heat waves and the damage to property and road network due to extreme precipitation events, thus providing the first screening of suitable adaptation measures tailored to the city-specific context. Starting from a “screening” carried out on the platform, it is possible to select technical alternatives for the climate adaptation of buildings and open spaces, evaluating their effects in terms of reducing climate impacts and costs/benefits associated with their implementation, including related social, economic, and environmental cobenefits (such as the improvement of air quality, the increase in urban biodiversity, the increase in real estate values, the generation of employment, and greater cohesion and inclusion of local communities).
In addition to the “screening service” available at the pan-European level through the CLARITY CSIS, an “Expert Service” workflow, performed offline and tailored to specific needs of end-users, allows further increasing the resolution of hazard and impact simulations, by exploiting detailed land use datasets locally available, and assessing the DRR/CCA potential of city-wide adaptation plans, as well as of specific district redevelopment projects.
CLARITY Expert Services for urban adaptation have been tested in three geographical contexts—Italy, Austria, and Sweden—representative of different climates in EU, with the aim of supporting local authorities in the integration of DRR/CCA measures in planning and design interventions.
The Italian case has focused on the City of Naples, addressing the update of relevant local plans/projects to comply with EU climate and energy policies and the Italian National Strategy for Climate Change Adaptation. To this aim, the UNINA-PLINIVS team has codesigned with the municipality’s technical departments involved in the project (Environment, Urban Planning, and Social Housing) a multiscale approach for climate-resilient urban planning supported by CLARITY services, providing coherence of concepts, methods, assessments, and decisions across the different local decision-making and planning levels: Strategic Planning (the Naples SECAP, Sustainable Climate and Energy Action Plan), City Planning (the Naples PUC, Municipal Urban Plan), and Urban Design (the Ponticelli District PRU, Urban Regeneration Program).
The main achievements of the CLARITY methods and tools’ application to the Naples case consist in the possibility of exploring the impact of climate-related hazard on the selected elements at risk with a progressive level of detail, always taking into account the “local effect” determined by the urban microclimate and the specific features of local settlements, as well as the definition of exposure parameters for the three hazards considered. The levels of detail range from a 250 m mesh overlapped to the territory for city-wide analyses, up to a 1 m and 3D representation for neighborhood-scale simulations.
Materials and Methods
Hazard Characterization
Within CLARITY, several climate change indicators linked to weather events, commonly used or specifically designed for risk assessment (e.g., ECA and D3, Urban SIS4, and ETCCDI5), have been calculated by processing EURO-CORDEX data, with the support of the Austrian (ZAMG) and Swedish (SMHI) meteorological institutes, partners of the project.
All climate indicators6 were calculated for a baseline period (1971–2000) and future time periods until 2100 using bias-corrected EURO-CORDEX data (Taylor et al., 2012). To account for the uncertainty in model predictions, the climate indices were extracted using several climate models, calculating the ensemble mean and standard deviation (Goler, 2020).
The climate indicators considered within CLARITY refer to temperature-related hazards, such as extreme heat or cold, and precipitation-related hazards, such as floods, windstorms, and droughts.
For what concerns heat waves and pluvial floods, which are the main hazards considered in CLARITY because of their relevance in all EU urban contexts, these indicators allowed to identify temperature and precipitation thresholds representative of reference hazard events under future climate scenarios.
Reference events for current and future climate have been classified according to three main variables, resulting in 27 possible combinations:
• Time period: 2011–2040, 2041–2070, and 2071–2011.
• Greenhouse gas emission scenarios (Representative Concentration Pathways, cf. IPCC, 2014a): RCP 2.6 (early response), RCP 4.5 (effective measures), and RCP 8.5 (business as usual/worst case scenario).
• Frequency of the event: “frequent” (1-year return period), “occasional” (5-year return period), and “rare” (20-year return period).
The temperature and precipitation values represent the initial input for the evaluation of the local hazard conditions, which take into account the urban microclimate and other local variables. As mentioned, in fact, the sole analysis of data derived from the observation of past events recorded by local meteorological stations and projected into the future through the statistical “downscaling” of Regional Climate Models cannot capture the microclimatic variability linked to settlement characteristics of the built environment. Urban morphology and land cover greatly affect the thermal stress conditions and the ability to absorb rainwater, resulting in a significant diversification of the main hazard parameters, which have been calculated through specific hazard models developed by the UNINA-PLINIVS Study Centre within the CLARITY project: the Heat Wave Local Effect Model (HWLEM) and the Flood Local Effect Model (FLEM).
In the HWLEM, the thermal stress variation in the different areas of the city is simulated through the mean radiant temperature (Tmrt) indicator, which is widely validated in the literature (cf., among others, Lindberg et al., 2016) as representative of the perceived outdoor comfort. This is essentially derived from 1) air temperature; 2) surface temperature; 3) urban morphology, green cover, and surface characteristics of buildings and open spaces7. Although the method used to derive Tmrt values does not consider wind as a parameter, extremely low wind speeds are usually recorded during heat waves, and therefore, the simplification adopted, widely recognized in the scientific literature (Gulyás et al., 2006; Chen et al., 2016; Oke et al., 2017), is suitable in relation to the objectives of the simulation.
Several definitions of heat waves exist in the literature (Robinson, 2001; Baccini et al., 2008; D’Ippoliti et al., 2010; Perkins and Alexander, 2013; Perkins, 2015). Given the CLARITY objective of quantifying the associated potential health impacts and mortality rate increase, a consolidated definition in the epidemiological domain has been selected. Accordingly, a heat wave that has a detrimental effect on health is defined as a period of at least two consecutive days with maximum daily apparent temperatures equal to or exceeding the 90th percentile of the daily maximum apparent temperature during the warm season (April–September) of the baseline period (D’Ippoliti et al., 2010).
A calibration of surface temperature and mean radiant temperature values in heat wave conditions for the City of Naples has been carried out to support the assumptions done in the HWLEM, based on elaborations from ENVI-MET (Simon and Bruse, 2020) and SOLWEIG (Lindberg and Grimmond, 2011) models (Figure 2, top). Observed surface temperature data have been retrieved from Landsat satellite data of July 19, 2015, corresponding to a 3-day heat wave with maximum temperatures of about 36–37°C (Figure 2, center). Further data used for calibration were collected during the 5-day heat wave with maximum temperatures of about 34–35°C of 28–31 July 2020 through aerial and field surveys (Figure 2, bottom).
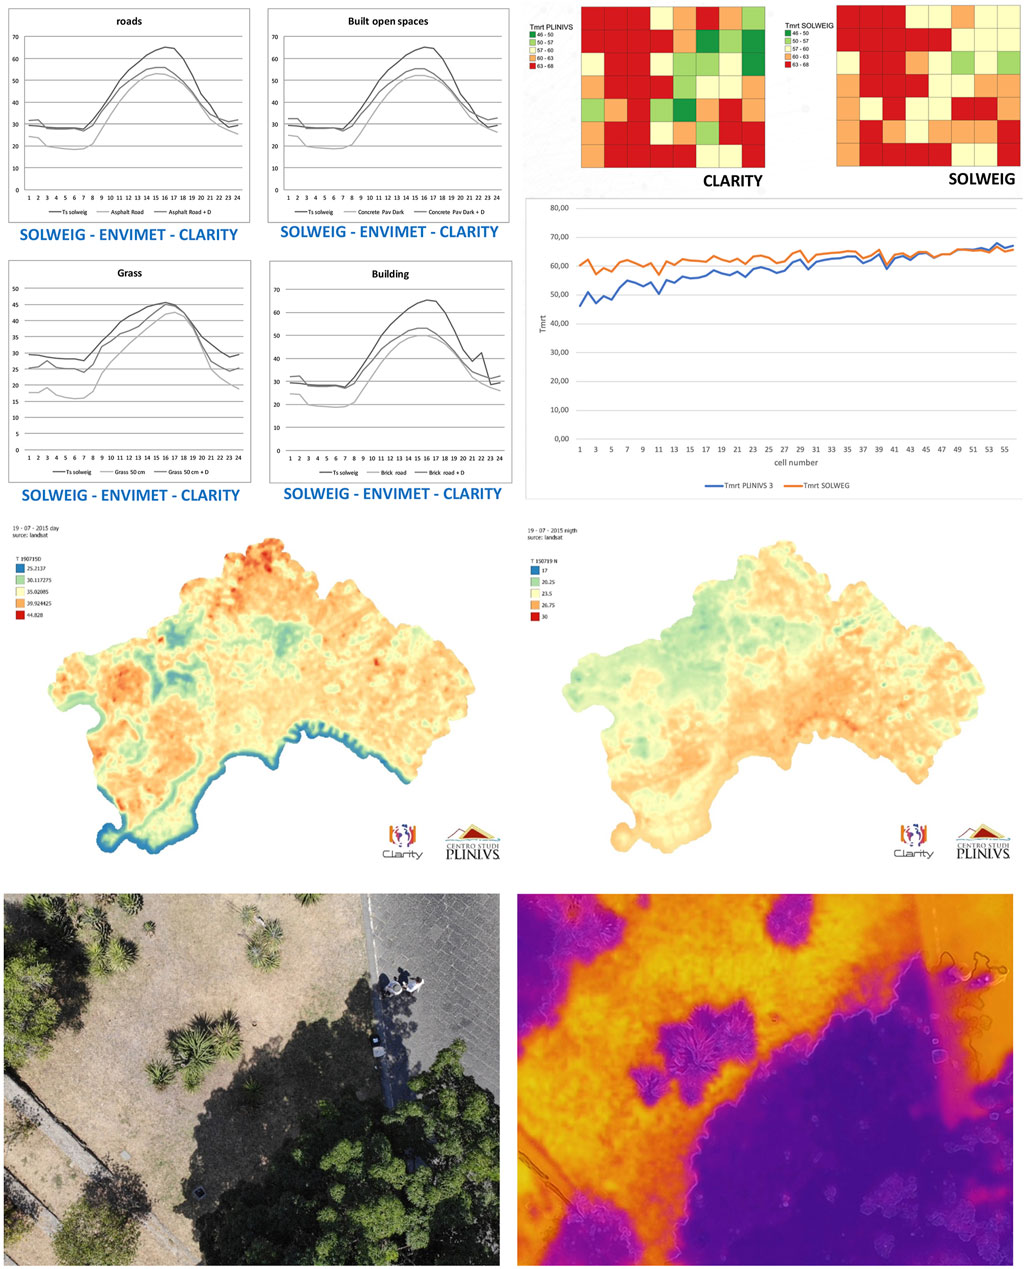
FIGURE 2. Calibration of surface temperature and mean radiant temperature values in the HWLEM: comparison with results from ENVI-MET and SOLWEIG models (top); observed land surface temperature data from Landsat, July 19, 2015 (center) and from drone campaign, July 30, 2020 (bottom).
The “expert” level version of the HWLEM, fed by local land use data, allows deepening the spatial resolution of the simulation, with a result returned on a grid of 250 m (Figure 3, top), in which each cell can be further analyzed in greater detail (Figure 4) to identify areas characterized by critical hazard conditions due to land use and urban morphology features (such as low-medium density areas with a prevalence of waterproof dark horizontal surfaces, lack of green areas, and trees).
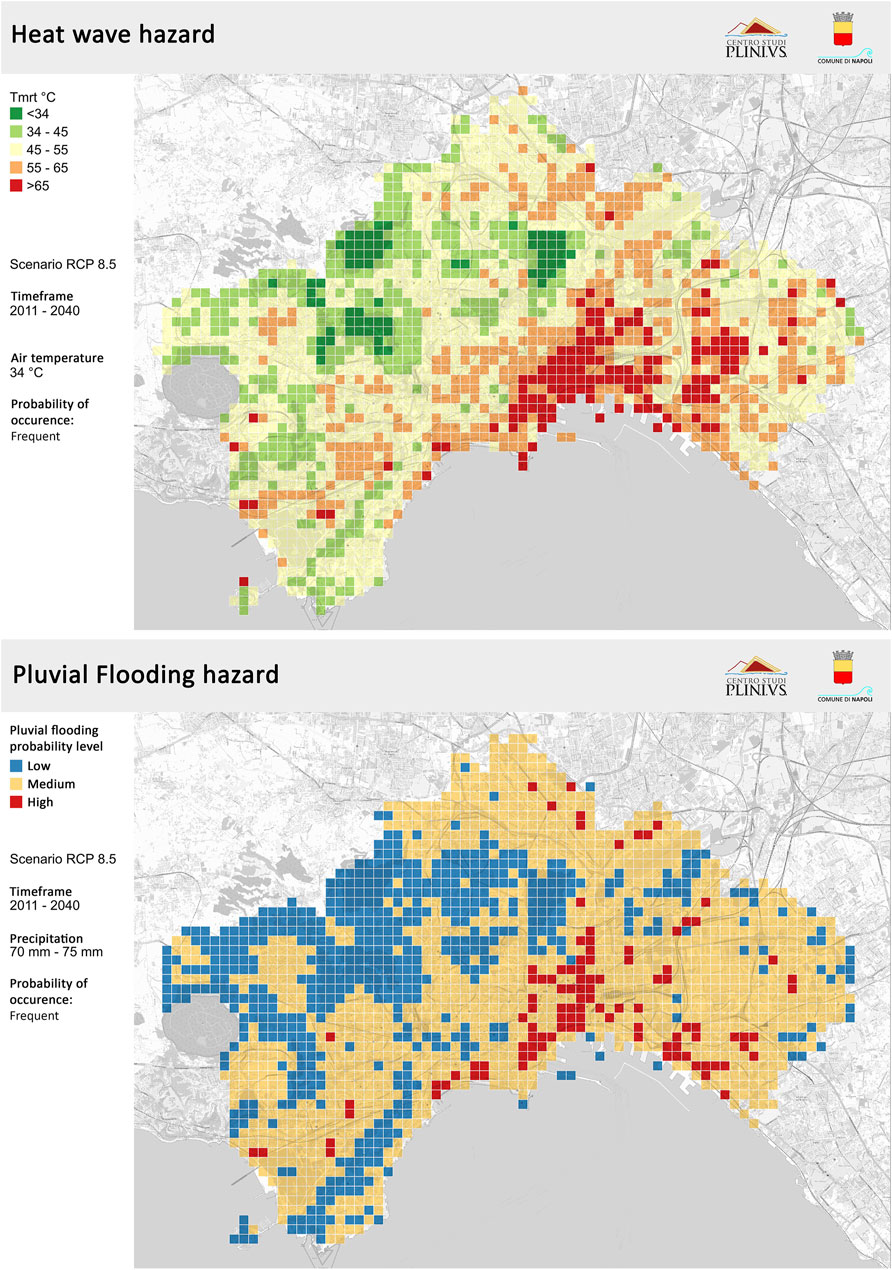
FIGURE 3. Hazard local effect results for Naples municipality from HWLEM (top) and FLEM (bottom), corresponding to a “frequent” event in the period 2011–2040, RCP 8.5.
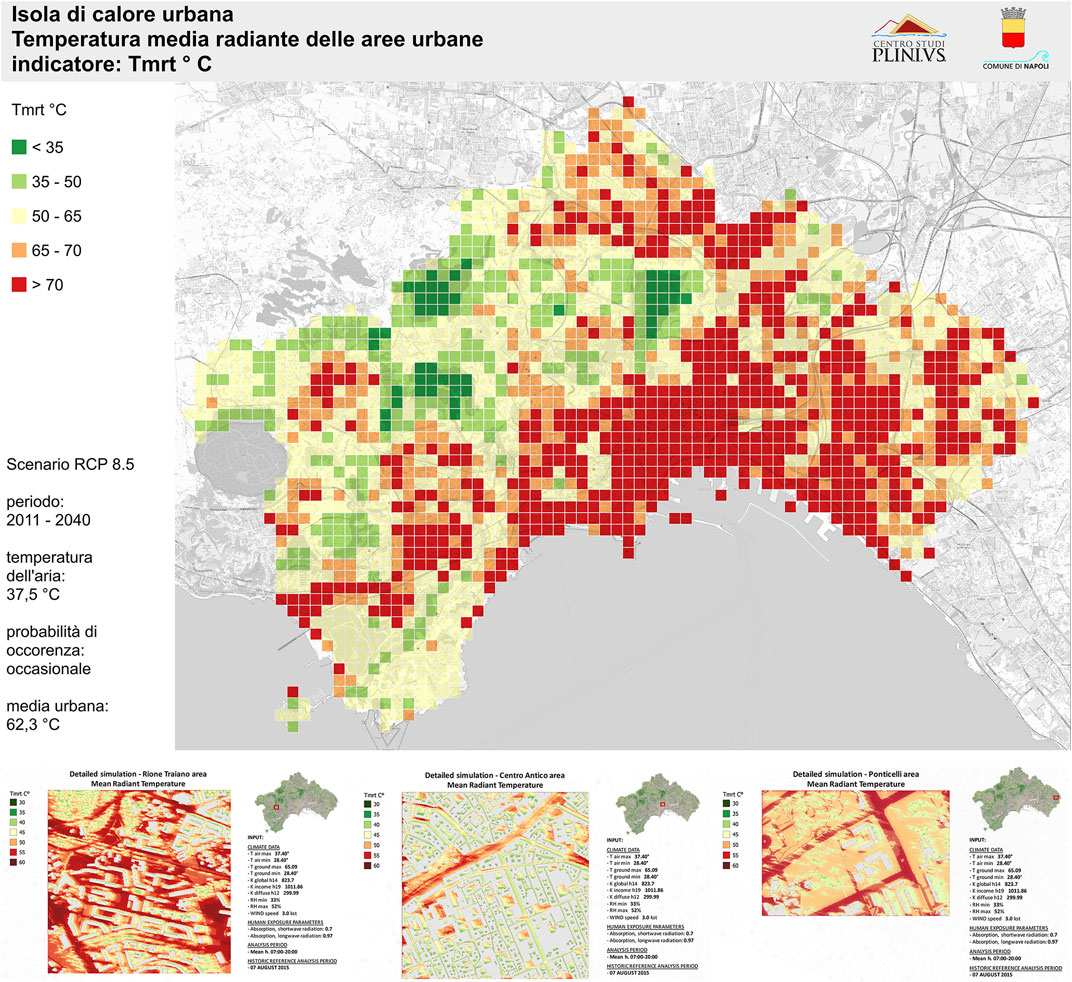
FIGURE 4. Example of detailed analyses of heat wave hazard on sample cells carried out through SOLWEIG model (bottom). Tmrt values correspond to an “occasional” event in the period 2011–2040, RCP 8.5.
The FLEM aims at capturing the flooding probability of urban areas following extreme rainfall events, as a proxy of expected water depth and velocity levels due to a combination of surface runoff and sewage system overload. This kind of “2D” flood simulation is extremely complex to automate on a pan-European scale due to the number of parameters involved and the level of detail necessary to represent the dynamics of the phenomenon in relation to the duration and intensity of the event. For this reason, the “screening” model allows an approximate evaluation, assigning a “risk coefficient” to the limited set of necessary parameters that is currently homogeneously available on a European scale, namely, the orography and relative altimetry of hydrographic basins, the presence of runoff streams, and the runoff coefficient in relation to land use.
The “expert” level version of the FLEM adds as parameters the sewer system capacity, based on the distribution of local network and basic assumptions derived from discussion with municipal service operators. The FLEM has been only partially validated through comparisons with data from past pluvial flooding events in Naples, with acceptable results (Figure 3, bottom).
Vulnerability, Risk, and Impact
Once the hazard has been determined with an adequate resolution level, the data related to exposure and vulnerability allow measuring the expected impact of the extreme heat and/or precipitation events considered. Within CLARITY, the risk/impact assessment is rooted on the conventional approach originally defined in risk science and theory of decisions (UNDRO, 1980; UN DHA, 1993; Coburn et al., 1994).
Such an approach considers risk as a product (in terms of probabilistic convolution) of hazard (H), exposure (E), and vulnerability (V), according to the known relation R = HxExV.
This conceptual framework is also adopted by the IPCC AR5—with a radical shift compared to AR2, AR3, and AR4 assessment frameworks, less aligned with the conventional risk assessment approach—further exploring the meaning of this equation: “Risks from climate change impacts arise from the interaction between hazard (triggered by an event or trend related to climate change), vulnerability (susceptibility to harm), and exposure (people, assets, or ecosystems at risk)” (IPCC, 2014b).
Vulnerability is then defined here as “susceptibility to harm” of a given “exposed element” (people, assets, and ecosystems) under the effect of a given hazard (be it rapid- or slow-onset). In other words, the vulnerability represents “the propensity or predisposition to be adversely affected” (IPCC, 2014b).
In the CLARITY methodology, this definition is formalized as “the probability of a given element at risk, classified as part of a specific vulnerability class, to be affected by a level of damage, according to a prefixed scale of damage, under a given hazard intensity.” Vulnerability is represented by a mathematical function defined as the degree of loss to a given element at risk, or set of such elements, resulting from the impact of a hazard of a given magnitude. It is specific to each hazard element at risk combination and expressed according to a “damage scale” (from no “damage” to “total damage”).
Vulnerability assessment then requires the preliminary identification of all the elements which may be at risk from a particular hazard, i.e., the exposure, understood as the probabilistic distribution that a given element (people, buildings, infrastructure, etc.) of assigned characteristics occupies in a given time a given geographical area (Zuccaro et al., 2018a; Zuccaro et al., 2018b).
In other words, the exposure represents the distribution of elements at risk on the territory, which are categorized into “vulnerability classes.” The definition of accurate quantitative vulnerability indicators thus heavily depends on the availability of data to organize exposure information into coherent and reliable “vulnerability classes” that represent homogeneous categories of elements at risk grouped according to the expected level of damage under specific hazard conditions.
Each “vulnerability class” can be then associated with a “vulnerability function,” expressing the probability that the elements in a given class exceed a certain level of damage, given a level of hazard magnitude. Vulnerability functions can be obtained through three different approaches, depending on the available information: “empirical methods” allow building functions from observed data, through statistical correlations of the damage caused by past events on samples of elements belonging to specific classes in relation to different hazard intensity ranges; “mechanical methods” allow determining calculated vulnerability functions through the statistical processing of the results obtained by analytical approaches conducted on a sample of virtual models representing the elements at risk examined subject to a representative set of hazards; hybrid methods evaluate the functions combining analytical approaches and observations of damage caused by past events (Zuccaro et al., 2018a; Zuccaro et al., 2018b).
The elements at risk against which the risk and/or impact of hazard(s) can be assessed are diverse and the identification of hazard and exposure is the first step to build up a coherent vulnerability analysis, determining for each of the exposed elements the relevant vulnerability factors in relation to the hazard(s) considered, which can be of physical, social, economic, and environmental type.
The vulnerability analysis framework may thus change according to data availability and resolution, with significant variations connected to the spatial scale of the analysis (global, national, regional, and local). For instance, the identification of building construction typologies at the international level would require the harmonization of several national datasets (where existing), and information derived from national datasets (e.g., census data) is generally more fuzzy and less reliable than local datasets built through surveys on site, which can obviously be performed only for limited spatial domains. Indeed, the increased availability of data from satellite, remote sensing, and IT mapping tools, as well as the progressive digitization of cadastral data in EU, represent relevant resources that can have a huge impact on the upgrade of exposure and vulnerability analysis methodologies in the near future.
A clarification is needed to precise the difference between “risk” and “impact”: the risk is the probability that a given damage level (e.g., on people, building, and infrastructure), because of a hazard event (understood as a potentially damaging physical event, phenomenon or human activity characterized by its location, intensity, frequency, and probability), is reached in a given period of time, in a specific geographic area. Thus, risk has to be intended as a cumulative assessment that considers the total potential damage that can be induced in the same area by several events (with different intensities or return periods) in a prefixed time window (Zuccaro and De Gregorio, 2013), normalized through an index (usually between 0 and 1). The impact scenario, instead, represents the probabilistic distribution, in a given geographic area, of the damage induced by a single hazard event with an assigned probability of occurrence (assumed as reference hazard scenario). The equation used for risk assessment can then be extended to impact scenario analyses, resulting in Iref_event = Href_event x E x V, with H assumed as reference event (Zuccaro et al., 2018a; Zuccaro et al., 2018b).
CLARITY tools have been designed to simulate impact assessments from the multiple reference events, allowing a proper quantification of the expected damage on selected elements at risk, provided that the exposure and vulnerability information are available.
In the case of heat waves, the element at risk considered is the population, and the expected impacts are related to the perceived discomfort that can lead to different levels of pathologies and an increase in mortality.
The perceived discomfort levels are assessed using the UTCI indicator (Universal Thermal Climate Index8), while the expected increase in mortality in relation to the intensity of the heat waves was assessed with the support of the Department of Epidemiology of the Regional Health Service of the ASL Roma 1, for the calibration of data from scientific reference literature (D’Ippoliti et al., 2010). The vulnerability classes are calibrated with reference to age, where the weakest population groups are children under 15 and the elderly over 65. Three classes have been defined (under 14, 15–64, and over 65), spatially distributed on each cell of the grid and classified in relation to the damage probability according to hazard thresholds. The possibility of using the age-class-related vulnerability curves depends strictly on the availability of exposure data (i.e., the geolocalization of population in the cities according to age groups). At the completion of the CLARITY project in 2020, this information was not present in any EU database, and consequently, the age-class vulnerability functions have been excluded from the CSIS European data package. Accordingly, the calculation of impact at the screening level is performed with a single vulnerability class for all population groups. However, the use of age classes could be implemented at the expert level, provided that the corresponding local data package includes exposure data related to the different age groups.
In the CSIS, specific vulnerability functions have been developed for the two main European climatic zones, acknowledging the difference between population in Mediterranean Europe and continental Europe in terms of temperature thresholds determining heat stress conditions (Goler, 2020). Direct costs related to healthcare have been also estimated, taking into account the multiple factors that determine the risk of hospitalization, such as corporeal risk factors (age; reduced autonomy; neurodegenerative diseases; dementias; cardiovascular diseases; obesity; malnutrition; use of medicines interfering with the body’s adaptation to heat); environmental factors (duration of heat wave; presence of atmospheric pollution; absence of air conditioning; lack of access to fresh areas during the day); special living or working conditions (social isolation; intense physical activity; working in presence of intense heat sources; work conditions that require warm or waterproof clothing).
Depending on the heat wave intensity and the combination of the above-specified factors, a spectrum of heat-related diseases and hospitalization needs can be defined, in terms of the average duration of treatment and stay in the hospital. In relation to each damage threshold, the duration of hospitalization and corresponding costs have been derived from a literature review (Merrill et al., 2008; Choudhary and Vaidyanathan, 2014; Isaksen et al., 2015; Liss et al., 2017). Indirect costs are also taken into account, in terms of decrease in local GDP due to hospitalization of people and consequent reduction of hours worked, estimated for EU countries through OECD data (Figure 5, top, shows an example of the expert level impact assessment for an occasional heat wave, 2011–2040, RCP 8.5).
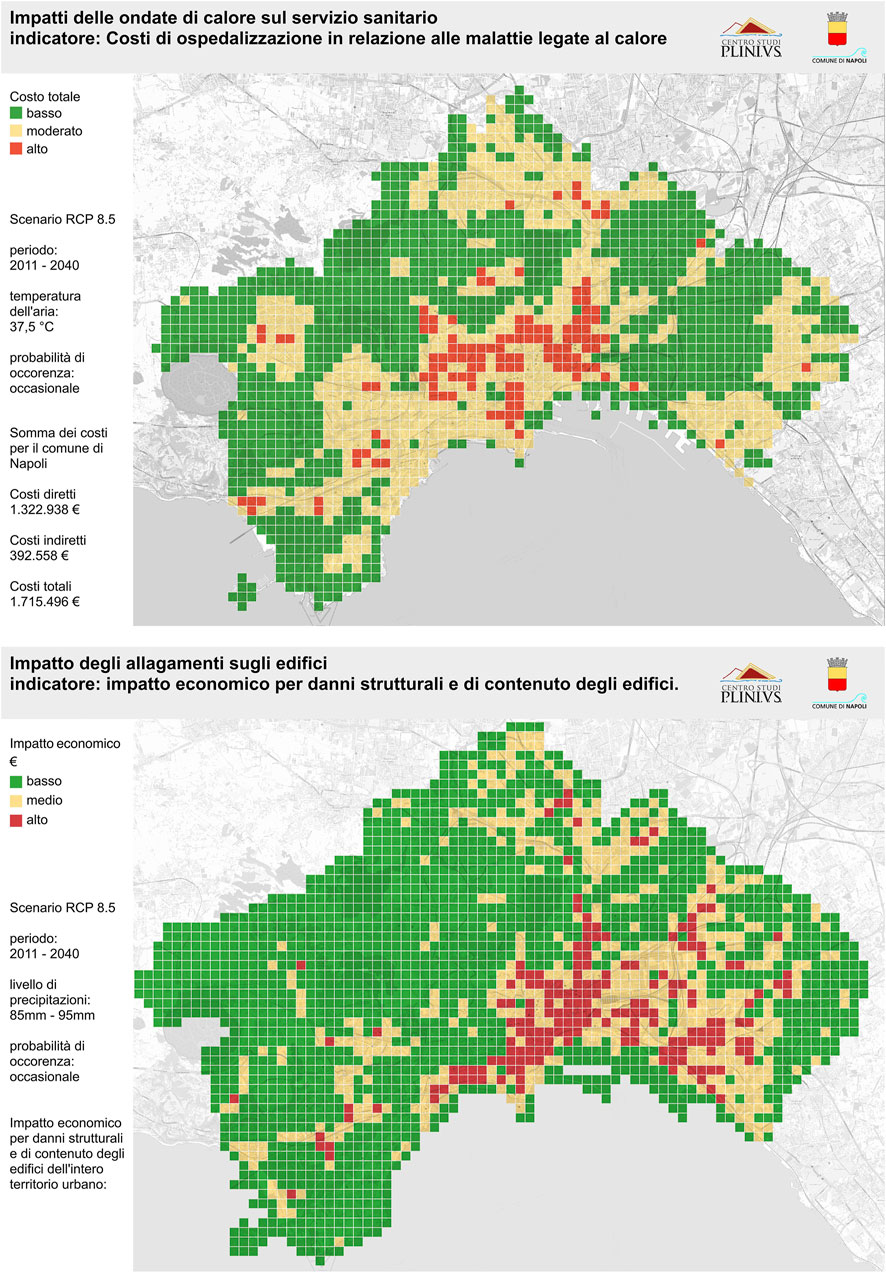
FIGURE 5. Example of economic impact results from HWLEM, related to hospitalization costs due to heat-related diseases (top), and FLEM, related to structural and content damage to buildings (bottom), corresponding to an “occasional” event in the period 2011–2040, RCP 8.5.
In the case of flood, the elements at risk considered are the road network and the building stock. Based on the expected flooding probability threshold following a given hazard intensity (expressed in amount of precipitation concentrated in 1 day), economic impacts related to cleaning and restoration of flooded roads sections, the repair of structural damage to property, and loss of value of building content due to flooding of ground floors and underground levels are taken into account.
Direct economic impacts have been determined through the depth-damage curves available at the European level (Huizinga et al., 2017), by associating to each class of the flooding probability index calculated through the FLEM a corresponding water depth value, calibrated through a survey of past events limited to Naples area. Further calibrations are currently carried out to improve the reliability of impact modeling results. Indirect economic impacts have been taken into account in terms of decrease in local GDP due to forced stop of the business activities and damage to stored goods. Different damage values have been calculated for residential and nonresidential buildings, also considering that it is common that in urban areas residential buildings host commercial and business activities located on ground floors and underground levels. However, the lack of detailed information about the distribution of such business activities in cities at the pan-European level results in high uncertainty about the economic impact output, which in the current version of the CSIS and expert level analyses is calculated on a qualitative scale (Figure 5, bottom, shows the impact on buildings).
The approach followed by CLARITY is to build up a theoretical hazard/impact model already designed in the perspective of wider availability of the missing datasets in the future harmonized at the EU level (e.g., age group distribution, heat-related hospitalization data, economic impact from flood events, and business activities location), thus making the CSIS and expert level models ready-made to exploit such data to produce better results.
Climate Adaptation Strategies and Measures
The results of the simulations of the local effect of hazards and the expected impacts on the elements at risk allow us to identify the urban areas where the climate risk is higher and consequently to support the definition of local priorities in terms of adaptation strategies and measures.
A particular feature of climate-related hazards, compared to other hazard categories such as geophysical hazards, is in fact the possibility of reducing the impacts by acting on the local aggravation component of the hazard, rather than reducing the vulnerability of the exposed elements.
In fact, most of the adaptation measures included in the CLARITY model tend mainly to influence the “local effect” parameters (albedo, emissivity, evapotranspiration, shading, runoff coefficient, etc.), which results in a reduction of the impacts from heat waves, by acting on the surface temperatures of buildings and open spaces and obtaining an improvement in the conditions of perceived thermal stress and the reduction of the Urban Heat Island (UHI), and from flood events, by acting on the capacity of urban surfaces to ensure adequate levels of drainage and storage of rainwater.
In relation to both categories of climate risk, however, it is appropriate to highlight the additional benefits linked to some types of adaptation measures, in particular Nature-Based Solutions such as green roofs, bioswales, trees, or urban green areas, which contribute to carbon sequestration and climate mitigation, in terms of local contribution to the reduction of global greenhouse gas emissions (Strohbach et al., 2012). The CLARITY focus on climate adaptation brought to the choice of including the climate change mitigation potential of some measures in terms of environmental cobenefits.
The climate adaptation solutions to be integrated into urban transformation actions should be defined in fact in relation to not only the achievable climate adaptation benefits but also the possibility of conveying a series of social, economic, and environmental cobenefits linked to the reconfiguration of buildings and open spaces.
The identification and communication of the cobenefits of climate adaptation is a priority for urban decision-makers since it allows broadening the consensus regarding resilient urban transformation strategies on the part of local communities (Floater et al., 2016), often expressing urban regeneration needs and priorities not explicitly linked to climate action (e.g., better quality of housing, greater endowment of equipped public spaces and green areas, and better accessibility to transport systems) but also directly associated with the potential cobenefit of urban adaptation, thus triggering a virtuous circuit of support for public initiatives in the implementation of interventions.
NBS represents the category of adaptation measures which also in the case of cobenefits guarantee additional by promoting biodiversity conservation and ecosystem services’ enhancement, while simultaneously responding to major urban challenges such as well-being and higher quality of public spaces, poverty reduction, and green/circular economy improvement (European Commission, 2015; EEA, 2017; Maes and Jacobs, 2017; Raymond et al., 2017; Rosenzweig et al., 2018).
The CLARITY platform allows the integration of a series of adaptation measures, selected from the most widespread and effective ones emerging from implemented urban adaptation projects and from the systematization of state-of-the-art online platforms and scientific literature (Climate-Adapt; Van De Ven et al., 2016; atelierGROENBLAUW, 2016; D’Ambrosio and Leone, 2017; Raven et al., 2018). Adaptation measures can be selected from a database that includes for each of them a “fact sheet” with a technical description and information related to achievable climate benefits and related cobenefits, as well as the parametric costs for the implementation of each measure (Figure 6, top).
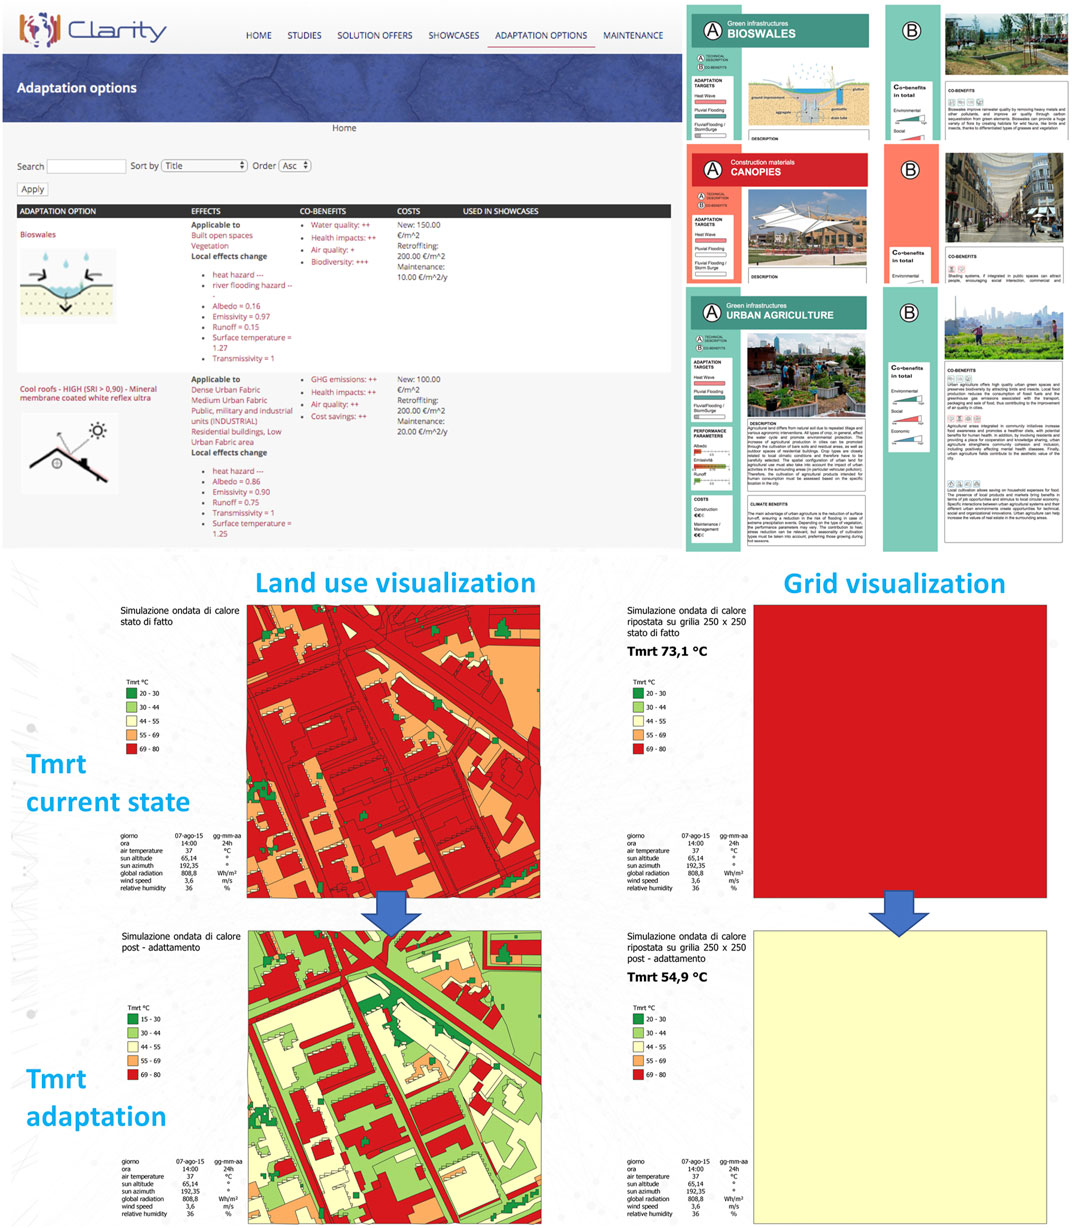
FIGURE 6. CSIS screenshot for the step “Identify adaptation options” (top-left) and adaptation measures “fact sheets” (top-right); an example of modification of Tmrt values on a cell following the integration of adaptation strategies (bottom).
The catalog of adaptation measures is useful for integrating into the analysis report downloadable from the CSIS platform-specific information about the most suitable types of interventions to support the local adaptation process. However, it is important to underline that the effectiveness of adaptation measures (both in terms of climate benefits, associated cobenefits, and cost-benefit ratio) is strongly linked to the ability to effectively integrate them into more complex “adaptation strategies,” which are usually locally defined also in relation to broader objectives of urban transformation and regeneration, considering how only a widespread and synergistic application of the individual measures can guarantee the effectiveness of the adaptation action, and only their diversification in relation to the specificities of urban contexts, in relation to morphological and land use variables, can convey the expected benefits.
To simplify the process on the user’s side, a set of adaptation strategies are predefined in the CSIS front-end and can be selected to test the effect of adaptation through the simulation tool. Each adaptation strategy is linked to a specific land use class and modifies the morphological and/or surface characteristics in the study area in which they are applied (Figure 6, bottom), returning, as a result, the expected reduction of heat wave and flood impacts, also including a parametric estimate of the implementation costs.
Parametric costs have been derived from a previous national research project conducted at UNINA Department of Architecture (Metropolis “Integrated and sustainable methods and technologies for resilience and safety in urban systems”). Originally determined through analyses of the Italian construction market (D’Ambrosio and Leone, 2016), within CLARITY, the parametric costs of adaptation measures have been extended to other EU countries through comparative studies.
Cobenefits have been derived from diverse sources (Floater et al., 2016; Eggert, 2020) and connected to each adaptation measure as found in literature, grouped into three main categories (environmental, social, and economic), and homogenized into a qualitative scale, with a pure indicative purpose, since the values are not used in the CSIS calculation. The purpose is mainly to inform end-users about the achievable “cobenefits” (as described in the fact sheet box), linked to each solution.
Results
The CLARITY Expert Service for the City of Naples
The application of CLARITY climate services by local authorities can be of strategic importance to implement urban climate adaptation in a multiscale planning and design perspective. The variable detail of the analysis outputs allows the tool to be used from the strategic planning up to district-scale projects, guaranteeing coherence of the adopted measures across the different planning/design levels.
This approach was tested by the municipality of Naples, partner of the project, which has used CLARITY tools to build an accurate local climate change profile, including the analysis of seasonal trends and extreme events, and to implement simulations to support the integration of urban adaptation strategies in the development of the new SECAP, Sustainable Climate and Energy Action Plan (strategic level), the update of the PUC, Municipal Urban Plan (city level), and the drafting of the Ponticelli PRU, Urban Regeneration Program (district level). The whole process has been publicly discussed and codesigned with the following technical services of the municipality of Naples: Environmental Controls and SEAP Implementation, General Urban Planning and Common Goods, Social Housing, and New Centralities.
Climate Change Profile and Land Use Data for the City of Naples
Naples, like many urban areas in Mediterranean Europe, has already been facing in recent years a significant climatic variation compared to the 1971–2001 “historical” reference period. The last few years have shown a constant increase in the minimum and maximum temperatures (to which more frequent episodes of heat waves are associated), while seasonal precipitation patterns have seen an increasingly marked alternation between periods of drought and extreme events characterized by high rainfall concentrated in a few hours (which cause surface flooding episodes, even critical). The available simulations referring to future scenarios (until 2100) confirm these trends, with uncertainties related to the intensity of the expected climate change related to different GHG emission scenarios on a global scale.
Climate indices at the base of hazard local effect analyses are derived by EURO-CORDEX simulations. All the data of the ensemble are “bias-corrected” compared to the daily observation dataset on the E-OBS grid. The results are available for historical (1971–2000) and future periods (2011–2040, 2041–2070, and 2071–2100). Within dedicated workshops conducted in Naples with CLARITY partners, local experts, and stakeholders, it has been decided to focus the expert level analyses with reference to two main Representative Concentration Pathways: RCP 8.5 (which reflects the current global warming trend) and RCP 4.5 (which reflects a scenario of gradual reduction of emissions on a global scale).
Figure 7 (top) shows the summary of extreme events relevant for the Naples area in terms of frequency and intensity. The data analysis indicates that events similar to those recorded in the last 5 years (36°C for periods even longer than six consecutive days) will increase significantly in terms of frequency and intensity in the next 30 years, up to reach, in the second half of the century, intensity levels which have not yet occurred (over nine consecutive days with temperatures above 38°C).
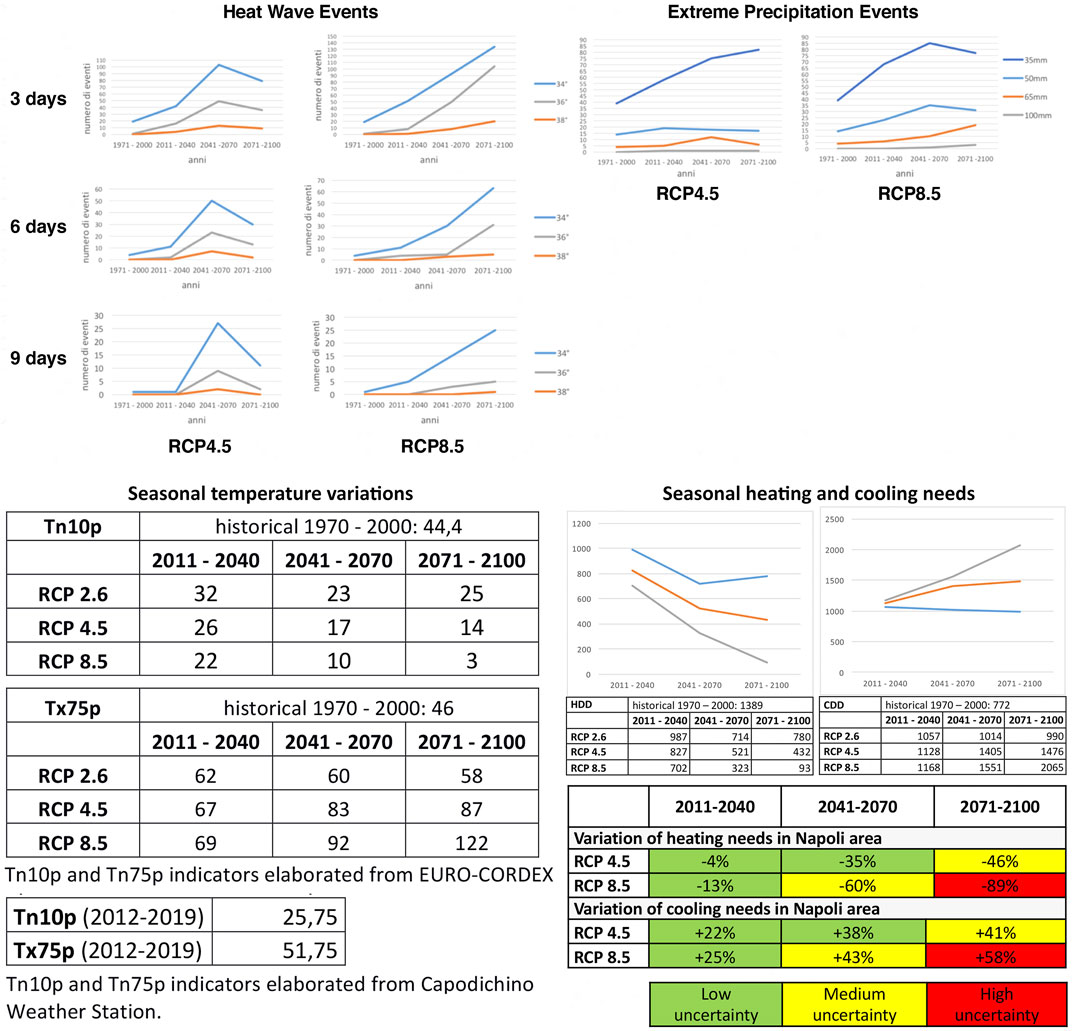
FIGURE 7. Extreme events of temperature and precipitation (top), seasonal temperature variation (bottom-left), and heating/cooling needs (top-right) in Naples.
As for the heat waves, the increased frequency and intensity of extreme precipitation events represent a signal of the ongoing climate change, indicating the transition of Naples area towards subtropical and tropical climatic conditions. The projection of subdaily precipitation was not available among CLARITY climate indicators. Accordingly, observations and projections about the daily trends are assimilated into time periods of less than 6 h, which is a recurring characteristic in the case of Naples. In future periods, extreme precipitation events are likely to exceed the thresholds observed during recent storms in Naples (above 60 mm/day concentrated in a few hours). The data analysis indicates that events similar to those recorded in recent years will increase significantly in terms of frequency and intensity in the next 30 years, up to, in the second half of the century, intensity levels which have not yet occurred (100 mm/day).
Upon request of the Environment Department of the municipality of Naples, further indicators have been extracted from the CLARITY database and processed to provide estimates in relation to energy consumption for buildings heating and cooling in relation to the expected climate change scenarios, namely:
• Tn10p: average number of days in which the minimum daily temperature is lower than the 10th percentile of the minimum daily temperatures on a 5-day window.
• Tx75p: number of days in which the maximum daily temperature is higher than the 75th percentile of the maximum daily temperatures during the warm season of April-September of the period 1971–2000.
The same indicators were extracted with the same method from a dataset of observed data for the period 2012–2019, from Naples Capodichino weather station, in order to verify the deviation from the historical analysis period considered by EURO-CORDEX (1970–2000), with more recent data affected by the ongoing climate change. As shown in Figure 7 (bottom-left), the elaboration shows values close to the EURO-CORDEX estimates for the period 2011–2040, congruent with the expected trends, considering that the baseline period corresponds to the first forecasting EURO-CORDEX decade and that going towards 2040 the Tn10p indicator will continue to decrease, while the Tx75p indicator will continue to grow.
For the same 2012–2019 reference period, two additional indicators related to the estimate of the energy needs for buildings heating and cooling have been extracted from a local weather station hosted at LUPT-PLINIVS headquarters, located in the city center:
- HDD (Heating Degree Days): used to determine building heating schedule at the city level.
- CDD (Cooling Degree Days): used to determine building cooling schedule at the city level.
Data referring to the abovementioned indicators are shown in Figure 7 (bottom-right).
They are calculated, in a simplified way, by operating the difference between the average value of the daily temperature and a predetermined value. In the case of Naples, the value is 18.3°C, commonly used as an outdoor temperature threshold which guarantees indoor comfort conditions both in summer and in winter without the need for heating/cooling systems. The indicator shows the difference in the average value of the temperature detected by the station itself for the various months. In winter, the resulting Degree Days (DD) correspond to the heating/cooling needs for indoor spaces.
Alongside the definition of climate change indicators and extreme events scenarios to take into account within urban planning and design activities, a review of the locally available land use datasets has been carried out in order to provide a reliable estimation of the “local effect” of heat wave and flood hazards. The datasets shared by the City of Naples, currently used for planning purposes at various levels, have been verified and corrected (in terms of geometries and intended uses) through comparisons with recent high-resolution satellite images (e.g., Pleiades 2018 data to extract NDVI information) and integrated with the input parameters required by the models.
The resulting land use map (Figure 8) is extremely detailed and adds to the geometric and morphological data of buildings and open spaces also essential elements not often present in ordinary cartographies, such as the presence of trees and the characteristics of albedo, emissivity, and runoff of the different urban surfaces.
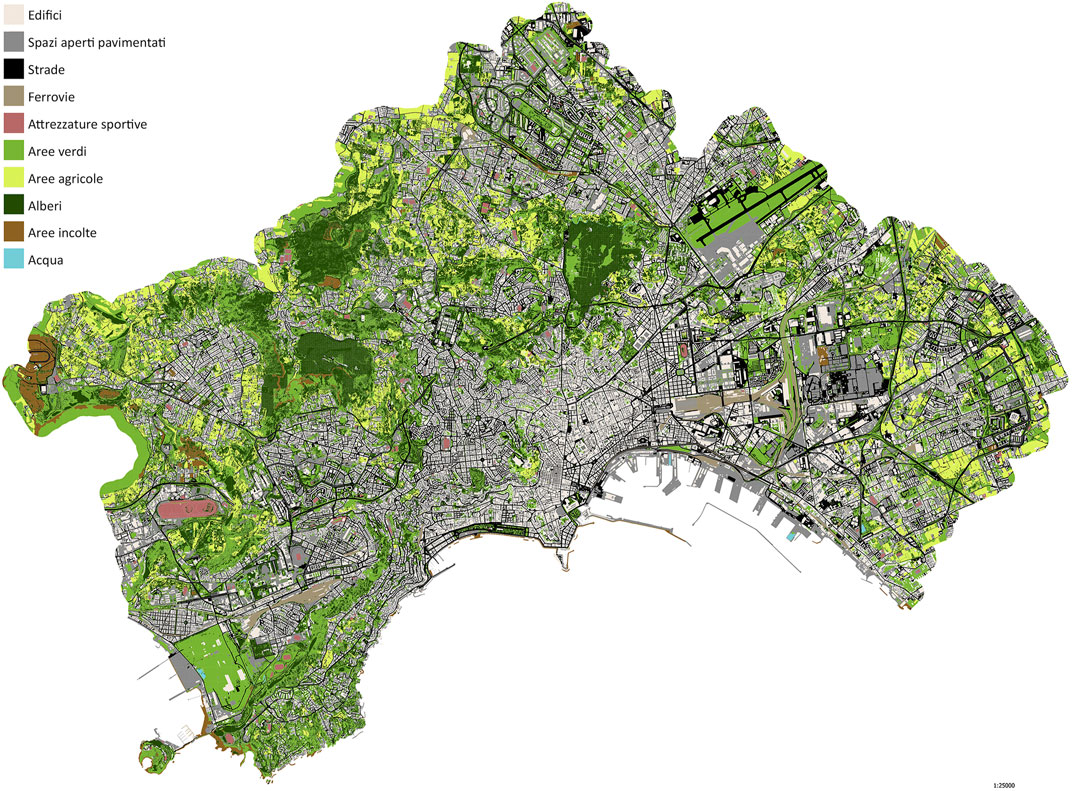
FIGURE 8. Updated land use map of Naples used from HWLEM and FLEM calculation.
The processing of the model’s input parameters allows us to carry out simulations according to different air temperature ranges expected in the City of Naples, as derived from climate projections. As an example, while Figure 3 (top) shows the Tmrt values related to a “typical” heat wave, of no particular intensity, but which has a high probability of occurring considerably more often in the near future (as the event of 28–31 July 2020 demonstrated), Figure 9 shows a critical event with air temperature 41°C, classified as “rare” for the period 2041–2070.
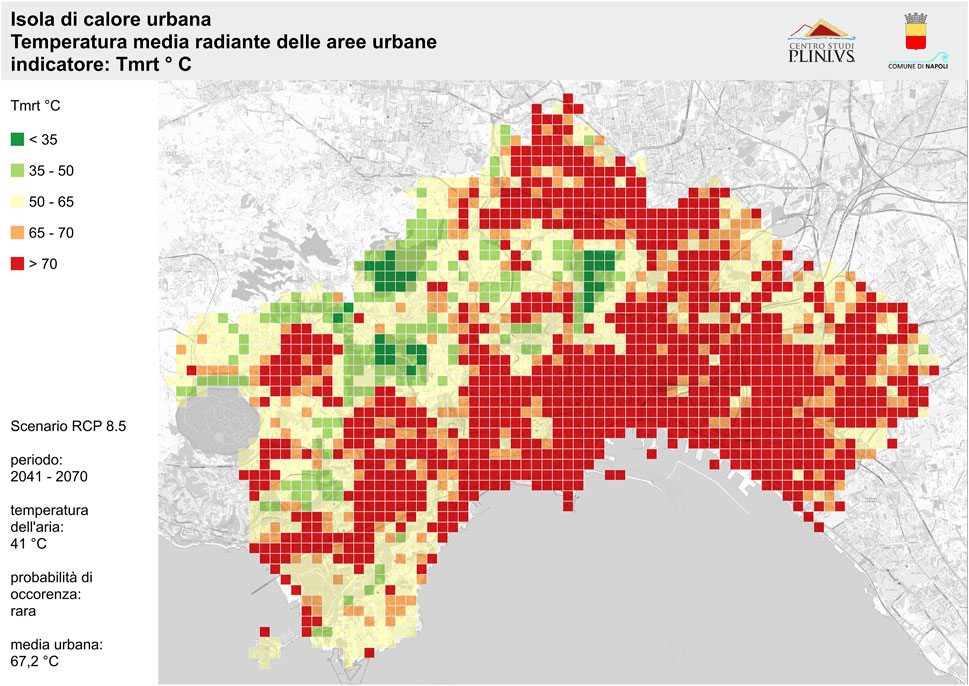
FIGURE 9. Hazard local effect results for Naples municipality from HWLEM. Tmrt values correspond to a “rare” event in the period 2041–2070, RCP 8.5.
The levels of detail range from a 250 × 250 m mesh overlapped to the territory for city-wide analyses, up to a 1 × 1 m and 3D representation for neighborhood-scale simulations. The choice of the reference analysis mesh has been agreed upon with the local end-users, and it is the same grid used by local authorities and civil protection to perform risk and impact assessment of other relevant natural hazards in the area, such as earthquakes and volcanic eruptions. This will allow harmonizing the output derived from CLARITY modeling workflow with seismic and volcanic risk impact assessments produced by PLINIVS for the Metropolitan City of Naples as Center of Competence of the Italian Department of Civil Protection (Zuccaro and De Gregorio, 2019), thus allowing the identification of existing multirisk conditions, as well as the development of potential integrated strategies for CCA and DRR in the area. Such an approach increases the end-users’ awareness of the need of implementing holistic resilience-based urban planning and design interventions, streamlining funding allocations in relation to the diverse sources of risk and the planned urban infrastructure developments.
The adaptation measures fact sheets have been translated in Italian and used to support the codesign of adaptation strategies with local stakeholders in relation to the different planning levels identified.
During the codesign workshops, the Technical Departments of the Municipality of Naples have identified the general framework that defines the potential contribution of CLARITY climate services in the context of a multiscale integrated urban adaptation planning. The main priority is to use the same approach for technological support across the different urban planning/design levels, so to enhance the coherence of concepts, methods, and assessments at the levels of strategic planning, city planning, and urban design.
Napoli SECAP
In 2015, the Covenant of Mayors and Mayors Adapt initiatives have been officially joined in the Covenant of Mayors for Climate and Energy, which aims to achieve by 2030, within an integrated approach to climate change mitigation and adaptation.
Concerning climate mitigation, the following objectives are set:
• A reduction of at least 40% of greenhouse gas emissions.
• A share of at least 32% of energy production from renewable sources.
• A share of at least 32.5% of building energy efficiency improvement.
With regard to climate adaptation, it is required to take appropriate actions to prevent or minimize the expected impacts through appropriate planning actions in the short, medium, and long term.
The municipality of Naples intends to adhere to the Covenant of Mayors for Climate and Energy by applying CLARITY methodology and tools to perform the required climate change risk and vulnerabilities assessment at the city level, as a knowledge base for outline a sustainable and resilient urban vision. Compared to the original structure of the SEAP, the drafting of the SECAP requires, by the signatory local authorities, the need to extend the knowledge framework from the sole analysis of energy consumption and the consequent CO2 emissions of the various urban services and infrastructures (carried out through the BEI, Baseline Emissions Inventory), towards a full understanding and assessment of the risks, vulnerabilities, and climatic impacts from extreme weather events and seasonal trends variations, to be carried out through the RVA (risk and vulnerability assessments).
CLARITY methodology is in fact in line with the approach identified by the guidelines of the Covenant of Mayors for Climate and Energy (Neves et al., 2016) and the guidebook of the Joint Research Center of the European Commission (Bertoldi, 2018), created to support local authorities in the transition from the “SEAP” to the “SECAP.”
In the Napoli SECAP, the indicators adopted to assess vulnerability are subdivided, in compliance with the JRC guidelines, in two categories: “socioeconomic vulnerability” and “physical and environmental vulnerability.”
As outlined in Result, vulnerability is defined as the probability that an element at risk, belonging to a vulnerability class, experiences a level of damage, according to a predefined damage scale, as a response to a hazard event of given intensity. To be compliant with the JRC guidelines, however, the vulnerability indicators to report in the SECAP template (section “Vulnerabilities of your local authority or region”) include all the relevant parameters related to the calculation of exposure of elements at risk, as well as heat wave and flood local effects values, as fundamental “socioeconomic” and “physical and environmental” variables. It should be noted that this does not influence the RVA methodology adopted, which is instead based on the CLARITY approach, as outlined in Result.
The SECAP requires the identification of assets and people at risk from climate change impacts, targeting the “impacted policy sectors” and identifying specific impact indicators for each sector considered.
In addition to the impact indicators used in the CLARITY CSIS, the expert level study includes the expected increase in building cooling costs due to increasing summer temperatures, based on the analysis of the variation of HDD and CDD indicators. Trends in energy consumption for heating and cooling are foreseen in the reference periods for the RCP 4.5 and RCP 8.5 scenarios, mainly referring to the consumption of gas for civil use in the winter and to the electricity consumption for air conditioning in the summer, which currently represent the prevalent energy sources in the metropolitan area of Naples.
These estimates support SECAP implementation not only in the “Adaptation” section but also in relation to “Mitigation,” correlating the energy consumption with the corresponding GHG emissions from the civil sector in relation to the expected climate change scenarios. Uncertainties have been taken into account in relation to variation in global climate trends, considering decreasing confidence intervals towards 2100 (Figure 8, bottom-right).
Table 1 illustrates the contribution to the Napoli SECAP for the section “Expected impacts in your local authority or region,” as requested by the template of the Covenant of Mayors for Climate and Energy9.
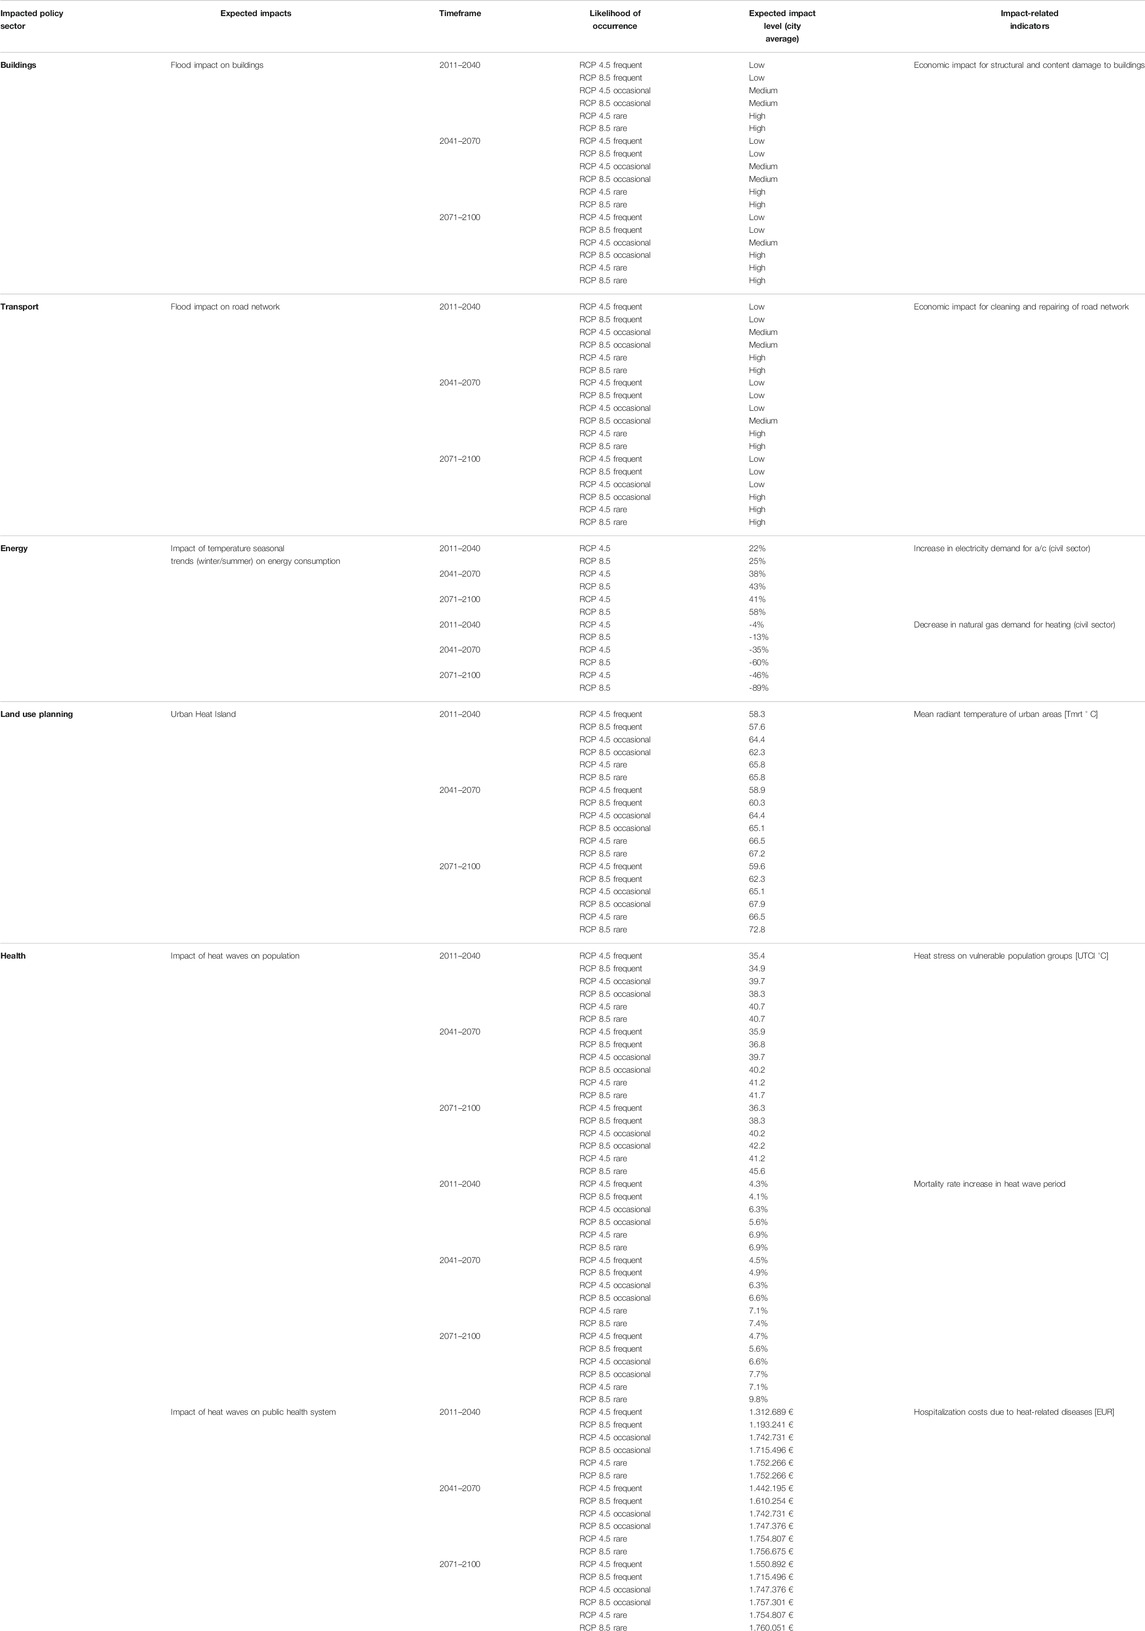
TABLE 1. Summary of impact indicators calculated for the Naples SECAP.
For each of the expected impacts on the identified policy sectors, ad hoc simulations developed by PLINIVS allow determining the value of the impact-related indicators through the impact scenario analysis and feeding the corresponding section in the SECAP template, which requires only qualitative values related to the likelihood of occurrence (unlikely, possible, and likely), expected impact level (low, moderate, and high), and the timeframe (current, short, medium, and long term).
Impact scenario analyses are carried out by using the following correlation between CLARITY scenario taxonomy and SECAP template:
• Likelihood of occurrence
o Rare (CLARITY) = unlikely (SECAP)
o Occasional (CLARITY) = possible (SECAP)
o Frequent (CLARITY) = likely (SECAP)
• Timeframe
o 2011–2040 (CLARITY) = current (SECAP)
o 2011–2040 (CLARITY) = short term (SECAP)
o2041–2070 (CLARITY) = medium term (SECAP) o 2071–2100 (CLARITY) = long term (SECAP)
• Expected impact level
o Very low-low (CLARITY) = low (SECAP)
o Medium (CLARITY) = moderate (SECAP)
o High-very high (CLARITY) = high (SECAP)
To support the strategic vision at the city level, all ongoing and planned urban regeneration projects in Naples deemed relevant in terms of urban climate adaptation have been mapped and analyzed in terms of variation of heat wave and flood hazards and associated impacts (Figure 10 shows the results for the Tmrt indicator).
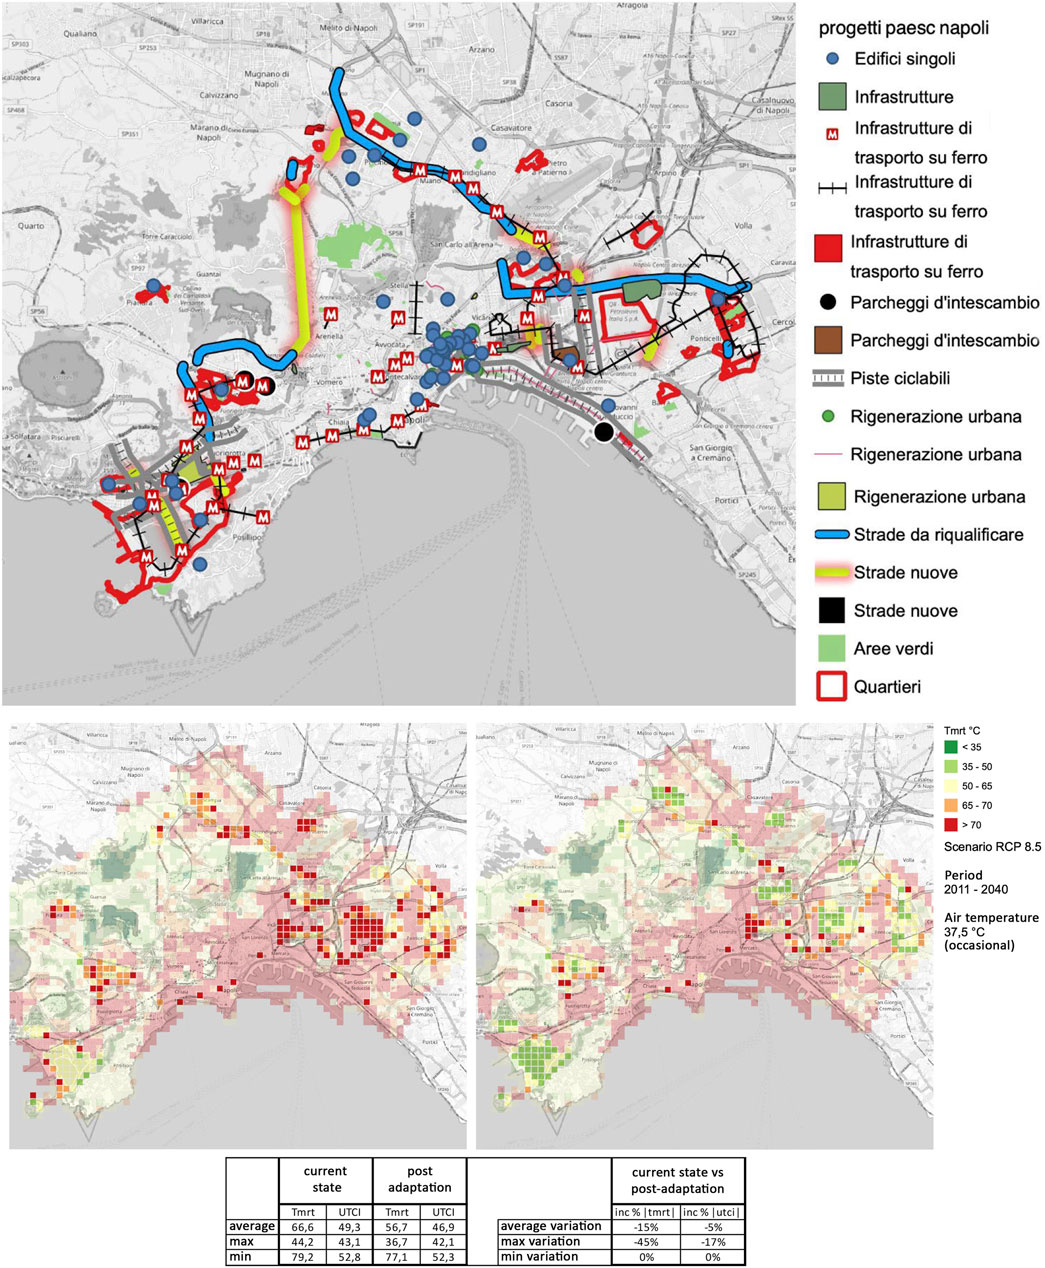
FIGURE 10. Ongoing and planned urban regeneration projects in Naples (top) and potential benefits in terms of climate adaptation (bottom).
The mapping returns a broad and articulated picture of the projects carried out by the municipality of Naples, characterized by diversified stages of progress (planned interventions, projects currently in the design phase, currently in the implementation phase, and completed), which correspond to different opportunities for integration of climate adaptation measures and strategies, whereas it is not adequately taken into account by the project itself.
In particular, depending on the implementation stage of each project, a proposal to maximize its adaptation potential is done based on the following considerations:
• Planned interventions: full integration of climate adaptation measures, following the technical guidance contained in the Preliminary of the PUC, Municipal Urban Plan (Comune di Napoli, 2020).
• Interventions currently in the design phase: integration of variable climate adaptation measures according to the design level (preliminary design: 100%; final design: 70%; execution design: 50%), to be selected minimizing the need for variants and evaluating the opportunity for integration in the tender phase as elements characterizing the technical offer scoring.
• Interventions currently in the implementation phase: integration of climate adaptation measures limited to certain elements (new green areas and trees, new canopies and shelters, replacement of asphalt surfaces with medium gray stone paving, etc.), depending on the type of project and the state of implementation.
• Completed interventions: no integration possible, evaluation of the intervention carried out in terms of contribution to climate adaptation according to the measures actually implemented.
An example of cost-benefit calculation through CLARITY tools focused on long-term “ideal” adaptation strategies towards 2050 is included in the SECAP, representing a strategic adaptation planning vision. The information about potential implementation costs of adaptation strategies/measures was requested to support decision-makers and technical departments providing a knowledge base useful for negotiating the allocation of funding at the national and regional level, in particular in the context of the Cohesion Funds 2021–2027 (being Naples among the EU regions beneficiary of the highest share of funding allocation) and in light of the EU Green Deal and the Next Generation EU programs. While the city-wide adaptation costs might seem like a huge figure to bear (Figure 11), if gradually implemented over 10–30 years to support the EU’s adaptation strategy towards 2030–2050, it consists of only 3–1.5% of the GDP of the Metropolitan City of Naples, representing at the same time investment with a highly positive payback. Furthermore, when the figure is divided by focusing on specific areas (see Figure 12), the costs are perfectly in line with similar urban regeneration interventions.
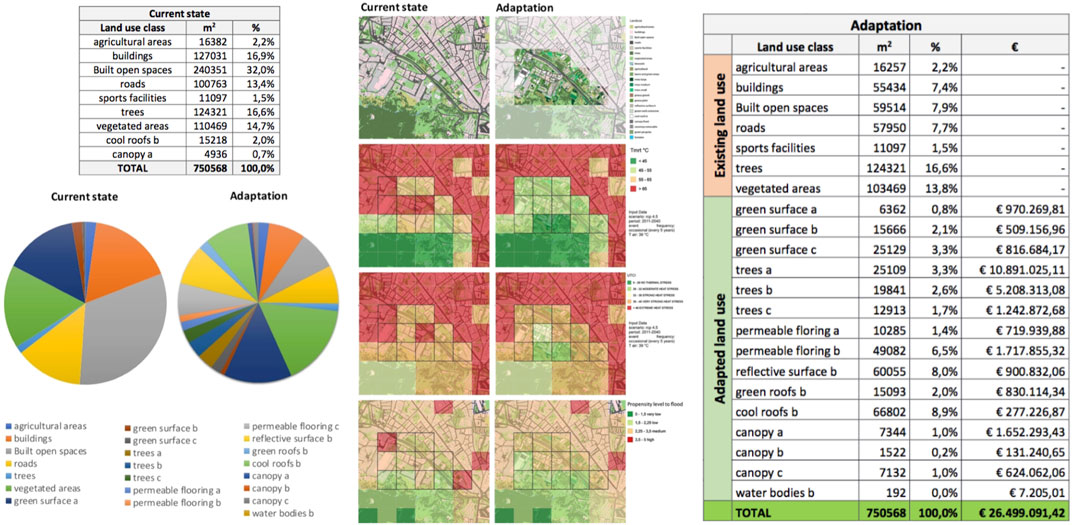
FIGURE 11. Cost of climate adaptation at the city level, considering an “ideal” strategy towards 2030 and 2050.
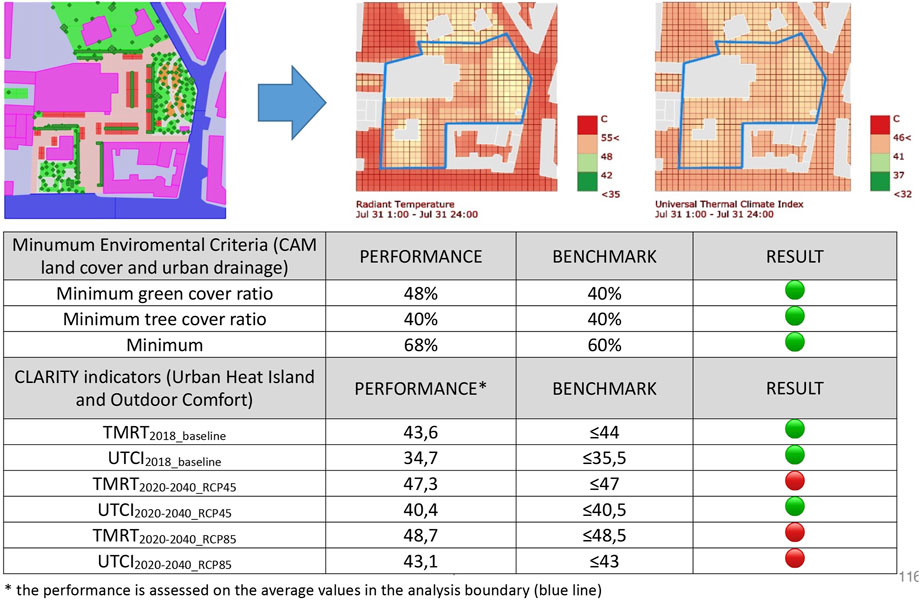
FIGURE 12. Analysis of an adaptation project for a sample district classified as an “urban regeneration area” in the PUC.
PUC: Municipal Urban Plan
The Naples PUC has been the first official planning document that integrates CLARITY data, simulations, and guidelines as a cornerstone of local climate action (Comune di Napoli, 2020).
The update of the Municipal Urban Plan for the municipality of Naples is based on the preliminary document “Naples 2019–2030. City, Environment, Rights and Common Goods” (Comune di Napoli, 2019), which includes a specific focus on climate adaptation.
Hazard/impact modeling results serve as an initial analysis, to determine e.g., the city districts most at risk from heat waves and floods, and the identification of targeted actions in relation to other urban regeneration priorities addressed by the PUC (retrofitted eco-districts, urban drainage, urban forestry, changes in land use, and continuity of green infrastructures). Overall, the identified heat waves and flood hotspots will suggest criteria and guidelines for reviewing the zoning of the city plan based on identified climate risks and expected impacts.
Based on the results of the city-wide climate hazard analyses and their correlation with urban redevelopment priorities as defined by the PUC, specific adaptation plans have been developed in city areas identified by the PUC as interested by urban regeneration projects, calculating their performance in terms of heat stress reduction and the corresponding implementation costs.
The adaptation project of the sample areas was developed together with the municipality of Naples within dedicated workshops. Once the strategies applied return the optimal results in terms of UTCI, Tmrt, and flood probability, a cost analysis is performed based on the percentage of land use modified. Total costs refer to the cells corresponding to the project area, marked with a black boundary in Figure 12, as an example of the detailed analyses carried out. The possibility of analyzing the potential for climate adaptation together with such a detailed control of expenditure allows a proper allocation of financial resources devoted to the implementation of the PUC subprojects.
To ensure that future interventions in the PUC subproject areas are in line with the CLARITY approach, specific guidelines have been produced highlighting the criteria for integrating adaptation measures in the design of buildings and open spaces. The guidelines are designed in the form of Technical Implementation Rules (NTA) of the PUC, constituting the regulatory framework for all urban projects, of both public and private initiatives.
General criteria related to land use in terms of permeable surface ratio, shading ratio, vegetative coverage, and tree density ratio have been established also following the 2017 national law about Minimum Environmental Criteria (CAM Edilizia), mandatory for all public interventions, complemented with CLARITY impact indicators. The approach envisaged by the municipality is to link the mandatory Strategic Environmental Assessment (SEA) to the CLARITY simulation tools, granting the permit only if all threshold values are met (Figure 13).

FIGURE 13. Analysis of a neighborhood development project from a private initiative subject to Strategic Environmental Assessment (SEA).
Furthermore, each adaptation measure has been classified in relation to the land use category to which it is applied (roads, public/private open spaces; public/private buildings) and the intervention categories as defined by the PUC (ordinary maintenance; extraordinary maintenance; restoration and conservative rehabilitation; building renovation; urban retrofitting; new development), highlighting the level of applicability for each combination.
Ponticelli District Regeneration Plan
The Urban Redevelopment Program (PRU) in the Ponticelli area represents an exemplary case for deepening the issues related to climate adaptation integrated into urban regeneration interventions on a district/neighborhood scale.
Ponticelli represents an emblematic example of the failure of the emergency redevelopment process that shaped the suburbs of Naples after the earthquake of 1980. Several criticalities arise from the postearthquake program (PSER, Extraordinary Housing Program 1981–1986), which has been only partially implemented. From the originally planned mixed-use district for the resettlement of residents of the damaged neighborhoods of Naples historic center, only the housing units were actually built by expropriating agricultural areas, thus creating a monofunctional residential district. The lack of infrastructures and public services contributed to aggravate the urban fragmentation, with social and spatial segregation dynamics between PSER urban blocks and the preexisting built/social fabric typical of the Ponticelli historic center and of the consolidated early/mid-20th century urban development.
Climate change impacts here are evidently exacerbated by the poor planning process: overdimensioned road sections and large impervious open spaces between housing units with no vegetation, energy-intensive buildings, abandoned expropriated areas, and degradation of the historical drainage systems characterizing the original agricultural wetland landscape.
The PRU aims to reconfigure the district by realizing the needed public spaces/services and resolving the still existing housing emergency, due to the fact that postearthquake temporary houses became permanent “slums” and that the social housing stock is in a state of structural and technological decay due to the lack of maintenance of the publicly owned buildings.
The support provided by CLARITY concerns a series of detailed simulations related to the nine PRU subareas. The goal is to evaluate the effects of different solutions regarding the layout and morphology of buildings, the surface materials of buildings and open spaces, the vegetation layouts, and the organization of public spaces and equipment.
The simulations are performed in a three-dimensional environment with a resolution of 1–5m, using the SOLWEIG model in combination with an original parametric workflow developed in Grasshopper, based on widely validated tools such as Ladybug, Honeybee, and ENVI-met. The output of the CLARITY Expert services is in this case extremely detailed and allows a proper assessment of the design solutions for buildings and open spaces at the neighborhood scale, verifying their performance in terms of outdoor comfort, sustainable water management, energy efficiency of buildings, and general compliance with the requirements of the Minimum Environmental Criteria for construction (CAM).
The current development phase implemented by the municipality provides the main quantitative data for new buildings (residential and offices), roads, and public spaces, as well as the limits in terms of built volumes and standards for green areas and public services.
The general urban planning data, as defined by PUC, can be summarized as follows:
• Total buildable surface: 160,000 m2
• Building volume ratio ≤ 4 m3/m2
• Residential buildings volume ≤ 384,000 m3
• Area for public facilities ≥ 345,000 m2
• Road network: 20,000 m2
• Open public spaces/facilities and green areas ≥ 96,000 m2
Codesign workshops were carried out with the local community (2018) and municipal technical services (2019) to developing design scenarios tackling at the same time climate adaptation and the abovementioned urban regeneration priorities. The adaptation measures fact sheets have been used as a tool to understand the potential climate benefits and cobenefits of proposed design alternatives (Figure 15).
Figure 14 (top) shows the simulation of the mean radiant temperature (Tmrt) values for the current state, carried out both through SOLWEIG (resolution 1 m) and through the PLINIVS HWLEM (resolution 250 m). The analysis includes both the PRU area (black perimeter) and the historic center of Ponticelli, east of the PRU area. Most of the areas within the PRU perimeter show good Tmrt values at present, being mainly undeveloped, with a prevalence of vegetated areas and portions of agricultural fields. This aspect is of great interest since the challenge in this area is to design new residential buildings, mixed use, and public spaces that do not worsen the current good performance in terms of thermal stress, proposing itself as a model at the local level for new climate-resilient district developments.
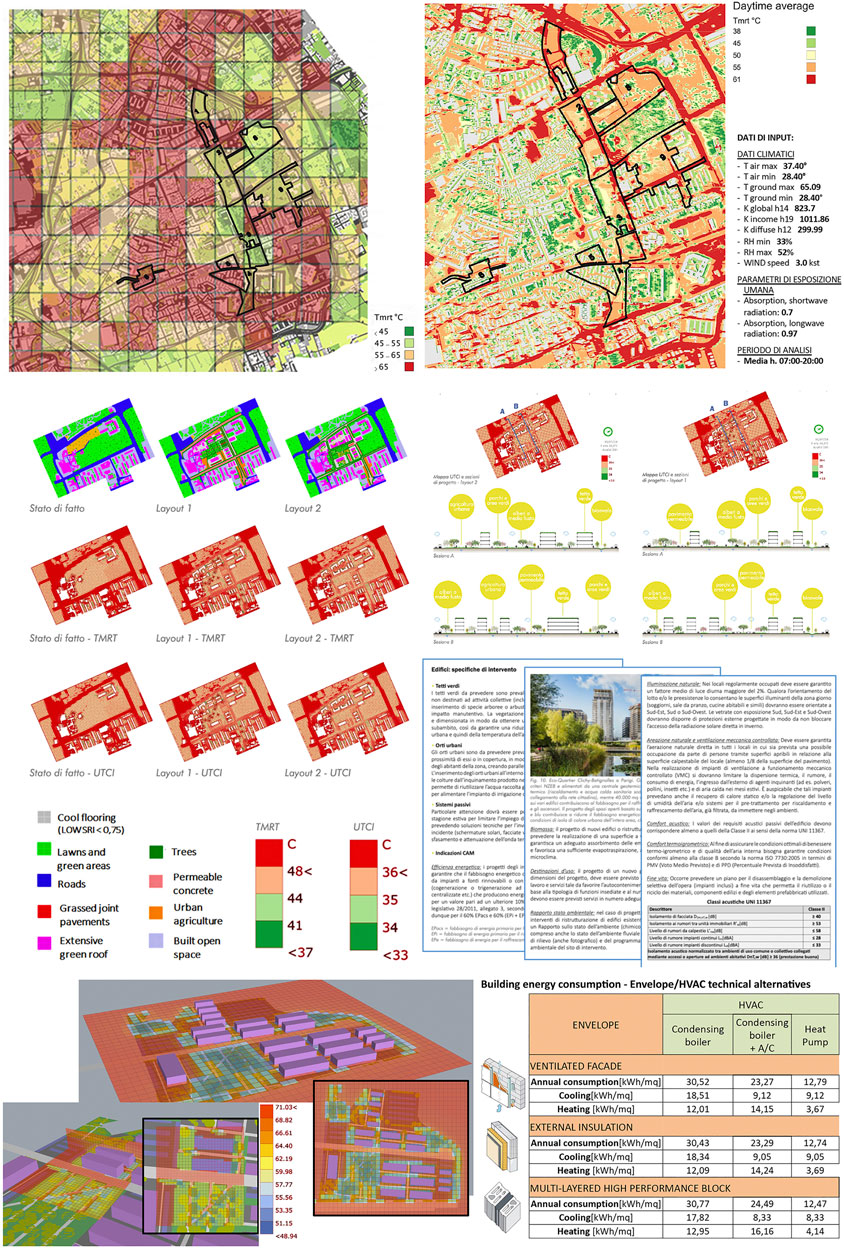
FIGURE 14. Example of outputs from the expert level study carried out for the PRU in Ponticelli.
All the project scenarios developed for the PRU subareas are analyzed through the two representative indicators (Tmrt and UTCI) and compared for current and future climate. The analyses refer to the average 24 h values in a heat wave period, in order to evaluate the ability of urban spaces to dissipate at night the heat accumulated during the day.
Concerning the flooding risk, the geomorphological conformation of the area, located in the eastern part of the slopes of Vesuvius, partially mitigates the impact of heavy rains, also thanks to the presence of large green areas which, even when not intended for agricultural use or equipped green areas, guarantee adequate soil permeability. In addition, in the center of the PRU area, there is an important branch of the East Naples sewerage network, which has a very high capacity and is usually able to drain rainwater even during extreme precipitation events. The main causes of surface flooding following extreme rainfall are attributable to the presence of depressions in roadways and the lack of maintenance of manholes. However, a high runoff in the PRU area—which could be increased following the conversion of part of the current green areas into buildings and paved open spaces—could result in further overloading the sewerage system, potentially aggravating the flooding conditions especially in the nearby districts of Barra and San Giovanni, located in a flat area almost at sea level. For this reason, in the adaptation strategies project, solutions have been proposed to maximize the infiltration of rainwater and the provision of water storage and recycling systems in residential and public areas.
On this basis, general guidelines for an approach to the design of buildings and open spaces oriented towards climate resilience and the specific intervention techniques have been implemented, also identifying the main requirements related to building CAMs for each type of land use.
The guidelines will be used for the preparation of preliminary design by the technical offices of the municipality of Naples (Social Housing Department) and the external consultants, as well as supporting the preparation of tender documents for the final design and implementation, which will be contracted based on proposed energy and environmental improvements to the baseline preliminary project, with reference to international standards and protocols such as LEED.
Discussion
Climate services are emerging worldwide as an essential tool to bridge the advancement in climate science and meteo/earth observations with a variety of operational fields in the domains of DRR and CCA. It is multidisciplinary study area with promising applications in the field of urban microclimate analyses and simulations, supporting the implementation of local policies and addressing climate-resilient redevelopment actions at both city and neighborhood levels.
To support such a perspective, hazard/impact assessments for extreme weather events should be supported by reliable probabilistic impact simulations and cost-benefit analyses with spatial and temporal resolutions adequate to urban planning and design needs. Quantitative results of simulation models, based on accurate exposure data and adequate vulnerability curves for relevant vulnerability classes of elements at risk, enable the comparison of performance metrics of proposed solutions, assessing their benefits in relation to multiple risks and the establishment of priorities based on local needs and goals (Zuccaro et al., 2018c).
CLARITY, through its “Screening” and “Expert” tools, has addressed this challenge through a multidisciplinary systematic approach, where architectural and urban disciplines, systems engineering, social science, earth sciences, IT and data visualization, probabilistic modeling, and scenario analysis have contributed to deploy a new generation of climate services specifically designed to meet the needs of public authorities and professionals in the field of planning and design dealing with urban climate resilience.
This approach assumes that urban environments are complex systems resulting from the interaction of different subsystems: the physical system, the relational and functional system, and the socioeconomic system. Hazards and impacts on the built environment induced by climate change depend on several interconnected aspects, which require to go beyond the conventional approach of climate science, limited to the definition of synthetic indices at the regional scale, understanding the complex dynamics of urban systems and their transformation processes, to properly identify, plan, and implement suitable pathways for climate resilience.
In this context, the quality and availability of the multiple datasets needed to characterize hazard, exposure, and vulnerability conditions as well as assess the performance of adaptation strategies is essential to build reliable models and tools that aim to provide better knowledge and decision support in DRM, DRR, and CCA. In this sense, CLARITY has acknowledged the current technological improvements field of earth observation, big data acquisition and management, IT infrastructure, and cloud computing, proposing a modeling approach at the pan-European level which anticipates the expected increased future availability of data. Once new harmonized datasets will be made available for all European cities, the “Screening” tool will be improved in the reliability of assessments, thus constituting a useful resource for the initial setup of urban adaptation plans.
The “expert” level application for the City of Naples represents a step forward in the definition of a standardized approach to address climate-resilient urban planning and design in a multiscale perspective, and its replicability in other regional and urban contexts in Italy is currently discussed at the national level with government bodies, such as the Italian National Governmental Agency for Territorial Cohesion and the Italian Institute for Environmental Protection and Research.
At the local level, the identification of climate change impact hotspots and suitable adaptation strategies shared between the various urban decision-makers responsible for the various planning levels, as well as the consistency of the information contained in the various project documents, represent essential aspects for guaranteeing the implementation of interventions and facilitating their funding.
This in particular in the context of the European Regional Development Funds and the Cohesion Fund, which in the current and upcoming 7-year programming periods will mainly be aimed at supporting climate adaptation and urban resilience actions. In the southern-Italy context, there is a growing awareness in local authorities and communities about the need of rapidly transitioning towards sustainable and climate-resilient urban development pathways, but this forward-looking perspective is often endangered by the “historical” limited spending capacity of EU structural funds by the public administration (Minister for Southern Italy and Territorial Cohesion, 2020), despite being beneficiary of the majority of Italian national funding share. This is combined with the widespread socioeconomic divide compared to other Italian and EU regions (with a GDP per capita, e.g., in Campania and Sicily of about 17 k€ and emigration of about 2 M people in the last 20 years, of whom 50% are young individuals with 80% prevalence of higher education qualification) and the pressing demand of responding to basic needs, such as the quality and availability of social housing, public transport, and other urban services. In this perspective, the environmental transition in these areas is seen also as an economic opportunity, which needs to be supported by a strong capacity building for what concerns “green job” skills in many sectors, profiting of the opportunities related to the significant share of Green Deal package resources devoted to Italian (and European) Southern Regions. Effective climate action in southern Italian cities can only be guaranteed through vertical and horizontal coordination between the various actors in the programming, planning, and decision-making process, also in relation to the technical design alternatives underlying transformation and regeneration processes CLARITY project has demonstrated the effectiveness of the proposed tools in supporting such processes.
Even the choice of implementing the simulation models within software environments widely used in urban planning and design (GIS and Rhinoceros/Grasshopper) is intended to facilitate the implementation of this type of analysis on any project proposal developed by the municipal technical services and/or external consultants. Specific guidelines have been drawn up to prepare 2D/3D projects drawings using GIS and 3D modeling software so that the project layouts can be analyzed directly through the simulation components developed within CLARITY Expert Services.
Further relevant research developments will make it possible to expand the methodology adopted also to multihazard assessments, thanks to the adoption of a risk modeling and simulation methodology consistent with the approaches used for assessing the impact of geophysical hazards, such as the seismic and volcanic risks. The evolution of CLARITY tools to support design and decisions in a multirisk perspective can represent a fundamental resource for increasing the potential for use of scientific results by institutional decision-makers and designers at various levels, aimed at developing effective strategies to integrate national to local DRR and CCA policies, as highlighted in the numerous policy and international agendas (Sendai Framework for DRR; Paris Agreement; 2030 Agenda for Sustainable Development; New Urban Agenda).
Further efforts are required to identify synergies and opportunities for integrating strategies in complementary sectors, such as urban development, environmental protection, climate action, emergency planning, and response, still often siloed into sectoral perspectives undermining the effectiveness of policy, governance, and implementation of actions to support the ecological and digital transition at the base of the European Green Deal and the new EU Strategy on Adaptation to Climate Change.
Data Availability Statement
The datasets presented in this study can be found in online repositories. The names of the repository/repositories and accession number(s) can be found below: https://zenodo.org/communities/clarity/.
Author Contributions
Sections 1 and 2 were authored by GZ. Sections 3 and 4 authored by ML.
Funding
CLARITY project has received funding from the EU H2020 R and I program (Grant no. 730355). The Consortium, coordinated by the Austrian Institute of Technology, includes 17 partners with multidisciplinary expertise and several national/local authorities from four case study areas (Italy, Austria, Sweden, and Spain). The outcomes of the Naples case presented herein were jointly developed by UNINA-PLINIVS, ZAMG, and the City of Naples.
Conflict of Interest
The authors declare that the research was conducted in the absence of any commercial or financial relationships that could be construed as a potential conflict of interest.
Publisher’s Note
All claims expressed in this article are solely those of the authors and do not necessarily represent those of their affiliated organizations, or those of the publisher, the editors, and the reviewers. Any product that may be evaluated in this article, or claim that may be made by its manufacturer, is not guaranteed or endorsed by the publisher.
Supplementary Material
The Supplementary Material for this article can be found online at: https://www.frontiersin.org/articles/10.3389/fenvs.2021.693319/full#supplementary-material
Footnotes
1Available at https://csis.myclimateservice.eu/), developed within the H2020 CLARITY project (GA n.730,355).
21. Characterize Hazard; 2. Evaluate Exposure; 3. Analyze Vulnerability; 4. Assess Risk and Impact; 5. Identify Adaptation Options; six Appraise Adaptation Options; 7. Implement/Integrate Adaptation Action Plan.
3https://www.ecad.eu/indicesextremes/.
4http://urbansis.climate.copernicus.eu/.
5http://etccdi.pacificclimate.org/list_27_indices.shtml.
6Freely available online at https://zenodo.org/communities/clarity/search?page=1&size=20&q=ensemble%20calculations.
7Namely, the building density and the presence of trees, and the albedo and emissivity of green and built surfaces.
9https://www.covenantofmayors.eu/IMG/xlsx/SECAP_Template.xlsx.
References
atelierGROENBLAUW (2016). Urban Green-Blue Grids for Resilient Cities. available at: www.urbangreenbluegrids.com (Accessed March 15, 2020)
Baccini, M., Biggeri, A., Accetta, G., Kosatsky, T., Katsouyanni, K., Analitis, A., et al. (2008). Heat Effects on Mortality in 15 European Cities. Epidemiology 19 (5), 711–719. doi:10.1097/ede.0b013e318176bfcd
Bertoldi, P. (2018). Guidebook: How to Develop a Sustainable Energy and Climate Action Plan (SECAP). Luxembourg: Publication Office of the European Union
Chen, L., Yu, B., Yang, F., and Mayer, H. (2016). Intra-urban Differences of Mean Radiant Temperature in Different Urban Settings in Shanghai and Implications for Heat Stress under Heat Waves: a GIS-Based Approach. Energy and Buildings 130, 829–842. doi:10.1016/j.enbuild.2016.09.014
Choudhary, E., and Vaidyanathan, A. (2014). Heat Stress Illness Hospitalizations Environmental Public Health Tracking Program, 20 States, 2001-2010. Morbidity and Mortality Weekly Report. Surveill. Summ. 63, 1–16.
Coburn, A. W., Spence, R. J. S., and Pomonis, A. (1994). Vulnerability and Risk Assessment. 2nd Edition. Cambridge, UK: UNDP Disaster Management Training Programme
Comune di Napoli (2019). Napoli 2019-2030. Città, ambiente, diritti e beni comuni. Piano Urbanistico Comunale - Documento di Indirizzi. available at: https://www.comune.napoli.it/flex/cm/pages/ServeAttachment.php/L/IT/D/1%252Fe%252F9%252FD.194f8300cdfa79d96fa4/P/BLOB%3AID%3D37912/E/pdf (Accessed March 15, 2020)
Comune di Napoli (2020). Preliminare di PUC e rapporto ambientale preliminare. available at: http://www.comune.napoli.it/flex/cm/pages/ServeBLOB.php/L/IT/IDPagina/37912 (Accessed March 15, 2020)
C. Rosenzweig, W. D. Solecki, S. A. Hammer, and S. Mehrotra (2018). in Climate Change and Cities (ARC 3-2). Second Assessment Report of the Urban Climate Change Research Network (New York: Cambridge University Press)
D’Ambrosio, V., and Leone, M. F. (2016). Environmental Design for Climate Change Adaptation. 1. Innovative Models for the Production of Knowledge. Napoli: Clean
D’Ambrosio, V., and Leone, M. F. (2017). Environmental Design for Climate Change Adaptation. 2. Tools and Guidelines for Climate Risk Reduction. Napoli: Clean
D’Ippoliti, D., Michelozzi, P., Marino, C., de’Donato, F., Menne, B., Katsouyanni, K., et al. (2010). The Impact of Heat Waves on Mortality in 9 European Cities: Results from the EuroHEAT Project. Environ. Health A Glob. Access Sci. Source 9, 37.
EEA (2017). Climate Change Adaptation and Disaster Risk Reduction in EuropeEnhancing Coherence of the Knowledge Base, Policies and Practices. Luxembourg: Publications Office of the European Union
European Commission (2013). Non-paper Guidelines for Project Managers: Making Vulnerable Investments Climate Resilient. Brussels: European Commission. available at: https://climate-adapt.eea.europa.eu (Accessed March 15, 2020)
European Commission (2015). Towards an EU Research and Innovation Policy Agenda for Nature-Based Solutions & Re-naturing Cities. Final Report of the Horizon2020 Expert Group on Nature-Based Solutions and Re-naturing Cities. Luxembourg: Publications Office of the European Union
Floater, G., Heeckt, C., Ulterino, M., Mackie, L., Rode, P., Bhardwaj, A., et al. (2016). Co-benefits of Urban Climate Action: A Framework for Cities. available at: http://eprints.lse.ac.uk/id/eprint/68876 (Accessed March 15, 2020)
Gulyás, Á., Unger, J., and Matzarakis, A. (2006). Assessment of the Microclimatic and Human comfort Conditions in a Complex Urban Environment: Modelling and Measurements. Building Environ. 41 (12), 1713–1722. doi:10.1016/j.buildenv.2005.07.001
G. Zuccaro, M. F. Leone, C. Martucci, G. Grandjean, and K. C. Lauta (2018c). in ESPREssO Vision Paper on Future Research Strategies Following the Sendai Framework for DRR 2015-2030. available at: https://www.preventionweb.net/publications/view/65157 (Accessed March 15, 2020)
Huizinga, J., de Moel, H., and Szewczyk, W. (2017). Global Flood Depth-Damage Functions: Methodology and the Database with Guidelines. Sevilla: Joint Research Centre
IPCC (2014b). Climate Change: Impacts, Adaptation, and Vulnerability. Part A: Global and Sectoral Aspects. Contribution of Working Group II to the Fifth Assessment Report of the Intergovernmental Panel on Climate Change. Cambridge and New York: Cambridge University Press
Isaksen, T. B., Yost, M. G., Hom, E. K., Ren, Y., Lyons, H., and Fenske, R. A. (2015). Increased Hospital Admissions Associated with Extreme-Heat Exposure in King County, Washington, 1990-2010. Rev. Environ. Health 30 (1), 51–64. doi:10.1515/reveh-2014-0050
Lindberg, F., and Grimmond, C. S. B. (2011). The Influence of Vegetation and Building Morphology on Shadow Patterns and Mean Radiant Temperatures in Urban Areas: Model Development and Evaluation. Theor. Appl. climatology 105 (3-4), 311–323. doi:10.1007/s00704-010-0382-8
Lindberg, F., Onomura, S., and Grimmond, C. S. B. (2016). Influence of Ground Surface Characteristics on the Mean Radiant Temperature in Urban Areas. Int. J. Biometeorol. 60 (9), 1439–1452. doi:10.1007/s00484-016-1135-x
Liss, A., Wu, R., Chui, K. K., and Naumova, E. N. (2017). Heat-Related Hospitalizations in Older Adults: An Amplified Effect of the First Seasonal Heatwave. Sci. Rep. 7, 39581. doi:10.1038/srep39581
Maes, J., and Jacobs, S. (2017). Nature-Based Solutions for Europe's Sustainable Development. Conservation Lett. 10 (1), 121–124. doi:10.1111/conl.12216
Merrill, C. T., Miller, M., and Steiner, C. (2008). Hospital Stays Resulting from Excessive Heat and Cold Exposure Due to Weather Conditions in US Community Hospitals, 2005. In Healthcare Cost and Utilization Project (HCUP) Statistical Briefs. Rockville, United States: Agency for Healthcare Research and Quality (US). [Internet][
Minister for Southern Italy and Territorial Cohesion (2020). Piano Sud 2030. Sviluppo e Coesione per l’Italia. available at: http://www.ministroperilsud.gov.it/media/2177/pianosud2030_doc_eng_light.pdf (Accessed March 15, 2020)
Neves, A., Blondel, L., Brand, K., Hendel-Blackford, S., Rivas Calvete, S., Iancu, A., and Kona, A. (2016). The Covenant of Mayors for Climate and Energy Reporting Guidelines. Luxembourg: Publications Office of the European Union
Oke, T. R., Mills, G., Christen, A., and Voogt, J. A. (2017). Urban Climates. New York/London: Cambridge University Press
Perkins, S. E. (2015). A Review on the Scientific Understanding of Heatwaves-Their Measurement, Driving Mechanisms, and Changes at the Global Scale. Atmos. Res. 164-165, 242–267. doi:10.1016/j.atmosres.2015.05.014
Perkins, S. E., and Alexander, L. V. (2013). On the Measurement of Heat Waves. J. Clim. 26, 4500–4517. doi:10.1175/jcli-d-12-00383.1
Raven, J., Stone, B., Mills, G., Towers, J., Katzschner, L., Leone, M., et al. (2018). “Urban Planning and Design,” in Climate Change and Cities: Second Assessment Report of the Urban Climate Change Research Network. Editors C. Rosenzweig, W. Solecki, P. Romero-Lankao, S. Mehrotra, S. Dhakal, and S. Ali Ibrahim (New York: Cambridge University Press), 139–172.
Raymond, C. M., Frantzeskaki, N., Kabisch, N., Berry, P., Breil, M., Nita, M. R., et al. (2017). A Framework for Assessing and Implementing the Co-benefits of Nature-Based Solutions in Urban Areas. Environ. Sci. Pol. 77, 15–24. doi:10.1016/j.envsci.2017.07.008
R. Goler (2020). in CLARITY D3.3. Science Support Plan and Concept V3. available at: http://www.clarity-h2020.eu (Accessed March 15, 2020)
IPCC (2014a). in Climate Change 2014: Synthesis Report. Contribution of Working Groups I, II and III to the Fifth Assessment Report of the Intergovernmental Panel on Climate Change, Core Writing Team. Editor R. K. L. A. PachauriMeyer (Cambridge and New York: Cambridge University Press)
Robinson, P. J. (2001). On the Definition of a Heat Wave. J. Appl. Meteorol. 40, 762–775. doi:10.1175/1520-0450(2001)040<0762:otdoah>2.0.co;2
Simon, H., and Bruse, M. (2020). Modelling of Microclimates. Eco-Design Buildings Infrastructure: Dev. Period 2016–2020 4, 318–334. doi:10.1201/9781003095071-18
Strohbach, M. W., Arnold, E., and Haase, D. (2012). The Carbon Footprint of Urban green Space-A Life Cycle Approach. Landscape Urban Plann. 104 (2), 220–229. doi:10.1016/j.landurbplan.2011.10.013
Taylor, K. E., Stouffer, R. J., and Meehl, G. A. (2012). An Overview of CMIP5 and the experiment Design. Bull. Am. Meteorol. Soc. 93 (4), 485–498. doi:10.1175/bams-d-11-00094.1
UN-DHA (1993). Internationally Agreed Glossary of Basic Terms Related to Disaster Management. DNA193136. Geneva: United Nations Department of Humanitarian Affairs
UNDRO (1980). Natural Disasters and Vulnerability Analysis. Report of Experts Group Meeting of 9-12 July 1979. Geneva: UNDRO
Van De Ven, F. H. M., Snep, R. P. H., Koole, S., Brolsma, R., Van Der Brugge, R., Spijker, J., et al. (2016). Adaptation Planning Support Toolbox: Measurable Performance Information Based Tools for Co-creation of Resilient, Ecosystem-Based Urban Plans with Urban Designers, Decision-Makers and Stakeholders. Environ. Sci. Pol. 66, 427–436. doi:10.1016/j.envsci.2016.06.010
Zuccaro, G., and De Gregorio, D. (2019). Impact Assessments in Volcanic Areas-The Vesuvius and Campi Flegrei Cases Studies. Ann. Geophys. 62 (1), 02. doi:10.4401/ag-7827
Zuccaro, G., De Gregorio, D., and Leone, M. F. (2018b). Theoretical Model for Cascading Effects Analyses. Int. J. Disaster Risk reduction 30, 199–215. doi:10.1016/j.ijdrr.2018.04.019
Zuccaro, G., and De Gregorio, D. (2013). Time and Space Dependency in Impact Damage Evaluation of a Sub-plinian Eruption at Mount Vesuvius. Nat. Hazards 68, 1399–1423. doi:10.1007/s11069-013-0571-8
Zuccaro, G., Leone, M. F., and De Gregorio, D. (2018a).All-hazards Impact Scenario Assessment Methodology as Decision Support Tool in the Field of Resilience-Based Planning and Emergency Management. In RESILIENCE - The 2nd International Workshop on Modelling of Physical, Economic and Social Systems for Resilience Assessment. Luxembourg: Publications Office of the European Union, 92–101.
Keywords: H2020 CLARITY, urban climate adaptation, municipality of Naples, multiscale planning, climate hazard/impact modeling
Citation: Zuccaro G and Leone MF (2021) Climate Services to Support Disaster Risk Reduction and Climate Change Adaptation in Urban Areas: The CLARITY Project and the Napoli Case Study. Front. Environ. Sci. 9:693319. doi: 10.3389/fenvs.2021.693319
Received: 10 April 2021; Accepted: 04 August 2021;
Published: 01 October 2021.
Edited by:
Xander Wang, University of Prince Edward Island, CanadaReviewed by:
Kavan Javanroodi, École Polytechnique Fédérale de Lausanne, SwitzerlandDimitrios Melas, Aristotle University of Thessaloniki, Greece
Copyright © 2021 Zuccaro and Leone. This is an open-access article distributed under the terms of the Creative Commons Attribution License (CC BY). The use, distribution or reproduction in other forums is permitted, provided the original author(s) and the copyright owner(s) are credited and that the original publication in this journal is cited, in accordance with accepted academic practice. No use, distribution or reproduction is permitted which does not comply with these terms.
*Correspondence: Mattia Federico Leone, bWF0dGlhLmxlb25lQHVuaW5hLml0