 Shauna-kay Rainford
 Javier M. Martín-López
 Mayesse Da Silva
94% of researchers rate our articles as excellent or good
Learn more about the work of our research integrity team to safeguard the quality of each article we publish.
Find out more
ORIGINAL RESEARCH article
Front. Environ. Sci., 21 July 2021
Sec. Land Use Dynamics
Volume 9 - 2021 | https://doi.org/10.3389/fenvs.2021.685819
This article is part of the Research TopicLandscapes, Land-Use Change and Ecosystem Services in Colombia's Orinoquia Region: Recent Change and Future ProspectsView all 9 articles
In Colombia, the rise of agricultural and pastureland expansion continues to exert increasing pressure on the structure and ecological processes of savannahs in the Eastern Plains. However, the effect of land use change on soil properties is often unknown due to poor access to remote areas. Effective management and conservation of soils requires the development spatial approaches that measure and predict dynamic soil properties such as soil organic carbon (SOC). This study estimates the SOC stock in the Eastern Plains of Colombia, with validation and uncertainty analyses, using legacy data of 653 soil samples. A random forest model of nine environmental covariate layers was used to develop predictions of SOC content. Model validation was determined using the Taylor series method, and root-mean-squared error (RMSE) and mean error (ME) were calculated to assess model performance. We found that the model explained 50.28% of the variation within digital SOC content map. Raster layers of SOC content, bulk density, and coarse rock fragment within the Eastern Plains were used to calculate SOC stock within the region. With uncertainty, SOC stock in the topsoil of the Eastern Plains was 1.2 G t ha−1. We found that SOC content contributed nearly all the uncertainty in the SOC stock predictions, although better determinations of SOC stock can be obtained with the use of a more geomorphological diverse dataset. The digital soil maps developed in this study provide predictions of extant SOC content and stock in the topsoil of the Eastern Plains, important soil information that may provide insight into the development of research, regulatory, and legislative initiatives to conserve and manage this evolving ecosystem.
The development of large-scale commercial cropping systems is rapidly expanding in South America as natural environments are converted to cropland and pastureland (Laurance et al., 2014). The impact of these transformations on essential ecosystem services such as biodiversity and soil organic carbon (SOC) reservoirs are unknown, and there is a growing need for quantitative soil information that can inform sustainable monitoring and conservation of these fragile ecosystems. In Colombia, the Eastern Plains (Spanish: Llanos Orientales) are increasingly being converted from natural savannahs to commercial cropland for cash crops (rice, soy bean, and maize), biofuels (oil palm and sugar cane), and rubber (Wassenaar et al., 2007; Garcia-Ulloa et al., 2012). However, past and current challenges in the region such as a prior Guerrilla control (Krakowski and Zubiría, 2018) and restricted access to remote areas due to poor roads and large distances from cities and villages (Rausch, 2014) have contributed to the lack of soils data in the Eastern Plains. This gap in knowledge presents challenges for assessing present and future changes within the landscape. Nonetheless, the use of digital soil mapping (DSM) using limited baseline knowledge and secondary data can facilitate the prediction of soil properties on which efficient plans for conservation can be drawn.
The Llanos region is a tropical savannah ranging from its northern extent at the Arauca River and the Colombia-Venezuela boarder to its southern and eastern boundaries, which are separated by the Guaviare and Orinoco rivers. While the landscape within Los Llanos has changed much in the last century (Rausch, 2013), mapping SOC stock in this region can serve as a baseline for which Colombia’s positioning in the Paris Agreement and Sustainable development goals (SDGs) can be evaluated. For example, an assessment of dynamic soil properties such as SOC stock in the Llanos region is important for the development of conservation strategies to mitigate or prevent the negative impact of urban and agricultural development on this region. As a key indicator of ecosystem health, gaining a better understanding of spatial patterns in SOC stock is also important if we are to evaluate changes in soil fertility and carbon sequestration, which are two ecosystem services in which SOC plays a major role in regulating.
In recent decades, DSM has become a successful framework that enables soil scientists to model and map continuous soil properties (Moore et al., 1993; Odeh, McBratney and Chittleborough, 1995; Zhu et al., 1997, 2001; McBratney et al., 2003; Ashtekar and Owens, 2013; Minasny and McBratney, 2016). Advances in DSM have led to the creation of spatially enhanced maps that promote greater understanding of the global distribution of soil attributes (Batjes, 1996). Such maps fulfill the research and applied needs of soil scientists, land managers, and policy makers as DSM can be used to inform sustainable management and conservation of essential soil properties such as SOC content and stock. Here, we aim to develop continuous DSM of the SOC content in this region using random forest analysis, and uncertainty estimates of total SOC stock within the topsoil (0–30 cm).
To our knowledge, there have been four attempts to utilize spatial analysis methodology to estimate SOC content or SOC stock in the Llanos region. Determinations of SOC stock have been measured using machine learning and statistics on the global and regional/national scales by SoilGrids (Hengl et al., 2017) and the Global Soil Partnership (FAO and ITPS, 2018), respectively. As part of its sustainable land use initiative to promote sustainable agriculture in South American savannas, the World Wildlife Fund (WWF) Colombia conducted an integrated analysis of flora biodiversity and carbon content in the Llanos region (Rincón et al., 2014). Ashtekar et al. (2014) was the first to use measured soils data to generate soil class maps and continuous soil property maps throughout the region. In this study, the derived soil property maps used the fuzzy logic approach with 64 sampled point data, and Ashtekar et al. (2014) quantitatively defined each soil class based on the distribution of three environmental covariates (percent slope, wetness index, and normalized height). Furthermore, Ashtekar et al. (2014) validated the soil property maps using an independent set of 69 sampled soil points. In this study, we use hundreds of measured point data collected throughout the Llanos region, environmental covariates with a higher resolution, and the digital soil mapping technique of random forest analyses to measure SOC carbon and determine SOC stocks within the Eastern Plains.
The Eastern Plains of Colombia is located in the northeastern departments of Arauca, Casanare, Meta, and Vichada, covering an area of approximately 26 million hectares (Figure 1). The tropical and isothermal climate is characterized by distinct wet and dry seasons, and mean annual temperatures range between 24°C and 28°C in the plains and between 13°C and 21°C in the mountains. The region has a unimodal precipitation regime with an average annual precipitation of 2,991 mm. Boarded by the Andean Eastern Cordillera in the west and the Amazon in the south, the Llanos includes major tributaries of the Orinoco River such as the Arauca, Meta, and Vichada rivers. The Eastern Plains is divided into six landscapes -piedmont, alluvial terraces, alluvial overflow plain, aeolian plain, alluvium, and the high plains-with an elevation that rarely exceeds 300 m. Predominant soils in the Eastern Plains are Oxisols and Ultisols that originate from alluvial deposits transported from erosion of the Eastern Cordillera during the late Pleistocene (Goosen, 1971). Native vegetation is typical of savannah, although forest vegetation can be found along the major rivers and their tributaries.
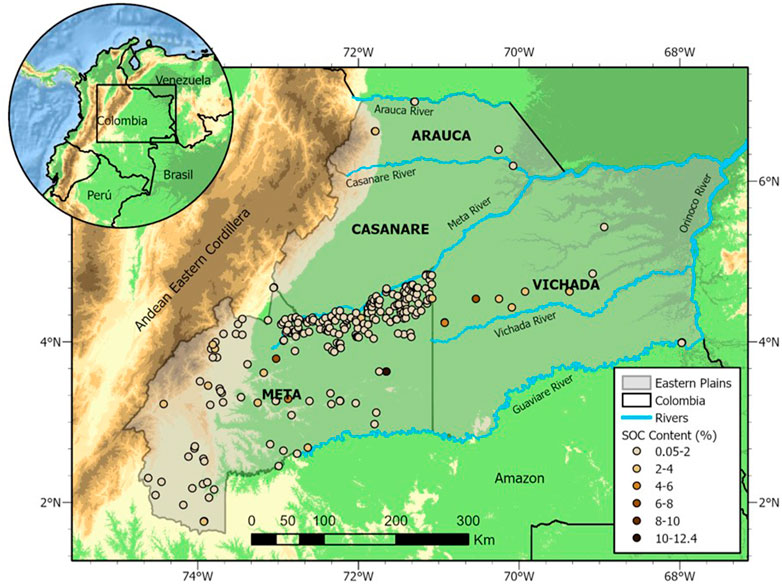
FIGURE 1. Distribution of soil samples in the Eastern Plains used to build the spatial predictive maps of soil organic carbon (SOC) content and stock.
This study examines legacy data collected by the International Center for Tropical Agriculture (CIAT) in collaboration with AGROSAVIA (before Corpoica), the Agustin Codazzi Geographical Institute (IGAC), and the Institute of Hydrology, Meteorology and Environmental Studies (IDEAM) for Colombia’s National Forest Inventory (IFN). Data obtained from CIAT and AGROSAVIA consisted of 158 point observations with three replicates from the topsoil (0–30 cm) sampled in 2013, and 64 soil profiles from IGAC, the Colombian institute responsible for producing and hosting soil information (http://ssiglwps.igac.gov.co:8888/siga_sig/Agrologia.seam). Following the IFN sampling strategy (Peña et al., 2014) IDEAM has collected 107 soil samples from 30 sites (conglomerates of subsamples) distributed in the Arauca, Meta, and Vichada departments. Sites are characterized by five sub-parcels that were arranged in the form of a square wherein four sub-parcels were collected 80 m in each cardinal direction of a central sample. Data collection and analysis by the IDEAM and the IFN are still on going, therefore many of the sites contain a range of one to five sub-parcels. Soil organic carbon content of data provided by CIAT-AGROSAVIA and IGAC were determined by the Walkley-Black methodology (Walkey and Black, 1934), and dry combustion by the IDEAM.
We acknowledge that the models are created using SOC content determined using different laboratory methods, without the use of a correction factor to collaborate findings. However, as measurements were very similar in areas of proximity we proceeded with the full data set. In total, 653 topsoil point samples were used in this study.
To predict the amount and distribution of SOC quantities according to the scorpan (a mnemonic for factors used in the prediction of soil attributes) framework developed by McBratney et al. (2003), we used a range of primary and secondary geospatial datasets to build a stack of environmental covariates. A 90 m resolution digital elevation model (DEM) was used to derive terrain parameters using Arc-GIS and SAGA-GIS (Jarvis et al., 2008). The DEM is a product of the United States National Aeronautics and Space Administration’s (NASA) Shuttle Radar Topographic Mission (SRTM), and the data voids were filled by Jarvis et al. (2008). Prior to use for digital soil mapping, the DEM was corrected to remove depressions and sinks and to ensure a regular flow of the landscape surface. A basic terrain analysis was conducted to derive representative terrain attributes using SAGA-GIS (analytical hill shading, aspect, slope, wetness index, profile and plan curvature, convergence index, and catchment area).
Other environmental covariates included:
• A topographic wetness index (TWI) of the DEM was derived in SAGA GIS as a representative of topographic control on hydrological processes.
• Monthly precipitation and average temperature rasters from the WorldClim Organization were used to estimate the precipitation effectiveness index (PEI). As PEI is common signifier of climate variation, and climatic regions across the Eastern Plains were classified according to the Thornthwaite (1931) classification scheme.
• A geomorphological classification was performed to assess patterns in the slope and elevation of the terrain. A pattern recognition approach (Jasiewicz and Stepinski, 2013) was used to conduct a terrain analysis, which categorized common landform elements into geomorphons based on slope and elevation. The ten landforms categories were reduced to the following five geomorphons classifications: flat, ridges, slope, valley, and foot-slope.
• A geology raster containing 29 classes (IGAC (http://www.igac.gov.co/igac))
• A modified version of IDEAM 2010–2012s land use map was also used in the model (IDEAM et al., 2012). The classification legend of the original land use map was a simplified to delineate the following categories: wetlands, forest, cropland, agriculture, pasture, settlements/urban areas, and other land uses.
The amount and distribution of SOC content in the Eastern Plains of Colombia was determined by the random forest approach (Breiman, 2001) using the R environment (R Core team, 2016). Prior to the generation of the model, each environmental covariate was resampled to the resolution of the DEM and a principal component analysis (PCA) was used to reduce the number of environmental covariates and determine the primary covariates that were most representative of the landscape. The multivariate PCA was conducted in SAGA-GIS.
The exploratory analysis of the data showed that the dataset was not normally distributed (Anderson-Darling test <0.05), negatively skewed (coefficient of skew <0), and had a high degree of peakedness (Kurtosis >1). Therefore, a Box-Cox transformation was used to normalize data prior to input for spatial modeling.
Random forest modeling is a non-parametric technique that fits classification trees to the dataset, and aggregates similarities among the observations to fit decision trees. This method consists of the selection of a random sample from the dataset to build a tree. This sample was then randomly replaced by others in the dataset (bootstrapped) and added to the training dataset. The trees were then split at nodes that were defined by a random subset of the predictor variables. The size of the predictor subset was determined by the square root of the total number of predictor variables, and nodes were split based the predictor that minimizes the regression error. A “forest” was then created as this process was repeated several times, until no further improvements in error could be achieved. Data that were not used are called “out-of-bag” samples and used to determine the regression errors for the trees. In this study, a random forest model with 500 trees, and a node size of three was ran with nine predictors using the randomForest R-package (Liaw and Wiener 2002). Although there is still debate about the best digital modeling methodology, this model has several advantages when compared to other digital mapping strategies as the bootstrap samples and random selection across the many predictors helps to reduce variance among the predictors (Breiman, 2001).
A cross-validation analysis was conducted to assess the predicative performance of the random forest model. Due to the small amount of data points, 90% of the dataset was used in the training dataset to develop the model, and the remaining 10% was used for model testing. The model was cross-validated 100 times, and the performance matrix of each repetition was averaged. A diagnostic comparison of the predicted and observed SOC values was performed to illustrate the predictive performance of the random forest model. The coefficient of determination (R2), mean error (ME), and root-mean-squared error (RMSE) were used to determine the model performance.
Soil organic carbon stock (ton/ha) was calculated using the SOC content, bulk density, and coarse rock fragment maps of the Eastern Plains according to Eq. (1). The SOC content map was the product of the random forest methodology, and the bulk density and coarse fragment maps were retrieved from the International Soil Reference and Information Center’s (ISRIC) SoilGrids automated soil mapping database. ISRIC SoilGrids maps were used for this project due to the lack of bulk density and coarse fragments data within this region. The SoilGrids maps are created using state-of-the-art machine learning methods that utilize soil profiles and environmental covariate data to globally map soil properties at a spatial resolution of 250 m. Prior to the determination of SOC stock, the bulk density and coarse fragment maps were clipped to the boundary of the Eastern Plains using GRASS-GIS.
Where SOCstock is the SOC stock (t ha−1), SOCcontent the soil organic carbon content (g kg−1), BLD is the bulk density (units) and CRF the coarse rock fragments (units). The equation is multiplied by a factor of 10 to convert from kg m−2 to t ha−1.
The Taylor series method was used to assess SOC stock predictions throughout the region. This method was chosen in lieu of other uncertainty analyses because it allows for the identification of the main source of error in prediction estimates. Global accuracy measures for the three soil properties were used since bulk density and coarse rock fragment data either do not exist or could not be obtained for this specific study area. While global measures may not apply to the study area, they are the best estimates for this understudied region. The following standard deviations of the SoilGrids prediction error for SOC content, bulk density, and coarse rock fragment were used to calculate the standard deviation of the SOC stock map over 0–30 cm: sd (SOC) = 32.8 mg/kg, sd (bulk density) = 164.7 kg/m3, sd (coarse rock fragment) = 10.9%. The standard deviation of SOC stock predictions was determined as the square root of the prediction variance, and the relative error was calculated as the ratio of the standard deviation and the SOC stock prediction.
In total, the following nine environmental covariates were used to predict SOC in the Eastern Plains of Colombia: analytical hill shading, aspect, slope, catchment slope, TWI, PEI, geology, geomorphon, and land use. The continuous property map of SOC content (g kg−1) in the Llanos region is presented in Figure 2. Soil organic carbon content was generated to the resolution of the DEM (90 m), and spatial predictions are shown to represent the amount of SOC contained in the topsoil (0–30 cm). The predicted SOC content was similarly distributed in each department, with values ranging between 3.6–35.6 (g kg−1). The amount and distribution of SOC content reflects the differences in geology, and thus elevation and slope, across the landscape.
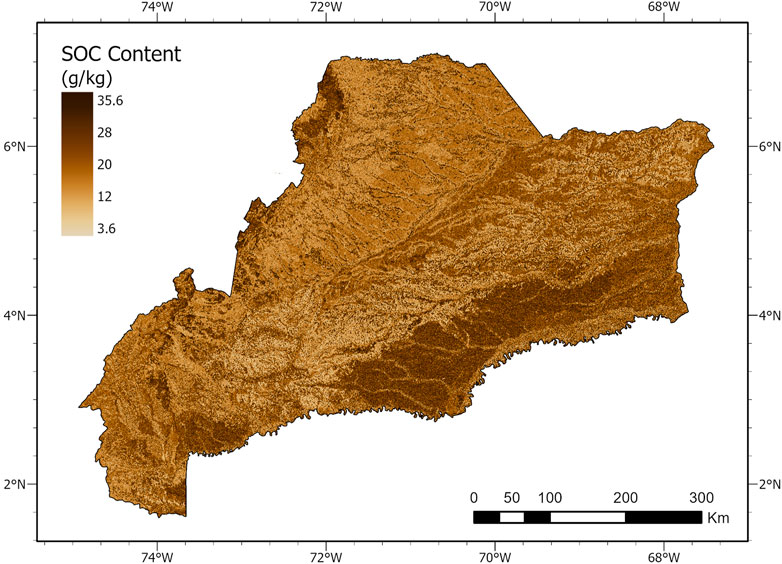
FIGURE 2. Predicted SOC content (g kg−1) in the Eastern Plains.
Model assessment was performed as the 100-fold cross-validation of 65 data points. Based on the cross-validation results, 50.28% of the variation within SOC content was explained by the model. RMSE is 0.461 and ME in the predictions of SOC was approximately 0.038. Since the ME value is close to zero, it indicates that there was a very low bias in the predictions and that there was no systematic over or under-prediction of the SOC content in the Eastern Plains. However, a plot of the predicted versus observed values indicated that the model under-predicted low values and over-predicted high values (Figure 3). Therefore, high and low SOC content on the predicted map should be treated with caution.
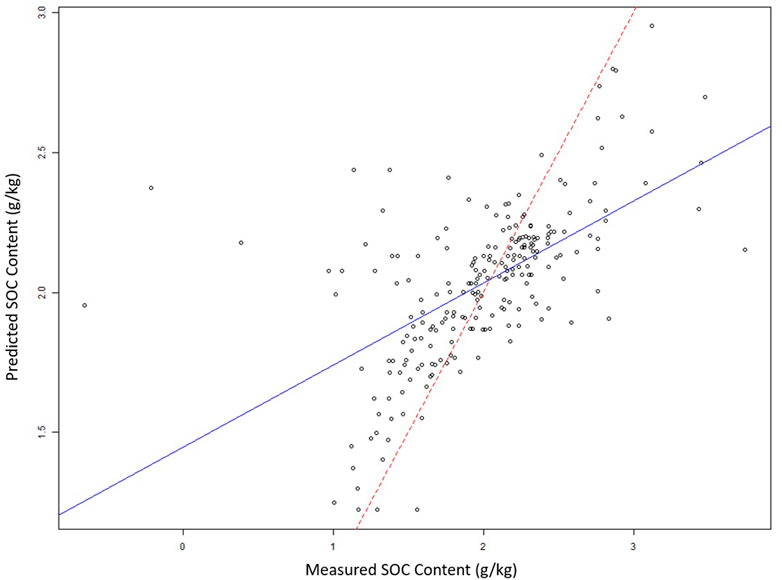
FIGURE 3. Diagnostic comparison of the predicted and observed SOC content (g kg−1), with the line of perfect fit (red) and best line of fit (blue).
The total predicted SOC stock in the topsoil of the Eastern Plains is approximately 1.2 Gt ha−1 (Figure 4). This indicates that the amount of carbon stored in the study area in tons of CO2 equates to 3.7 Gt, which is equivalent to approximately 14 times of total Colombia emissions (258.35 Mt CO2-eq) reported in the National Inventory of Greenhouse Gas Emissions (Ideam et al., 2016) and which represents 0.42% of the global emissions for the year 2012.
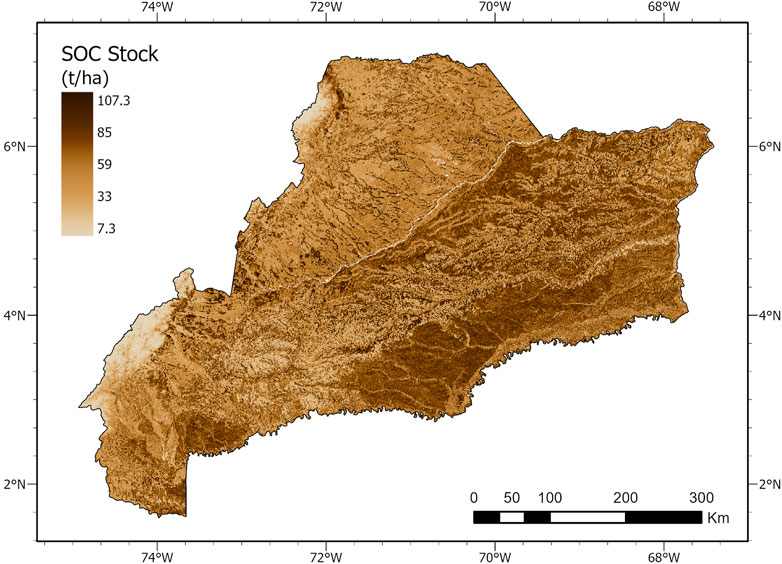
FIGURE 4. Predicted SOC stock (t ha−1) in the Eastern Plains.
Based on the Taylor series method the standard deviation of the uncertainty propagation ranged between 30.8–171.2 (t ha−1) (Figure 5). Of the three soil properties, uncertainty about the SOC content is the main source of uncertainty (99.69%), and this source of uncertainty is magnitudes higher than that of bulk density (0.16%) and coarse rock fragment (0.15%). Lower ranges of uncertainty are concentrated in areas closes to the Eastern Cordillera, while the largest amount of uncertainty were found in the southern region of the Plains and the northern regions of the Dissected High Plains. Furthermore, the mean relative error of the SOC stock predictions was 325.42%. Although not ideal, large estimates were expected since the SOC stock predictions were small in most areas of the Eastern Plains. As the ratio of the prediction error standard deviation and the prediction itself, since the standard deviation was large, the relative error of the estimates was large as well.
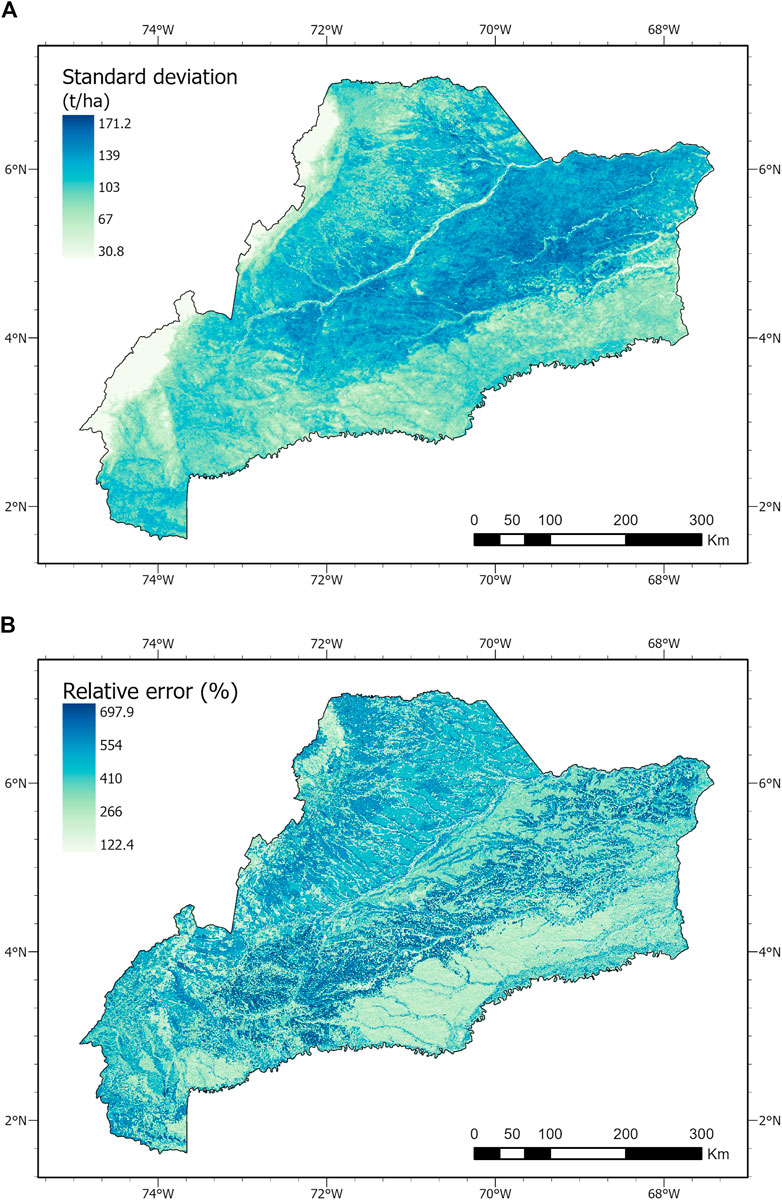
FIGURE 5. Maps of the (a) standard deviation (t ha−1) and (b) relative error (%) of SOC stock predictions.
Digital soil maps of SOC content and stock within the topsoil of the Eastern Plains of Colombia were created along with validation and uncertainty estimates in accordance to the Global Soil Map Requirements (Hartemink et al., 2010). Soil organic carbon content was low throughout much of the Llanos region, which is consistent with other investigations of SOC content in the topsoil of the Eastern Plains (Ashtekar et al., 2014; Libohova et al., 2016). Higher SOC content were observed in some regions of the High and Low Plains (Figure 2). These sparse regions of high SOC content were mainly centered in the southern part of the Arauca and Casanare departments, which are dominated by savannah type vegetation that favors the accumulation of SOC (Blydenstein, 1967). It is unexpected that SOC content was not distinctively lower in the High Plains, because severe erosion caused by natural and anthropogenic factors is common in this area (Goosen, 1971).
As indicated by the model validation assessments, predictions of SOC content in the Eastern Plains can be improved. Namely, the continuous SOC content map generated from the random forest model of nine soil covariate layers only marginally highlights differences associated with the diverse geomorphology and soils in the Llanos region. While the random forest model and covariate inputs are succinct and have been successfully applied in other studies (see Grimm et al., 2008), the quality of the SOC content predictions in this region can be improved by a larger and more diverse array of soil sample inputs. In a review of map quality measures Brus et al. (2011) found that the collection of additional independent data for validation of digital soil maps is superior to validation by cross-validation because the latter method may not provide unbiased estimates of map accuracy. Bias arise with clustered soil samples points in the cross-validation assessments because the prediction errors of the data used for validation are spatially correlated with the data used to generate the map.
Furthermore, since most of the soil samples in the legacy data were collected along roads near agricultural fields, the innate diversity throughout the Llanos region was not captured as well. Accounting for land area and geospatial variability, similar studies have demonstrated that soil properties can be adequately predicted using sample sizes between 80–137 sample points (see Fang et al., 2005; Xie et al., 2011). Clustering is a known problem with legacy data, and when examined in this study, the sample size decreases from 653 to roughly 30 sample points for SOC content. Therefore, the soil samples of the legacy data used here may have failed to capture the spatial variability present within the region. The latter method has the advantage of geospatial technologies that can be used to characterize patterns of soil properties over various spatial scales. For this methodology to be effective, the sampling design must include a subset of points that are representative of various macro- and micro-ecosystems. Given the vast range of the Eastern Plains of Colombia, however, much of the physical area can only be covered with limited scope. Strategic planning of sample design can overcome these challenges by identifying an effective sample size and data collection locations that can be used to draw scientifically based conclusions and develop soil carbon baseline for land use planning and GHG emissions monitoring. Therefore, it is logical that large estimates of uncertainty among SOC stock predictions were found to be caused by variability in SOC content. Goidts et al. (2009) used an error propagation method to assess the relative contribution of SOC content, sampling depth, bulk density, and rock fragments used in the determination of SOC stock variability in Southern Belgium. Like this study, for non-stony soils they found that the main source of uncertainty in the SOC stock predictions was the SOC content, which represented an average of 47% of the SOC stock variability.
This presented map of SOC stock in the Eastern Plains is far from perfect, but it highlights areas for future sampling and management initiatives. Our analysis indicated that predictions of SOC content and SOC stock within this region would be greatly improved if future data collection initiatives focused in Casanare, Arauca and Vichada department. Given the vast size and geological diversity within the Eastern Plains, it is recommended that future sampling initiatives concentrate on collecting more soil samples from more diverse landscapes in future mapping initiatives. Doing so will likely reduce uncertainty propagation standard deviation and relative error of SOC content predictions, which will contribute to more accurate assessments of SOC stock in the topsoil of the Llanos region.
Developing digital soil maps of the Eastern Plains of Colombia presents many challenges. However, the SOC content and stock maps developed in this study provide meaningful understanding landscape dynamics of two essential soil properties. Given natural hazards and anthropogenic factors such as climate change and land use change, this study is important as results can be used to inform sustainable development and management of future soil sampling initiatives within this region. Determinations of current SOC content and stock will also help inform future and ongoing policy conservation strategies for this evolving landscape.
The data analyzed in this study is subject to the following licenses/restrictions: part of the data is publicly available but some were provided by the oweners only for this work and can not be made available. Requests to access these datasets should be directed to Mayesse da Silva,bS5hLmRhc2lsdmFAY2dpYXIub3Jn.
SR led the writing of the manuscript, with text contributions from MS and JM. SR and MS designed the framework of the research and organized the data. SR performed the programming and data analysis. JM formatted the document and graphics. All authors reviewed and approved the final draft of the manuscript.
This work is part of the project Land use change in the Orinoquia funded by The Nature Conservancy, as part of the Science for Nature and People Partnership (SNAPP).
The authors declare that the research was conducted in the absence of any commercial or financial relationships that could be construed as a potential conflict of interest.
The authors would like to thank Glenn Hyman and Rebecca Paffard, our colleagues in the SNAPP group for their input during the map-making process. We would also like to acknowledge the ISRIC SoilGrids organization, with special thanks to Dr Gerard Heuvelink for his help with the R code that was used to create the digital soil maps. This work would not have been possible if not for legacy data provided by the Institute of Hydrology, Meteorology and Environmental Studies (IDEAM), Agustin Codazzi Geographical Institute (IGAC), and the International Center for Tropical Agriculture (CIAT) in cooperation with Corporación Colombiana de Investigación Agropecuaria (AGROSAVIA).
Ashtekar, J. M., and Owens, P. R. (2013). Remembering Knowledge: an Expert Knowledge Based Approach to Digital Soil Mapping. Soil Horiz. 54 (5), 1–6. doi:10.2136/sh13-01-0007
Ashtekar, J., Owens, P., Brown, R., Winzeler, H., Dorantes, M., Libohova, Z., et al. (2014). “Digital Mapping of Soil Properties and Associated Uncertainties in the Llanos Orientales, South America,” in GlobalSoilMap. Editor D. Arrouays, and N. McKenzie, 367–372.doi:10.1201/b16500-67
Batjes, N. H. (2014). Total Carbon and Nitrogen in the Soils of the World. Eur. J. Soil Sci. 65 (1), 10–21. doi:10.1111/ejss.12114_2
Blydenstein, J. (1967). Tropical savanna Vegetation of the Llanos of colombia. Ecology 48 (1), 1–15. doi:10.2307/1933412
Breiman, L. (2001). Statistical Modeling: The Two Cultures (With Comments and a Rejoinder by the Author). Statist. Sci. 16 (3), 199–215. doi:10.1214/ss/1009213726
Brus, D. J., Kempen, B., and Heuvelink, G. B. M. (2011). Sampling for Validation of Digital Soil Maps. Eur. J. Soil Sci. 62 (3), 394–407. doi:10.1111/j.1365-2389.2011.01364.x
Fang, H., Liu, G., and Kearney, M. (2005). Georelational Analysis of Soil Type, Soil Salt Content, Landform, and Land Use in the Yellow River Delta, China. Environ. Manag. 35 (1), 72–83. doi:10.1007/s00267-004-3066-2
Garcia-Ulloa, J., Sloan, S., Pacheco, P., Ghazoul, J., and Koh, L. P. (2012). Lowering Environmental Costs of Oil-palm Expansion in colombia. Conservation Lett. 5 (5), 366–375. doi:10.1111/j.1755-263X.2012.00254.x
Goidts, E., Van Wesemael, B., and Crucifix, M. (2009). Magnitude and Sources of Uncertainties in Soil Organic Carbon (SOC) Stock Assessments at Various Scales. Eur. J. Soil Sci. 60 (5), 723–739. doi:10.1111/j.1365-2389.2009.01157.x
Goosen, Ir. D. (1971). Physiography and Soils of the Llanos Orientales, Columbia. Enschede, Netherlands: International Institute for Aerial Survey and Earth Sciences (ITC).
Grimm, R., Behrens, T., Märker, M., and Elsenbeer, H. (2008). Soil Organic Carbon Concentrations and Stocks on Barro Colorado Island - Digital Soil Mapping Using Random Forests Analysis. Geoderma 146 (1), 102–113. doi:10.1016/j.geoderma.2008.05.008
Hartemink, A. E., et al. (2010). “GlobalSoilMap.net – A New Digital Soil Map of the World,” in Digital Soil Mapping. Progress in Soil Science. Editors J .L. Boettinger, D. W. Howell, A. C. Moore, A. E. Hartemink, and S. Kienast-Brown (Dordrecht: Springer), 2. doi:10.1007/978-90-481-8863-5_33
Hengl, T., de Jesus, J. M., Heuvelink, G. B., Gonzalez, M. R., Kilibarda, M., Blagotić, A., et al. (2017). SoilGrids250m: Global Gridded Soil Information Based on Machine Learning. PLoS one 12 (2), e0169748. doi:10.1371/journal.pone.0169748
Ideam, P., and Mads, D.Cancilleria (2016). Inventario Nacional y Departamental de Gases de Efecto Invernadero - Colombia. Tercera Comunicación Nacional de Cambio Climático.
IDEAMIGACSINCHI (2012). Capa Nacional de Cobertura de la Tierra (período 2005–2009): Metodología CORINE Land Cover adaptada para Colombia escala 1:100.000. V1. 0 Bogota: IDEAM.
Jarvis, A., Reuter, H. I., Nelson, A., and Guevara, E. (2008). Hole-filled SRTM for the globe Version 4, available from the CGIAR-CSI SRTM 90m Database. Available at: http://srtm.csi.cgiar.org (Accessed July 13, 2018).
Jasiewicz, J., and Stepinski, T. F. (2013). Geomorphons - a Pattern Recognition Approach to Classification and Mapping of Landforms. Geomorphology 182, 147–156. doi:10.1016/j.geomorph.2012.11.005
Krakowski, K., and Zubiría, G. (2018). Accounting for Turbulence in the Colombian Underworld. Trends Organized Crime, 1–21. doi:10.1007/s12117-018-9330-2
Laurance, W. F., Sayer, J., and Cassman, K. G. (2014). Agricultural Expansion and its Impacts on Tropical Nature. Trends Ecol. Evol. 29 (2), 107–116. doi:10.1016/j.tree.2013.12.001
Liaw, A., and Wiener, M. (2002). Classification and Regression by Random Forest. R News (R News), 18–22.
Libohova, Z., Odgers, N. P., Ashtekar, J., Owens, P. R., Thompson, J. A., and Hempel, J. (2016). “Some Challenges on Quantifying Soil Property Predictions Uncertainty for the GlobalSoilMap Using Legacy Data,” in Digital Soil Mapping Across Paradigms, Scales and Boundaries (Singapore: Springer), 131–140. doi:10.1007/978-981-10-0415-5_11
McBratney, A. B., Mendonça Santos, M. L., and Minasny, B. (2003). On Digital Soil Mapping. Geoderma 117 (1), 3–52. doi:10.1016/S0016-7061(03)00223-4
Minasny, B., and McBratney, A. B. (2016). Digital Soil Mapping: A Brief History and Some Lessons. Geoderma 264, 301–311. doi:10.1016/j.geoderma.2015.07.017
Moore, I. D., Gessler, P. E., Nielsen, G. A., and Peterson, G. A. (1993). Soil Attribute Prediction Using Terrain Analysis. Soil Sci. Soc. Am. J. 57 (2), 443–452. doi:10.2136/sssaj1993.03615995005700020026x
Odeh, I. O., McBratney, A. B., and Chittleborough, D. J. (1995). Further Results on Prediction of Soil Properties from Terrain Attributes: Heterotopic Cokriging and Regression-Kriging. Geoderma 67 (3-4), 215–226. doi:10.1016/0016-7061(95)00007-b
Peña, M. A., Ramirez, S., Phillips, J. F., Cabrera, E., Córdoba, N., and Carreño, L. M. (2014). Manual de campo para el monitoreo de carbono en bosques naturales. Colombia: IDEAM. Bogotá D.C., 64.
R Core Team (2016). R: A Language and Environment for Statistical Computing. Vienna, Austria: R Foundation for Statistical ComputingAvailable at: https://www.R-project.org/.
Rausch, J. M. (2013). Changing Concepts of the Llanos Frontier in the Last Half of the Twentieth Century Gainesville: University Press of Florida, 128–146. doi:10.5744/florida/9780813044668.003.0006
Rausch, J. M. (2014). Territorial Rule in Colombia and the Transformation of the Llanos Orientales. Letras Hispanas 10, 86.
Rincón, S. A., Suárez, C. F., Romero-Ruiz, M. H., Flantua, S. G. A., Sarmiento, A., Hernández, N., et al. (2014). Identifying Highly Biodiverse Savannas Based on the European Union Renewable Energy Directive (SuLu Map): Conceptual Background and Technical Guidance Cali: WWF Colombia.
Thornthwaite, C. W. (1931). The Climates of North America: According to a New Classification. Geographical Rev. 21 (4), 633–655. doi:10.2307/209372
Walkey, A., and Black, I. A. (1934). An Examination of the Degtjareff Method for Determining Soil Organic Matter, and a Proposed Modification of the Chromic Acid Titration Method. Soil Sci. 37 (1), 29–38. doi:10.1097/00010694-193401000-00003
Wassenaar, T., Gerber, P., Verburg, P. H., Rosales, M., Ibrahim, M., and Steinfeld, H. (2007). Projecting Land Use Changes in the Neotropics: The Geography of Pasture Expansion into forest. Glob. Environ. Change 17 (1), 86–104. doi:10.1016/j.gloenvcha.2006.03.007
Xie, Y., Chen, T.-b., Lei, M., Yang, J., Guo, Q.-j., Song, B., et al. (2011). Spatial Distribution of Soil Heavy Metal Pollution Estimated by Different Interpolation Methods: Accuracy and Uncertainty Analysis. Chemosphere 82 (3), 468–476. doi:10.1016/j.chemosphere.2010.09.053
Zhu, A.-X., Band, L., Vertessy, R., and Dutton, B. (1997). Derivation of Soil Properties Using a Soil Land Inference Model (SoLIM). Soil Sci. Soc. Am. J. 61 (2), 523–533. doi:10.2136/sssaj1997.03615995006100020022x
Keywords: digital soil mapping, soil organic carbon, machine learning, random forest, spatial modeling
Citation: Rainford S-k, Martín-López JM and Da Silva M (2021) Approximating Soil Organic Carbon Stock in the Eastern Plains of Colombia. Front. Environ. Sci. 9:685819. doi: 10.3389/fenvs.2021.685819
Received: 25 March 2021; Accepted: 08 July 2021;
Published: 21 July 2021.
Edited by:
Gabriele Buttafuoco, National Research Council (CNR), ItalyReviewed by:
Neil A. Coles, University of Leeds, United KingdomCopyright © 2021 Rainford, Martín-López and Da Silva. This is an open-access article distributed under the terms of the Creative Commons Attribution License (CC BY). The use, distribution or reproduction in other forums is permitted, provided the original author(s) and the copyright owner(s) are credited and that the original publication in this journal is cited, in accordance with accepted academic practice. No use, distribution or reproduction is permitted which does not comply with these terms.
*Correspondence: Mayesse Da Silva, bS5hLmRhc2lsdmFAY2dpYXIub3Jn
Disclaimer: All claims expressed in this article are solely those of the authors and do not necessarily represent those of their affiliated organizations, or those of the publisher, the editors and the reviewers. Any product that may be evaluated in this article or claim that may be made by its manufacturer is not guaranteed or endorsed by the publisher.
Research integrity at Frontiers
Learn more about the work of our research integrity team to safeguard the quality of each article we publish.