 Paulo S. Domingues
 Helena Pala
 Nelson S. Oliveira
95% of researchers rate our articles as excellent or good
Learn more about the work of our research integrity team to safeguard the quality of each article we publish.
Find out more
ORIGINAL RESEARCH article
Front. Environ. Sci. , 10 June 2021
Sec. Water and Wastewater Management
Volume 9 - 2021 | https://doi.org/10.3389/fenvs.2021.684074
This article is part of the Research Topic Resource Recovery from Wastewater Treatment View all 4 articles
The management of residual flows from swine farms, such as slurry and hydrolyzate, is a serious environmental problem in Portugal, so the search for new solutions is important, especially if they can be implemented in production sites, avoiding the transport of waste. Anaerobic co-digestion can configure a sustainable method of management and valorization of these flows in swine farms, resulting in biogas to produce energy and a digestate with agronomic value. The swine hydrolyzate is the product from the elimination of swine carcasses on the farms, through a hydrolysis process. Its use in the anaerobic process wasn’t found in the literature, identifying the need to evaluate its potential. Thus, anaerobic co-digestion of swine slurry and hydrolyzate was carried out and the main purpose of this research was to find the best feeding ratio between the two substrates in batch test, focusing on biogas production. The study was developed in two phases, both under mesophilic conditions. In the first one, using 100 ml syringes, the effect of the relative proportion of substrates on the anaerobic co-digestion potential was investigated and the effect of pressure sterilization of the substrates on biogas production was verified. In the second phase, a larger scale study was carried out in a 4,500 ml digestor, ran under the conditions identified as the most favorable in the preliminary tests. The results obtained allowed us to conclude that the largest volume of accumulated biogas was obtained with the proportion of 90.9% swine slurry: 9.1% swine hydrolyzate (v/v); and that the sterilization of the substrates doesn’t constitute an effective thermal pre-treatment. The larger scale test revealed an inefficient anaerobic process due to the inhibitory effect caused by the accumulation of ammonia and volatile organic acids. However, the production yield was 606.8 LBiogas/kgVS and 431.6 LMethane/kgVS, indicating that process allowed a production of biogas and methane higher than the values cited in literature for anaerobic digestion of swine slurry. This result showed that the use of swine hydrolyzate as a co-substrate results in a better balance of nutrients, promoting a better development of microorganisms.
The growing demand for food, namely meat and dairy products, has intensified livestock production in recent decades. One of the most relevant livestock sectors is swine industry (Kafle and Kim, 2012). The residues produced are mainly slurry and manure, dead animals, fetuses and animal tissues. These materials have a high organic load and an excess of nutrients, such as Nitrogen (N), Phosphorus (P) and even some micronutrients such as Zinc (Zn) and Copper (Cu). The presence of antibiotics is an emerging source of pollution and has an inhibitory effect on the anaerobic process, when these materials are used as a substrate (Drosg, 2013).
In 2019, there were approximately 148 million swine in the European Union (EU) countries. In Portugal, the swine industry is of great importance, with approximately 2 million animals and 4,000 swine farms (DGAV Direção-Geral de Alimentação e Veterinária, 2020). The main residual flows resulting from swine farms, such as swine slurry (SS) and swine hydrolyzate (SH), are a source of odors and pathogens, emission of greenhouse gases and groundwater contamination (Kafle and Kim, 2012). The SS is composed by a liquid mixture of swine excrement and urine, also containing the washing waters of the facilities. Ferreira (2014) mentions a value of 5 dm3/animal.day to estimate the SS production in Portugal. Considering this value for the number of swine in 2019, an annual availability of approximately 3.9 million m3 can be estimated. SH originates from fetuses, oocytes, embryos, semen, blood, placentas and swine that die on the farm due to natural causes and are therefore not suitable for human consumption. It results from the implementation of a plan to eliminate these materials on the farms, through a hydrolysis process. Currently in Portugal, the implementation of this process in some swine farms shows that each breeding-female swine originates on average 60 kg of this materials per year and that 1 m3 of SH contains around 600 kg. With about 200000 breeding-female swine stock, an annual SH production potential of approximately 20.000 m3 can be estimated.
These residual flows belong to category two of animal byproducts, as classified by the Animal By-Product Regulation of EU, ABPR 1069/2009/EC, and can be used as substrate for the anaerobic process in biogas plants only after sterilization. This method consists in the previous reduction of the particles to dimensions not exceeding 50 mm and heating them up to a core temperature above 133°C for at least 20 min without interruption and at a pressure of not less than 3 bar (EC European Commission, 2009).
This research focused on the Anaerobic co-Digestion (AcoD) of residual flows, namely SS and SH, as a possible way of managing these effluents, while producing biogas that can be used to generate heat or electricity on the farm, and also guarantee the biochemical stabilization of the material, the destruction of pathogenic microorganisms and a digestate that can be valued as an organic soil corrector. The main goal of this work was to evaluate the SH potential as a co-substrate in mesophilic batch AcoD, finding the best feeding SS:SH ratio, and studying the performance of this process and the biogas production. Although the use of SS as a substrate in the anaerobic process for biogas production is already widely studied, SH use in the process wasn’t found in the literature, identifying the need to evaluate its potential. The innovative character of this study thus focuses on the experimental development of biogas production through the AcoD of these two residual flows, aiming at its application in swine farms. The SH is studied as a co-substrate, since its availability in a farm is much lower than the volumes of SS generated.
The anaerobic digestion (AD) consists of complex biological processes that occur mainly in the absence of oxygen, under controlled conditions, and in digesters in which the interactions of various microorganisms allow the degradation of organic matter present in the substrate (Mehariya et al., 2018). Anaerobic digesters are available in various designs and configurations, being classified based on the solids content of the raw material and the feeding mode, the organic load rate, the number of stages/phases and the interaction mode of the biomass with the substrate (Nizami et al., 2013).
There are four main biochemical steps involved in AD, namely, hydrolysis, acidogenesis, acetogenesis and methanogenesis. (Mehariya et al., 2018). In the initial steps, the bacteria decompose complex substrates into volatile organic acids (VOA), carbon dioxide (CO2) and hydrogen (H2). Only at the final stage, the process is strictly anaerobic and the archaea are responsible for the methane (CH4) production (Ren et al., 2017). This step is thus decisive to the effectivess of biogas production (Abbasi et al., 2012). AD is influenced by the interaction between the biological community and environmental factors that ensure better process stability and efficiency, such as temperature, pH, alkalinity, VOA, long chain organic acids (LCOA), ammonia concentration, heavy metals concentration, detergents and antibiotics presence, nutrients, Carbon/Nitrogen (C/N) ratio, organic load, retention time, agitation, total solids (TS), humidity and particle size (Neshat et al., 2017).
The substrates used in AD can be of different origins, such as sewage sludge, organic fraction of solid urban wastes, non-edible residues from food crops, residues resulting from agricultural activity (cow, swine, poultry and others), wastes of animal oils and fats, effluents resulting from industrial activity, such as the food products, slaughterhouses, chemicals, milk, and others (Deublein and Steinhauser, 2008). AD allows for optimized waste management, currently being one of the most used technologies worldwide in the management of biomass and waste, as in addition to producing biogas, it also results in a nutrient-rich effluent, the digestate (Samun et al., 2017). Biogas is a combustible gas mixture, and its chemical composition varies with the type of biomass and with the various operating parameters used in the DA process (Weiland, 2010). Typical biogas contains 40–75% (v/v) of CH4, 25–55% (v/v) of CO2 and traces of other gases, such as H2, oxygen (O2), nitrogen (N2), sulfide hydrogen (H2S), water and ammonia (Kadam and Panwar, 2017). In addition, it also contains dust particles, siloxanes, aromatic and halogenated compounds, although in very small quantities (Khan et al., 2017). Biogas can be used to produce thermal or electrical energy, or subjected to a purification process to obtain biomethane, that can be used as a substitute for natural gas (Hakawati et al., 2017). The digestate is a mixture of undegraded substances with the bacterial community itself. Its direct application in agriculture is dependent on the fulfillment of the established quality requirements. Usually the digestate is dehydrated and the liquid fraction is forwarded to the DA or other treatment process. The solid fraction is valued through incorporating into a stabilization process such as composting, giving rise to a compost. This product has enormous agronomic and environmental value and can be used as an organic soil corrector, as it improves its texture and workability, containing nutrients such as N and potassium (K) (Baweja et al., 2018).
Pre-treatment of substrates can be an important strategy that aims to improve the anaerobic process, transforming complex structures of some substrates into compounds that are more easily biodegradable for microorganisms, which may result in an increase in the rate of substrates degradation (Armah and Armah, 2017). Numerous pre-treatment approaches can be used, such as physical, thermal, chemical, biological and combined methods (Mehariya et al., 2018). In animal by-products made up of residual flows of the swine industry, as is the case with the substrates used in this research, thermal pre-treatment is usually associated, as it allows the legal requirement of sterilization prior to AD to be met. However, the effect of this pre-treatment on this type of substrates, namely SS, is associated with divergent results, since the biogas production from pre-treated substrates isn’t always greater than that obtained from substrates without pre-treatment. In some cases, thermal pretreatment can cause the formation of recalcitrant compounds, thus being considered to have a negative effect, with an influence on biogas yield (Carrere et al., 2015).
In the anaerobic process, the growth of microorganisms for the biogas production requires that organic materials meet certain nutritional requirements, which aren’t always guaranteed through a single substrate (Kafle and Kim, 2012). In this context, a strategy used in the process is AcoD, which involves the simultaneous degradation of two or more substrates. When there are different organic wastes in the same geographic location, this strategy allows for integrated management (Siddique and Wahid, 2018). The use of SS as a substrate in the anaerobic process, prevents the uncontrolled emission of CH4 from the natural degradation of this matter, as well as limits the emission of odors. Moreover, its use can be advantageous, avoiding a decrease in the pH value, a consequence of the excessive acidification that can occur in the digestion of some types of substrates. However, its high N content can cause problems in the digesters and inhibit the biogas production (Tian et al., 2015). As for the SH, its local application in an anaerobic process allows a reduction in costs related to its collection outside the farm and ensures a decrease in the movement of vehicles. EU legislation prohibits swine farmers from burying dead animals on the farm, thus creating sustainable alternatives, such as the implementation of a carcass elimination plan through hydrolysis. This procedure thus allows disposal to occur on the farm itself, at lower costs and with lower health risks (Kirby et al., 2018).
The AcoD of SS with waste from different sources, usually sewage sludge and food waste, is widely used with satisfactory results (Nasir et al., 2012). However, in these cases there is always a need to carry out the transport of these substrates with the inherent disadvantages, both at an environmental and economic level. There are few references in the literature regarding AcoD of SS with other substrates from the swine farms, such as swine carcasses. The possibility of using the anaerobic process on the farm itself to digest swine carcasses has been little considered, mainly using carcasses hydrolysis. Swine carcasses contain a high content of organic matter, protein and lipids, and can be established as a useful co-substrate for the AcoD process (Edstrom et al., 2003). However, Siddique and Wahid (2018) report that high concentrations of lipids can create problems in anaerobic digesters, due to a possible concentration of ammonia and LCOA, resulting in the inhibition of microorganisms. Thus, the need to investigate the use of SH as a co-substrate is evident.
The swine slurry (SS) and swine hydrolyzate (SH) samples were collected in a farm in the central region of Portugal, located in Lugar do raso, Regueira de Pontes, municipality of Leiria, Portugal. This farm annually produces about 100,000 m3 of SS and 50 m3 of SH. Samples were collected in January 2020 for preliminary tests, and in May 2020 for the final test. SS samples were taken from the first of three existing lagoons. Regarding the SH, the materials generated daily on the farm are deposited in tanks equipped with an electrical resistor. Before starting deposition, the tank is filled with 1/4 of water and heated to around 40°C, in order to promote the decomposition of the materials. It is a mesophilic hydrolysis with a hydraulic retention time of 180–200 days, in an optional anaerobic environment. SH was taken directly from the first of three existing tanks. After collection, samples were directly transported to the lab in a thermal bag, in order to minimize the occurrence of biological degradation.
SS and SH samples used in the preliminary tests were analyzed for volatile solids (VS), fixed solids (FS), pH, total carbon (C), total nitrogen (N), total phosphorus (P) and sulfur (S). AcoD substrates, composed by SS and SH samples, used in the final test, as well as the obtained digestate were characterized by parameters, such as VS, FS, total C, total N, total P, S, chemical oxygen demand (COD), biochemical oxygen demand (BOD), Kjeldahl-N, ammoniacal nitrogen (NH4-N) and formic, acetic, propionic and butyric acids. Before the test, VS and FS were also measured in SS and SH individual samples. The characterization of the biogas produced in the final test was carried out through analysis on a Sewerin EX-TEC® HS 680. The main constituents of biogas were quantified, namely CH4 (% v/v) and CO2 (% v/v).
The laboratory tests (Table 1) were designed to respond to the following aspects:
(1) Biogas production potential through the AD of SS;
(2) Biogas production potential through the AcoD of SS and SH, identifying the proportion of the two substrates that results in the highest production;
(3) Sterilization effect, as thermal pre-treatment of the substrates, in the biogas production through the AcoD of SS and SH, assuming the proportion of the two substrates that results in the highest production;
(4) AcoD efficiency of SS and SH, assuming the proportion of the two substrates that results in the highest production.
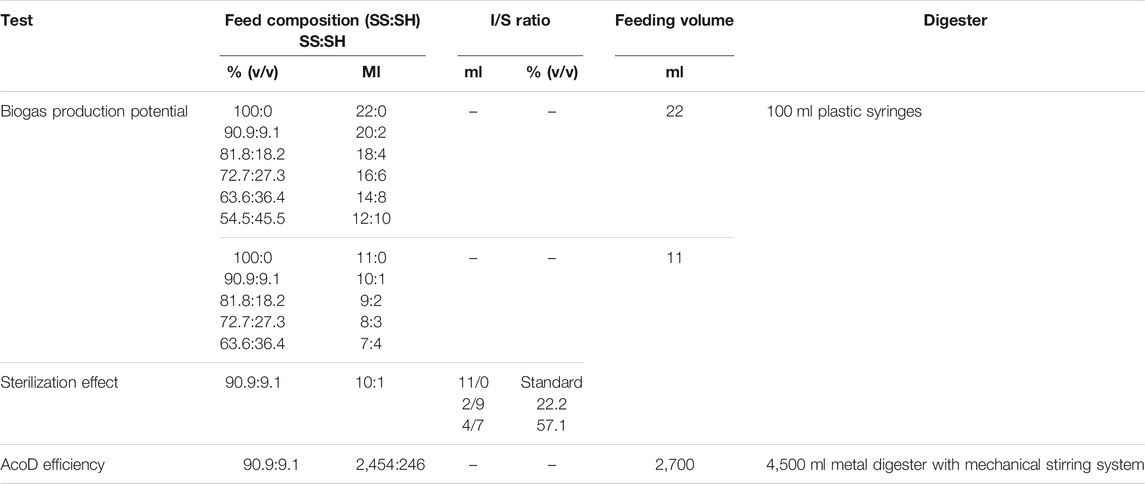
TABLE 1. Tests performed during the experimental procedure.
The experimental procedure used is presented below. The tests were carried out in batch, that is, the digesters were fed only once at the beginning of each test and sealed until the biogas production was finished.
The biogas production potential was assessed by testing mixtures with different proportions of SS and SH, as described in Table 1. The AD of the SS sample serves as a standard, allowing to evaluate the effect of the SH increase on the AcoD of these two substrates. These tests were carried out without the introduction of inoculum, since the substrates used come from an anaerobic environment and have a microbiological community capable of initiating the biological reaction. In the first series of tests, a feeding volume of 22 ml was used and incubated for 10 days. At the end of that period, it was found that the volume of the syringes would not be sufficient to store and measure the totality of the biogas produced, so the tests were interrupted and a new study was started, with a lower feeding volume. Thus, in the second series of tests, the volume of feed sample was 11 ml, to promote complete degradation of the substrate, and to guarantee the storage and measurement of the total biogas produced during the anaerobic process.
The evaluation of the thermal pre-treatment effect on the substrates was carried out by using a sterilization procedure in an automatic autoclave Raypa AES-75. Sterilization was applied to the SS:SH mixture that showed better biogas production in the first set of tests (Table 1). The sample was properly stored in a sealed glass container, for 20 min, at 133°C and a relative pressure of 2 bar. Since sterilization promotes the elimination of microorganisms, it was necessary to use inoculum in the tests that involved sterile samples. For this purpose, non-sterile fractions from the same sample were used in different inoculum/substrate (I/S) ratios, based on the total volume. The ratios tested are based on the information provided by Mehariya et al. (2018), who refer to several studies reporting an effective I/S ratio of about 20%, varying according to the substrates used. A non-sterile sample was used as a standard thus allowing to evaluate both the sterilization effect of these substrates and the effect of the I/S ratio on the biogas production. These tests were carried out with a feed volume of 11 ml, until biogas production was verified.
All preliminary tests were performed in 100 ml plastic syringes and kept at a temperature of 35 ± 1°C, in a Binder incubator (Figure 1), according to the procedure reported by Niyonsaba (2014). Biogas production was evaluated daily, using the syringe measurement scale, and the recorded values were then adjusted to the volumes at the standard temperature (0°C) and pressure (1 atm), according to Eq. 1:
where VSTP is the volume of gas measured at standard temperature and pressure (L), VT is the volume of gas measured at temperature T (L), T is the temperature of the fermentation gas (°C) and PT is the pressure of gas measured at temperature T (atm).
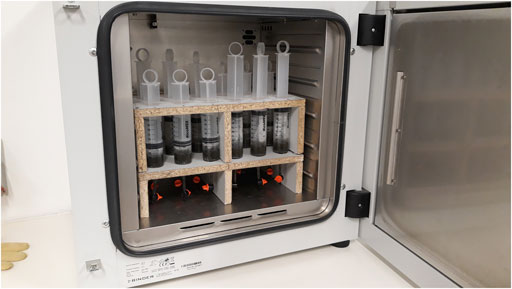
FIGURE 1. Laboratory tests using 100 ml syringes.
Before each measurement, the digesters were manually agitated for 10–15 s. These tests were carried out in triplicate, in order to obtain reliable results for the preparation of the quantitative analysis of the biogas produced. The statistical significance of the quantitative analysis was assessed by analysis of variance (single factor ANOVA), with a level of significance (p) lower than 0.05.
The AcoD efficiency was evaluated in a larger scale test. A 4,500 ml digestor, with useful volume of 2,700 ml and mechanical stirring, was specifically built for this purpose from equipment at the end of its life cycle (Figure 2). In the upper part of the digester, a biogas outlet, a pressure measurement inlet, a substrate feed inlet and a pH and redox potential measurement input were installed. At the base, an outlet of the digestate material was installed, which also allows cleaning.
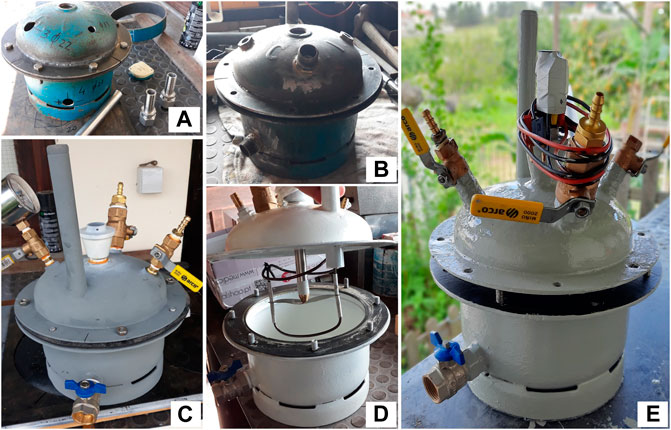
FIGURE 2. Construction phases of the anaerobic digester. (A) Cutting, drilling and flanges welding; (B) Welding of threaded parts; (C) Primer application and parts assembly; (D) Painting and assembly of the mechanical stirring system; (E) Final assembly.
The test was performed in discontinuous regime, with a substrate feed volume of 2,700 ml. The SS:SH mixture which maximizes biogas production was used as AcoD substrate 90.9% SS:9.1% SH (v/v); Even though the AD of these residual flows requires previous sterilization, this test was performed without sample sterilization. This comes from the fact that tests indicated that sterilization only delays the development of the AD process with no significant influence on the biogas production. This procedure avoided the use of inoculum, since the substrates come from an anaerobic environment with an active biological community, thus simplifying the execution of the test. After introducing the mixture of substrates into the digester and before sealing the system, it was washed with a N2 flow to guarantee anaerobic conditions. During the test, the digester was heated in a water bath at 35°C ± 1°C, in a JP Selecta Precisterm equipment, to provide the appropriate temperature conditions; and it was mechanically stirred twice a day, for 5 min, with reduced speed, ensuring the substrates homogenization. The system configuration integrated the connection of the digester to an 18 syringes of 100 ml assembly in series, to daily evaluate the volume of biogas produced, as shown in Figure 3. The values recorded by reading the syringes measurement scale were then adjusted to the volumes at standard temperature (0°C) and pressure (1 atm) (Eq. 1). The biogas production was calculated as a function of the VS present in the substrates fed to the digester, thus ensuring comparison with data from other authors.
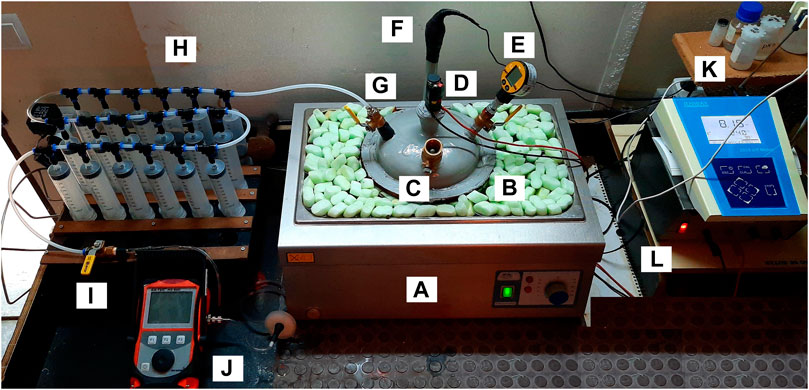
FIGURE 3. Laboratory test with biogas production and measurement system. (A) Hot water bath; (B) Anaerobic digester; (C) Substrate feed inlet; (D) Motor of the mechanical stirring system; (E) Manometer; (F) pH and redox potential measurement input; (G) Biogas outlet; (H) Measuring syringe battery; (I) System purge/Gas analyzer connector; (J) Gas analyzer; (K) pH, redox potential and temperature measurement equipment; (L) Voltage converter.
The pressure measurement of the biogas was carried out with a Keller LEO two equipment, connected to the system through the pressure measurement inlet. Biogas composition, namely CH4 and CO2, was determined daily through an analyzer, as described in Samples Analyses, connected to the syringe battery, using the biogas stored in the syringes and previously quantified. The CH4 production was calculated as a function of the VS present in the substrates fed to the digester, thus ensuring comparison with the literature. For the measurement of pH and redox potential values, a Jenway 3,510 pH Meter equipment was used, with the integration of the electrode in the digester input, and the record was made daily. The test ran until the end of the biogas production, being finished after 5 days without production.
At the end of the test, a sample of digestate was collected for analysis, to complement the evaluation of the AcoD efficiency. The experimental data allowed the evaluation of the AcoD efficiency with regard to the following parameters: elementary analysis (total C, total N, total P and S); removal efficiency of TS, VS, COD and BOD; Kjeldahl-N, NH4-N; formic, acetic, propionic and butyric acid; and biogas and CH4 volume produced.
The preliminary tests in different SS:SH proportions (% v/v), whether using a feed volume of the digesters of 22 ml or 11 ml, resulted in an identical evolution of biogas production with the highest volume of accumulated biogas obtained in the AcoD tests 90.9% SS:9.1% SH (v/v). In order to assess the biogas production potential, the average results of the triplicate measurements are presented. The analysis of variance (single factor ANOVA), performed with a level of significance (p) lower than 0.05, allowed to verify that there are no significant differences between the results obtained in triplicates.
Considering a feed volume of the digesters of 22 ml, the largest biogas production after 10 days was 66 ± 1 ml, vs. 16 ± 1 ml obtained in the AD of SS. The lowest volume of accumulated biogas was obtained with the 54.5% SS:45.5% SH (v/v) mixture.
Figure 4 shows the preliminary tests, using a feed volume of the digesters of 11 ml. The accumulated biogas obtained in the AcoD test of 90.9% SS: 9.1% SH (v/v) after 31 days, was higher than that obtained in the AD test of SS (85 ± 3 ml vs. 41 ± 3 ml, respectively). The lowest accumulated biogas volume (11 ± 2 ml) was found in the AcoD test of 63.6% SS: 36.4% SH (v/v).
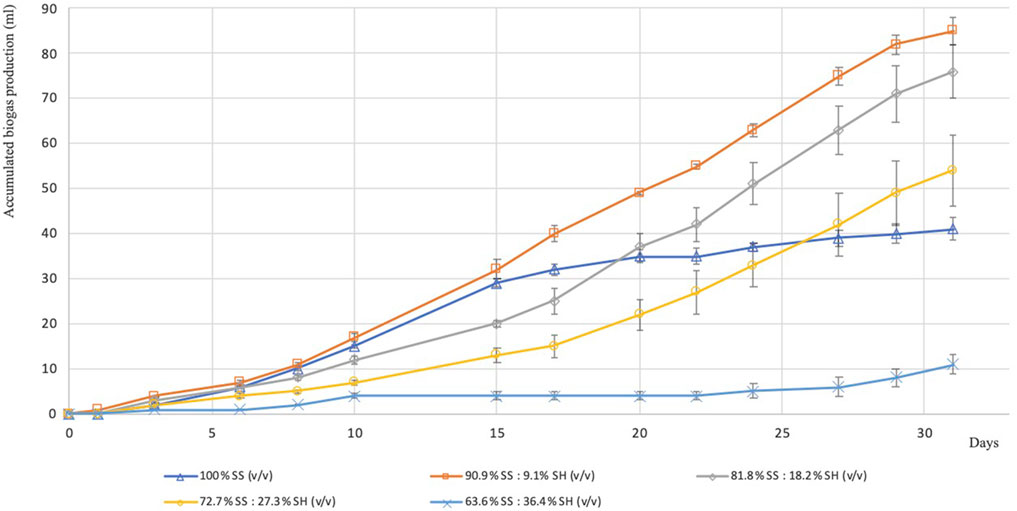
FIGURE 4. Effect of the SS:SH proportion on biogas production (feed volume = 11 ml).
These results show that with the AcoD of the two substrates in a proportion that contains approximately between 9 and 27% (v/v) of SH, the biogas production is greater than in the DA of SS. For higher values, the biogas production in AcoD decreases significantly. This fact may be associated with an increase in the organic load fed to the digesters, as a result of the increase in the SH fraction in AcoD, since SH is richer in VS than SS (Table 2), which leads to process inhibition.
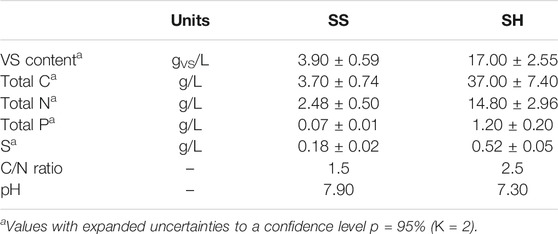
TABLE 2. Characterization of the substrates studied in the preliminary tests.
According to Hassan et al. (2017), in the AD of substrates that have high amounts of nitrogen, such as animal manure, the use of high organic loads can inhibit the process due to the accumulation of ammonia. Borowski and Kubacki (2015) showed the high potential of swine slaughterhouse wastes for the biogas production when using AcoD under mesophilic conditions. These authors concluded that the use of swine slaughterhouse wastes and sewage sludge in co-digestion allows a better balance of macro and micronutrients but they also state that these substrates are characterized by high amounts of nitrogen, which may result in a low C/N ratio.
In fact, our results show that although the main nutrients are available in the SS (Table 2), by adding the SH in a certain proportion, the biogas production is maximized (Figure 4). Thus, it seems that AcoD allows to obtain a better balance of nutrients by using these complementary substrates, ensuring the nutrients that satisfy microorganism development and increase biogas production. This is probably due to the SH co-substrate, which in addition to having a lower pH, is rich in phosphorus and sulfur compared to SS, thus justifying the better results until a certain proportion. Still, as expected, these two substrates have a C/N ratio below the range considered optimal for the anaerobic process (20–30).
In order to assess the effect of substrates sterilization on biogas production, Figure 5 shows the accumulated production when the 90.9% SS:9.1% SH (v/v) mixture (which maximized biogas production), is subjected to sterilization/thermal pre-treatment. The average results of the triplicate measurements are presented.
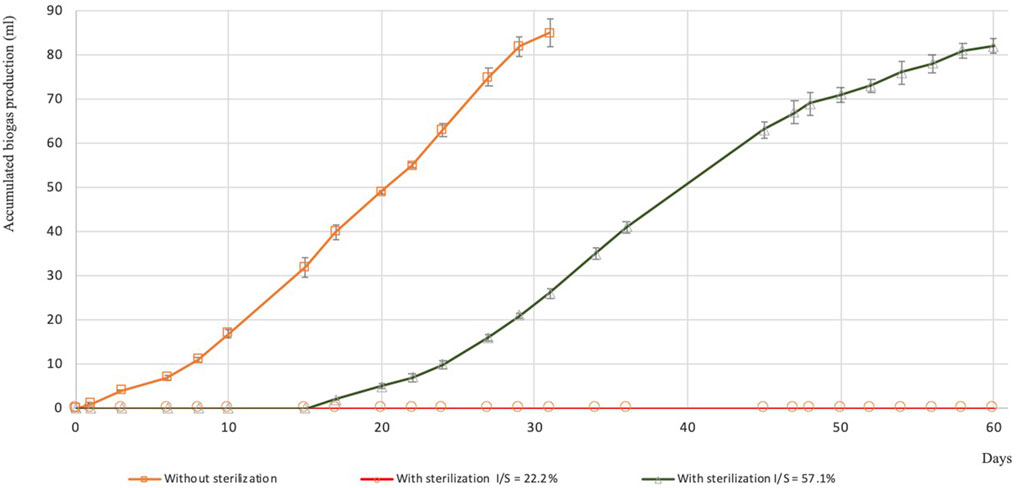
FIGURE 5. Effect of sterilization/thermal pre-treatment on biogas production.
According to Figure 5, the biogas production is null when the sterilized substrates (thermally pre-treated) are inoculated with an I/S ratio of 22.2% (v/v), indicating that the microbiological community present isn’t enough to start the biological reaction. In the test without sample sterilization, the biogas production starts immediately, reaching an accumulated value of 85 ± 3 ml, after 31 days. In this case, as the substrates used come from an anaerobic environment with an active biological community, there was no restriction on microbiological growth. Then, with the increase in inoculum (I/S ratio of 57.1% v/v), it appears that the sample sterilization only delays the development of the anaerobic process, with no significant influence on biogas production compared to the test without substrates sterilization. In this case, AcoD lasted 60 days, starting the biogas production about 15 days after the beginning of the test, and ending with an accumulated value of 82 ± 2 ml (vs. 85 ± 3 ml in the test without sterilization). As previously mentioned, Mehariya et al. (2018) report that there are several studies indicating an ideal I/S ratio of about 20% of inoculum relative to the substrate, varying according to the substrates used. Apparently, the characteristics of the SS and the SH substrates require a higher I/S ratio. Thermal pre-treatment is often used in this type of substrates, as it allows compliance with the legal requirement for sterilization prior to the anaerobic process. However, the results obtained demonstrate that the sterilization of the substrates doesn’t constitute an effective thermal pre-treatment. As noted, divergent results have been reported in literature, considering that in some cases the biogas production from pre-treated substrates isn’t greater than that obtained from substrates without pre-treatment, according to what was verified in this research.
Following the preliminary tests, a larger scale test was performed with a substrate feed volume of 2,700 ml. The test monitoring involved the characterization of the substrates, the digestate and the gaseous fraction obtained; and the quantification of the biogas produced during the process. The operation took place during 61 days with a temperature of 35°C ± 1°C.
The efficient decomposition of organic matter in the anaerobic process depends on the amount of solids fed to the digester. According to Table 3 the digester was fed with a total amount of VS of 70.20 gVS, 83.9% from SS (58.90 gVS) and 16.1% from SH (11.30 gVS).
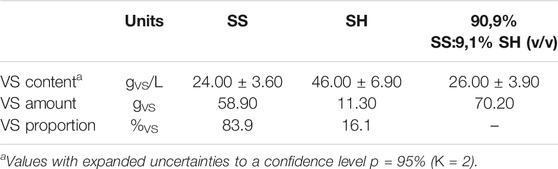
TABLE 3. Operating parameters of the AcoD efficiency test.
Kafle and Kim (2012) concluded that the application of two different organic loads, namely 2.50 gVS/L and 5.00 gVS/L, using swine manure as a substrate in a laboratory study under mesophilic conditions, results in a similar accumulated biogas production. These authors indicate that the use of higher organic loads requires less energy and favors the growth of various species of microorganisms, reducing the size and costs associated with the digester and increasing the biogas production. However, Rashama et al. (2019) mention that the increase in the organic load beyond a specific interval may impair the stability of the anaerobic process, since the greater activity of hydrolytic and acidogenic bacteria, compared to methanogenic microorganisms, results in higher VOA production and digestor acidification. Usually, the substrates are diluted in order to use lower organic loads. For the present research, there is no information about the organic loads in the AcoD of the specific substrates used, which could serve as a reference, so no dilution of the substrates was performed because they already contain a large amount of water. Thus, the value of the organic load applied to the digester (26.00 ± 3.90 gVS/L) can be considered high, compared to other AcoD processes in the literature.
The characterization of the sample fed to the digester and of the digestate at the end of the test, is shown in Table 4. Weiland (2010) mentions that for the development of anaerobic microorganisms, the organic matter used in the process must contain the essential nutrients with the ideal ratio of C:N:P:S = 600:15:5:1. According to the results, a proportion of 28:18:3:1 was found in the AcoD process, therefore outside the range considered to be optimal by this author, especially with regard to C.
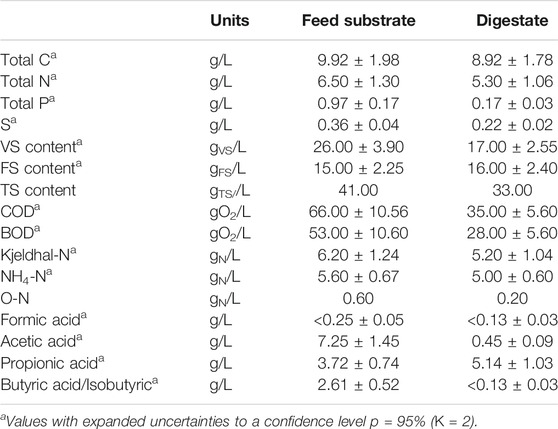
TABLE 4. Characterization of substrate mixture and digestate samples.
These results corroborate with that evidenced in Preliminary Tests resulting in low C/N ratios (1.5 for SS and 2.5 for SH; Table 2). The mixture of substrates used in this assay also has a C/N ratio of 1.5, a value well below the range considered optimal for AcoD (20–30), leading to the conclusion that, at this level, the SH introduction didn’t benefit the anaerobic process. In these cases, the literature reports a high concentration of ammonia due to excess N, with a consequent increase in pH, which will have a toxic effect on methanogenic microorganisms, inhibiting them and leading to a VOA accumulation. This result shows the need to introduce a third substrate, rich in C, in the AcoD, which allows reaching the optimum ratio mentioned, in order to maximize the biogas production.
Regarding the digestate (Table 4), there is a reduced amount of P, compared to the amount present in the mixture of substrates fed to the digester. Since P is an essential nutrient to accelerate the metabolic rate of microorganisms, and taking into account that P was consumed during the process, the use of SH in AcoD seems essential, since this substrate is determinant in the supply of this nutrient, as presented in Table 2.
The amounts of VS, FS and TS in the feed mixture and in the digestate allowed to identify a removal efficiency of 35% of VS and 20% of TS (Table 5). Kafle et al. (2012) studied swine manure AD under mesophilic conditions, through batch tests and reported removals of 45 and 29% of VS and TS, respectively. Borowski and Kubacki (2015) concluded that AcoD of swine slaughterhouse wastes and sewage sludge in equal proportions, under mesophilic conditions, provided maximum removals of 62% of VS. So, the values reported by these authors are higher than the results obtained in this study, which indicates that the conditions used herein are less favorable to the anaerobic degradation of the solids present in the SS:SH mixture. This result can be related to different factors, such as the high applied organic load, low C/N ratio and ammonia accumulation, resulting in an inhibition of the anaerobic process and consequently in a low removal of solids.
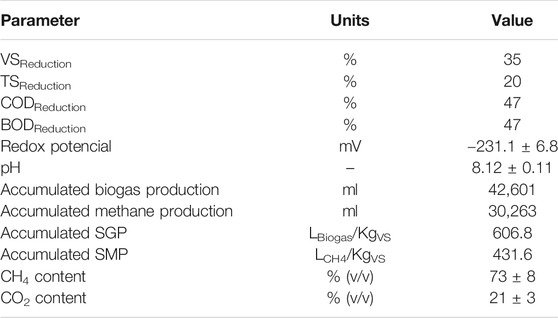
TABLE 5. Performances of the AcoD efficiency test.
The results related to the COD and BOD values allow to verify removal efficiencies of 47% (Table 5), and a BOD/COD ratio in the substrate and digestate of 0.8. Kafle and Kim (2012) obtained COD removals greater than 80% in the AcoD of apple wastes and swine manure, in laboratory tests with discontinuous regime and mesophilic conditions. Kalyuzhnyi et al. (1999) investigated the pre-treatment of the liquid fraction of different types of manure under mesophilic conditions on a laboratory scale and obtained a total COD reduction of 75% for SS. The COD removal efficiencies reported by these authors are higher than those achieved in the present study, which seems to support the already advanced hypothesis that there was a significant inhibition of the anaerobic process during the AcoD test. This conclusion is also supported by the BOD/COD ratio that expresses the sample's biodegradability. Values in the range between 0.50 and 0.60 indicate easy biological treatment, which isn’t the case, since during the test a ratio outside this range was found (0.80).
The amount of organic nitrogen (O-N) and the NH4-N/Kjeldahl-N ratio were determined from the concentrations of Kjeldahl-N and NH4-N present in the feed mixture and in the digestate. This ratio increased from 0.90 to 0.96 during the test, expressing the high concentration of proteins, and showing that the digestion of N resulted in an increase in the concentration of ammonia. According to Gashaw (2014), concentrations of NH4-N below 0.20 gN/L benefit the anaerobic process, since N is an essential nutrient for microorganisms, supplied in the form of ammonia or amino acids. Kafle and Kim (2012) report that, although NH4-N is responsible for maintaining alkalinity, when its concentration exceeds about 3.00 gN/L, activity in methanogenesis is inhibited. The literature reports that the inhibitory concentrations of NH4-N in the anaerobic process depend on different conditions, including the substrate, pH and temperature. The inhibitory effect increases with increasing pH, due to the release of free ammonia (Hassan et al., 2017). Edstrom et al. (2003) investigated the AcoD of different animal by-products with food wastes and animal manure on a laboratory scale and demonstrated that, under mesophilic conditions, these materials can be co-digested under stable conditions, up to NH4-N concentrations of 4.50–5.00 gN/L. Thus, the concentrations of NH4-N observed in this work were higher than the values reported by these authors (initial concentration of 5.60 ± 0.67 gN/L and final concentration of 5.00 ± 0.60 gN/L; Table 4), justifying the low removal efficiencies of VS, TS, COD and BOD obtained, corroborating with the indication of that the high concentration of ammonia, resulting from the excessive presence of N in the substrates, is liable to inhibit the AcoD process, as reported in the literature for this type of substrates.
Table 4 shows the concentrations of VOA, namely formic, acetic, propionic and butyric acids. As mentioned in the literature, it is observed that the concentration of formic acid during the test is reduced (<0.25 ± 0.05 g/L), demonstrating that it has no relevance to the process. Concentrations of acetic, propionic and butyric acid above 4.00 g/L, 1.00 g/L and 0.05 g/L, respectively, indicate a high probability of instability in the system (Drosg, 2013). According to Borowski and Kubacki (2015), propionic acid is considered the most important intermediate product in the anaerobic process of complex organic wastes, constituting one of the best indicators of a stable system. Despite the high initial concentration of acetic (7.25 ± 1.45 g/L) and butyric acid (2.61 ± 0.52 g/L), the concentration of these VOA is low at the end of the test, which demonstrates their consumption by microorganisms. In fact, the final concentration of acetic acid is significantly lower than the upper limit reported in the literature as an indicator of system instability (4.00 g/L), thus appearing that there is no accumulation of acetic acid during anaerobic digestion. As for butyric acid, despite having been consumed significantly during the process, its concentration seems to have always been higher than the concentration reported in the literature as an indicator of system instability (0.05 g/L) as this measure in the digestate indicated a value below 0.13 ± 0.03 g/L. The concentration of propionic acid increased by 38% during the test, indicating that the anaerobic process had a deficiency in the conversion of this acid. Borowski and Kubacki (2015) investigated the AcoD of swine slaughterhouse wastes with sewage sludge under mesophilic conditions, in laboratory, concluding that upon reaching concentrations of 2.00 g/L of propionic acid, biogas production may have been affected. These authors showed that the accumulation of propionic acid almost always leads to failure of anaerobic process, and this accumulation can also be related to the effect of free ammonia, which inhibits the propionate degradation. Since the concentration of propionic acid during the test is significantly higher than the value reported by these authors, and as the concentration of this acid is one of the best indicators of a stable system, it seems clear that the biological process must have been affected. According to Drosg (2013), an acetic/propionic acid ratio of less than 2.00 represents a high instability of the anaerobic process. At the beginning of the AcoD test, this ratio was very close to desirable, with a value of 1.95, however it suffered a continuous deterioration in relation to the stability limit, being 0.09 at the end of the test, due to the conversion inhibition of propionic acid. This result corroborates that SS:HS AcoD system didn’t run under optimal conditions.
According to Drosg (2013), methanogenic microorganisms need a strongly reducing environment, with a redox potential of less than −300 mV, in order for biogas production to be optimized. According to the redox potential values registered during the SS:HS AcoD assay, a average value of −231.1 ± 6.8 mV was obtained, thus revealing that the environment inside the anaerobic digester was not strongly reducing for the biogas production (Table 5).
This result may be related to the hydrolysis stage, in which the consumption of oxygen associated with facultative anaerobic bacteria allows to lower the redox potential to values adequate for the metabolism of methanogenic microorganisms to occur. In this step, the bacteria prefer pH values within the range of 5.50 and 6.50, which are significantly lower than those registered during this assay, probably as a consequence of the ammonia accumulation (Table 5 and Figure 6).
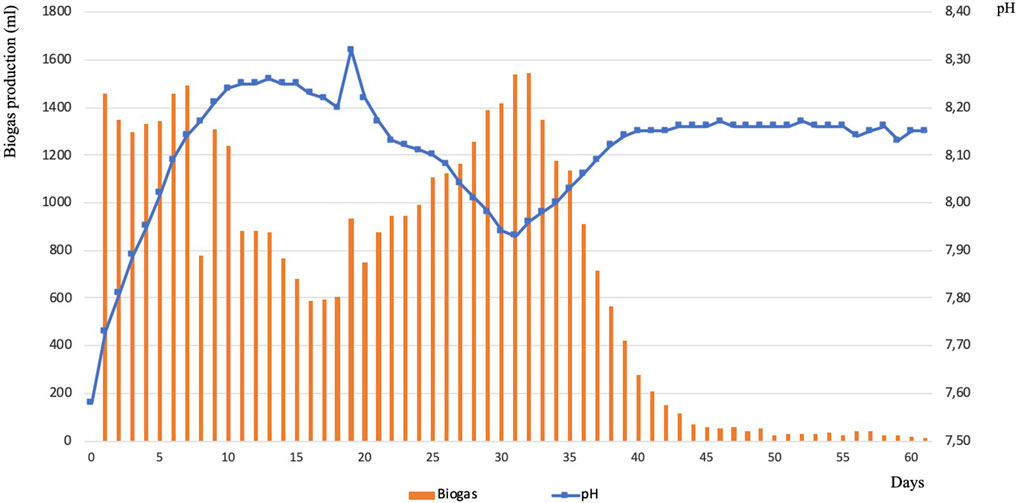
FIGURE 6. Relation between daily biogas production and pH.
Figure 6 shows the daily production of biogas obtained in AcoD and the relationship observed with the pH during the 61 days. During the first 7 days, a first peak in the biogas production occurs, with a stable production of approximately 1,400 ml/day. Throughout this period, the pH in the digester increases gradually, probably as a result of the ammonia accumulation, and from an approximate value of 8.15 the daily biogas production decreases significantly to values below 1,000 ml/day, which indicates the inhibition of the anaerobic process. The second peak in production occurs after the 25th day, with a daily increase in the biogas amount up to a maximum of 1,544 ml on the day 32. During this period, it is verified that the pH drops below 8.00, showing at this stage that there was less instability, probably due to factors related to the substrate or the adaptation of biomass to the environment. On day 33 and until the end of the test, the daily biogas production decreases, ceasing to be significant from day 40; at this stage, the pH tends to stabilize between 8.10 and 8.20. During the AcoD test, an average pH value of 8.12 ± 0.11 was obtained. (Table 5).
Parajuli (2011) mentions that in a mesophilic regime, a pH value of 7.50 corresponds to a concentration of free ammonia of 5% relative to the ammonium ion. Moreover, according to this author ammonia in free form is more toxic to methanogenic microorganisms than ammonium ion. With the increase in pH to values close to 8.00, this concentration of free ammonia doubles, which would justify the deficient degradation of the propionate obtained in the AcoD test, resulting in a very toxic environment for microorganisms. Therefore, the data present in Figure 6 seem to support the conclusions reported by this author, because when the pH values in the test were higher than 8.00, the biogas production was affected. This result is generally consistent with the literature that supports the serious impact of pH on methanogenic and acidogenic microorganisms, being a very important indicator to assess the stability of anaerobic systems.
During the process, there was a total CH4 production of 30263 ml, in a total of 42601 ml of biogas (Table 5). Tian et al. (2015) concluded that AcoD of SS and food wastes in equal proportions, carried out through batch tests and in mesophilic conditions, provided a CH4 concentration in the biogas of 63% (v/v). Kirby et al. (2018) investigated the potential of AcoD using swine carcasses with beet pulp as an additional C source and they demonstrated that swine carcasses can be digested at 35°C, producing large amounts of biogas, with CH4 concentrations ranging from 40.3 to 67.5% (v/v). The results obtained in this research are higher than the values cited by these authors, observing an average of CH4 concentration of 73 ± 8% (v/v) and an average of CO2 concentration of 21 ± 3% (v/v) in the biogas produced (Table 5). This result shows that the AcoD of SS and SH allows the biogas production with a high CH4 concentration. However, the high protein content of the two substrates causes a significant inhibition of the digestion process due to the ammonia concentration, limiting the overall biogas production.
Figure 7 shows the accumulated production of biogas and methane, measured as the yield of production in relation to the VS added to the digester. The production yield in the AcoD test was 606.8 LBiogas/kgVS and 431.6 LCH4/kgVS, with about 1/3 of the accumulated biogas production occurring in the first 10 days, namely 200 LBiogas/kgVS. After a slowdown by half in the following period, on the day 20, the yield increases again, presenting productions of around 150 LBiogas/kgVS every 10 days. As of the day 40, production stabilizes, with a very low biogas production until the end of the test.
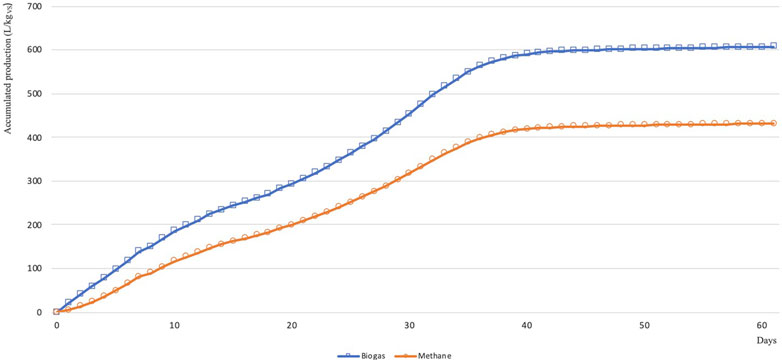
FIGURE 7. Yield of biogas and methane production.
Nagy and Wopera (2012) reported a specific production between 300 and 550 LBiogas/kgVS, in SS monodigestion. Tian et al. (2015) concluded that the SS monodigestion provided a yield of 407 LBiogas/kgVS and 248 LCH4/kgVS. Thus, and despite the low efficiency of the anaerobic process, the biogas and CH4 production in SS:HS AcoD was superior to the values referred in the literature for SS monodigestion, probably due to an AcoD that enabled a better balance of nutrients.
The present research aimed to evaluate the AcoD feasibility of SS with SH, two residual flows from swine farms, as an effective method of management and recovery of SH. Thus, a laboratory study was developed to identify the proportion of the two substrates that results in the greatest biogas production; to evaluate the effect of sterilization as thermal pre-treatment of the substrates; and to determine AcoD efficiency.
The preliminary tests allowed to validate the high potential of SH as a co-substrate for biogas production as the largest volume of accumulated biogas was obtained in AcoD with a proportion of 90.9% SS:9.1% SH (v/v). In fact, the biogas production was higher than that obtained in the SS monodigestion, as long as the mixture of the two substrates didn’t exceed 27.3% (v/v) of SH. The sterilization step didn’t constitute an effective thermal pre-treatment since the extent of the anaerobic degradation reaction when a I/S ratio of 57.1% (v/v) was used was identical to that which occurred with the non-sterile substrate, observing only a delay in the development of the process. The lower I/S ratio (22.2%, v/v) didn’t allow an active microbiological community to initiate the biological reaction so no biogas production occurred.
The largest scale AcoD test was carried out with the 90.9% SS:9.1% SH (v/v) mixture, which resulted in an organic load applied to the digester of 26.00 gVS/L. Biogas production ended 61 days after the start of the test, and as referred by Tian et al. (2015), the high amounts of N present in these substrates affected the anaerobic process negatively due to the inhibitory effect of the ammonia accumulation and the consequent pH increase in the digester. According to Parajuli (2011), the present work revealed that with the pH increase, the concentration of free ammonia led to a toxic environment for the microorganisms, justifying the deficient degradation of propionate. However, the biogas and CH4 production was higher than the values obtained by Tian et al. (2015) for the SS monodigestion, indicating that the AcoD of SS and SH allowed to obtain a better balance of nutrients, namely P and S.
In conclusion, compared to the SS monodigestion, the AcoD of SS and SH constitutes an interesting alternative in terms of the biogas production yield, thus configuring an efficient way of managing these residual flows. Although an optimal result was obtained with 9.1% SH, it was concluded that SH can be co-digested with SS in a range from 9.1 to 27.3% SH. Since the availability of SH on a farm is much lower than the volumes of SS generated, these results validate the use of SH as a co-substrate, allowing an adequate management of the two residues through the AcoD process. However, the introduction of yet another carbon-rich co-substrate, which would allow to increase the C/N ratio, could make the anaerobic process more efficient and increase the yield of biogas production. In any case, AcoD may present itself as a technology with the potential for decentralized biogas production, reducing the volume of residual flows to be exported from swine farms, reducing odors, stabilizing wastes and reducing treatment costs.
The original contributions presented in the study are included in the article/Supplementary Material, further inquiries can be directed to the corresponding author.
PD made the research, planned and carried out the experiments, processed the experimental data and contributed to the data interpretation, and wrote the manuscript with support from HP and NO.
This work was financially supported by: Base Funding—UIDB/50020/2020 of the Associate Laboratory LSRE-LCM—funded by national funds through FCT/MCTES (PIDDAC).
The authors declare that the research was conducted in the absence of any commercial or financial relationships that could be construed as a potential conflict of interest.
Abbasi, T., Tauseef, S. M., and Abbasi, S. A. (2012). Anaerobic Digestion for Global Warming Control and Energy Generation-An Overview. Renew. Sustainable Energ. Rev. 16, 3228–3242. doi:10.1016/j.rser.2012.02.046
Armah, E., Armah, T., and Armah, T. (2017). Biogas Production from Anaerobic Digestion-A Systematic Review. Ijar 5, 495–505. doi:10.21474/ijar01/5795
Baweja, M., Baredar, P., and Lal, R. R. (2018). Parametric Evaluation of Bio-Digestion Process-A Review. Ajee 6, 6–8. doi:10.11648/j.ajee.20180601.12
Borowski, S., and Kubacki, P. (2015). Co-digestion of Pig Slaughterhouse Waste with Sewage Sludge. Waste Management 40, 119–126. doi:10.1016/j.wasman.2015.03.021
Carrere, H., Antonopoulou, G., Affes, R., Passos, F., Battimelli, A., Lyberatos, G., et al. (2015). Review of Feedstock Pretreatment Strategies for Improved Anaerobic Digestion: From Lab-Scale Research to Full-Scale Application. Bioresour. Technology 199, 386–397. doi:10.1016/j.biortech.2015.09.007
Deublein, D., and Steinhauser, A. (2008). Biogas from Waste and Renewable Resources. Weinheim: Wiley VCH Verlag GmbH & Co. KGaA, 57–81.
DGAV - Direção-Geral de Alimentação e Veterinária (2020). Número de Animais e Explorações/Detentores - Portugal.
Edström, M., Nordberg, Å., and Thyselius, L. (2003). “Anaerobic Treatment of Animal Byproducts from Slaughterhouses at Laboratory and Pilot Scale,” in Applied Biochemistry and Biotechnology. Humana Press, 128. doi:10.1385/abab:109:1-3:127
Ferreira, L. J. (2014). Reciclagem descentralizada de resíduos orgânicos industriais através do processo de codigestão anaeróbia com chorumes de suinicultura. Lisboa: ISA. 180, 149.
Eurpean Commission (2009). Regulation (EC) No. 1069/2009 of the European Parliament and the Council of 2009. October 2009. Laying Down Health Rules as Regards Animal By-Products and Derived Products Not Intended for Human Consumption, in Official Journal, 1–33.
Gashaw, A. (2014). Anaerobic Co-digestion of Biodegradable Municipal Solid Waste with Human Excreta for Biogas Production: A Review. Ajac 2, 55–61. doi:10.11648/j.ajac.20140204.12
Hakawati, R., Smyth, B. M., McCullough, G., Rosa, F. D., and Rooney, D. (2017). What Is the Most Energy Efficient Route for Biogas Utilization: Heat, Electricity or Transport? Appl. Energ. 206, 1076–1087. doi:10.1016/j.apenergy.2017.08.068
Hassan, M., Ding, W., Umar, M., and Rasool, G. (2017). Batch and Semi-continuous Anaerobic Co-digestion of Goose Manure with Alkali Solubilized Wheat Straw: A Case of Carbon to Nitrogen Ratio and Organic Loading Rate Regression Optimization. Bioresour. Technology 230, 24–32. doi:10.1016/j.biortech.2017.01.025
Kadam, R., and Panwar, N. L. (2017). Recent Advancement in Biogas Enrichment and its Applications. Renew. Sustainable Energ. Rev. 73, 892–903. doi:10.1016/j.rser.2017.01.167
Kafle, G. K., and Kim, S. H. (2012). Anaerobic Treatment of Apple Waste with Swine Manure for Biogas Production: Batch and Continuous Operation. Appl. Energ. 103, 61–64. doi:10.1016/j.apenergy.2012.10.018
Kafle, G. K., Kim, S. H., and Sung, K. I. (2012). Batch Anaerobic Co-digestion of Kimchi Factory Waste Silage and Swine Manure under Mesophilic Conditions. Bioresour. Technology 124, 489–494. doi:10.1016/j.biortech.2012.08.066
Kalyuzhnyi, S., Sklyar, V., Fedorovich, V., Kovalev, A., Nozhevnikova, A., and Klapwijk, A. (1999). The Development of Biological Methods for Utilisation and Treatment of Diluted Manure Streams. Editor Water Science and Technology, 223–229. doi:10.1016/S0273-1223(99)00388-1
Khan, I. U., Othman, M. H., Hashim, H., Matsuura, T., Ismail, A., Rezaei-DashtArzhandi, M., et al. (2017). Biogas as a Renewable Energy Fuel – A Review of Biogas Upgrading, Utilisation and Storage. Energ. Convers. Management 150, 277–291. doi:10.1016/j.enconman.2017.08.035
Kirby, M. E., Theodorou, M. K., Brizuela, C. M., Huntington, J. A., Powles, J., and Wilkinson, R. G. (2018). The Anaerobic Digestion of Pig Carcase with or without Sugar Beet Pulp, as a Novel On-Farm Disposal Method. Editor Waste Management Elsevier, 1–2. doi:10.1016/j.wasman.2018.02.022
Mehariya, S., Patel, A. K., Obulisamy, P. K., Punniyakotti, E., and Wong, J. W. C. (2018). Co-digestion of Food Waste and Sewage Sludge for Methane Production: Current Status and Perspective. Bioresour. Technology, 265, 519–531. doi:10.1016/j.biortech.2018.04.030
Nagy, G., and Wopera, Á. (2012). Biogas Production from Pig Slurry – Feasibility and Challenges. Mater. Sci. Eng. 37 (2), 65–75.
Nasir, I. M., Mohd Ghazi, T. I., and Omar, R. (2012). Anaerobic Digestion Technology in Livestock Manure Treatment for Biogas Production: A Review. Eng. Life Sci. 12, 258–269. doi:10.1002/elsc.201100150
Neshat, S. A., Mohammadi, M., Najafpour, G. D., and Lahijani, P. (2017). “Anaerobic Co-digestion of Animal Manures and Lignocellulosic Residues as a Potent Approach for Sustainable Biogas Production”, in Renewable and Sustainable Energy Reviews Elsevier, 79 (C), 308–322.
Niyonsaba, O. (2014). Effect of Substrate Improvement on Optimizing Biogas Yield from Anaerobic Digestion, Master's thesis. University of Agder.
Nizami, A.-S., Saville, B. A., and MacLean, H. L. (2013). “Part III - Anaerobic Digestion Technology,” in Chapter 9 - Anaerobic Digesters - Perspectives and Challenges. Bioenergy Production by Anaerobic Digestion, Using Agricultural Biomass and Organic Wastes. New York: Earthscan, 139–147.
Parajuli, P. (2011). Biogas Measurement Techniques and the Associated Errors. University of Jyväskylä. 38, 6–7.
Rashama, C., Ijoma, G., and Matambo, T. (2019). Biogas Generation from By-Products of Edible Oil Processing: A Review of Opportunities, Challenges and Strategies. Biomass Conversion and Biorefinery 9. doi:10.1007/s13399-019-00385-6
Samun, I., Saeed, R., Abbas, M., Rehan, M., Nizami, A.-S., and Asam, Z.-u.-Z. (2017). Assessment of Bioenergy Production from Solid Waste. Elsevier 142, 656. doi:10.1016/j.egypro.2017.12.108
Siddique, M. N. I., and Wahid, Z. A. (2018). Achievements and Perspectives of Anaerobic Co-digestion: A Review. J. Clean. Prod. 194, 359–371. doi:10.1016/j.jclepro.2018.05.155
Tian, H., Duan, N., Lin, C., Li, X., and Zhong, M. (2015). Anaerobic Co-digestion of Kitchen Waste and Pig Manure with Different Mixing Ratios. J. Biosci. Bioeng. 120, 51–57. doi:10.1016/j.jbiosc.2014.11.017
Keywords: anaerobic process, swine farms, residual flows, biogas, hydrolysis process
Citation: Domingues PS, Pala H and Oliveira NS (2021) Anaerobic Mesophilic Co-Digestion of Swine Slurry and Hidrolyzate in Batch Reactors: A Case Study. Front. Environ. Sci. 9:684074. doi: 10.3389/fenvs.2021.684074
Received: 22 March 2021; Accepted: 25 May 2021;
Published: 10 June 2021.
Edited by:
Ariana Pintor, University of Porto, PortugalReviewed by:
Elizabeth Almeida Duarte, University of Lisbon, PortugalCopyright © 2021 Domingues, Pala and Oliveira. This is an open-access article distributed under the terms of the Creative Commons Attribution License (CC BY). The use, distribution or reproduction in other forums is permitted, provided the original author(s) and the copyright owner(s) are credited and that the original publication in this journal is cited, in accordance with accepted academic practice. No use, distribution or reproduction is permitted which does not comply with these terms.
*Correspondence: Paulo S. Domingues, cHNpbWFvZG9taW5ndWVzQGhvdG1haWwuY29t
Disclaimer: All claims expressed in this article are solely those of the authors and do not necessarily represent those of their affiliated organizations, or those of the publisher, the editors and the reviewers. Any product that may be evaluated in this article or claim that may be made by its manufacturer is not guaranteed or endorsed by the publisher.
Research integrity at Frontiers
Learn more about the work of our research integrity team to safeguard the quality of each article we publish.