 Jacinto Elías Sedeño-Díaz
 Eugenia López-López
- 1Coordinación Politécnica para la Sustentabilidad, Instituto Politécnico Nacional, Ciudad de México, Mexico
- 2Laboratorio de Evaluación de la Salud de los Ecosistemas Acuáticos, Escuela Nacional de Ciencias Biológicas, Instituto Politécnico Nacional, Ciudad de México, Mexico
The Tehuacán-Cuicatlán Biosphere Reserve, Mexico (TCBR) is the southernmost arid or semi-arid zone with the highest biodiversity in North America and is a UNESCO World Heritage site. Two main hydrographic streams cross the TCBR, the Salado River (an endogenous river) and the Grande River (an exogenous river). This study investigated temperature anomalies over the past 40 years. We analyzed potential differences between sub-basins and riparian areas on both streams using various indices, namely the Global Warming Index (GWI), Normalized Difference Vegetation Index (NDVI), Normalized Difference Water Index (NDWI), and Normalized Difference Drought Index (NDDI), and analyzed the potential relationship of these indices with climate change. Time series of satellite-based precipitation (June 2000–December 2020) and air temperature (January 1980–December 2020) were analyzed. A set of Landsat 8 OLI TIRS imagery from the driest and wettest months (2013–2020) was used to estimate NDVI, NDWI, and NDDI. These indices were evaluated separately for the sub-basins and river corridors in the dry and rainy seasons. The precipitation records indicate that in the Grande river sub-basin, precipitation is higher than in the Salado river sub basin. Normalized temperature anomalies and the GWI suggest a warming trend from 1994 to 2020, increasing up to 0.86°C in the Salado River and 0.52°C in the Grande River. The Grande and Salado sub basins showed significant differences between dry and wet seasons for each index (NDVI, NDWI, and NDDI). A Discriminant Analysis showed that the Salado sub-basin and the Salado River corridor are associated with severe drying conditions in the dry season (highest NDDI values). In the wet season, the Grande River corridor showed intermediate values of NDVI and NDWI but low values of NDDI. The Grande River corridor in the dry season was characterized by intermediate values of NDVI, NDWI, and NDDI. These river corridors provide environmental services in a trade-off with the stream and should be considered biodiversity hotspots. Due to the accentuated warming trend and the lowest precipitation, the Salado River sub-basin showed desertification signs associated with climate change. Both the Salado and the Grande River corridors showed resilience strategies to face climatic conditions.
Introduction
Drylands are a concept that applies to the vast hyper-arid, arid, semi-arid, and dry-sub-humid environments of the Earth, covering about 40–50 percent of the Earth’s land surface (Tooth, 2000; Safriel and Zafar, 2005). These are defined as regions where the annual potential evapotranspiration greatly exceeds annual precipitation, showing an aridity index lower than 0.65 (Tooth, 2013; FAO, 2016; Huang et al., 2017). These drylands are characterized by great water scarcity, low humidity, high solar radiation, and sparse, unevenly distributed, or temporally variable vegetation cover (Tooth, 2000; Tooth, 2013), are highly vulnerable to climatic variations, particularly to climate change (Tietjen et al., 2017; Zhang et al., 2020). Despite the above, many warm drylands support numerous river systems (Tooth, 2013).
Rivers are usually perennial, albeit with a variable flow, and are major landscape features, many of them being hundreds or thousands of kilometers long and commonly traversing drylands as part of exorheic systems. In drylands, rivers can be classified as exogenous or exogenic systems when they originate outside the arid zone, while endogenous (or endogenic) rivers originate within the dryland zone. Endogenous rivers generally have an intermittent flow, with channels remaining typically dry and only occasionally transporting water and sediments (Tooth, 2000); they can be perennial in some cases. Both types of rivers run across drylands, providing different attributes and environmental services to dryland sub-basins. Such environmental services include riparian areas, which contain microclimates that are significantly cooler and more humid than immediately adjacent areas (Krosby et al., 2018). Nevertheless, river corridors may differ between exogenous and endogenous rivers.
Vegetation and fluvial processes in dryland river channels have received relatively little attention (Sandercock et al., 2007). Global warming has fostered the scientific interest in drylands, particularly to study rivers in these areas (Huang et al., 2017; Zhang et al., 2020), focusing on different spatial and temporal scales and using different methodological approaches. Vegetation plays a key role in drylands because it provides multiple environmental services, including habitats for biodiversity, mitigation of water and wind erosion and desertification, promotion of water infiltration into soil, and increase in soil fertility. Also, vegetation contributes to increasing the resilience of landscapes and communities facing global change (FAO, 2016). In semi-arid and arid regions, the distribution and abundance of vegetation largely depend on water availability; this is particularly evident along river banks. Dryland riparian areas are complex ecosystems in transitional zones between aquatic and dry terrestrial ecosystems, acting like ecological corridors that support and transport biota (Fernandes et al., 2012), contributing to regional species richness, and regulating interactions with lotic systems (Pinay et al., 1990; Krosby et al., 2018). Thus, these areas are linear oases that serve as wet spots in dryland regions (Camporeale et al., 2019). Rivers provide humidity and nutrients to riparian vegetation, create green strips along riverbanks, and transport seeds and propagules downstream. In contrast, vegetation acts as a sediment sink, retains soil (Powell, 2009), regulates biogeochemical reactions, increases the biological roughness that facilitates the dissipation of water energy, promotes habitat heterogeneity, and improves the water quality (Harvey and Gooseff 2015; Harvey et al., 2018), among other essential functions. These aspects should be considered a trade-off between rivers and riparian vegetation, strengthening river connectivity. Monitoring river corridors is essential to 1) understand the associated processes, 2) evaluate the nature of evolving hazards, 3) maintain ecological sustainability, and 4) preserve their integrity as a resource for future generations (Tomsett and Leyland, 2019). Therefore, river corridors are highly important in several processes within drylands. Our analysis addresses key questions about river corridors associated with dryland rivers: do fluvial corridors play a similar role in exogenic and endogenic dryland rivers? Is global warming affecting fluvial corridors functions in dryland rivers?
Remote sensing has become a central tool in hydrological research, climate change (Cui et al., 2019), and drought analysis (AghaKouchak et al., 2015). It includes a wide range of techniques and methods to acquire data about spatial objects (e.g., a river corridor and its associated features) and phenomena (river processes, climate change) with no physical contact (Piegay et al., 2020). Remote sensing methods allow identifying landscape features over spatial and temporal scales by integrating time series, offering a perspective of landscapes at a sub-basin level. One approach consists of using vegetation, water, and drought indices such as the Normalized Difference Vegetation Index (NDVI), Normalized Difference Water Index (NDWI), and Normalized Difference Drought Index (NDDI), which provide information about the vigor and photosynthetic capacity of the vegetation canopy, water content in vegetation, and drought conditions, respectively (Gu et al., 2007). Through these methods and geographic information systems (GIS), we can explore the influence of river corridors on areas adjacent to watercourses, which play a central role in arid and semi-arid zones.
This research focuses on the Tehuacán Cuicatlán Biosphere Reserve in Mexico (TCBR). This reserve is part of the Mesoamerican region, considered the southernmost arid or semi-arid zone of the highest biodiversity in North America, designated as a world heritage by UNESCO (2016). Two sub-basins converge in this reserve: the Salado River sub-basin (S), an endogenous river flowing from northwest to southeast. The second, the Grande River sub-basin (G), is an exogenous river that flows from southeast to northwest. The main channels of both sub-basins converge to give rise to the Santo Domingo River; downstream, this river becomes the Papaloapan River, which discharges in the Gulf of Mexico. Like many endogenous dryland rivers, the Salado River is characterized by intermittent flows in its head river and a perennial flow at its middle and lower reaches. In contrast, the Grande River has a perennial flow at all times. Therefore, the TCBR includes both river categories—endogenous and exogenous —, a condition that contributes to its heterogeneity.
There are significant differences in water quality between both sub-basins, including conductivity, salinity, total hardness, and sulfate content; the Salado River shows the highest values of these variables (Lopez-Lopez et al., 2019). We hypothesize that there must be dissimilarities between endogenous and exogenous rivers at the sub-basin level; however, river corridors should have similar functions, with similar NDVI values but due to dry season and effects of climate change, different NDDI.
This study explores differences in the riverbanks of the Salado and Grande rivers, to investigate the role of intermittent or perennial flows on the maintenance and health status of the respective river corridors through several remote sensing methods and GIS, including the application of normalized difference indices such as NDVI, NDWI, and NDDI. Also, we looked for precipitation and temperature trends over the past 20 and 40 years, respectively, and analyzed the potential relationship of these indices with climate change.
Materials and Methods
Study Area
The Tehuacán-Cuicatlán Biosphere Reserve is located in the central southeast area of Mexico. The Salado and Grande River sub-basins are the most important hydrological systems in the TCBR (Lopez-Lopez et al., 2019). The Salado River sub-basin has an extension of 6,464 km2 and is an intermittent stream. Its headwater is located in Sierra Negra, a mountain range that is part of Sierra Madre del Sur, located within an arid zone. The Grande River sub-basin originates in Sierra de Juárez, a mountain range outside the arid zone and the TCBR. This sub-basin comprises an area of 4,944.7 km2 (Figure 1A). The dominant climates across the area are warm, semi dry (BS) to very dry arid desert (BW), which comprise 73.5% of the area (Figure 1B) (Lopez-Lopez et al., 2019; Garcia, 2004).
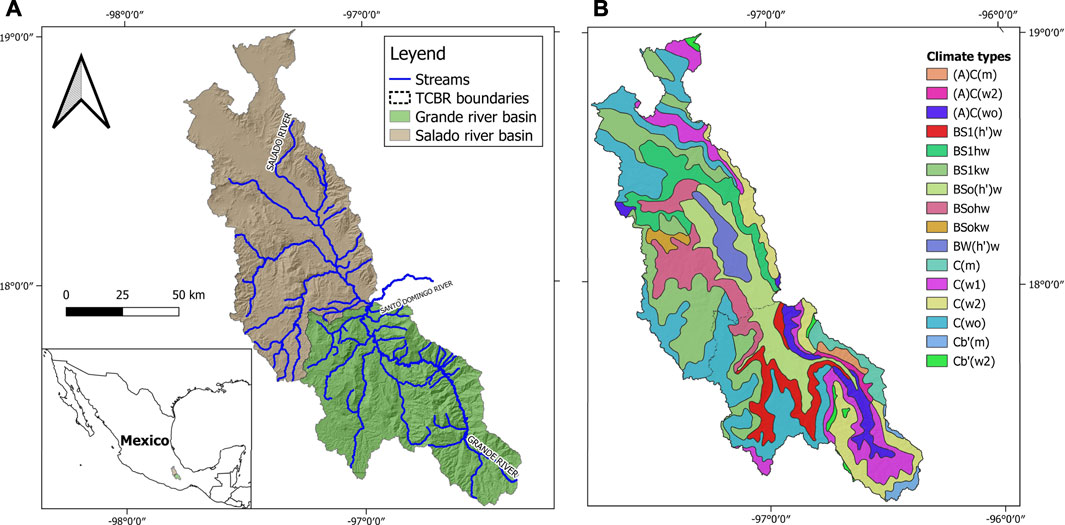
FIGURE 1. (A) Location of the study area, (B) Predominant climate types in the Grande and Salado sub-basins based on García (2004).
The TCBR includes a wide variety of vegetation types. It is considered one of the main diversification centers for the cacti family (Davila et al., 2002; UNESCO, 2018), which includes well-known threatened species worldwide, and is also the habitat of plants such as agaves, yuccas, bromeliads, Bursera spp., and oaks, all of which exhibit a high diversity. The dominant vegetation type is the deciduous tropical forest, being widespread across the Grande River sub-basin. The second most abundant vegetation type is the xeric shrubland, and the TCBR harbors the highest density of columnar cacti, with up to 1800 individuals per hectare. Besides, it is home to one of the highest animal biodiversity levels in drylands for amphibians, reptiles, and birds (CONANP, 2013; UNESCO, 2016).
Data Acquisition
A dataset was acquired for each sub-basin. We obtained time series of satellite-based precipitation and air temperature data from NASA Giovanni Services (2020). These include monthly mean data from June 01, 2000 to October 31, 2020 for precipitation data (Huffman et al., 2019), and from January 01, 1980 to December 31, 2020 for air temperature data. The precipitation dataset allowed identifying the months with the lowest and highest mean precipitation, as well as which sub basin have the highest precipitation values. We obtained the Landsat 8 OLI TIRS imagery sets from the USGS Global Visualization Viewer (GloVis, US Geological Service 2020) to cover the study area. Three scenes were required to cover the Salado and the Grande sub-basins, which were mosaicked. Images from the driest and wettest months within the 2013 to 2020 period were considered. All images met the criteria of 0–15% cloudiness. The Landsat 8 mission was launched in March 2013; therefore, the data analyzed in this study encompasses from the 2013 rainy season to the 2020 dry season. All images were subjected to atmospheric correction. Vector layers from streams (lines) and sub-basins (polygon) were obtained from INEGI (2020). All spatial analyses were performed using QGIS software V. 3.16 Hanover.
Temperature Anomalies Detection and Indices Calculation
The air temperature baseline in each sub-basin was constructed from the air temperature time series to compute the temperature-standardized anomaly and detect differences and trends. Standardized temperature anomalies, also called normalized temperature anomalies, frequently offer more in-depth information about the magnitude of the anomaly because it removes the bias from dispersion data (Grum and Hart, 2001). The baseline took into account the mean annual value from 1980 to 2010 for each sub-basin. The Global Warming Index was calculated from thermal anomalies to identify trends in terms of global warming, using the following equation (de Andalucia, 2018):
where GWI = Global Warming Index, MAi = Normalized Mean Anomaly in year i, MAI = Mean Accumulated Increment, calculated through:
where MAi−1 is the mean anomaly of the previous year.
The assessment of NDVI and NDWI used bands 3, 4, and 7 (Green, Red, and Swir, respectively) from Landsat 8 OLI TIRS images, consistent with Tarpley et al. (1984), Gao (1996), and Xu (2006), respectively, using the following equations:
where NDVI = Normalized Differential Vegetation Index, NDWI = Normalized Differential Water Index; B3, B4, B5, and Swir are the respective bands of the Landsat 8 OLI TIRS satellite mission.
NDVI and NDWI images were sequentially stacked into two time series spanning 7 years (2013–2020), one for the dry season and the other for the wet season, for each index. From the NDVI and NDWI stacked files, the mean profile for each index was derived.
The Normalized Difference Drought Index (NDDI) was calculated following Gu et al. (2007) using the following equation:
The river corridor vector layer for all streams was obtained for each sub-basin with four buffer widths: 50, 100, 200, and 400 m.
The polygon vector layers for each sub-basin were clipped against its respective river corridor buffer. Thus, we obtained the sub-basin layer without the river corridor and the river corridor layer isolated. Stacked files for NDVI and NDWI were clipped against both layers (sub-basin and river corridor) to obtain each index.
Data Analysis
The time series for precipitation and temperature were tested with a Mann Kendall test to identify the trends in their respective periods. Also, the Mann Kendall test was applied to air temperature anomalies to contrast with the Global Warming Index in each sub-basin.
Data for spectral indices from each sub-basin were analyzed with and without river corridors for the dry and wet seasons; the same was done for river corridors in each sub-basin. The periods analyzed were the dry seasons from 2014 to 2020 and the wet seasons from 2013 to 2019. Differences between river corridors width for each index were explored through a Kruskal Wallis analysis because the data did not fit a normal distribution. After selecting the appropriate river corridor width, a Kruskal Wallis analysis was applied to identify differences between different categories of each index. A Discriminant Analysis was performed to identify similarities or differences between river corridors and their sub-basins and seasons based on NDWI, NDVI, and NDDI values.
Results
Differences in Precipitation
The annual cycles of precipitation in RBTC show well-defined wet and dry seasons, being dry season from November to May, and wet season from June to October; the wet season is bimodal, with the first peak mode in June-July, and the second in September (Figure 2). The Salado River sub-basin has annual mean precipitation (83.99 mm) lower than the Grande River sub-basin (129.29 mm) in the period 1983 to 2020. In both sub-basins, February was identified as the driest month, while June and September were the wettest months. The Salado River sub-basin has annual mean precipitation ranging from 17.76 mm in February to 180.77 mm in June, and the Grande River sub-basin, from 31.12 mm in February to 273.45 mm in September (Figure 2). The analysis of the time series for Salado and Grande river sub-basins do not show a tendency to increase or decrease precipitation values (Mann Kendall test, Grande river sub-basin: Tau = −0.067, p = 0.138, Slope of Sen = −0.094, Salado river sub-basin: Tau = −0.013, p < 0.0001, Sen slope = −0.022). The pattern of precipitation during the remote sensing study period (2013–2020) is shown in Figure 3, where the Salado river sub basin shows lower precipitation than the Grande river sub basin, mainly on rainy season (June to October), since records of precipitation during dry season are similar to both sub basins.
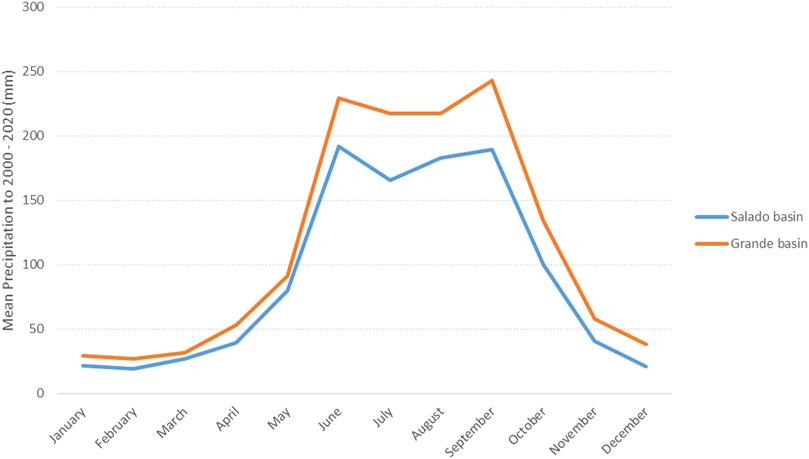
FIGURE 2. Mean monthly precipitation in the Grande and the Salado sub-basins in the 2000–2020 period.
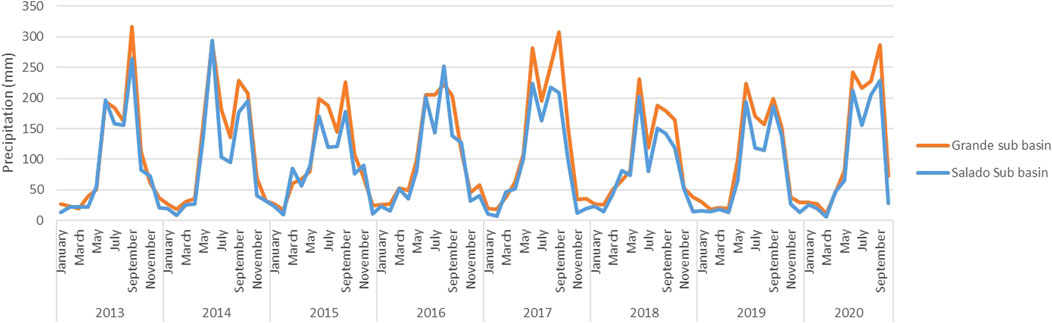
FIGURE 3. Record of precipitation in Salado and Grande sub basins during the remote sensing study period.
Temperature Anomalies
The Normalized Temperature Anomalies suggest a warming trend from 1994 to 2020 in both sub-basins, with positive values up to 0.61°C in the Salado River sub-basin and 0.45°C in the Grande River sub-basin in 2019 (Figure 4). In 2020, the GWI showed a 0.86°C increase versus baseline in the Salado River sub-basin (Figure 4A), while in the Grande River sub-basin, this difference was 0.52°C versus baseline (Figure 4B). In addition, the trend line showed a different slope for each sub-basin, denoting faster warming in the Salado River sub-basin than in the Grande River sub-basin.
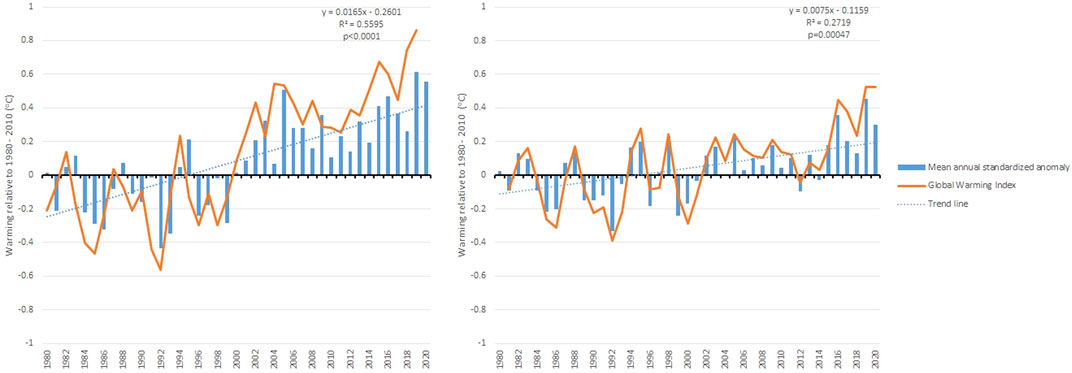
FIGURE 4. Mean annual temperature anomaly and mean annual temperature rise for (A) the Salado River sub-basin and (B) the Grande River sub-basin.
The Mann-Kendall test was applied to temperature times series in order to identify whether there is a trend in this time series. Results indicate that there is a trend with a Sens’s slope of 0.022 (Tau of Kendall = 0.225, p < 0.0001) to the Grande river sub basin, and 0.045 in the case of the Salado river sub basin (Tau of Kendall = 0.374, p < 0.0001). Therefore, the trend to warming up identified through, thermic anomalies analysis and Global Warming Index is confirmed. Since the Sens`s slope is slightly higher in the Salado river compared to the Grande river, the Salado river basin is experiencing a slightly faster warm-up.
NDVI, NDWI, and NDDI
For NDVI, NDWI, and NDDI, no significant differences were found between the width of river corridors (50, 100, 200, and 400 m) (p > 0.05), and no significant differences were found between the years studied either. However, differences between seasons were detected. Thus, the subsequent analysis focused on a 50 m river corridor width. Since NDVI, NDWI, and NDDI are normalized indices, comparisons with other regions are feasible. Thus, the rule to apply these indices is that values close to 1 indicate the best condition, and values close to zero indicate the worst condition. Although the Salado and Grande River sub-basins belong to dryland categories, including bare soil areas, mean NDVI values were positive for both sub-basins, indicating the presence of vegetation. Mean NDVI values ranged from 0.45 (dry season) to 0.56 (wet season) in the Grande River sub-basin, from 0.43 (dry season) to 0.55 (wet season) in the Grande River corridor, from 0.28 (dry season) to 0.43 (wet season) in the Salado River sub-basin, and from 0.28 (dry season) to 0.31 (wet season) in the Salado River corridor (Figure 5).
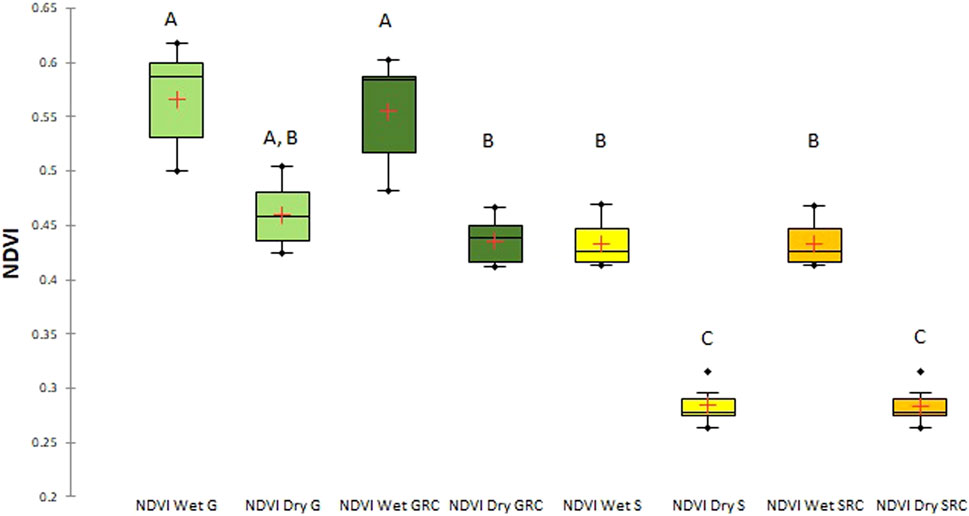
FIGURE 5. Box-and-whisker plot for NDVI values for the Grande River sub-basin (G), Grande River corridor (GRC), Salado River sub-basin (S), and Salado River corridor (SRC), in the wet and dry seasons. Different letters denote significant differences (p < 0.05).
NDVI values for the Salado River sub-basin and its corridor in the dry season showed significant differences (p < 0.05) with Grande River and its corridor in wet and dry seasons, and with Salado River sub-basin and its corridor in the wet season; being twice smaller than both the Grande River sub-basin and its corridor in the wet season. NDVI values for the Grande River sub-basin and its corridor during the dry season are similar to values for the Salado River and its corridor during the wet season.
The map of NDVI values and infrared spectral band combinations (5-4-3) for scenes of the Grande and the Salado Rivers are shown in Figure 6. Both images highlight vegetation cover. The Grande River has a more uniform vegetation cover on the river corridor in the wet and dry seasons. In contrast, the Salado River has a fragmented river corridor during the dry season. The Salado River shows no vegetation cover in areas far from the river channel in the dry season and a more uniform vegetation cover during the rainy season. Therefore, differences between endogenous and exogenous river sub-basins are evident at the landscape level.
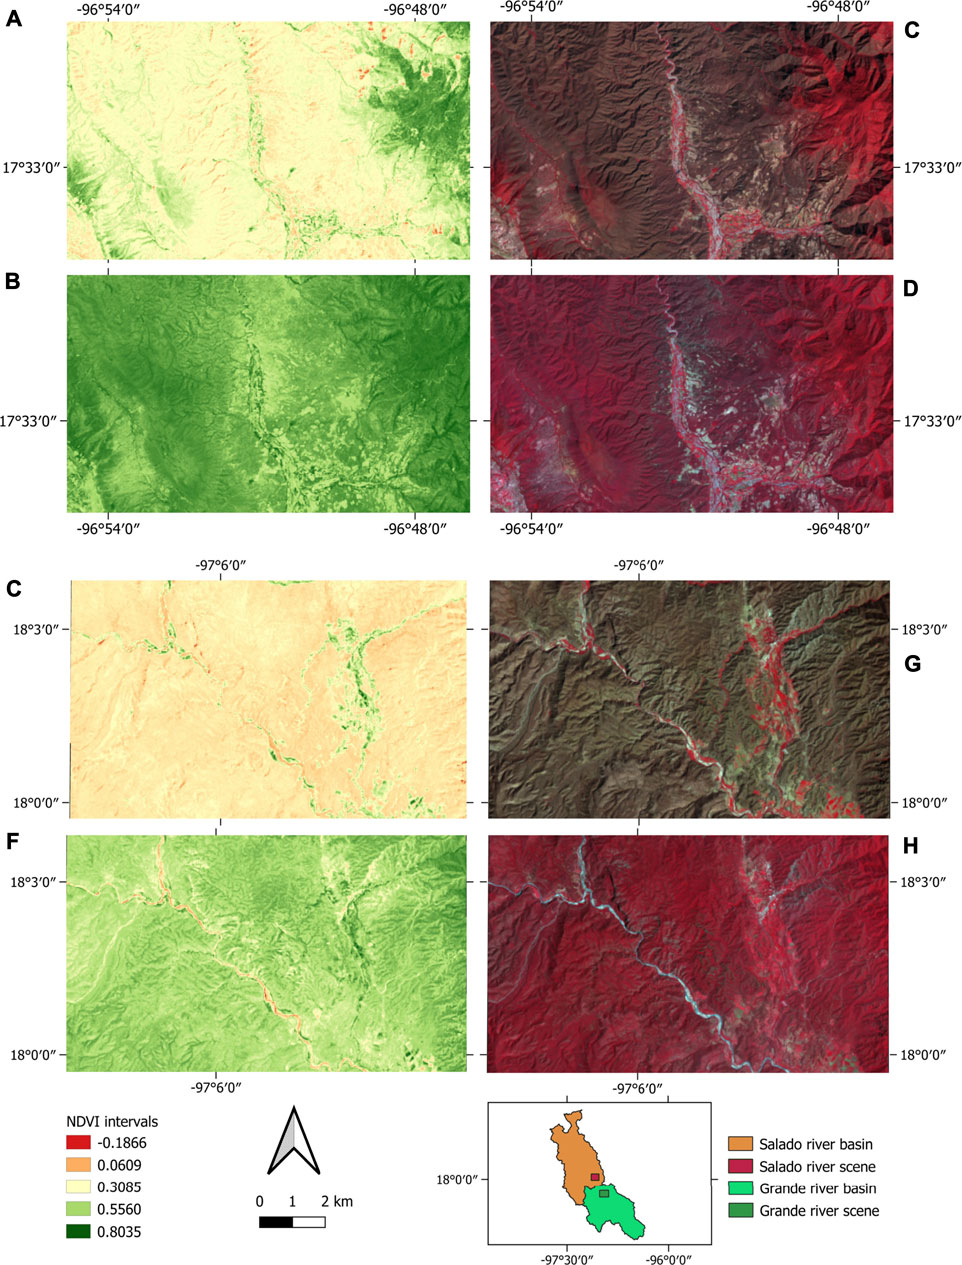
FIGURE 6. NDVI Map for (A) the Grande River in the dry season, (B) the Grande River in the wet season, (E) the Salado River in the dry season, and (F) the Salado River in the wet season. Spectral combination for infrared Landsat 8 OLI TIRS bands (5-4-3) for (C) the Grande River in the dry season, (D) Grande River in the wet season, (G) the Salado River in the dry season, and (H) the Salado River in the wet season.
Mean NDWI values fluctuated from 0.31 (dry season) to 0.47 (wet season) in the Grande River sub-basin, from 0.29 (dry season) to 0.47 (wet season) in the Grande River corridor, from 0.09 (dry season) to 0.29 (wet season) in the Salado River sub-basin, and from 0.22 (dry season) to 0.29 (wet season) in the Salado River corridor (Figure 7).
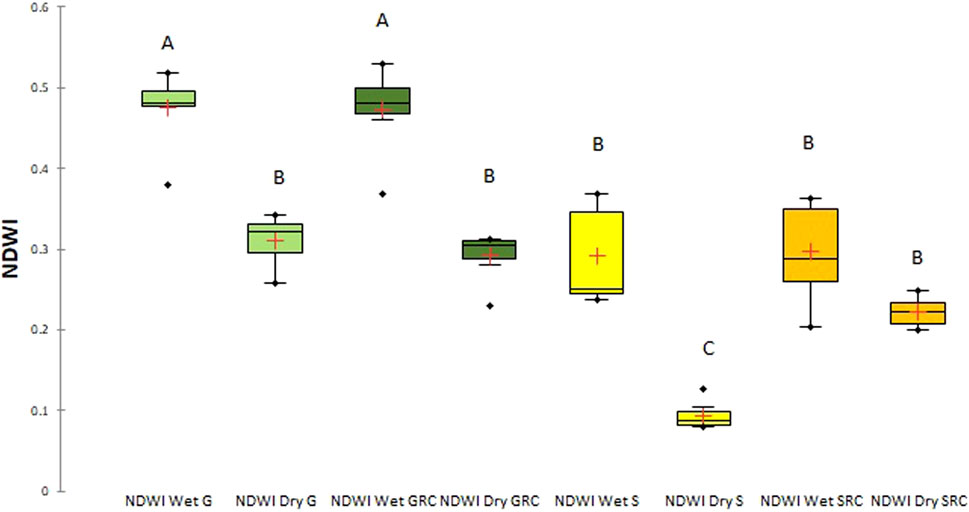
FIGURE 7. Box-and-whisker plot for NDWI values for the Grande River sub-basin (G), the Grande River corridor (GRC), the Salado River sub-basin (S), and the Salado River corridor (SRC) during the wet and dry seasons. Different letters denote significant differences (p < 0.05).
In this case, significant differences (p < 0.05) were found in NDWI values for the Grande River sub-basin and its corridor in the wet season versus the Salado River sub-basin and its corridor in the dry season. No significant differences (p > 0.05) were found among NDWI values for the Grande River and the Grande River corridor during the dry season versus the Salado River sub-basin in the wet season and the Salado River corridor in both wet and dry season. Therefore, the Salado River corridor during the wet and dry seasons is similar to the Grande River corridor in the dry season. The Salado River during the dry season shows the lowest NDWI values, being different from all other values (p < 0.05).
Mean NDDI values ranged from 0.19 (dry season) to 0.08 (wet season) in the Grande River sub-basin, from 0.19 (dry season) to 0.07 (wet season) in the Grande River corridor, from 0.50 (dry season) to 0.20 (wet season) in the Salado River sub-basin, and from 0.13 (dry season) to 0.04 (wet season) in the Salado River corridor (Figure 8). In this case, significant differences (p < 0.05) were found between the Salado River sub-basin in the dry season, being different from all others and showing the highest drought index values, and between the Salado River corridor in wet season, with Grande River and Grande River corridor in dry season.
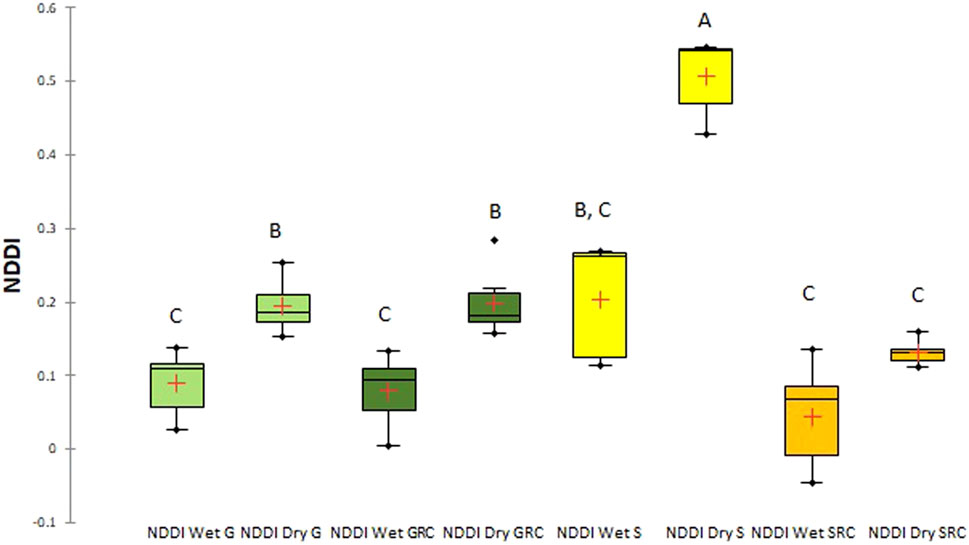
FIGURE 8. Box-and-whisker plot for NDDI values for the Grande River sub-basin (G), the Grande River corridor (GRC), the Salado River sub-basin (S), and the Salado River corridor (SRC) in the wet and dry seasons. Different letters denote significant differences (p < 0.05).
Discriminant Analysis
The first two discriminant functions explain 89.26% of the variance, with significant separation between groups (Wilk’s Lambda = 0.001). This analysis showed that the Salado River sub-basin and its corridor during the dry season are associated with the most prominent drought (highest NDDI values), including the lowest NDVI and NDWI values. The Grande River sub-basin during the dry and wet seasons exhibits the highest NDVI and NDWI values; likewise, the Salado River sub-basin and its corridor during the wet season show NDVI and NDWI values that are similar to those in the Grande River sub-basin. In the wet season, the Grande River corridor shows intermediate NDVI and NDWI and low NDDI values. During the dry season, the Grande River corridor forms a separate group with intermediate NDVI, NDWI, and NDDI values (Figure 9).
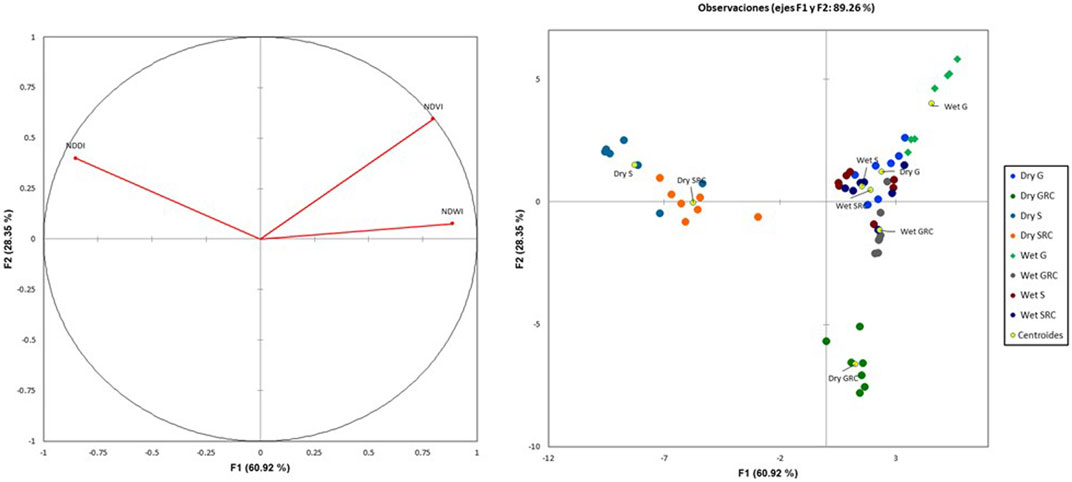
FIGURE 9. Discriminant analysis biplot for NDVI, NDWI, and NDDI for the Grande River and the Salado River sub-basins and river corridors.
Discussion
Rivers are often central elements of the landscape as they are far more than merely flowing water. Vegetation is present along virtually all river corridors, interacting with the flow, influencing bank stability, and contributing to floodplain roughness (Powell, 2009; Tomsett and Leyland, 2019). Furthermore, river corridors in dryland rivers play a critical role in supplying environmental services (FAO, 2016), such as drought mitigation.
From space, rivers are seen as green branches that delineate the landscape into sections, mainly in the dry season, as shown in Figure 6A,C,E,G. Precipitation and temperature are two climatic factors that determine the features of dryland rivers (Tietjen et al., 2017). The Grande and Salado River sub-basins belong to dryland categories; however, as one sub-basin has an exogenous river and the other an endogenous river, they display markedly different characteristics associated with precipitation and environmental temperature. The Grande River sub-basin receives more rainwater than the Salado River sub-basin, reflected in the lower mean annual precipitation values. In turn, this condition leads to differences in cover and vegetation type (Tietjen et al., 2017; Okin et al., 2018).
Huang et al. (2017) point out that the most significant warming over the past 100 years was observed over drylands and accounted for more than half of the continental warming. Likewise, Karmalkar et al. (2011) point out that mountain ecosystems and species, where climate zonation is constrained by topography, are particularly susceptible to changing climate, noting that although ecosystems have adapted to changing conditions in the past, current environmental changes are occurring at a much faster rate, and pose a severe threat to biodiversity. These authors make particular reference to the region that ranges from Central Mexico to the Panama Canal, where hotspot of Mesoamerican biodiversity has been declared, and conclude that Regional Climate Models that they applied predict that the warming that will occur in Mexico and Central America is greater than the global temperature increase.
Particularly, Lopez-Lopez et al. (2019) highlighted the vulnerability of the Salado and Grande Rivers to climate change, with evident changes in salinity and temperature that affect the diversity and structure of aquatic communities. In this study, based on a database spanning 30 years, normalized temperature anomalies and GWI values indicate a warming trend in both river sub-basins. However, the Salado River sub-basin shows a more significant trend, boosting a higher evapotranspiration rate, exacerbating the drought effects. These severe drought conditions in the Salado River sub-basin in the dry season were evident by the lowest NDVI and NDWI values and the highest NDDI values. Although no significant differences were observed between the Grande River sub-basin, the Grande River corridor, and the Salado River corridor in the dry season concerning the NDDI, these values were higher than those in the wet season, indicating the effects of drought. Lopez-Lopez et al. (2019) indicate that the Salado River runs across several geological strata; this causes increased salinization in both water and soil, thus limiting the growth of plants. Likewise, these authors report significant differences in water and air temperature between the Salado and Grande Rivers. Also, salinity in the Salado River may be increased by evapotranspiration and, consequently, affect the establishment of riparian plant communities. Moreover, if soil moisture decreases and air temperature continues increasing over time, evapotranspiration can drop until the soil becomes arid, resulting in desertification (Seneviratne et al., 2010; Fensholt et al., 2015; Huang et al., 2017). Therefore, endogenous rivers are more susceptible to climate change and the ensuing desertification.
The discriminant analysis (DA) is a particular case of canonical correlation; one of its objectives is to identify the significance of different variables, separating two or more groups that occur naturally (Espinal-Carreon et al., 2013). In this study, DA was applied to detect differences between sub-basins, river corridors, and seasons in terms of NDVI, NDWI, and NDDI. The Salado River corridor and sub-basin showed the lowest NDVI values; this implies sparse vegetation cover, making it more prone to erosion during flooding events and riverbank modifications, leading to reduced environmental services and restraining connectivity. Instead, high NDVI values in the Grande River sub-basin and its corridor imply a higher vegetation cover, which contributes to protecting the riverbank, increasing roughness (Powell, 2009), mitigating eolic and water erosion, and increasing habitat heterogeneity (Bendix and Stella, 2013; Harvey and Gooseff, 2015). Besides, the Grande River corridor showed higher NDVI values over time, thus mitigating drought along the whole sub-basin (Tomsett and Leyland, 2019), improving river connectivity and water quality (Harvey and Gooseff, 2015; Harvey et al., 2018).
Colloff and Baldwin (2010) indicate that resilience involves two main elements: 1) the capacity of an ecosystem to support disturbances without losing its core functions and controls, and 2) its capacity to withstand disturbances returning to its previous equilibrium afterward. In this study, the Grande River corridor in the dry season illustrates the first element, showing intermediate NDVI, NDWI, and NDDI values, which indicate that the effects of drought are not as severe as in the Salado River. For its part, the Salado River sub-basin and its corridor are examples of the second element because, despite a considerable disturbance by drought conditions in both cases, NDVI values return to values similar to those in the Grande River sub-basin and its corridor during the dry season. In this case, water from precipitation acts as a driver that elicits a vegetation cover response in the Salado River sub-basin contributing to recover values similar to those of the exogenous river sub-basin during the dry season, thus showing some resilience. The Salado and Grande River sub-basins harbor plant communities with morphological and physiological mitigation traits, as indicated by Bendix and Stella (2013) for dryland areas. The Salado River sub-basin and its corridor are home to plant communities such as xeric shrubland and thorn forests comprising plant species with reduced leaf area and a thick and waxy cuticle to reduce water loss and reflect heat. Additional adaptations are large fleshy stems to store water, thorns and thin, spiky or glossy leaves to reduce water loss, deep roots to reach groundwater, and long shallow roots that spread over a wide area (Batanouny, 2001). In contrast, the Grande River sub-basin, whose primary vegetation cover consists of deciduous tropical forest, is home to short slow-growing trees with leaves showing a lower specific leaf area (Ratnam et al., 2019), which shed their foliage during the dry season. Both strategies set an essential difference between sub-basins and river corridors of endogenous versus exogenous rivers to face drought conditions. Tellez-Valdez and Davila-Aranda (2003) examined the effects of climate change in TCBR on distribution patterns of 20 species of Cactaceae plants, testing three different future scenarios, and finding that the most extreme scenario predicts from a drastic distribution contraction of the population studied species, either outside or within the limits of the TCBR, to could even become extinct. The latter highlights the importance of climate change studies in this region. Furthermore, our study establishes a clear difference between the two main sub-basins of the TCBR, where the Salado river sub-basin is most vulnerable to desertification.
This study evidences significant differences between the river corridors of endogenous and exogenous rivers at the seasonal scale. River corridors of endogenic rivers are subject to more drastic processes and conditions versus exogenous river corridors. Krosby et al. (2018) indicate that riparian habitats are potential conservation areas under climate change scenarios because they provide microclimatic refuges against warming. However, in this study, we found that drought conditions were more severe in the Salado River sub-basin and its corridor, thus reducing the function of this river corridor. If these conditions continue, desertification processes may take place. While the Grande River corridor is essentially outlined as a landscape continuum, the Salado River corridor appears in dynamic patches, depending on the dry and rainy seasons.
River corridors in dryland rivers should be seen as green linear configurations of variable width that supplement rivers along their path. Overall, river corridors in TCBR should be considered biodiversity hotspots because they offer climatic and environmental conditions suitable for species that may not survive the dry conditions further away from the riverbed; these species of animals and plants supply environmental services in a trade-off with the stream.
Although there are efforts to model the potential effects of climate change in arid and semi-arid zones (Vivoni et al., 2009), the scope of this study does not consider the application of these models. However, subsequent studies in the RBTC should focus on generating databases that help feed the models that will allow identifying the effects of climate change on the course of the rivers of the RBTC.
The severe manifestation of drought in the Salado River sub-basin and its corridor showing the lowest NDVI values, the more accentuated warming trend, and the lowest precipitation, may be signs of desertification and climate change. Likewise, the lowest NDVI and NDWI and the highest NDDI values in the Salado River corridor reveal a channel devoid of vegetation cover, which promotes erosion, riverbank instability, low habitat heterogeneity, and reduced connectivity, highlighting the vulnerability of these riparian ecosystems and the risks to which they are subject. However, the Salado and Grande River corridors showed some level of resilience to face climatic conditions.
Efforts to conserve the river corridors should be made in the TCBR, including the Salado and the Grande sub-basins, to prevent the effects of climate change, i.e., desertification. Further studies should be conducted to address the effects of drought in the TCBR to support and guide management strategies and social policies.
Data Availability Statement
The raw data supporting the conclusions of this article will be made available by the authors, without undue reservation.
Author Contributions
JES-D conceived the idea, analyzed the data, and wrote the article. EL-L provided feedback on the analyses and the article. Both authors reviewed and contributed to the final version of the article.
Funding
This research was funding by Instituto Politécnico Nacional through the research projects SIP-20200578, 20210132, and SIP-20210133.
Conflict of Interest
The authors declare that the research was conducted in the absence of any commercial or financial relationships that could be construed as a potential conflict of interest.
Publisher’s Note
All claims expressed in this article are solely those of the authors and do not necessarily represent those of their affiliated organizations, or those of the publisher, the editors and the reviewers. Any product that may be evaluated in this article, or claim that may be made by its manufacturer, is not guaranteed or endorsed by the publisher.
Acknowledgments
The authors thank the Instituto Politécnico Nacional for the support and María Elena Sánchez-Salazar for the language editing.
Abbreviations
G, Grande River sub-basin; GRC, Grande River corridor; GWI, Global Warming Index; NDDI, Normalized Difference Drought Index; NDVI, Normalized Difference Vegetation Index; NDWI, Normalized Difference Water Index; S, Salado River sub-basin; SRC, Salado River corridor; TCBR, Tehuacán—Cuicatlán Biosphere Reserve.
References
AghaKouchak, A., Farahmand, A., Melton, F. S., Teixeira, J., Anderson, M. C., Wardlow, B. D., et al. (2015). Remote Sensing of Drought: Progress, Challenges and Opportunities. Rev. Geophys. 53, 452–480. doi:10.1002/2014RG000456
Batanouny, K. H. (2001). “Adaptation of Desert Plants,” in Plants in the Deserts of the Middle East. Adaptations of Desert Organisms (Berlin, Heidelberg: Springer), 39–44. doi:10.1007/978-3-662-04480-3_6
Bendix, J., and Stella, J. C. (2013). “Riparian Vegetation and the Fluvial Environment: A Biogeographic Perspective,” in Treatise on Geomorphology. Editors J. Shroder, D. R. Butler, and C. R. Hupp (San Diego, CA: Academic Press), Vol. 12, 53–74. doi:10.1016/B978-0-12-374739-6.00322-5
Camporeale, C., Perona, P., and Ridolfi, L. (2019). “Hydrological and Geomorphological Significance of Riparian Vegetation in Drylands,” in Dryland Ecohydrology. Editors P. D’Odorico, A. Porporato, and C. W. Runyan 2nd Ed. (Switzerland: Springer International Publishing), 239–275. doi:10.1007/978-3-030-23269-6_10
Colloff, M. J., and Baldwin, D. S. (2010). Resilience of Floodplain Ecosystems in a Semi-Arid Environment. Rangel. J. 32, 305–314. doi:10.1071/RJ10015
CONANP (2013). Programa de Manejo reserva de la Biósfera Tehuacán Cuicatlán. Mexico City: Secretaría de Medio Ambiente y Recursos Naturales, 329.
Cui, X., Guo, X., Wang, Y., Wang, X., Zhu, W., Shi, J., et al. (2019). Application of Remote Sensing to Water Environmental Processes under a Changing Climate. J. Hydrol. 574, 892–902. doi:10.1016/j.jhydrol.2019.04.078
Dávila, P., Arizmendi, M. D. C., Valiente‐Banuet, A., Villaseñor, J. L., Casas, A., and Lira, R. (2002). Biological Diversity in the Tehuacán-Cuicatlán Valley, Mexico. Biodiversity and Conservation 11, 421–442. doi:10.1023/A:1014888822920
de Andalucia, J. (2018). Consejería de Medio Ambiente y Ordenación del territorio. Andalucia: Sistema de Indicadores Ambientales de la Red de Información Ambiental de Andalucia.
Espinal Carreón, T., Sedeño Díaz, J. E., and López López, E. (2013). Evaluación de la Calidad del Agua en la Laguna de Yuriria, Guanajuato, México, mediante técnicas multivariadas: un Análisis de Valoración para dos épocas 2005, 2009-2010 Rev. Int. Contam. Ambie. 29 (3), 147–163.
FAO (2016). Trees, Forests and Land Use in Drylands, the First Global Assessment. Rome, Italy: Food and Agriculture Organization of the United Nations, 31.
Fensholt, R., Horion, S., Tagesson, T., Ehammer, A., Grogan, K., Tian, F., et al. (2015). “Assessing Drivers of Vegetation Changes in Drylands from Time Series of Earth Observation Data,” in Remote Sensing Time Series Revealing Land Surface Dynamics. Editors C. Kuenzer, S. Dech, and W. Wagner (Cham: Springer), 183–202. doi:10.1007/978-3-319-15967-6_9
Fernandes, M. R., Aguiar, F. C., Ferreira, M. T., and Pereira, J. M. C. (2012). Spectral Separability of Riparian Forests from Small and Medium-Sized Rivers Across a Latitudinal Gradient Using Multispectral Imagery. Int. J. Remote Sensing 34 (7), 2375–2401. doi:10.1080/01431161.2012.744491
Gao, B.-C. (1996). NDWI-A Normalized Difference Water Index for Remote Sensing of Vegetation Liquid Water from Space. Remote Sensing Environ. 58, 257–266. doi:10.1016/S0034-4257(96)00067-3
García, E. (2004). Modificaciones al Sistema de Clasificación Climática de Köppen (para adaptarlo a las condiciones de la República Mexicana. 5a ed. México: Instituto de Geografía, UNAM, 97.
Glovis, US Geological Service (2020). Geological Service. Available at: https://glovis.usgs.gov/app (Accessed September 09, 2020).
Grumm, R. H., and Hart, R. (2001). Standardized Anomalies Applied to Significant Cold Season Weather Events: Preliminary Findings. Wea. Forecast. 16, 736–754. doi:10.1175/1520-0434(2001)016<0736:saatsc>2.0.co;2
Gu, Y., Brown, J. F., Verdin, J. P., and Wardlow, B. (2007). A Five-Year Analysis of MODIS NDVI and NDWI for Grassland Drought Assessment Over the Central Great Plains of the United States. Geophys. Res. Lett. 34, 1–6. doi:10.1029/2006GL029127
Harvey, J., Gomez‐Velez, J., Schmadel, N., Scott, D., Boyer, E., Alexander, R., et al. (2018). How Hydrologic Connectivity Regulates Water Quality in River Corridors. J. Am. Water Resour. Assoc. 55, 369–381. doi:10.1111/1752-1688.12691
Harvey, J., and Gooseff, M. (2015). River Corridor Science: Hydrologic Exchange and Ecological Consequences from Bedforms to Basins. Water Resour. Res. 51, 6893–6922. doi:10.1002/2015WR017617
Huang, J., Li, Y., Fu, C., Chen, F., Fu, Q., Dai, A., et al. (2017). Dryland Climate Change: Recent Progress and Challenges. Rev. Geophys. 55, 719–778. doi:10.1002/2016RG000550
Huffman, G. J., Stocker, E. F., Bolvin, D. T., Nelkin, E. J., and Tan, J. (2019). GPM IMERG Final Precipitation L3 1 Month 0.1 Degree X 0.1 Degree V06, Greenbelt, MD. Goddard Earth Sciences Data and Information Services Center (GES DISC) (Accessed July 12, 2021).
INEGI (2020). Instituto Nacional de Estadística, Geografía e Informática. Available at: https://www.inegi.org.mx/temas/mapadigital/(Accessed November 14, 2020).
Karmalkar, A. V., Bradley, R. S., and Diaz, H. F. (2011). Climate Change in Central America and Mexico: Regional Climate Model Validation and Climate Change Projections. Clim. Dyn. 37, 605–629. doi:10.1007/s00382-011-1099-9
Krosby, M., Theobald, D. M., Norheim, R., and McRae, B. H. (2018). Identifying Riparian Climate Corridors to Inform Climate Adaptation Planning. PLoS ONE 13 (11), e0205156. doi:10.1371/journal.pone.0205156
López López, E., Sedeño Díaz, J. E., Mendoza MartínezGómez Ruiz, E. A., and Martínez Ramírez, E. (2019). Water Quality and Macroinvertebrate Community in Dryland Streams: The Case of the Tehuacán-Cuicatlán Biosphere Reserve (México) Facing Climate Change. Water 11, 1376. doi:10.3390/w11071376
NASA Giovanni Services (2020). Giovanni Services. Available at: https://giovanni.gsfc.nasa.gov/giovanni/(Accessed August 26, 2020).
Okin, G. S., Sala, O. E., Vivoni, E. R., Zhang, J., and Bhattachan, A. (2018). The Interactive Role of Wind and Water in Functioning of Drylands: What Does the Future Hold? BioScience 68, 670–677. doi:10.1093/biosci/biy067
Piégay, H., Arnaud, F., Belletti, B., Bertrand, M., Bizzi, S., Carbonneau, P., et al. (2020). Remotely Sensed Rivers in the Anthropocene: State of the Art and Prospects. Earth Surf. Process. Landforms 45, 157–188. doi:10.1002/esp.4787
Pinay, G., Décamps, H., Chauvet, E., and Fustec, E. (1990). “Functions of Ecotones in Fluvial Systems,” in The Ecology and Management of Aquatic-Terrestrial Ecotones. Editors R. J. Naiman, and H. Décamps (Singapore: Springer), 141–169.
Powell, D. M. (2009). “Dryland Rivers: Processes and Forms,” in Geomorphology of Desert Environments. Editors A. J. Parsons, and A. D. Abrahams (Dordrecht: Springer), 333–373. doi:10.1007/978-1-4020-5719-9_12
Ratnam, J., Chengappa, S. K., Machado, S. J., Nataraj, N., Osuri, A. M., and Sankaran, M. (2019). Functional Traits of Trees from Dry Deciduous “Forests” of Southern India Suggest Seasonal Drought and Fire Are Important Drivers. Front. Ecol. Evol. 7, 8. doi:10.3389/fevo.2019.00008
Safriel, U., and Zafar, A. (2005). “Dryland Systems,” in Ecosystems and Human Wellbeing, Current State and Trends. Editors R. Hassan, R. Scholes, and N. Ash (Washington, D. C: Island Press), 623–662.
Sandercock, P. J., Hooke, J. M., and Mant, J. M. (2007). Vegetation in Dryland River Channels and its Interaction with Fluvial Processes. Prog. Phys. Geogr. Earth Environ. 31 (2), 107–129. doi:10.1177/0309133307076106
Seneviratne, S. I., Corti, T., Davin, E. L., Hirschi, M., Jaeger, E. B., Lehner, I., et al. (2010). Investigating Soil Moisture-Climate Interactions in a Changing Climate: A Review. Earth-Science Rev. 99, 125–161. doi:10.1016/j.earscirev.2010.02.004
Tarpley, J. D., Schneider, S. R., and Money, R. L. (1984). Global Vegetation Indices from the NOAA-7 Meteorological Satellite. J. Clim. Appl. Meteorol. 23, 491–494. doi:10.1175/1520-0450(1984)023<0491:gviftn>2.0.co;2
Téllez‐Valdés, O., and Vila‐Aranda, P. D. (2003). Protected Areas and Climate Change: A Case Study of the Cacti in the Tehuacán‐Cuicatlán Biosphere Reserve, Mexico. Conservation Biol. 17, 846–853. doi:10.1046/j.1523-1739.2003.01622.x
Tietjen, B., SchlaepferBradford, D. R. J. B., Bradford, J. B., Lauenroth, W. K., Hall, S. A., Duniway, M. C., et al. (2017). Climate Change‐Induced Vegetation Shifts lead to More Ecological Droughts Despite Projected Rainfall Increases in many Global Temperate Drylands. Glob. Change Biol. 23, 2743–2754. doi:10.1111/gcb.13598
Tomsett, C., and Leyland, J. (2019). Remote Sensing of River Corridors: A Review of Current Trends and Future Directions. River Res. Applic 35, 779–803. doi:10.1002/rra.3479
Tooth, S. (2013). “9.31 Dryland Fluvial Environments: Assessing Distinctiveness and Diversity from a Global Perspective,” in Treatise on Geomorphology. Editor J. F. Shroeder (San Diego, CA: Elsevier. EUA.), 9, 612–644. doi:10.1016/b978-0-12-374739-6.00257-8
Tooth, S. (2000). Process, Form and Change in Dryland Rivers: A Review of Recent Research. Earth-Science Rev. 51, 67–107. doi:10.1016/S0012-8252(00)00014-3
UNESCO (2018). Decisions Adopted during the 42nd Session of the World Heritage Committee (Manama, 2018). Manama, Bahrain: WORLD HERITAGE COMMITTEE Forty-second session, 260.
UNESCO (2016). Tehuacán-Cuicatlán Valley Originary Hábitat of Mesoamerica. Mexico: INAH, CONANP, 282.
Xu, H. Q. (2006). Modification of normalised difference water index (NDWI) to enhance open water features in remotely sensed imagery. Int. J. Remote Sens. 27, 3025–3033. doi:10.1080/01431160600589179
Keywords: dryland river, endogenous and exogenous rivers, remote sensing, riparian vegetation, drought analysis, climate change
Citation: Sedeño-Díaz JE and López-López E (2021) The Influence of Climate Change on River Corridors in Drylands: The Case of the Tehuacán-Cuicatlán Biosphere Reserve. Front. Environ. Sci. 9:681703. doi: 10.3389/fenvs.2021.681703
Received: 17 March 2021; Accepted: 17 August 2021;
Published: 03 September 2021.
Edited by:
Teresa Ferreira, University of Lisbon, PortugalReviewed by:
Simone Graça Pinto Varandas, University of Trás-os-Montes and Alto Douro, PortugalSílvia Carvalho, University of Lisbon, Portugal
Copyright © 2021 Sedeño-Díaz and López-López. This is an open-access article distributed under the terms of the Creative Commons Attribution License (CC BY). The use, distribution or reproduction in other forums is permitted, provided the original author(s) and the copyright owner(s) are credited and that the original publication in this journal is cited, in accordance with accepted academic practice. No use, distribution or reproduction is permitted which does not comply with these terms.
*Correspondence: Jacinto Elías Sedeño-Díaz, anNlZGVub0BpcG4ubXg=