 Ming Zhu
 Jingjing Zhang
 Lianqi Zhu
- 1College of Environment and Planning, Henan University, Kaifeng, China
- 2College of Geography and Tourism, Zhengzhou Normal University, Zhengzhou, China
The Normalized Difference Vegetation Index (NDVI) is sensitive to changes in surface vegetation cover. Research into how climate change impacts surface vegetation cover is essential to manage ecological systems and promote green development. The Western Henan Mountains, located in the transitional zone between the northern subtropical and warm temperate zones of China, is an ideal location to study the impacts of climate change on surface vegetation cover. Combining a digital elevation model (DEM) with temperature and precipitation data; and MODIS-NDVI imagery (2000∼2017) for the Western Henan Mountains, this study explores variations in the growing season NDVI and its response to climate change. Results show that there are significant changes with fluctuations in NDVI values from 2000 to 2017. NDVI increased at a growth rate of 0.027 per decade (p < 0.05) overall, indicating vegetation conditions have gradually improved. Although the NDVI value showed an overall increasing trend, 19.12% of the areas showed a decreasing trend, interspersing and intersecting spatially, showing significant spatial differences. NDVI increased initially, but then decreased as a function of elevation, which was shown to be proportional to slope and independent of aspect. Variables including elevation and slope gradient are shown to provide high explanation of NDVI variability, whilst temperature is shown to have a more significant impact on NDVI than precipitation. However, vegetation responses to temperature and precipitation covaried with both slope and aspect. Positive NDVI trends were strongest at low elevations (i.e., <1,100 masl), which we attribute to vegetation restoration activities. Lower NDVI values characterized gentle slopes (<5°), whilst higher values were, in contrast, associated with steeper slopes (5∼10°). This study highlights the complex mechanisms and their relations governing vegetation response to climate change and should form an instructive basis for both future modeling studies investigating the response of vegetation to future global warming.
Introduction
Vegetation comprises a critical component of ecosystems connecting the atmospheric, hydrological and pedological systems (Yang et al., 2010; Piao et al., 2011). The sensitivity of vegetation cover to climate change has become a major research focus considering the unprecedented rates and impacts of anthropogenic global warming on the biosphere.
The Normalized Difference Vegetation Index (NDVI) is commonly used to indicate changes to vegetation cover in response to climate variability (Nemani et al., 2003). Several studies have investigated the relationships between NDVI and climate factors (e.g., temperature and precipitation at global (Ichii et al., 2002; Liu et al., 2016) and regional (Herrmann et al., 2005; Du et al., 2016; Yin et al., 2016) scales via correlation analysis (Tong, 2014), factor analysis and regression analysis(Zhang et al., 2017).
Notably, 67% of China’s total land area is mountainous, of concern, given the high sensitivity of mountain ecosystems to climate change. Therefore, understanding the elevation-dependent composition of vegetation within different mountain environments is crucial for understanding the varied impacts of climate on these environments (Zhu and Li, 2017; Zhang et al., 2018). Mountain vegetation provides vital ecosystem services, but is highly sensitive to environmental change and is influenced by numerous factors (Pepin et al., 2015). Understanding the driving mechanisms controlling mountain vegetation is essential to project future spatial patterns of vegetation change in response to global warming in these regions, and as such constitutes a pressing issue for climate change research. Extensive research has been conducted on mountain ecosystems in the European Alps, Kilimanjaro in Africa, Cordillera in North America, and the Andes in South America (Habeck, 1987; Hemp, 2006; Gehrig-Fasel et al., 2007; Erschbamer et al., 2009; Asam et al., 2018). Some progress has also been made in the study of mountain vegetation changes in China, specifically the Sanjiangyuan area of Tibet Plateau, Hengduan Mountains, Tianshan Mountains, Changbai Mountains, Qilian Mountains and Qinling Mountains (Kessler, 2000; Long, 2003; Zhang et al., 2004; Yao et al., 2010). The Western Henan Mountains are in the transition zone between the northern subtropical and warm temperate zones of China. The region also represents a topographical transition zone between the second and third steps, displaying diverse topographic characteristics (Zhang et al., 2019).
Research on mountain vegetation growth relies heavily on the NDVI, which is an important indicator for assessing the status of mountain vegetation growth, particularly during the growing season (Geng et al., 2019). In particular NDVI has been used to investigate dynamic changes in the horizontal structure of mountain vegetation. In China, nine vertical vegetation zones in the West Kunlun Mountains were identified using SPOT-VGT NDVI and digital elevation model (DEM) data. Several studies have investigated the drivers of vegetation changes in mountain regions. For example, studies of dynamic vegetation cover changes in the European Alps found that climate change was less significant compared to anthropogenic activities (Erschbamer et al., 2009). Furthermore, trends in NDVI variations and regional responses along different elevation gradients were analyzed in the Qinling Mountains. The results indicated that the vegetation in high-elevation areas was mainly controlled by temperature changes (Geng et al., 2019). Disentangling the relative impacts of climate changes and geographic factors such as slope, altitude and aspect is needed to more fully assess the controls on vegetation within different mountain regions (Song, 1994; Lunetta et al., 2006; Eastman et al., 2013). The Western Henan mountains represent a key gap in the field of mountain vegetation research and therefore is investigated in the present study.
In this study, the Savitsky-Golay (S-G) filtering algorithm was applied to the 2000∼2017 MODIS-NDVI time series data. Combined with DEM, temperature, and precipitation data, and using trend- and correlation analyses, this study discusses the multi-dimensional change of vegetation and its climate response accounting for terrain factors such as altitude, slope, and aspect. The characteristics of NDVI change and the response of vegetation on both the northern and southern slopes of the Western Henan mountains were investigated to characterize the vegetation dynamics and their responses to climate change. The value of this study lies in the fact it can provide a crucial basis for decision-making in terms of vegetation protection measures and green development for different ecological units within mountain ecosystems under different global warming scenarios.
Materials and Methods
Study Area
The western mountainous area of Henan Province belongs to the Qinling Mountains (110°20′∼113°40′ E, 32°40′∼35°10′ N). The region includes the Xiaoqinling and Songshan Mountains from east to west; the Xiaoshan, Xiong’er, and Waifang Mountains from east to north; and Funiu Mountain from east to south in total covering an area of ∼4,300 km2 (Figure 1). The research area is located in a transitional zone between the northern subtropical and warm temperate zones of China. The annual average temperature in this area is 13∼15°C, the annual average precipitation is 600∼1,200 mm and the average annual sunshine hours are generally 2,000–2,600 h. The elevation of the region ranges from 75 to 2,384 m above sea level (masl herein), decreasing gradually from west to east.
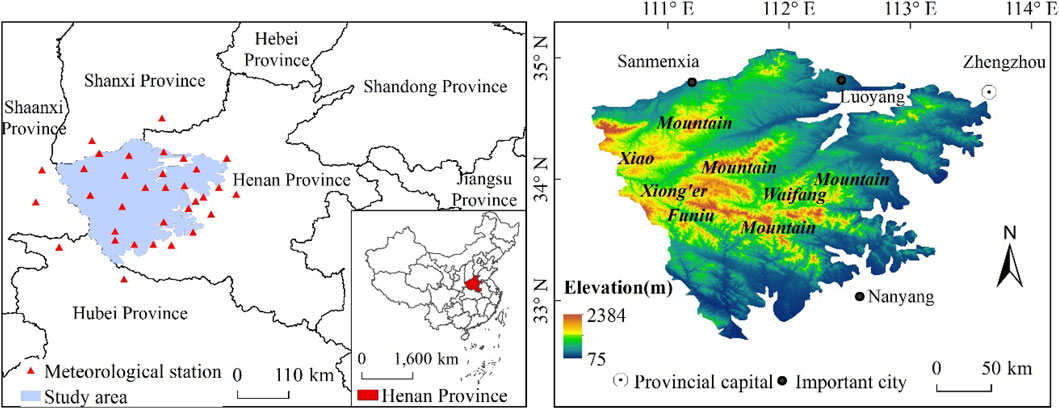
FIGURE 1. The location and elevation of the study area. Note the positions of the meteorological stations used in this study are shown on the left.
Data Resources and Pre-Processing
This NDVI data used in this study was obtained from a NASA 250 m resolution MOD13Q1 (https://ladsweb.modaps.eosdis.nasa.gov/) product which was synthesized every 16 days from the years 2000∼2017. The DEM data was derived from the ASTER Global Digital Elevation Model (ASTGTM2; http://www.gscloud.cn/) at a spatial resolution of 30 m and was interpolated to a 250 m resolution by mosaic processing, cropping and re-sampling in ArcGIS. Temperature and precipitation data were obtained from monthly data records of 27 meteorological stations (2000∼2017) of the Henan Meteorological Service (Figure 1).
NDVI Reconstruction and Extraction
MODIS Reprojection Tools (MRT) was used to splice, project, and cut the MODIS-NDVI data. The Savitsky-Golay (SG) filter algorithm of the TIMESAT tool was adopted to reconstruct NDVI data to eliminate mutation points and decrease systematic errors from clouds, aerosols, angle of view and solar height (Tucker et al., 2005).
Vegetation in the Western Henan Mountains is dormant during winter and sometimes covered by snow. We therefore only analyzed NDVI in the growing season. Using TIMESAT to extract phenological information from pixels coupled with data on the spatiotemporal distribution of long leaves and withered vegetation, the growing season for the region was determined to be from May to September. Thus, the ninth and eighteenth phases of the annual image represent the beginning and end of the growing season, respectively. Then, the mean value of NDVI under annual and multi-year growth seasons can be calculated (Jarlan et al., 2008; Peng et al., 2012).
Meteorological Data Processing
Meteorological station data were interpolated onto a 250 m resolution grid. The DEM was used as a covariant whilst thin plate spline smoothing algorithms (ANUSPLIN) and Kriging were used to interpolate annual temperature and precipitation respectively (Jarlan et al., 2008; Zhang et al., 2016). Annual average air temperature and precipitation were also estimated using ArcGIS 10.4 software.
Permission to Reuse and Copyright
Elevation, slope and aspect were extracted from the DEM using ArcGIS 10.4. With reference to the distribution characteristics of the vertical vegetation types (as reported in the Scientific survey of the Funiu Nature Reserve) (Song, 1994), the study area was divided into five vertical zones: <800, 800∼1,100, 1,100∼1,700, 1,700∼2,000, and >2,000 masl, accounting for 70.3, 16.6, 12.3, 5.3, and 0.5% of the total area, respectively.
The slope was divided into <5°, 5∼10°, 10∼20°, 20∼30°, 30∼40°, and > 40°, accounting for 17.6, 22.0, 29.2, 19.2, 9.4, and 2.6% of the total area, respectively. Slopes between 5 and 20° were the most common (51.2%). Furthermore, slope direction was divided into the slope-free direction (−1), north (0∼22.5°, 337.5∼360°), northeast (22.5∼67.5°), east (67.5∼112.5°) southeast (112.5∼157.5°), south (157.5∼202.5°), southwest (202.5∼247.5°), west (247.5∼292.5°) and northwest (292.5∼337.5°); accounting for 0.5, 11.3, 13.5, 12.9, 12.4, 13.3, 11.8, and 11.6% of the total area, respectively. This classification was necessary because complex terrain features meant that the distribution of the slope directions was highly fragmented.
The classified layers of elevation, slope, and aspect were extracted by the Attribute Extraction Tool in ArcGIS 10.4. Then, the spatial distribution of mean NDVI, annual air temperature, and annual precipitation in the growing season were superimposed using mask extraction. Finally the spatiotemporal distribution of NDVI, temperature and precipitation for different elevations, slopes, and aspects was analyzed.
Methods
Trend Analysis
To analyze the spatiotemporal changes of NDVI at each grid unit, a simple linear slope analysis model was employed in MATLAB 4.1 (Tucker et al., 2005; Lunetta et al., 2006; Jarlan et al., 2008; Peng et al., 2012; Eastman et al., 2013; Tong et al., 2016; Zhang et al., 2016).
The software SPSS 21.0 was used for correlation analysis and significance testing between NDVI at different elevations, slopes, and aspects and annual temperature and precipitation. Then, the response of vegetation to temperature and precipitation over complex mountain topography was obtained.
Correlation Analysis
Changes in the NDVI are affected by multiple factors. In order to better analyze the relationship between NDVI and a given variable, the influence of other variables needs to be eliminated. Therefore, a partial correlation analysis method based on pixels is used to determine the relationship between annual NDVI, precipitation and temperature. This yields a coefficient with which to explore the relationship between annual NDVI and climate factors.
In addition, the significance of partial correlation coefficients between NDVI, precipitation, and temperature was determined using a t-test.
To assess the degree of autocorrelation between climate and terrain factors and the resultant impacts on NDVI, correlation analysis and statistical tests for significance were carried out in SPSS 21.0 on: (i) NDVI, (ii) annual average temperature; and (iii) annual precipitation for different altitudes and slopes in the western Henan Mountains. From these data, we demonstrate the response of vegetation dynamics to both temperature and precipitation in the study area.
Results
NDVI Changes
Trends in NDVI Variability
An analysis of growing season NDVI values from 2000 to 2017 reveals significant changes in NDVI values with large fluctuations (Figure 2). Overall, NDVI increased at a growth rate of 0.027 per decade (p < 0.05), indicating a gradual increase in vegetation. Minimum (0.598) and maximum (0.696) NDVI values occurred in 2001 and 2015, respectively (Figure 2).
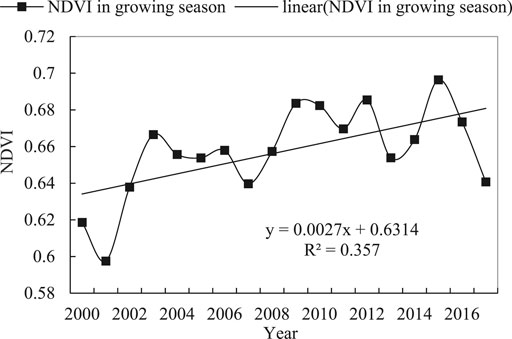
FIGURE 2. Normalized difference vegetation index (NDVI) trends during the growing season.
Spatial NDVI Changes
Figure 3 indicates the spatial distribution of the mean annual NDVI and the annual trends of change within each grid for the years 2000–2017. Mean annual NDVI values between 0.364 and 0.999 occupied most of the area across the whole region. Low NDVI values (i.e., 0∼0.537) were always distributed along the northern and southern margins. Grids with high NDVI values (i.e., 0.752∼0.999) were mainly distributed in the central areas and parts of the northwest (Figure 3A). It can be seen from Figure 2 that the NDVI value generally showed an increasing trend from 2000 to 2017. Grids under an increasing trend overall and were widely distributed across the whole region, indicating that the vegetation in the study area has gradually improved. Although the NDVI value showed an overall increasing trend, 19.12% of the areas showed a decreasing trend, which were mainly distributed in the central areas, part of the northeastern and southeastern areas, interspersing and intersecting spatially, showing significant spatial differences (Figure 3B).
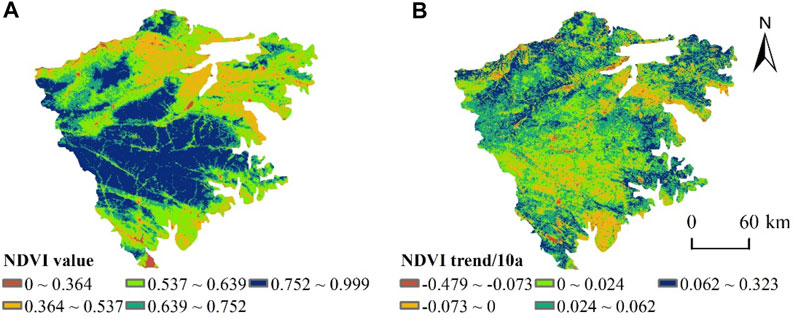
FIGURE 3. Spatial distribution of the annual mean NDVI (A) and trends of changing NDVI values (B).
Influence of Terrain Factors on NDVI
We selected the variables of elevation, slope, and aspect to explore the effect of terrain on NDVI. Figure 4A shows that after an initial increase, NDVI values decreased with elevation. The minimum NDVI value (0.606) occurred below 800 masl. The maximum NDVI value (0.822) occurred at 1,700∼2,000 masl in areas undisturbed by human activities, thus promoting vegetation growth. In areas above 2,000 masl the NDVI exhibited a downward trend. Figure 4B shows a positive correlation between NDVI and slope gradient. Maximum NDVI values (0.797) occurred on slopes ranging from 30 to 40°, above which NDVI declined. Minimum NDVI were attained (0.569) for slope gradients of <5°. Figure 4C shows that the aspect had no significant impact on NDVI values. The NDVI of the southern slope was low (0.636) relative to the northwestern slope (0.685). This difference can be explained by the fact that the southern slopes are dominated by cultivated lands, while forests dominate the northwestern slopes.
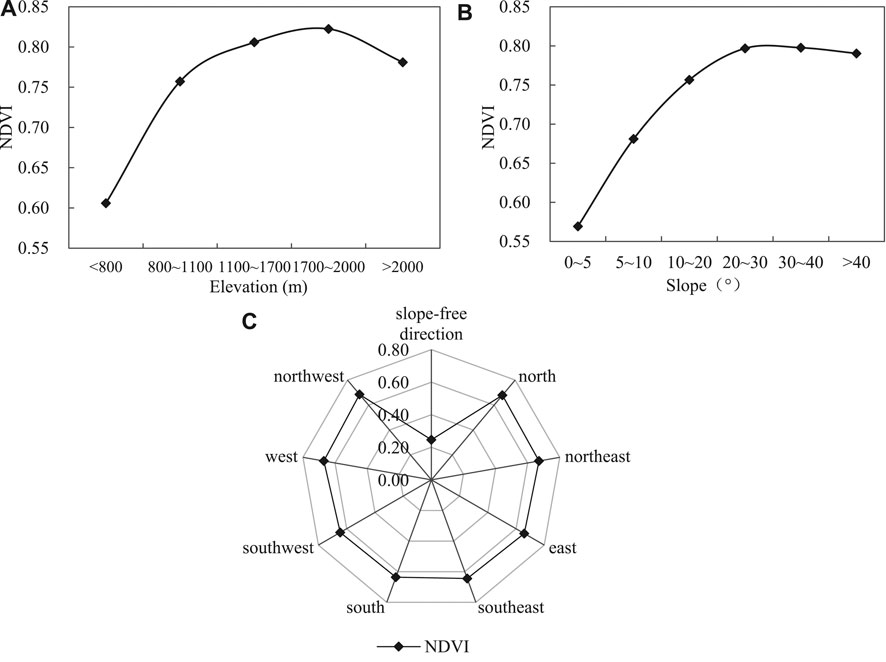
FIGURE 4. NDVI variations with elevation (A), slope (B), and aspect (C).
Comparison of NDVI Trends for Different Terrain Factors
Figure 5 shows the variations in NDVI trends as a function of elevation, slope and aspect. The variation in NDVI trends at elevation zones from 800 to 2,000 masl was 0.029 (p < 0.05), 0.028 (p < 0.05), 0.020, 0.009, and 0.004 per decade. Trends in NDVI variability were significant on slopes at elevations less than 1,700 masl (Figure 5A). In general, NDVI growth rates decreased as elevation increased. The NDVI growth trend in areas with the slope between 0 and 5°and above 40°was increased at first and then decreased, then increased slightly. NDVI growth was the highest (0.038 per decade, p < 0.05) in areas with the slope of 5∼10° and the lowest in areas with the slope of 30∼40°, indicating that vegetation improvement was less apparent as the slope increased (Figure 5B). The effect of aspect on NDVI growth trends was relatively consistent (approximately 0.028 per decade). NDVI growth rates on shady slopes (0.029 per decade) were slightly higher compared to sunny slopes (0.026 per decade) (Figure 5C).
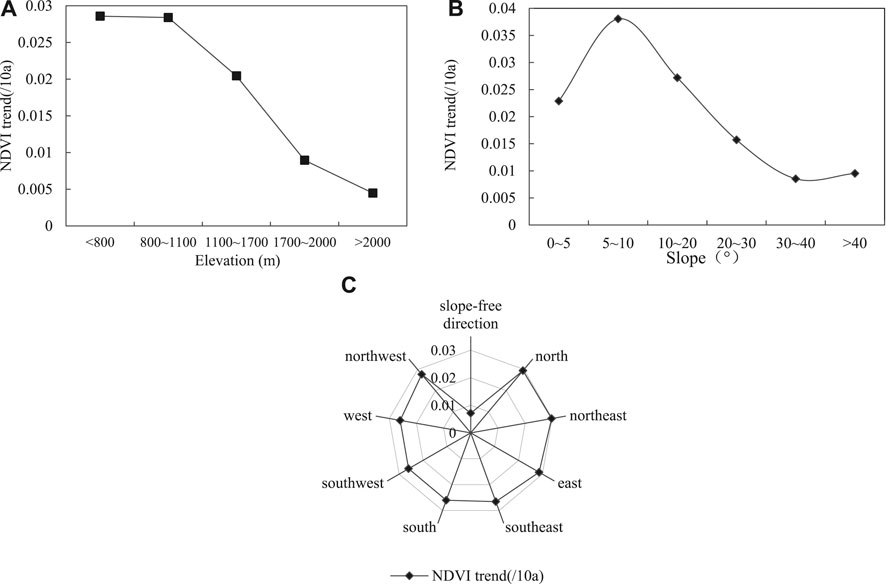
FIGURE 5. Variations in NDVI trends with (A) elevation, (B) slope, and (C) aspect.
The spatial distribution of NDVI trends in different vegetation change areas is shown in Figure 6A. 40% of the area exhibited improved vegetation cover, 56.68% remained stable, whilst 3.35% exhibited a decline. Vegetation recovery decreased with increasing elevation, whilst the largest improvements (i.e., 42%) to vegetation recovery were observed on slopes at elevations ranging from 800 to 1,100 masl (Figure 6B). The maximum ratio of stable vegetation (approximately 93%) occurred on slopes at elevations ranging from 1,100 to 2,000 masl. Areas of degraded vegetation were most common under 800 masl (4.38%), followed by areas over 2,000 masl (1.8%).
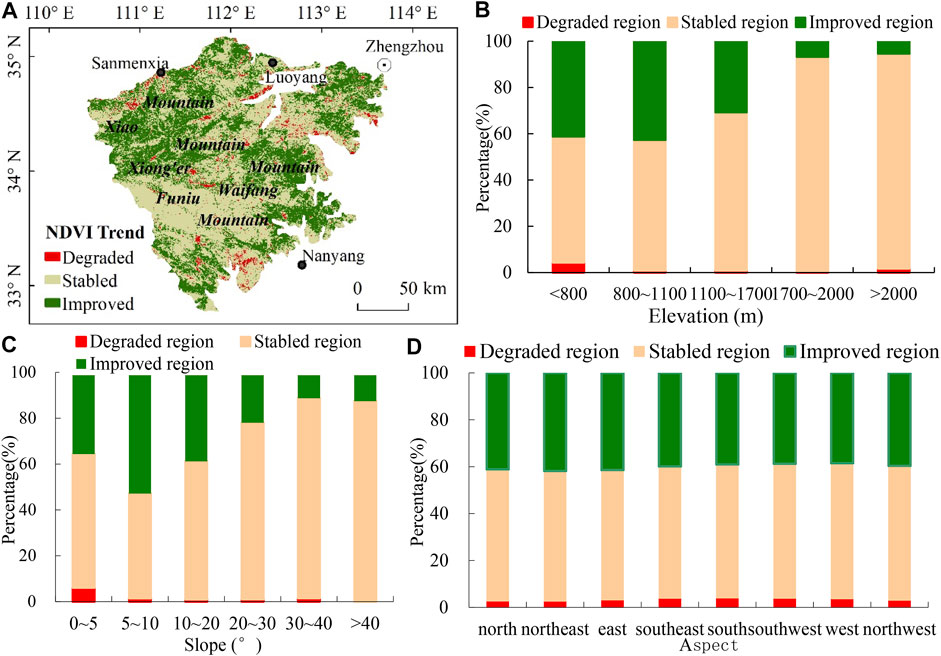
FIGURE 6. The spatial distribution of vegetation classifications (A) and their occurrence at different elevations (B), slopes (C), and aspects (D).
Figure 6C indicates an initial increase in the ratio of improved vegetation which then decreased as a function of slope gradient. Improved vegetation was most common (52.77%) on slopes of 5∼10°. Farmland at this slope gradient was the focus of the Grain for Green Project; hence, the forested area was increased, resulting in vegetation recovery. Degraded vegetation mostly occurred (6.07%) on slopes of 0∼5° partly resulting from the impact of urbanization in recent years. Slope aspect did not markedly influence vegetation state (Figure 6D). Areas of improved, stable, and degraded vegetation accounted for 38∼42, 55∼58, and 2.5∼4% of the land surface under different aspects, respectively.
NDVI Responses to Temperature and Precipitation
The spatial distribution of annual average temperature and precipitation for each grid is shown in Figure 7. Mean annual temperature values from 2000 to 2017 ranged from 6.35 to 16.91°C. Most grids in the northwest fell under a low range of values (6.35∼12.05°C). Grids with temperature values ranging from 13.42 to 16.91°C were mainly concentrated in the southern and northeastern parts of the region (Figure 7A). Mean annual precipitation values from 2000 to 2017 ranged from 341.92 to 1125.17 mm across the entire study area, whilst grids with precipitation values ranging from 517.69 to 900.07 mm occupied most of the region. Grids with high precipitation values ranging from 900.07 to 1125.17 mm were mainly distributed on the southern slope of Funiu Mountain. Low precipitation values were always located in the northern and southern most areas (Figure 7B).
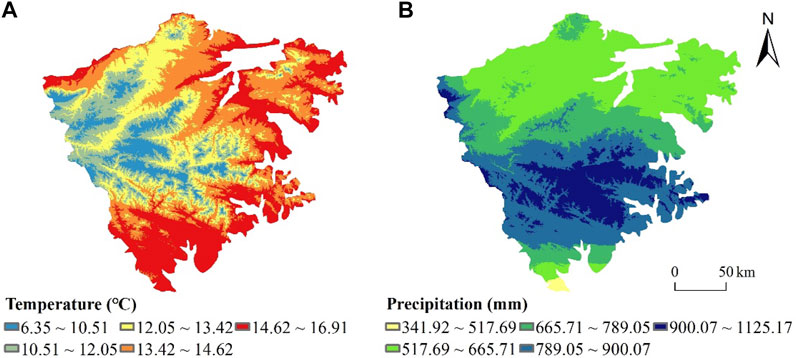
FIGURE 7. Spatial patterns of annual average temperature (A), annual average precipitation (B) from 2000 to 2017.
Figure 8 indicates temperature and precipitation anomalies during the study period. Temperature anomalies showed an upward trend of 0.236°C per decade (p < 0.05). The highest (lowest) annual average temperature was 14.02°C (13.27°C) in 2006 (2001) (Figure 8A). Conversely, precipitation anomalies showed a downward trend of −61.255 mm per decade (p > 0.05). The highest (lowest) annual average precipitation was 983.3 mm (486.9 mm) in 2003 (2013) (Figure 8B).
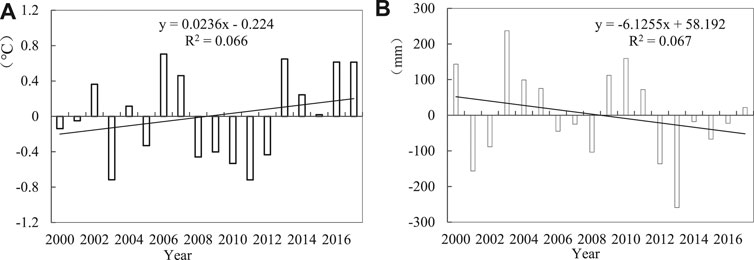
FIGURE 8. Temperature (A) and precipitation (B) anomalies with trends over time.
The spatial distribution pattern of the partial correlation coefficient between NDVI, annual temperature and precipitation is shown in Figure 9. The partial correlation coefficient between NDVI and temperature is -0.52∼0.47 and the regional mean is -0.03. NDVI is shown to be negatively correlated with temperature primarily in the northwestern, northeastern, and southern regions. The most significant negative correlation (p < 0.1) was found in the southwestern and northeastern parts of the study area. The area which exhibited a positive correlation between NDVI and temperature was relatively small (0.9%, p < 0.1), and was restricted to the northwest. The partial correlation coefficient between NDVI and precipitation is -0.53∼0.51 (mean: 0.05). The northeastern, southwestern and eastern parts of the study area are shown to exhibit a negative correlation. Conversely, a positive correlation between NDVI and precipitation is evident around the northwestern, southeastern and northeastern parts of the study area.
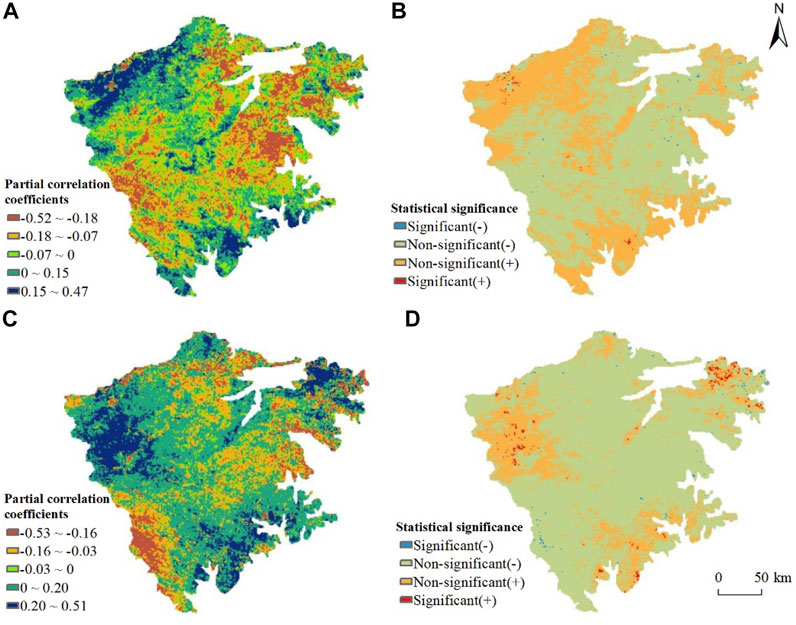
FIGURE 9. Partial correlation coefficients between NDVI and temperature (A), precipitation (C); and statistical significance of the correlations between NDVI and temperature (B), precipitation (D).
NDVI Response to Terrain Factors
Table 1 indicates the relationship between NDVI, temperature and precipitation for different elevations, slopes and aspects. As elevation increased, the correlation between NDVI and temperature gradually adjusted from negative to positive. The correlation between NDVI and precipitation was generally positive, but notably the correlation was stronger at lower elevations where vegetation has been enhanced by cultivation. For all measured slope gradients, there was a negative correlation between NDVI and temperature. The correlation decreased as slope gradient increased at first and then strengthened slightly. Overall, there was a positive correlation between NDVI and precipitation with slope. The relationship was found to be weakest for slope gradients of 10∼40° where precipitation peaked. This then strengthened when the slope exceeded 40°. In terms of aspect, the correlations between NDVI, temperature and precipitation were negative and positive, respectively. No variations in the response of NDVI to slope aspects were observed.
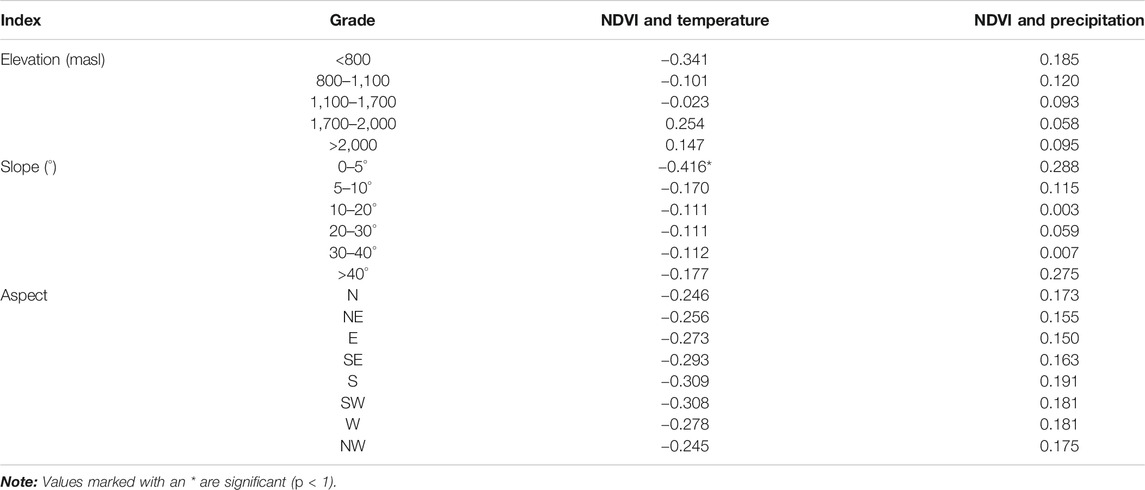
TABLE 1. Correlation coefficients for NDVI with temperature and precipitation at different elevations, slopes, and aspects.
Discussion
This study has presented a detailed investigation of the response of vegetation cover to temperature and precipitation changes in the western Henan region from 2000 to 2017. As such, our results are instructive for informing governmental policy concerning green development planning.
Existing literature on the dynamic changes of mountain vegetation in western Henan primarily use the Maximum Value Composite (MVC) method to process MODIS-NDVI data. However, this fails to completely remove the noise points in the time series data, which can distort otherwise noise-free pixel values. In this study, the S-G filtering algorithm in TIMESAT 3.2 was used to: (i) perform time-series reconstruction on MODIS-NDVI data; (ii) remove noise points; and (iii) extract the phenological information from the pixels to ensure the reliability of the growing season NDVI and justify its application to characterize extent of surface vegetation cover. NDVI is thus an important indicator of the status of a landscape (i.e., degraded, or stable) in mountainous areas. This study demonstrated that the NDVI trends between 2000 and 2017 exhibited large fluctuations. Vegetation growth is closely related to prevailing hydroclimatic conditions which are then reflected in changes in NDVI. The eco-environment in the region has improved significantly since the implementation of the Returning Farmland to Forest Program from 2000, yielding a greening trend comparable with that observed in Eurasia and Northern China (Sun et al., 2015; Zhu et al., 2019). In addition, human activities sometimes have negative effects on vegetation change, such as periodic logging of economic forest and timber forest, which may also be an important reason for the large interannual fluctuation of NDVI.
Vegetation growth is highly dependent on terrain via its effects on temperature, precipitation, soil and nutrient availability etc. (Pei et al., 2019). The minimum NDVI value (0.606) which occurred below 800 m can be attributed to human activities such as urban construction, mining, road and water infrastructure development. In areas above 2,000 m NDVI showed a downward trend due to declining temperature. NDVI exhibited an increasing trend with slope up to 20°, above which poor soil conditions unfavorable to vegetation growth resulted in lower NDVI values. The different trends in NDVI between the southern and northwestern slopes can be attributed to the fact that the southern slopes are mainly dominated by cultivated lands, while forests are mainly located on the northwestern slopes. The changing NDVI trends were significant for slopes at elevations less than 1,700 masl due to the influence of human activities. Policies including the Returning Farmland to Forest Program and grassland and afforestation subsidies improved vegetation coverage below 1,700 masl. Conversely, the small changes in NDVI trends observed at higher elevations (>1,700 masl) can thus be mainly attributed to climate change.
A large number of studies have shown that climatic factors are important mechanisms responsible for driving vegetation growth and change (Hou et al., 2015; Wang et al., 2015). Temperature and precipitation are the most important factors affecting vegetation changes. Precipitation mainly affects the source of water for plant growth (Buitenwerf et al., 2015; Xu et al., 2019). The NDVI for the entire western Henan area was related to extreme climate and human activities. Correlation analysis shows that the response of NDVI to changes in temperature is more significant than for precipitation in general, though NDVI is still positively correlated with precipitation. Moderate precipitation is optimal to promote vegetation growth, but excessive precipitation would create an anaerobic environment in the root zone (Yang et al., 2015; Fu et al., 2016) causing a reduction in available soil nutrients (Schuur et al., 2001) inimical to vegetation growth.
Changes in vegetation cover are affected by both climate and human activities. Implementation of national ecological protection construction projects (e.g., the Three North Shelterbelt and Returning Farmland to Forests) has led to increased regional vegetation coverage which has yielded a range of ecosystem services (Gao and Yang, 2015; Zhao et al., 2017). However, some studies have suggested that there may be disadvantages associated with afforestation. This negative impact may be one of the important reasons for the sharp decline in vegetation coverage in the Loess Plateau at the beginning of the 21st century. Excessive dependence on afforestation and large-scale ecological planning in arid and semi-arid areas also entails certain risks. Therefore, future research on vegetation growth and climate change must also consider the impacts of human activities on vegetation growth, and quantitatively distinguish these from the impacts of climate change driving changes to vegetation cover.
Some uncertainties remain in this study. First, the temperature and precipitation data were interpolated from meteorological stations. Due to the scarcity of stations in high altitude areas (though the effect of altitude is taken into consideration) the accuracy of interpolation is still not as high as that of NDVI obtained directly via remote sensing. Second, the quantitative grading of the NDVI change trend in this study is based on the characteristics of the mountain vegetation in western Henan. There is also no unified classification standard in the existing literature against which to assess the grading of the NDVI change. Future research should explore the impact of the terrane, microclimate, and human activities on mountain NDVI, in order to guide ecological engineering and mountain vegetation restoration efforts.
Conclusion
In this study, we explored the response of vegetation changes to climate change and the effect of terrain factors (elevation, slope and aspect) on NDVI in the Western Henan Mountain region of China. The results of this study provide an instructive basis for guiding policymaking and legislation pertaining to the protection and restoration of mountain vegetation. In summary:
1) From 2000 to 2017 NDVI changed significantly, exhibiting large fluctuations. NDVI increased at a growth rate of 0.027 per decade (p < 0.05) overall, indicating vegetation conditions have gradually improved. NDVI increased initially, but then decreased as a function of elevation, which was shown to be proportional to slope and independent of aspect. Although the NDVI value showed an overall increasing trend, 19.12% of the areas showed a decreasing trend, interspersing and intersecting spatially, showing significant spatial differences.
2) The positive trend in NDVI gradually decreased as elevation increased and NDVI in the high elevation areas remained stable, which was attributed to vegetation restoration activities below 1,100 m. NDVI positive trends exhibited an initial increase but then decreased as a function of increasing slope. The most significant improvements to vegetation occurred on slopes of 5∼10°, while vegetation degradation peaked on slopes less than 5°. The impact of slope aspect on NDVI trends was not apparent.
3) Temperature and precipitation both have significant effects on NDVI, but the response of NDVI to temperature is more significant. The response of vegetation to climate change at different elevations, slopes, and aspects differed. Increased precipitation at lower elevations was beneficial to vegetation, while higher temperatures promoted vegetation growth at higher elevations. When the slope gradient was low (0∼5°), the negative correlation between NDVI and temperature and the positive correlation between NDVI and precipitation peaked. The response of NDVI to temperature and precipitation for different slope aspects was not apparent.
Data Availability Statement
The raw data supporting the conclusions of this article will be made available by the authors, without undue reservation.
Author Contributions
MZ proposed the method, performed analysis and wrote the paper; JZ analyzed the data; LZ conceived the study. All authors read and approved the final manuscript.
Funding
This research was funded by the Natural Science Foundation of China (41671090).
Conflict of Interest
The authors declare that the research was conducted in the absence of any commercial or financial relationships that could be construed as a potential conflict of interest.
Acknowledgments
This is a short text to acknowledge the contributions of specific colleagues, institutions, or agencies that aided the efforts of the authors.
References
Asam, S., Callegari, M., Matiu, M., and Fiore, G. (2018). Relationship between Spatiotemporal Variations of Climate, Snow Cover and Plant Phenology over the Alps-An Earth Observation-Based Analysis. Remote Sensing 10 (11), 1757. doi:10.3390/rs10111757
Buitenwerf, R., Rose, L., and Higgins, S. I. (2015). Three Decades of Multi-Dimensional Change in Global Leaf Phenology. Nat. Clim Change 5 (4), 364–368. doi:10.1038/nclimate2533
Du, J. Q., Ahati, J., ChenXi, Z., ShiFeng, F., WeiLing, L., JunQi, Y., et al. (2016). Analysis of Vegetation Dynamics Using GIMMS NDVI3g in the Three-Rivers Headwater Region from 1982 to 2012. Acta Prataculturae Sinica 25 (1), 1–12. doi:10.11686/cyxb2015111
Eastman, J., Sangermano, F., Machado, E., Rogan, J., and Anyamba, A. (2013). Global Trends in Seasonality of Normalized Difference Vegetation Index (NDVI), 1982-2011. Remote Sensing 5 (10), 4799–4818. doi:10.3390/rs5104799
Erschbamer, B., Kiebacher, T., Mallaun, M., and Unterluggauer, P. (2009). Short-term Signals of Climate Change along an Altitudinal Gradient in the South Alps. Plant Ecol. 202 (1), 79–89. doi:10.1007/s11258-008-9556-1
Fu, G., Li, S.-W., Sun, W., and Shen, Z.-X. (2016). Relationships between Vegetation Carbon Use Efficiency and Climatic Factors on the Tibetan Plateau. Can. J. Remote Sensing 42 (1), 16–26. doi:10.1080/07038992.2016.1131115
Gao, J. X., and Yang, Z. P. (2015). Restoration of Ecological Functions: Goal and Orientation of Ecological Restoration in China. J. Ecol. Rural Environ. 33 (1), 1–6. doi:10.11934/j.issn.1673-4831.2015.01.001
Gehrig-Fasel, J., Guisan, A., and Zimmermann, N. E. (2007). Tree Line Shifts in the Swiss Alps: Climate Change or Land Abandonment? J. Vegetation Sci. 18 (4), 571–582. doi:10.1111/j.1654-1103.2007.tb02571.x
Geng, L., Wang, X., and Wang, H. (2019). Detecting Spatiotemporal Changes in Vegetation with the BFAST Model in the Qilian Mountain Region during 2000-2017. Remote Sensing 11 (2), 103. doi:10.3390/rs11020103
Habeck, J. R. (1987). Present-day Vegetation in the Northern Rocky Mountains. Ann. Mo. Bot. Garden 74, 804–840. doi:10.2307/2399451
Hemp, A. (2006). Continuum or Zonation? Altitudinal Gradients in the forest Vegetation of Mt. Kilimanjaro. Plant Ecol. 184 (1), 27–42. doi:10.1007/s11258-005-9049-4
Herrmann, S. M., Anyamba, A., and Tucker, C. J. (2005). Recent Trends in Vegetation Dynamics in the African Sahel and Their Relationship to Climate. Glob. Environ. Change 15 (4), 394–404. doi:10.1016/j.gloenvcha.2005.08.004
Hou, W., Gao, J., Wu, S., and Dai, E. (2015). Interannual Variations in Growing-Season NDVI and its Correlation with Climate Variables in the Southwestern Karst Region of China. Remote Sensing 7 (9), 11105–11124. doi:10.3390/rs70911105
Ichii, K., Kawabata, A., and Yamaguchi, Y. (2002). Global Correlation Analysis for NDVI and Climatic Variables and NDVI Trends: 1982-1990. Int. J. Remote Sensing 23 (18), 3873–3878. doi:10.1080/01431160110119416
Jarlan, L., Mangiarotti, S., Mougin, E., Mazzega, P., Hiernaux, P., and Ledantec, V. (2008). Assimilation of SPOT/VEGETATION NDVI Data into a Sahelian Vegetation Dynamics Model. Remote Sensing Environ. 112 (4), 1381–1394. doi:10.1016/j.rse.2007.02.041
Kessler, M. (2000). Altitudinal Zonation of Andean Cryptogam Communities. J. Biogeogr. 27 (2), 275–282. doi:10.1046/j.1365-2699.2000.00399.x
Liu, Y., Wang, Y., Du, Y., Zhao, M., and Peng, J. (2016). The Application of Polynomial Analyses to Detect Global Vegetation Dynamics during 1982-2012. Int. J. Remote Sensing 37 (7), 1568–1584. doi:10.1080/01431161.2016.1142688
Long, J. N. (2003). Diversity, Complexity and Interactions: An Overview of Rocky Mountain forest Ecosystems. Tree Physiol. 23 (16), 1091–1099. doi:10.1093/treephys/23.16.1091
Lunetta, R. S., Knight, J. F., Ediriwickrema, J., Lyon, J. G., and Worthy, L. D. (2006). Land-cover Change Detection Using Multi-Temporal MODIS NDVI Data. Remote sensing Environ. 105 (2), 142–154. doi:10.1016/j.rse.2006.06.018
Nemani, R. R., Keeling, C. D., Hashimoto, H., Jolly, W. M., Piper, S. C., Tucker, C. J., et al. (2003). Climate-driven Increases in Global Terrestrial Net Primary Production from 1982 to 1999. Science 300 (5625), 1560–1563. doi:10.1126/science.1082750
Pei, Z., Fang, S., Yang, W., Wang, L., Wu, M., Zhang, Q., et al. (2019). The Relationship between NDVI and Climate Factors at Different Monthly Time Scales: A Case Study of Grasslands in Inner Mongolia, China (1982-2015). Sustainability 11 (24), 7243. doi:10.3390/su11247243
Peng, D., Zhang, B., Liu, L., Fang, H., Chen, D., Hu, Y., et al. (2012). Characteristics and Drivers of Global NDVI-Based FPAR from 1982 to 2006. Glob. Biogeochem. Cycles 26 (3), 1–15. doi:10.1029/2011gb004060
Pepin, N., Bradley, R. S., Diaz, H. F., Baraer, M., Caceres, E. B., Forsythe, N., et al. (2015). Elevation-dependent Warming in Mountain Regions of the World. Nat. Clim. Change 5 (5), 424–430. doi:10.1038/nclimate2563
Piao, S., Wang, X., Ciais, P., Zhu, B., Wang, T., and Liu, J. (2011). Changes in Satellite-Derived Vegetation Growth Trend in Temperate and Boreal Eurasia from 1982 to 2006. Glob. Change Biol. 17 (10), 3228–3239. doi:10.1111/j.1365-2486.2011.02419.x
Schuur, E. A. G., Chadwick, O. A., and Matson, P. A. (2001). Carbon Cycling and Soil Carbon Storage in Mesic to Wet Hawaiian Montane Forests. Ecology 82 (11), 3182–3196. doi:10.1890/0012-9658(2001)082[3182:ccascs]2.0.co;2
Song, C. (1994). Scientific Survey of the Funiu-Mountain Nature reserve. Beijing: China Forestry Publishing House, 10–11.
Sun, W., Song, X., Mu, X., Gao, P., Wang, F., and Zhao, G. (2015). Spatiotemporal Vegetation Cover Variations Associated with Climate Change and Ecological Restoration in the Loess Plateau. Agric. For. Meteorology 209-210, 87–99. doi:10.1016/j.agrformet.2015.05.002
Tong, X., Wang, K., Brandt, M., Yue, Y., Liao, C., Fensholt, R., et al. (2016). Assessing Future Vegetation Trends and Restoration Prospects in the Karst Regions of Southwest China. Remote Sensing 8 (5), 357. doi:10.3390/rs8050357
Tong, X. (2014). Trends in Vegetation and Their Responses to Climate and Topography in Northwest Guangxi. Shengtai Xuebao/Acta Ecologica Sinica 34 (12), 3425–3434. doi:10.5846/stxb201310162503
Tucker, C. J., Pinzon, J. E., Brown, M. E., Slayback, D. A., Pak, E. W., Mahoney, R., et al. (2005). An Extended AVHRR 8‐km NDVI Dataset Compatible with MODIS and SPOT Vegetation NDVI Data. Int. J. Remote Sensing 26 (20), 4485–4498. doi:10.1080/01431160500168686
Wang, J., Wang, K., Zhang, M., and Zhang, C. (2015). Impacts of Climate Change and Human Activities on Vegetation Cover in Hilly Southern China. Ecol. Eng. 81, 451–461. doi:10.1016/j.ecoleng.2015.04.022
Xu, X., Du, H., Fan, W., Hu, J., Mao, F., and Dong, H. (2019). Long-term Trend in Vegetation Gross Primary Production, Phenology and Their Relationships Inferred from the FLUXNET Data. J. Environ. Manage. 246, 605–616. doi:10.1016/j.jenvman.2019.06.023
Yang, Y., Guan, H., Shen, M., Liang, W., and Jiang, L. (2015). Changes in Autumn Vegetation Dormancy Onset Date and the Climate Controls across Temperate Ecosystems in China from 1982 to 2010. Glob. Change Biol. 21 (2), 652–665. doi:10.1111/gcb.12778
Yang, Z.-p., Ou, Y. H., Xu, X.-l., Zhao, L., Song, M.-h., and Zhou, C.-p. (2010). Effects of Permafrost Degradation on Ecosystems. Acta Ecologica Sinica 30 (1), 33–39. doi:10.1016/j.chnaes.2009.12.006
Yao, Y., Zhang, B., Han, F., and Pang, Y. (2010). Diversity and Geographical Pattern of Altitudinal Belts in the Hengduan Mountains in China. J. Mt. Sci. 7 (2), 123–132. doi:10.1007/s11629-010-1011-9
Yin, G., Hu, Z., Chen, X., and Tiyip, T. (2016). Vegetation Dynamics and its Response to Climate Change in Central Asia. J. Arid Land 8 (3), 375–388. doi:10.1007/s40333-016-0043-6
Zhang, B. P., Tan, Y., and Mo, S. G. (2004). Digital Spectrum and Analysis of Altitudinal Belts in the Tianshan Mountains. J. Mountain Res. 2, 184–192. doi:10.3969/j.issn.1008-2786.2004.02.009
Zhang, J., Zhu, W., Zhao, F., Zhu, L., Li, M., Zhu, M., et al. (2018). Spatial Variations of Terrain and Their Impacts on Landscape Patterns in the Transition Zone from Mountains to plains-A Case Study of Qihe River Basin in the Taihang Mountains. Sci. China Earth Sci. 61 (4), 450–461. doi:10.1007/s11430-016-9158-2
Zhang, J., Zhu, W., Zhu, L., Cui, Y., He, S., and Ren, H. (2019). Topographical Relief Characteristics and its Impact on Population and Economy: A Case Study of the Mountainous Area in Western Henan, China. J. Geogr. Sci. 29 (4), 598–612. doi:10.1007/s11442-019-1617-y
Zhang, R., Ouyang, Z. T., Xie, X., Guo, H. Q., Tan, D. Y., Xiao, X. M., et al. (2016). Impact of Climate Change on Vegetation Growth in Arid Northwest of China from 1982 to 2011. Remote Sensing 8 (5), 364. doi:10.3390/rs8050364
Zhang, X. M., Kelin, W., Yuemin, Y., and Xiaowei, T. (2017). Factors Impacting on Vegetation Dynamics and Spatial Non-stationary Relationships in Karst Regions of Southwest China. Shengtai Xuebao/Acta Ecologica Sinica 37 (12), 4008–4018. doi:10.1016/j.chnaes.2016.12.008
Zhao, A., Zhang, A., Lu, C., Wang, D., Wang, H., and Liu, H. (2017). Spatiotemporal Variation of Vegetation Coverage before and after Implementation of Grain for Green Program in Loess Plateau, China. Ecol. Eng. 104, 13–22. doi:10.1016/j.ecoleng.2017.03.013
Zhu, W., and Li, S. (2017). The Dynamic Response of forest Vegetation to Hydrothermal Conditions in the Funiu Mountains of Western Henan Province. J. Geogr. Sci. 27 (5), 565–578. doi:10.1007/s11442-017-1393-5
Keywords: growing season NDVI, climate change, green development, correlation analysis, western henan mountains
Citation: Zhu M, Zhang J and Zhu L (2021) Article Title Variations in Growing Season NDVI and Its Sensitivity to Climate Change Responses to Green Development in Mountainous Areas. Front. Environ. Sci. 9:678450. doi: 10.3389/fenvs.2021.678450
Received: 09 March 2021; Accepted: 11 May 2021;
Published: 25 May 2021.
Edited by:
Qingxiang Li, Sun Yat-Sen University, ChinaReviewed by:
Binhui Liu, Northeast Forestry University, ChinaT. P. Sabin, Indian Institute of Tropical Meteorology (IITM), India
Copyright © 2021 Zhu, Zhang and Zhu. This is an open-access article distributed under the terms of the Creative Commons Attribution License (CC BY). The use, distribution or reproduction in other forums is permitted, provided the original author(s) and the copyright owner(s) are credited and that the original publication in this journal is cited, in accordance with accepted academic practice. No use, distribution or reproduction is permitted which does not comply with these terms.
*Correspondence: Lianqi Zhu, lqzhu@henu.edu.cn