- 1Air Quality Research Group, Department of Chemical and Environmental Engineering, Universidad Nacional de Colombia, Bogota, Colombia
- 2Corporación Colombiana de Investigación Agropecuaria (AGROSAVIA), Villavicencio, Colombia
Savanna ecosystems cover ∼20% of the total land surface and account for ∼30% of the terrestrial global net primary production. They are also highly sensitive to climate change, since their carbon (C) sink capacity may decline under rising temperatures and irregular rainfall. These responses, which will define the future climate role of the savanna ecosystems, are currently not well understood. The Colombian Orinoco River basin (“Llanos”) natural savannas are being rapidly converted to agriculture. The impact of this transformation on C fluxes and accumulation is not clear. It is thus urgent to understand the Llanos natural savanna ecosystem services, including their C cycle and underlying mechanisms. Here we report and analyze 2 years of measurements of carbon dioxide fluxes from a naturally-restored (secondary) Llanos High Plains savanna ecosystem, using eddy covariance. Meteorological conditions, particularly rainfall, were quite variable during the measurement period. During the first year of measurements, the savanna was a weak carbon source (35 gC m−2), while during the second year, the system was a comparatively strong carbon sink (−273 gC m−2), despite receiving less rainfall than during the first year. As expected, the savanna net ecosystem exchange (NEE) was highly dependent on global solar radiation, soil water content, and ecosystem respiration. We found that after ∼10 days of nominal drought, i.e., with less than ∼5 mm/day of precipitation, the NEE became highly dependent on drought duration. The ecosystem reached a critical condition of low photosynthetic activity after ∼60 days of nominal drought. Based on these findings, we developed and applied a simple standard meteorology-based model that properly reproduced the observations. Our results indicate that a shift to a climate with similar total precipitation but split into extreme dry and wet seasons might eventually suppress the savanna C uptake capacity.
Introduction
Terrestrial ecosystems sink about one third of the total anthropogenic greenhouse gas (GHG) emissions from industrial activity and land-use changes (Keenan and Williams, 2018). The urgency of climate change mitigation requires these ecosystem services to be understood, quantified, monitored, modeled, and enhanced when feasible. This is particularly important in the tropics, where soil and aboveground carbon accumulation, and other ecosystem services are not sufficiently well understood. Remaining natural ecosystems are severely threatened by pressures of land-use changes, including those related to food and industrial feedstock production. Understanding the functioning and services of natural and restored tropical ecosystems is of paramount importance to conservation efforts and for rational mitigation decision-making.
Savanna ecosystems cover ∼20% of the total land surface and account for ∼30% of the global net primary production (NPP) (Lipsett-Moore et al., 2018). Therefore, they play a very important role in the C cycle; but they are also highly sensitive to climate change, since their C sink capacity is expected to decline under rising temperatures (Bond-Lamberty et al., 2018) and irregular rainfall (Fei et al., 2017). The vegetation of tropical savannas consists of a continuous herbaceous cover of mostly C4 grasses and sedges along with significant but discontinuous cover of C3 shrubs and trees (Walker, 1987). These ecosystems are also characterized by strong rainfall seasonality, which implies periods of significant water stress (Frost et al., 1985). Conversion of savannas into agricultural lands may result in a reduction of its C sink capacity to the extent of changing the ecosystem into a C source. Currently, the global rate of savanna loss is not well-established, but it may exceed 1% per year, approximately twice as fast as that of rainforests. This likely imply carbon dioxide (CO2) emissions at least as large as those arising from rainforest deforestation (Grace et al., 2006).
Savannas cover an area of ∼270 million ha (Mha) in South America, mainly distributed in Brazil (76%), Venezuela (9%) and Colombia (8%). The large areas of savannas are seen as the main alternative to avoid agricultural expansion in tropical areas of greater ecological fragility, such as the Amazon rainforests (López-Hernández et al., 2005). Although most of their soils suffer from physical and chemical limitations to agricultural production (López-Hernández et al., 2005), large areas of South American savannas have been turned into monocultures or pastures (Borghetti et al., 2019). The Colombian Orinoco River basin savannas, also known as “Llanos”, particularly, the flat High Plains region, has also been rapidly transformed into mechanized agriculture. The agriculture expansion of this region is expected to continue (Jimenez et al., this issue) since market demand and government policy for the development of the Llanos High Plains create conditions that encourage investment to take advantage of the agricultural and agrobusiness potential of the region. The Colombian government estimates that 2.8 Mha of the High Plains have potential for agricultural, livestock and forestry use (DNP, 2014).
This agricultural expansion in the Llanos High Plains creates a concern about its impact on the carbon cycle. There are very few reports (Etter et al., 2010) on the C role of the Colombian Llanos savanna ecosystems and a critical knowledge gap on their controlling factors.
San José’s et al. carbon flux measurements in the seasonally-flooded Venezuelan savannas found that their C content increases was mainly due to increases in their woody fraction (San José, 1991; San José et al., 1998a; San José, 2001; San José and Montes, 2007; San José et al., 2014). Regarding the Colombian High Plains savannas (Figure 1A), we found only two studies on GHG fluxes, specifically on soil respiration (Lavelle et al., 2014; Agrosavia, 2017). We found no reports on Net Ecosystem Exchange (NEE) over this essential ecosystem, nor about its response and main environmental controlling factors. Our research addresses the knowledge gap on the Colombian savanna C fluxes by answering the following question: What environmental factors control CO2 exchange in the High Plains savannas?
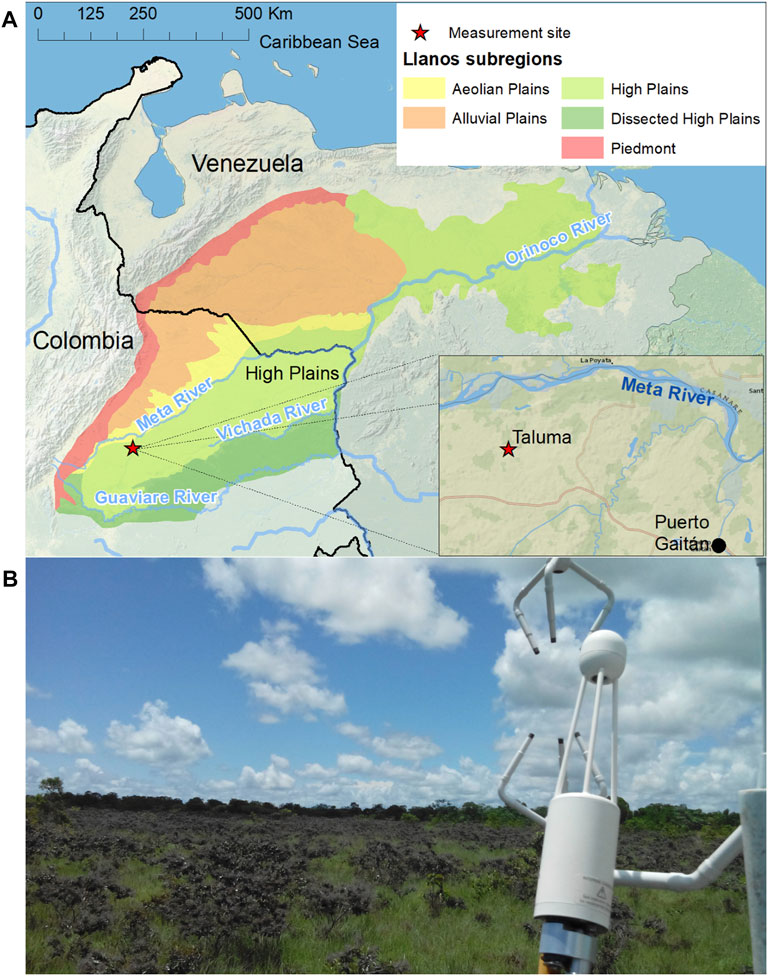
FIGURE 1. Measurement site. (A) General location of the Colombian Orinoco River basin (Llanos), and its geomorphological subregions. (B) Close-up view of the eddy covariance instrument and its main footprint.
In this study, we used the eddy covariance technique to measure the exchange of CO2 between the atmosphere and a naturally-restored tropical, Northern South America savanna ecosystem located in Llanos High Plains. We conducted measurements during two years of very distinct meteorological conditions. The accumulated rainfall during 2016 was significantly higher than during 2017 but the rainfall distribution during 2016 was very anomalous, with an extremely low-precipitation dry season and higher-than-average precipitation during its wet season. Based on our findings, we developed and applied a simple, standard meteorology-based model that properly reproduces the observed CO2 fluxes.
Materials and Methods
Site Description
The Llanos comprises four subregions (piedmont, high plains—flat and dissected, alluvial overflow plains, and aeolian plains), each having different landforms, soil, savanna formations and vegetation patterns. The Llanos westerly wind patterns are synoptically controlled by a Walker-type circulation (Mesa-Sánchez and Rojo-Hernández, 2020), and its climate is highly influenced by the position of the Inter-Tropical Convergence Zone. The precipitation regime is primarily unimodal in most of the region, except for the piedmont, where the regime is bimodal due to the Andes influence (Pulwarty et al., 1998; Pacheco and León-Aristizábal, 2001). There is a decreasing precipitation gradient through the Llanos with a west-to-east axis, with annual precipitations from ∼3,000 mm toward the southwestern Andes foothills in Colombia to 900–1,300 mm in the Orinoco River delta in Venezuela (San José et al., 1998b; Rippstein et al., 2001). Consistently, the dry season length varies from 1 or 2 months in the southwest to 5–6 months in the northeast (Rondón et al., 2006).
The Colombian Llanos cover around 23 Mha (20% of the Colombian continental territory) with altitudes between 80 and 500 m a.s.l., and ecological gradients between the Colombian Andes and the Amazon (Figure 1). Its soils are mostly of low fertility, acidic, with low organic carbon content and toxic levels of iron and aluminum (De la Hoz, 2009). Among other factors, this is the result of their seasonal exposure to floods, droughts, burning and strong winds. The Llanos High Plains, located south of the Meta River in Colombia (∼42% of the Colombian Llanos) are slightly more elevated than the alluvial and aeolian plains, making them much less subject to seasonal flooding. In spite of their low fertility, the Colombian Llanos High Plains, particularly the flat High Plains, are being rapidly transformed into mechanized agriculture.
Measurements were conducted over a unique, large patch of seminatural (native but secondary) savanna located in the Colombian High Plains (Figure 1), specifically at Agrosavia’s Taluma Experimental Station (EC-TS, 4°22′24.10″N, 72°13′19.23″W, 173 m a.s.l.). The patch, naturally transformed back into a High Plains native savanna, is flat, homogeneous, and with enough area to guarantee the quality of the measured fluxes (more than 4 ha). The site has been actively protected from fires, agricultural, and grazing activities for at least the last 20 years. The savanna site is under a monomodal precipitation regime, in which the dry season typically runs from December to mid-March with late March and November as transition time periods (Figure 2). The mean annual rainfall in the region during the last 15 years (2005–2020) was 2,294 mm/yr (1836 mm/yr to 2,607 mm/yr), with almost all the precipitation (∼90%) occurring between april and november (at Hacienda Las Margaritas station; 4°20′26.00″N, 72° 9′22.90″W). The average daily temperature at Taluma was 26.4°C (22.6–31.2°C) and the average daily relative humidity was 82% (48–100%) (based on 3 years of measurements at Taluma weather station—TWS, 4°22′15.06″N, 72°13′39.70″W).
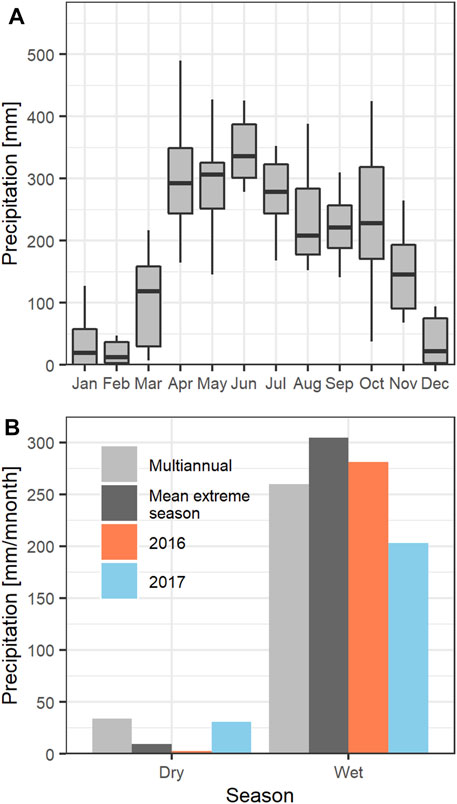
FIGURE 2. Multiannual precipitation patterns for the period 2005–2020. (A) monthly precipitation and (B) comparison of precipitation during the dry (January and February) and wet seasons (April–November) for the multiannual period (2005–2020), the mean extreme season (defined as the 5 years having the highest and lowest precipitation), and 2016 and 2017. December was excluded from the dry season to focus the analysis on the middle and end of the season.
According to studies conducted at Taluma by Agrosavia, the predominant soils are Oxisols (Tropeptic Haplorthox), with a loamy-sandy texture and an average pH of 4.3. These soils are naturally compressed, with an apparent density of 1.53 g cm−3. They are susceptible to compaction and erosion, have low infiltration, low water storage capacity, and are highly vulnerable to mechanization. Macropores account for 3–5%, while mesopores add up to 9–15% of the porous space. Measured calcium (Ca) content of the soils was within 0.05–0.10 cmol kg−1, magnesium (Mg) 0.02 to 0.01 cmol kg−1 at the same depth, and there was a low content of available phosphorus, 1.3 mg kg−1. Minor elements like boron (Bo), copper (Cu) and zinc (Zn) have been found in concentrations lower than 0.5 mg kg−1 (Agrosavia, 2017).
The herbaceous layer in the Colombian High Plains savannas is typically 0.3–1.0 m high (Rippstein et al., 2001). Shrubs are abundant at our site (see Supplementary Figure S1). When these are included, the average canopy height at our measurement footprint was 1.6 m on average. The families Poaceae (grasses), Fabaceae (legumes) and Cyperaceae are the most representative plant families and are endemic to this type of savannas. They are followed by the families Asteraceae (Compositae), Rubiaceae, Labiatae (Lamiaceae), and Melastomataceae. The Poaceae family is the richest in species and its dominant genera are Paspalum, Panicum, Axonopus, and Andropogon. In the Fabaceae family, the genera are better distributed, and in the family Cyperaceae, the dominant genus (in species) is Rhynchospora (Rippstein et al., 2001).
Eddy Covariance and Ancillary Environmental Measurements
Fluxes of sensible heat
A Biomet 101 system (Li-Cor, Lincoln, NE, United States) was used to measure ancillary biometeorological variables at EC-TS. This equipment was available for a limited time (from December 2015 to May 2016) at this site. The measured variables included soil heat fluxes, soil water content, soil temperature, air temperature, humidity, and global, net, and photosynthetic active radiation (PAR). These data were used to validate the simpler Taluma Weather Station (TWS—iMetos 3.3 Pressl instrument, Werksweg, Austria) data. The period when Biomet and TWS measured simultaneously was used for developing correction factors to TWS (see Supplementary Table S1). When Biomet data was not available, the main environmental parameters were measured with TWS.
The variables needed for EC CO2 flux measurements, i.e., the vertical and horizontal wind speed components and the CO2 mixing ratio, along with the virtual sonic temperature, were measured at 10 Hz. The companion, low-frequency meteorological measurements were averaged and recorded at a time resolution of 1 min. Sensors were set up following Munger et al. (2012) guidelines. Measurements were conducted from 2015-12-20 to 2017-12-14. The time series had two large data gaps due to logistical issues: 1) from 2016-10-08 to 2016-12-08 and 2) from 2017-03-08 to 2017-05-05.
Data Processing and Data Assessment
High-frequency data were processed using EddyPro® Version 6.2, (2016). The dataset was split into seven periods with similar meteorological conditions (Supplementary Figure S2). Each of them was processed independently to improve the spectral correction assessment (Morales-Rincon, 2019).
Fluxes were calculated every 30 min. The raw data correction algorithm included the following tests and corrections: 1) hard flag when signal strength was below 70%; 2) statistical screening test (Vickers and Mahrt, 1997); 3) planar fit rotation for anemometer tilt correction (Wilczak et al., 2001); 4) covariance maximization for time lag compensation between turbulent components of wind speed and gas concentration; 5) block-averaging for extracting turbulent fluctuations; 6) density fluctuation compensation (Webb et al., 1980); 7) low-frequency spectral losses (Moncrieff et al., 2005); 8) high-frequency spectral losses (Ibrom et al., 2007); 9) flux random uncertainty quantification (Finkelstein and Sims, 2001); 10) micrometeorological quality assessment (Mauder and Foken, 2004); and 11) footprint analysis with a simple, two dimensional model (Kljun et al., 2015).
The Mauder and Foken (2004) micrometeorological quality assessment evaluates whether the theoretical requirements of EC are fulfilled, using tests for stationarity and integral turbulent characteristics. The results from these two tests were combined to derive a data quality classification into three groups: flag 0, flag 1, and flag 2, which correspond to high-quality, intermediate-quality, and low-quality data, respectively. We only considered the high and intermediate quality data for evaluating fluxes. The data collected during precipitation events were also discarded.
A storage term was added to the CO2 fluxes to account for changes in concentrations within the measurement volume, i.e., under the savanna canopy during the 30 min averaging period (Aubinet et al., 2012). The CO2 storage was estimated from CO2 concentrations and based on a 1-point profile. This technique is based on the assumption that the 30 min changes in concentration at the instrument level are representative of the whole air layer underneath the EC system.
EC measurements can be affected by high-frequency spikes due to fast changes in turbulence conditions, changes in footprint, water droplets on sonic anemometers, and other factors. Although most of the spikes are removed in the high frequency data processing, some anomalous data get into the half-an-hour time series from which the half hourly fluxes are estimated, producing false fluxes. Outlier detection techniques are applied to prevent this from happening (Papale et al., 2006). Two additional data assessment criteria were applied to identify these outliers: 1) coherence or plausibility, and 2) consistency or step test (Vejen et al., 2002; Zahumenský, 2004). For both tests, the evaluation was performed using a customized moving average filter that used a time window size and a signal “amplification” factor as parameters. This filter is described in Section 3 of the Supplementary Material. For coherence, the thresholds for the variables were defined using a long moving time window (7 days) and a vertical amplification factor of 3 times the standard deviation (SD) of data within the window. Data above and below the 3 SDs within the sliding window were flagged as outliers. All fluxes flagged as outliers and their associated variables were discarded (e.g. for
Nighttime Flux Estimation
During nighttime, eddy covariance provides direct measurements of nighttime ecosystem respiration. However, carbon flux measurements can be severely hindered by the low turbulence conditions prevailing at night. The first step to amend this was to identify and discard biased flux data. The filtering methodology proposed by Aubinet et al. (2012) was applied to nighttime data (19:00–05:30 LT), but using the standard deviation of vertical velocity
Once Aubinet’s filter was applied, concerns remained on EC flux measurements of nighttime ecosystem respiration, Reco. Under low wind conditions, CO2 might be stored beneath the measurement plane within the canopy. Some of the stored CO2 might be horizontally transported by advection. Typically, most of the remaining accumulated CO2 is vertically released by turbulence bursts or upon turbulence onset after sunrise. On the other hand, early evening measurements are unlikely to be affected by advection (Van Gorsel et al., 2007), and can be considered representative of nighttime fluxes. San José et al. (2014) chamber measurements over a similar Llanos savanna ecosystem showed that nighttime soil respiration fluxes did not change much along the night, and that the daytime ones were comparable in magnitude although more variable along the day. We did not find any significant correlation between nighttime respiration fluxes and soil temperature. In absence of better information, we assumed that respiration did not vary within a day, and that this flux was identical to the nighttime one. Following San José et al. (2014) and as per our discussion above, Reco was assumed to be constant and estimated as the median of the early night (19:00–20:30 LT) fluxes corrected by storage. At our Equatorial site, sunset and sunrise times, and thus the length of the day, change by less than 30 min along the year. Therefore, we defined nighttime as the time period from 19:00 to 05:30. Solar radiation during this time period is well below 10 W m−2 throughout the year (see Supplementary Figure S4).
As valid nighttime data was sometimes unavailable, and to ensure the representativeness of the nighttime respiration median, a wing-variable time window (from 3 to 13 days) was used to guarantee having at least 30% of the possible data of the window. Also, in the processed CO2 flux time series, the nighttime period (19:00–5:30 LT) data were substituted by the calculated, constant Reco. The uncertainty of the respiration and nighttime fluxes was estimated as the standard deviation (SD) of the data used to calculate the flux.
Seasonal and Daily Cycle of Carbon Fluxes
We used the Mitscherlich light response curve (LRC, Eq. 1; Falge et al., 2001) to investigate the savanna ecosystem CO2 flux variability and controlling factors. The LRC fitting for each day included the daytime (06:00–17:00 LT) NEE data of that day along with that of the immediately previous and next days. For Reco, we used nighttime respiration of that day derived from its early-evening fluxes as explained above. Occasionally, Reco was directly estimated from the LRC model fitting when the early evening method failed to produce a Reco estimate.
Since PAR measurements were available at the site for a limited period of time only, global radiation (Rg) was used instead of PAR. These two variables were highly correlated (see Supplementary Figure S6), which allowed for the replacement of the original variables α (µmol CO2 µmol (photons)−1) and PAR (µmol (photons) m−2 s−1) for β (µmol CO2 J−1) and Rg (W m−2), respectively. CO2 fluxes during the 2016-03-15–2016-03-19 period were excluded from the LRC analysis as they did not follow the LRC expected behavior (low or positive NEE when negative was expected).
LRC was further refined to account for the NEE limitation due to stomatal closure, modeled using Eq. 2, where the vapor pressure deficit (VPD) was calculated from RH and Ta, according to Campbell and Norman, (1998). We initially used a
Gap Filling
Besides statistical analysis, the main reason for filling gaps was the proper estimation of carbon accumulation or loss by the ecosystem over extended periods of time. Daytime and nighttime gaps were tackled separately. For nighttime, the gaps in the Reco time series (as described in )Section Nighttime Flux Estimation were filled as described in Section Seasonal and Daily Cycle of Carbon Fluxes. A five-method, gap-length dependent recipe was implemented for daytime gaps:
(1) Linear interpolation for gaps shorter than 1 h (Falge et al., 2001).
(2) Mitscherlich LRC model (Falge et al., 2001), incorporating Eq. 1 and Eq. 2, or only Eq. 1 when the mathematical method did not converge for the two equations.
(3) The method proposed by Reichstein et al. (2005) was used for similar meteorological conditions (SMC) (only the filling quality A was used).
(4) A modification of the SMC method (SMCM) that included time and vertical moving windows and used the median as a central tendency estimator, was also used. Time windows of 7 or 15 days were used. The criterium for not increasing the time window length was to have at least 5 data points to calculate statistics. Vertical windows were 20, 40, 60, 80 and 100% of the following defined thresholds: Rg = 50 W m−2, air temperature (Ta) = 2.5°C, VPD = 5 hPa. (Reichstein et al., 2005).
(5) A modification of the mean diurnal variation method (MDV, Falge et al., 2001) that used a moving time window to guarantee at least 30% of the possible data within the window, was also used. These procedures were run twice to fill long gaps.
Data gap filling methods were selected as per the following sequence: method 1); method 2); the least uncertain resulting from methods 3) and 4); and finally, method 5). The flux uncertainty was calculated for each method as follows: linear interpolation of the flux random error for method 1); residual standard error of the LRC model for method 2); and standard deviation of the data within the time window for methods 3), 4) and 5).
Results
Meteorological Conditions
The meteorological conditions, particularly rainfall, were quite variable during the measurement period (Figure 2). Our measurements began in the 2016 dry season, during which precipitation was 93% lower than the long-term average (34 mm/month for the 2005-2020 period), as estimated from a meteorological station located at ∼7 km east from our site (Hacienda Las Margaritas). Moreover, the precipitation during the 2016 dry season was 73% lower than the average for the five driest years of the 2005–2020 time period (9.3 mm/month). No rain (0 mm) was observed during January 2016. Only 5 mm were observed during February 2016. Conversely, during the 2016 wet season the precipitation was 8% higher than the long term-average (259.9 mm/month). This likely implies that the ecosystem experienced high stress during both seasons, due to severe drought during the dry season, and higher-than-normal precipitation during the wet season.
Precipitation during the 2017 dry season (30.5 mm/month) was very close to the long-term average, but during the wet season was 22% lower than the long-term average (259.9 mm/month) (Figure 2B).
Seasonal and Daily Cycle of Carbon Fluxes
Figure 3 shows the half-hourly resolved, 3-consecutive-day CO2 flux time series during three contrasting periods: 1) the beginning of the dry season (Figure 3A), 2) wet season (Figure 3B) and 3) extreme dry season (Figure 3C). During the first period, the ecosystem served as a net carbon sink (daily NEE ranged from −0.77 to −1.40 gC m−2 d−1). Measured nighttime ecosystem fluxes were highly variable, likely due to intermittent turbulence CO2 flushing. Nighttime fluxes estimated from periods of nearly constant flux early in the night, showed ecosystem respiration fluxes of ∼4.6 µmol CO2 m−2 s−1. During the second period, the ecosystem also served as a slightly less effective net carbon sink with daily NEE ranging from −0.74 to −1.03 gC m−2 d−1. Ecosystem respiration during this period was slightly higher than respiration during the first period. During the third period, the ecosystem was a carbon source with daily NEE ranging from 0.49 to 0.82 gC m−2 d−1. The ecosystem respiration (∼1.8 µmol CO2 m−2 s−1) was almost a factor ∼3 smaller during this period than during the two other periods.
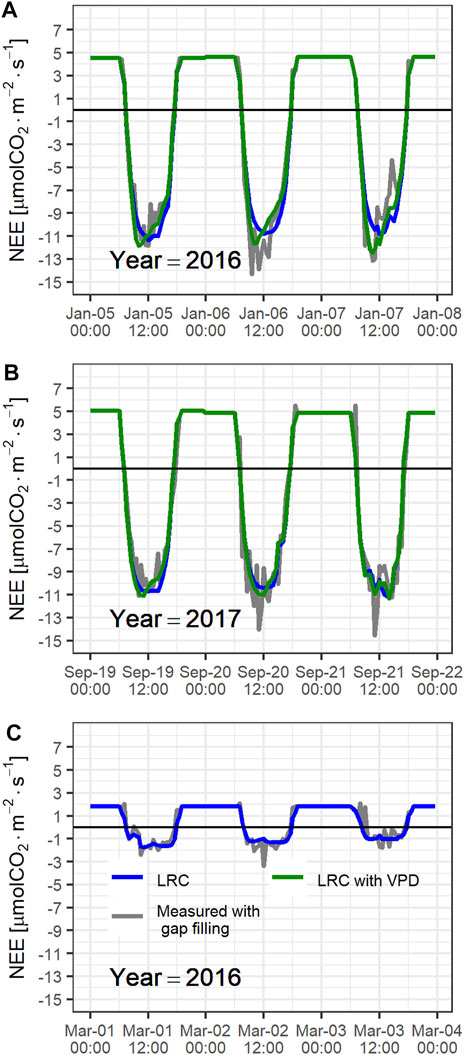
FIGURE 3. Daily cycle of carbon fluxes (NEE) for 3 consecutive days during (A) early in the dry season of 2016; (B) the wet season of 2017, and (C) late in the dry season of 2016. Half-hourly fluxes after gap filling procedures are shown in gray, light response curves adjusted for each day are shown in blue, and light response curves adjusted for each day including VPD effects are shown in green.
Figure 3 also shows the fitted LRC model for each day with Eqs 1, 2, and without VPD adjustments (i.e. with Eq. 1 only). Although both models represent quite well the NEE daily cycle, the model that considers stomatal closure, based on VPD, represents better the NEE peak, especially during the beginning of the dry season. In contrast, the VPD-adjusted model underperformed the simpler LRC model, i.e., without stomatal closure, for most part of the late 2016 dry season.
Figure 4 shows the weekly-averaged CO2 fluxes, ecosystem respiration (Reco), daily carbon accumulation (i.e., cumulative NEE), and precipitation. There were significant differences between the monthly NEE of 2016 and 2017. Overall, the largest continued carbon uptake occurred during the beginning of the dry seasons, mainly during December and January. NEE interannual differences among late dry seasons and the wet seasons appear to be highly influenced by differences in precipitation distribution between the two years.
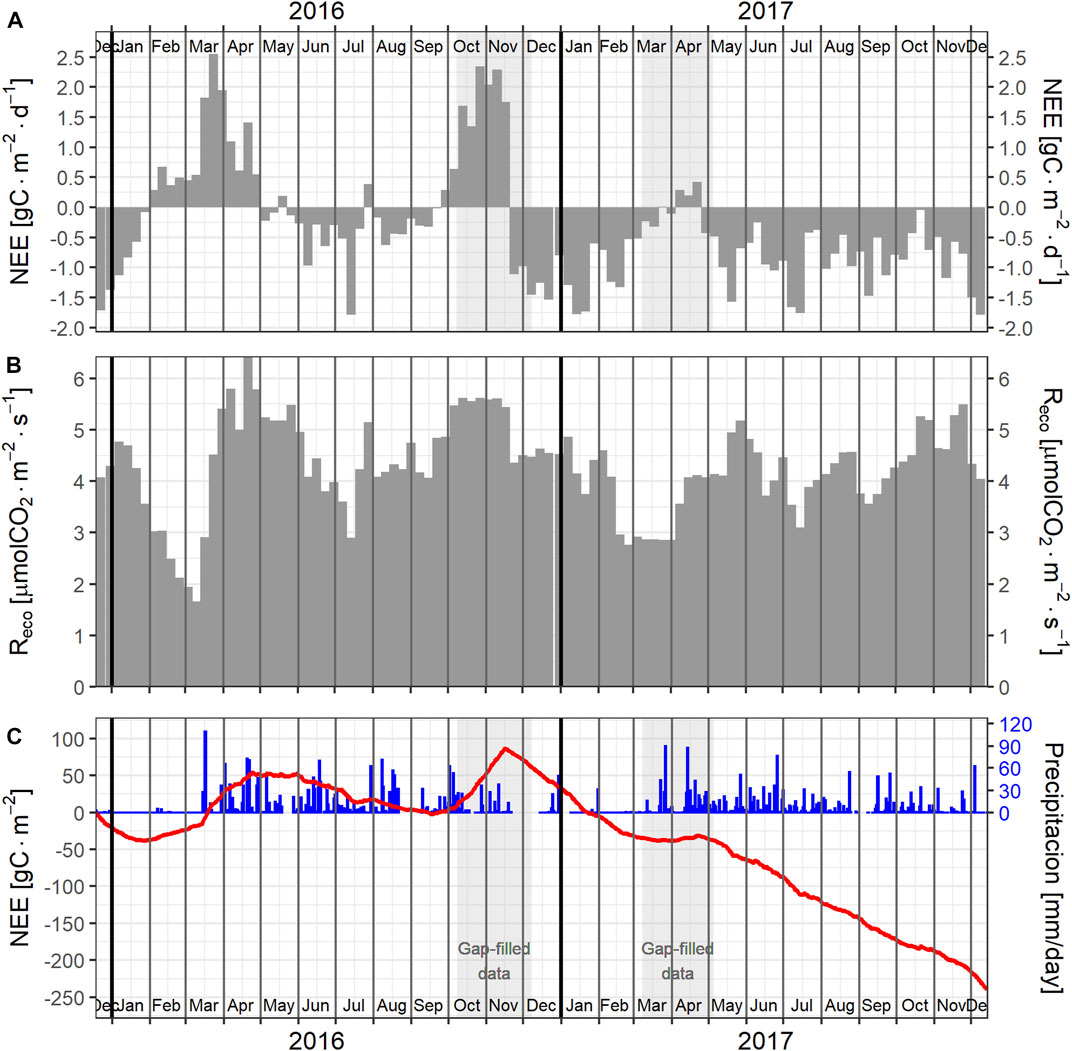
FIGURE 4. Carbon fluxes, ecosystem respiration, and cumulative NEE. (A) Weekly average of daily carbon fluxes, (B) weekly average of ecosystem respiration, (C) cumulative NEE since the beginning of measurements (red) and daily precipitation (blue).
During 2016, as the dry season progressed with almost no rain between January and middle March, a systematic decrease in NEE was observed. During February 2016, the ecosystem became a carbon source and maintained that condition until the end of april, almost one month after the beginning of the wet season. After the first precipitation events in middle March, there was an increase in ecosystem respiration that resulted in NEE levels within 1.5–2.5 gC m−2 d−1 during the two weeks that followed the precipitation events. Between May and September 2016, the ecosystem acted as a carbon sink during most of the weeks, but had much less carbon uptake than during the same period of 2017. During late September, the ecosystem decreased its carbon uptake, turned into a carbon source, and maintained that condition until middle November. No data was obtained during the period October 8–December 8 due to logistic problems. Data presented for that period corresponded to estimations based on gap filling procedures taking into account the data trends near that gap. During 2017, the ecosystem was a carbon sink during most of the weeks. Variability in ecosystem respiration significantly contributed to NEE variability. The savanna ecosystem acted as a small carbon source during 2016 (NEE = 35 gC m−2), and as a significant carbon sink during 2017 (NEE = −273 gC m−2; from 2017-01-01 to 2017-12-14, i.e. 17 days short).
Figure 5 shows the 2016 and 2017 monthly averaged daily CO2 flux and VPD profiles. The monthly precipitation data for each year (P16 and P17) and the accumulated precipitation since January of the year (PC16 and PC17) are also shown. Large differences are observed between the 2016 and 2017 CO2 flux profiles during the dry season with substantially lower CO2 uptake during the drier months of 2016 (January-February) compared to 2017. The anomalous CO2 fluxes during the 2016 dry season are also consistent with larger vapor pressure deficits that year compared to 2017. As the dry seasons progressed, the carbon uptake decreased in spite of decreasing VPD in march. Conversely, precipitation during april was 32% greater in 2016 compared to 2017. This resulted in significantly higher respiration in april 2016 compared to april 2017. At the beginning of the wet season, although the diurnal carbon uptake increased, there was also an increase in ecosystem respiration that resulted in positive carbon fluxes during april. Precipitation during the wet season was higher in 2016 than in 2017. With the exception of May and September, all the wet season months were wetter in 2016 compared to 2017. The 2016 annual accumulated precipitation ended up being 428 mm higher in 2016 compared to 2017. As the wet season progressed the differences between 2016 and 2017 diurnal carbon fluxes started to increase, due to a systematic decrease in the 2016 ecosystem carbon uptake.
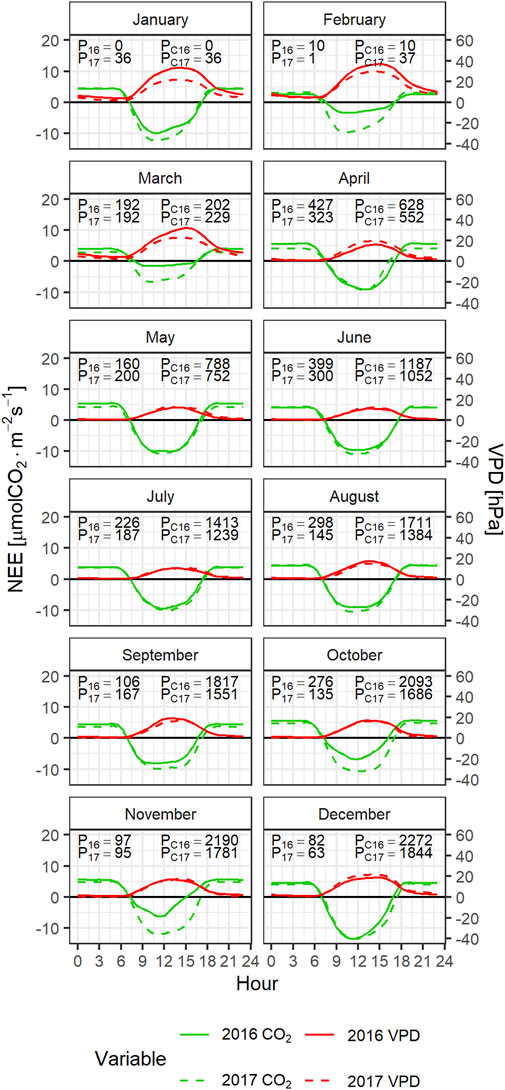
FIGURE 5. Mean daily profile of CO2 fluxes and VPD by month during 2016 (red) and 2017 (green). Each panel shows the monthly precipitation during each year (P16 for 2016 and P17 for 2017) and the accumulated precipitation from January to each month (PC16 and PC17).
Environmental Controls on CO2 fluxes
The results above clearly show that the savanna CO2 fluxes and cumulative NEE are highly dependent not just on the total annual and monthly precipitation, but particularly on its temporal distribution, and that this dependence is a non-trivial one. While precipitation in 2017 was 19% lower than in 2016, the net C uptake in 2017 was far higher than in 2016. To understand the impact of drought severity on the functioning of the savanna ecosystem, we first explored the CO2 flux dependency on accumulated precipitation over variable accumulation period lengths. No clear correlation was found. Instead, we found a very compact dependence of NEE on an indicator of nominal drought. This indicator was defined as the consecutive number of days without effective precipitation. We found that a minimum precipitation of 5 mm/day minimizes the spread of the NEE—nominal drought indicator relationship. The drought indicator is thus the consecutive number of days with less than 5 mm/day of precipitation. Figure 6 shows the daily CO2 fluxes as a function of this indicator. It clearly shows that the carbon uptake decreases monotonically but non-linearly from 10 days of nominal drought on. The ecosystem becomes a carbon source after ∼40 days of nominal drought.
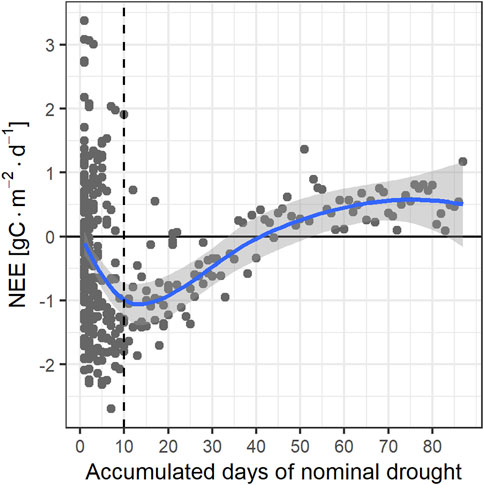
FIGURE 6. Relationship between carbon fluxes and accumulated days of nominal drought (defined as precipitation < 5 mm/day).
The effects of drought on the ecosystem were also evident on the light-response curve parameters. Figure 7 shows the NEE at light saturation
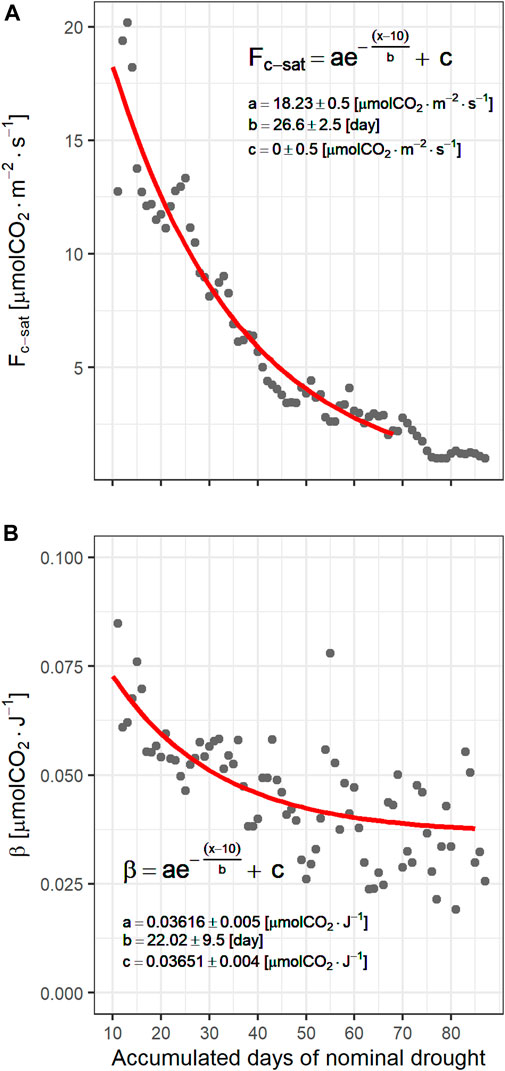
FIGURE 7. Dependence of (A) NEE at light saturation (
There was also high variability in ecosystem respiration. During the dry season, Reco displayed a statistically significant dependence on VPD, with lower respiration rates at larger VPD values (Figure 8). This dependency was represented by a logistic curve. The Reco dependence on drought could be better described by soil water content (SWC), but this variable was unavailable for much of the measurement campaign. These interrelations are further confirmed by the good correlation between VPD and SWC during the dry season (Supplementary Figure S8).
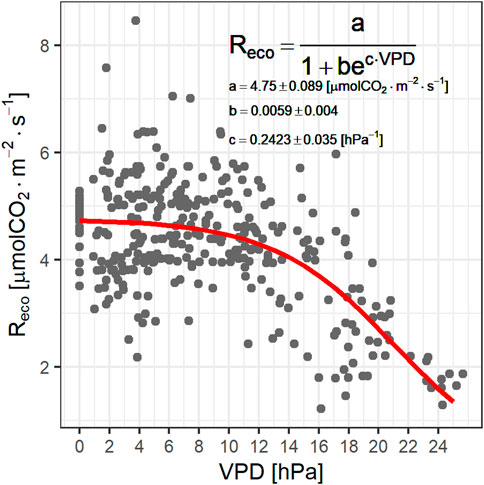
FIGURE 8. Relationship between ecosystem respiration and VPD. Coefficient uncertainties are ±1 standard deviation (68% CI).
Discussion
Effect of Meteorological Factors on Carbon Fluxes
We observed high variability in monthly carbon fluxes and ecosystem respiration during our two years of measurements. During the two wet seasons and the early dry seasons, i.e. when the ecosystem had enough water, the maximum hourly NEE levels were rather similar, and the carbon fluxes were controlled by solar radiation. As the dry seasons progressed, long periods of low precipitation were experienced leading to decreasing water availability. These reduced the ecosystem gross primary productivity (GPP) but also its respiration. The reduction of respiration was insufficient to counterbalance the GPP reduction, thus the drought resulted in a systematic decrease of NEE, which seasonally turned the ecosystem into a carbon source.
Light response curves properly described the savanna carbon fluxes at the daily scale. This representation of diurnal fluxes by the LRC model was improved when
Ecosystem respiration was highly variable and dependent on VPD, particularly during the dry season. At the end of the dry season, heterotrophic respiration was inhibited by the very low soil water contents. Then, we observed a significant increase in ecosystem respiration during the dry to wet season transition. This is likely explained by the occurrence of CO2 respiration bursts upon moistening of dry soil, known as the Birch effect (Birch and Friend, 1956; Griffiths and Birch, 1961). This is a complex phenomenon that results from rapid stimulation of microbial activity, reproduction and growth from sudden increase in soil water (Ma et al., 2012). The Birch effect has been previously reported in African (Williams et al., 2009) and other Orinoco savannas (San José et al., 2014).
Based on these findings, we developed a simple NEE light-response curve (LRC) model, all the variables of which can be calculated from basic meteorological measurements (precipitation, global radiation, temperature, and relative humidity). Functions of these variables properly represent the effects of stomatal closure and drought duration on the ecosystem NEE and respiration. After testing various modeling variants, we found that the incorporation of the drought effects into the model was essential to properly represent the ecosystem C accumulation. We also found that, if ecosystem functioning was not limited by water availability, its C exchange could be reasonably well-represented by a single set of LRC parameters, i.e., for the non-drought conditions experienced during the wet and early dry seasons. An ad hoc model is then used to incorporate the water limitation effects on NEE, using the drought duration models explained above.
The proposed LRC-drought model used two sets of parameters. The first set of parameters (
It is very important for a C flux model, either simple, as the one described above, or complex as DNDC (DeNitrification-DeComposition model) to be as bias-free as possible. Otherwise, even a small bias at the hourly or daily time scales may lead to a significantly biased estimation of the C accumulation over extended periods of time (years to decades). Therefore, although the drought – no-drought model presented above reproduces the hourly C fluxes quite well, it is necessary to assess its ability to reproduce the longer-term C accumulation. Figure 9 shows the measured carbon accumulation (black trace), along with several estimated variants: 1) “Daily LRC”:LRCs fitted on a daily basis using VPD when was possible (red trace); 2) “Generalized LRC”: single set of parameter for LRC ignores drought and stomatal closure effects (blue trace); 3) “Generalized LRC with VPD”: single parameter set for LRC incorporates stomatal closure effects (VPD function) but ignores drought effects (orange trace); 4) “Generalized LRC with drought effects”: drought-no-drought LRC-based model explained above incorporates drought instead of stomatal closure effects (green trace). None of the generalized LRC models (i.e. models 2–4) was able to properly reproduce NEE during the 2016 dry to wet season transition nor during the 2016 extreme precipitation period (see Figure 9A). This suggests that soil processes play a major yet complex role in the ecosystem C exchange during rapid transitions to high soil humidity conditions. Due to their complexity, these periods were excluded from the modeled C accumulation comparison. Incorporating stomatal closure effects into the light-response curve (“Generalize LRC with VPD”) improves the ability of the model to simulate the accumulated carbon dynamics, particularly during the dry season; but the model has a significant bias and poor performance. The “Generalized LRC with drought effects” model constitutes a significant improvement with both a better dynamic representation and a much smaller bias. This model was able to reproduce carbon accumulation during the extreme 2016 dry season, the 2017 dry season, and the 2017 wet season.
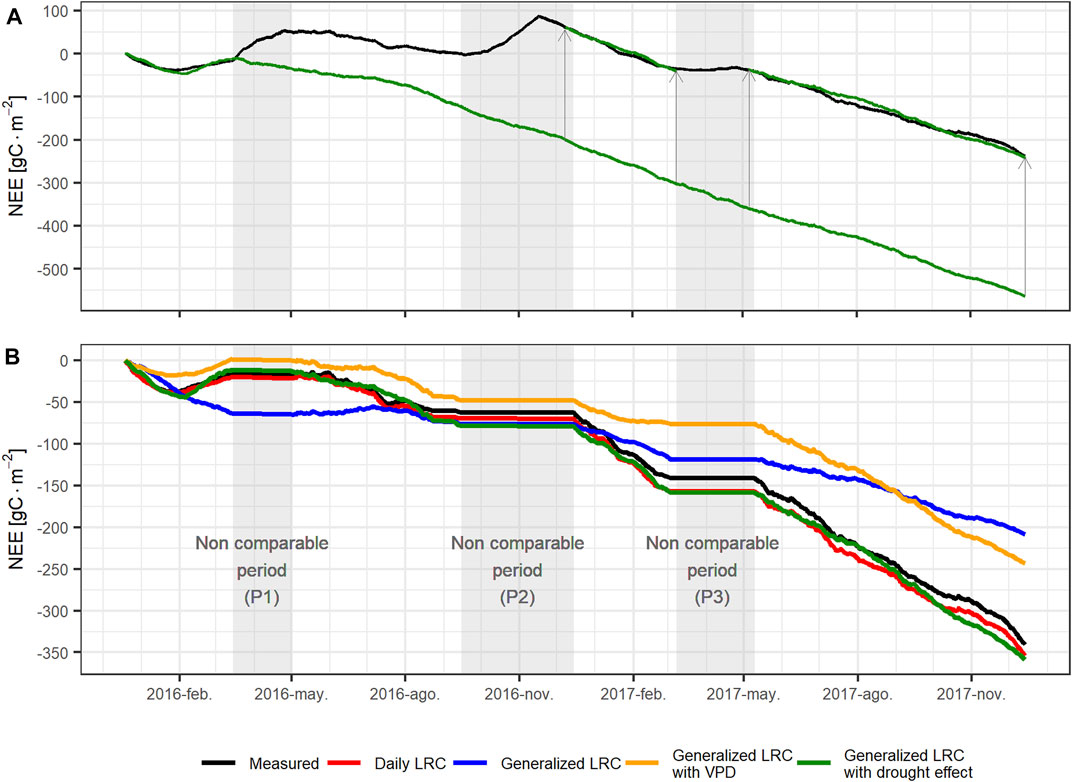
FIGURE 9. Comparison of measured carbon accumulation and model variant estimations: (A) measured carbon accumulation (black) and generalized LRC with drought effects (green) (see text for details) the entire measurement period; (B) Comparison excluding unavailable data and dry to wet season transition periods (gray shade). Along with observations (black), this comparison includes the following models: daily LRC (red), generalized LRC (blue), generalized LRC with VPD (orange), and generalized LRC with drought effects (green).
Carbon Storage and Climate Change Mitigation
There were large differences in net carbon fluxes between 2016 and 2017. During 2016 the ecosystem acted as a net source (annual NEE of 35 gC m−2) during a year characterized by a severe dry season followed by extreme precipitation during the wet season. During 2017, the savanna served as a carbon sink with an annual NEE of −273 g C m−2. Although annual precipitation during 2017 was lower than during 2016, the average precipitation during the 2017 wet season was high enough to provide ecosystem water requirements, which resulted in high ecosystem productivity. This change of carbon sink to carbon source was also observed in a grazed savanna ecosystem in South Africa (Räsänen et al., 2017), where the annual NEE changed from -85–139 g C m−2 and the magnitude and direction of NEE was reported to be related to water stress and precipitation distribution rather than annual precipitation. Specifically, NEE was found to be highly dependent on the number of days when soil moisture was higher than 7%.
The annual C uptake measured during 2017 was similar to the annual NEE of Campo Sujo savannas (−288 g C m−2), an open shrub savanna with scattered shrubs similar to the Llanos High Plain savannas (Santos et al., 2003). Th annual C uptake reported for the Venezuelan Llanos were lower than our measured 2017 NEE (−6, −116 and −139 gC m−2 yr−1 for an herbaceous savanna, a tree savanna and a woodland savanna, respectively; San José et al., 2008). The savanna vegetation in our study could be considered similar to the herbaceous and tree savanna measured by San José et al. (2008). However, the dry season is longer in the Venezuelan savannas than in Colombian High Plains and Campo Sujo, which may explain the lower carbon uptake in the Venezuelan savannas.
The Colombian Llanos High Plains (9.7 million hectares—Mha) have undergone significant transformation. Etter et al. (2010) estimate that 21% of the High Plains savannas had been cleared for agriculture by 2010. The same study also estimates that an additional ∼10% of the High Plains savannas would be cleared by 2020. The clearing of the Dissected High Plains savannas was estimated to be lower (∼10% until 2010). Overall, more than 5 Mha of savannas are currently reported as being used for cattle grazing in Meta and Vichada, the two Colombian Provinces (Departmentos) that host the High Plains region. Colombia’s Nationally Appropriate Mitigation Actions (NAMA) for the livestock sector have set an emissions reduction goal of 11.15 Tg CO2-eq/year (11.15 Mton CO2-eq/yr) by 2030. One of the mitigation measures is land restoration. During our 2 years of observations, including a very anomalous one, the native savanna accumulated ∼2.5 ton C/ha. Considering this carbon sequestration capacity, we feature a simple scenario in which 10% of the area currently used for cattle grazing is left alone, so it naturally restores. We estimate that this action alone might sink ∼1 Tg CO2-eq/yr, i.e., 10% of the NAMA’s emission reduction goal by 2030. This estimation is based on the assumption that a 10-year period would be composed of two cycles as follow: 1-year cycles of benign meteorological conditions, meteorologically and C accumulation-wize similar to 2017, one year of extreme weather, similar to 2016, and three 1-year periods of mild meteorological conditions with 70% of the carbon accumulation measured in 2017. We also considered that during the restoration process, the carbon uptake capacity of the ecosystem would increase from 10% of the above-mentioned capacity to 55% during the 10th year (a 5% per year increase rate). Based on these assumptions, the restored ecosystems could uptake 1.8 Tg CO2-eq/year by 2050.
Conclusion
This research reported carbon dioxide flux measurements in a Northern South America tropical naturally restored savanna ecosystem located in the Llanos High Plains, using the eddy covariance technique. Besides quantifying the CO2 flux in this ecosystem (not previously reported in the literature), we identified the main relationships between fluxes and meteorological conditions.
The savanna ecosystem annual carbon uptake was highly dependent on climate conditions, particularly the length and intensity of the dry and wet seasons. Despite receiving more precipitation during 2016, the ecosystem went from a minor C source in 2016 (annual NEE = 35 g C m−2) to a significant C sink in 2017 (annual NEE = −273 g C m−2). The savanna poor performance in 2016 was mainly due to 2 factors: 1) increasing C release during its long and severe dry season; and 2) enhanced respiration at the beginning of the wet season (Birch effect). This indicates that the C performance of Orinoco High Plains savannas is highly sensitive to uneven distributions of rainfall. This savanna ecosystem is thus especially vulnerable to the intensification of climate variability, which might turn savannas into net C sources.
Our results suggest that this savanna ecosystem became water-stressed when precipitation went below ∼5 mm/day. After ∼10 days under this nominal drought condition, the savanna ecosystem C fluxes became controlled by the nominal drought duration rather than by solar radiation. The nighttime ecosystem respiration was also dependent on drought conditions, however its dependency was better described by vapor pressure deficit rather than by drought duration.
We developed a simple NEE light-response curve (LRC) model, all the variables of which can be calculated from basic meteorological measurements (precipitation, global radiation, temperature, and relative humidity). Functions of these variables properly represent the effects of drought duration on ecosystem NEE and respiration. The model was able to adequately reproduce carbon accumulation during the extreme 2016 dry season, the 2017 dry season, and the 2017 wet season. The model did not represent well the dry to wet season transition, when the ecosystem was under extreme wet conditions, thus likely flooded. Long-term CO2 flux measurements, along with ancillary variable measurements, are required to better understand and represent the ecosystem respiration, particularly during the dry to wet season transition, over which heterotrophic respiration may become dominant.
Data Availability Statement
The raw data supporting the conclusion of this article will be made available by the authors, without undue reservation.
Author Contributions
RJ conceived and managed the project. LM-R, AH, and RJ planned the observations, developed the models and analyzed the data. LM-R, AH and NR-H conducted the field measurements. LM-R and RJ prepared the manuscript with significant contributions from all the authors.
Funding
This research was funded by Colciencias (Colombian Administrative Department of Science, Technology and Innovation), through grant number 1101-569-35161 for the project “Atmospheric emissions and impact of land use change and intensive agriculture on air quality in the Colombian Llanos.”
Conflict of Interest
The authors declare that the research was conducted in the absence of any commercial or financial relationships that could be construed as a potential conflict of interest.
Acknowledgments
We gratefully acknowledge the U.S. Department of Agriculture, which through the Borlaug Fellowship Program – Global Research Alliance, funded the research stay of LM-R at Kansas State University. The authors also express gratitude to Taluma’s researchers and Aliar La Fazenda for their logistic support. We also thank the reviewers, whose insightful comments and questions contributed to clarify and improve this paper.
Supplementary Material
The Supplementary Material for this article can be found online at: https://www.frontiersin.org/articles/10.3389/fenvs.2021.673932/full#supplementary-material
References
Acevedo, O. C., Moraes, O. L. L., Degrazia, G. A., Fitzjarrald, D. R., Manzi, A. O., and Campos, J. G. (2009). Is Friction Velocity the Most Appropriate Scale for Correcting Nocturnal Carbon Dioxide Fluxes? Agric. For. Meteorology 149, 1–10. doi:10.1016/j.agrformet.2008.06.014
Agrosavia (2017). Informe Final de Meta. 2017. Recomendaciones tecnológicas de manejo de suelos de la altillanura plana mediante la estrategia de capa productiva para los diferentes sistemas. Villavicencio: Corporación Colombiana De Investigación Agropecuaria - AGROSAVIAAvailable at: https://scienti.minciencias.gov.co/gruplac/jsp/visualiza/visualizagr.jsp?nro=00000000002033.
Aubinet, M., Feigenwinter, C., Heinesch, B., Laffineur, Q., Papale, D., Reichstein, M., et al. (2012). “Nighttime Flux Correction,” in Eddy Covariance (Dordrecht: Springer Netherlands), 133–157. doi:10.1007/978-94-007-2351-1_5
Birch, H. F., and Friend, M. T. (1956). The Organic-Matter and Nitrogen Status of East African Soils. J. Soil Sci. 7, 156–168. doi:10.1111/j.1365-2389.1956.tb00871.x
Bond-Lamberty, B., Bailey, V. L., Chen, M., Gough, C. M., and Vargas, R. (2018). Globally Rising Soil Heterotrophic Respiration over Recent Decades. Nature 560, 80–83. doi:10.1038/s41586-018-0358-x
Borghetti, F., Barbosa, E., Ribeiro, L., Ribeiro, J. F., and Walter, B. M. T. (2019). “South American Savannas,” in Savanna Woody Plants Large Herbiv, 77–122. doi:10.1002/9781119081111.ch4
Campbell, G. S., and Norman, J. M. (1998). An Introduction to Environmental Biophysics. New York, NY: Springer New York. doi:10.1007/978-1-4612-1626-1
De la Hoz, V. (2009). Geografía económica de la Orinoquia. Banco de la República - Sucursal Cartagena.
Dnp, (2014). Política para el desarrollo integral de la Orinoquia: Altillanura - Fase 1. (Documento CONPES 3797). Bogotá D.C.: DNP.
EddyPro® Version 6.2, 2016 (2016). EddyPro® Software. Lincoln, NE. LI-COR, Inc; Infrastructure for Measurements of the European Carbon Cycle Consortium. (Version 6.2) [windows].
Etter, A., Sarmiento, A., and Romero, M. H. (2010). “Land Use Changes (1970-2020) and the Carbon Emissions in the Colombian Llanos,” in Ecosystem Function In Savannas. Measurement And Modeling at Landscape to Global Scales. Editors M. J. Hill, and N. P. Hanan (CRC Press), 383–402.
Falge, E., Baldocchi, D., Olson, R., Anthoni, P., Aubinet, M., Bernhofer, C., et al. (2001). Gap Filling Strategies for Defensible Annual Sums of Net Ecosystem Exchange. Agric. For. Meteorology 107, 43–69. doi:10.1016/S0168-1923(00)00225-2
Fei, X., Jin, Y., Zhang, Y., Sha, L., Liu, Y., Song, Q., et al. (2017). Eddy Covariance and Biometric Measurements Show that a savanna Ecosystem in Southwest China Is a Carbon Sink. Sci. Rep. 7, 1–14. doi:10.1038/srep41025
Finkelstein, P. L., and Sims, P. F. (2001). Sampling Error in Eddy Correlation Flux Measurements. J. Geophys. Res. 106, 3503–3509. doi:10.1029/2000JD900731
Foken, T. (2017). in Energy and Matter Fluxes of a Spruce Forest Ecosystem. Editor T. Foken (Cham: Springer International Publishing). doi:10.1007/978-3-319-49389-3
Frost, P. G. H., Medina, E., Menaut, J.-C., Solbrig, O., Swift, M., and Walker, B. H. (1985). Responses of Savannas to Stress and Disturbance. A Proposal for a Collaborative Programme of Research. Biol. Int. 63, 233–239. doi:10.1557/proc-63-233
Grace, J., Jose, J. S., Meir, P., Miranda, H. S., and Montes, R. A. (2006). Productivity and Carbon Fluxes of Tropical Savannas. J. Biogeogr. 33, 387–400. doi:10.1111/j.1365-2699.2005.01448.x
Griffiths, E., and Birch, H. F. (1961). Microbiological Changes in Freshly Moistened Soil. Nature 189, 424. doi:10.1038/189424a0
Ibrom, A., Dellwik, E., Flyvbjerg, H., Jensen, N. O., and Pilegaard, K. (2007). Strong Low-Pass Filtering Effects on Water Vapour Flux Measurements with Closed-Path Eddy Correlation Systems. Agric. For. Meteorology 147, 140–156. doi:10.1016/j.agrformet.2007.07.007
José, J. J. S., Montes, R., and Nikonova-crespo, N. (1991). Carbon Dioxide and Ammonia Exchange in the Trachypogon Savannas of the Orinoco Llanos. Ann. Bot. 68, 321–328. doi:10.1093/oxfordjournals.aob.a088259
Jose, J., Montes, R., Nikonova, N., Grace, J., and Buendía, C. (2014). Effect of the Replacement of a Native savanna by an African Brachiaria Decumbens Pasture on the CO2 Exchange in the Orinoco Lowlands, Venezuela. Photosynt. 52, 358–370. doi:10.1007/s11099-014-0039-4
Keenan, T. F., and Williams, C. A. (2018). The Terrestrial Carbon Sink. Annu. Rev. Environ. Resour. 43, 219–243. doi:10.1146/annurev-environ-102017-030204
Kljun, N., Calanca, P., Rotach, M. W., and Schmid, H. P. (2015). A Simple Two-Dimensional Parameterisation for Flux Footprint Prediction (FFP). Geosci. Model. Dev. 8, 3695–3713. doi:10.5194/gmd-8-3695-2015
Lasslop, G., Reichstein, M., Papale, D., Richardson, A. D., Arneth, A., Barr, A., et al. (2010). Separation of Net Ecosystem Exchange into Assimilation and Respiration Using a Light Response Curve Approach: Critical Issues and Global Evaluation. Glob. Chang. Biol. 16, 187–208. doi:10.1111/j.1365-2486.2009.02041.x
Lavelle, P., Rodríguez, N., Arguello, O., Bernal, J., Botero, C., Chaparro, P., et al. (2014). Soil Ecosystem Services and Land Use in the Rapidly Changing Orinoco River Basin of Colombia. Agric. Ecosyst. Environ. 185, 106–117. doi:10.1016/j.agee.2013.12.020
Lipsett-Moore, G. J., Wolff, N. H., and Game, E. T. (2018). Emissions Mitigation Opportunities for savanna Countries from Early Dry Season Fire Management. Nat. Commun. 9, 2247. doi:10.1038/s41467-018-04687-7
López-Hernández, D., Hernández-Hernández, R. M., and Brossard, M. (2005). Historia del uso reciente de tierras de las sabanas de América del Sur. Estudios de casos en sabanas del Orinoco. Interciencia 30 (10), 623–630. Available at: https://www.redalyc.org/articulo.oa?id=33910907.
Ma, S., Baldocchi, D. D., Hatala, J. A., Detto, M., and Curiel Yuste, J. (2012). Are Rain-Induced Ecosystem Respiration Pulses Enhanced by Legacies of Antecedent Photodegradation in Semi-arid Environments? Agric. For. Meteorology 154-155, 203–213. doi:10.1016/j.agrformet.2011.11.007
Mauder, M., and Foken, T. (2004). Documentation and Instruction Manual of the Eddy Covariance Software Package TK2. Bayreuth, 1614–89166.
Mesa-Sánchez, O. J., and Rojo-Hernández, J. D. (2020). On the General Circulation of the Atmosphere Around Colombia. Rev. Acad. Colomb. Cienc. Ex. Fis. Nat. 44, 857–875. doi:10.18257/RACCEFYN.899
Moncrieff, J., Clement, R., Finnigan, J., and Meyers, T. (2005). “Averaging, Detrending, and Filtering of Eddy Covariance Time Series,” in Handbook Of Micrometeorology: A Guide For Surface Flux Measurement And Analysis. Editors X. Lee, W. Massman, and B. Law (Dordrecht: Springer Netherlands), 7–31. doi:10.1007/1-4020-2265-4_2
Morales-Rincon, L. A. (2019). Flujos de bióxido de carbono y vapor de agua medidos mediante covarianza de remolinos en sabana nativa y cultivos transitorios mecanizados en la Altillanura colombiana. Universidad Nacional de Colombia.
Munger, J. W., Loescher, H. W., and Luo, H. (2012). “Measurement, Tower, and Site Design Considerations,” in Eddy Covariance. Dordrecht: Springer Netherlands, 21–58. doi:10.1007/978-94-007-2351-1_2
Pacheco, Y., and León-Aristizábal, G. (2001). Clasificación climática de la orinoquia colombiana a partir de los patrones de circulación atmosférica. Meteorol. Colomb. 4, 117–120.
Papale, D., Reichstein, M., Aubinet, M., Canfora, E., Bernhofer, C., Kutsch, W., et al. (2006). Towards a Standardized Processing of Net Ecosystem Exchange Measured with Eddy Covariance Technique: Algorithms and Uncertainty Estimation. Biogeosciences 3, 571–583. doi:10.5194/bg-3-571-2006
Pirvulescu, V. (2013). Application of the Eddy-Covariance Method under the Canopy at a Boreal forest Site in central Sweden. Lund University.
Pulwarty, R. S., Barry, R. G., Hurst, C. M., Sellinger, K., and Mogollon, L. F. (1998). Precipitation in the Venezuelan Andes in the Context of Regional Climate. Meteorl. Atmos. Phys. 67, 217–237. doi:10.1007/BF01277512
Räsänen, M., Aurela, M., Vakkari, V., Beukes, J. P., Tuovinen, J.-P., Van Zyl, P. G., et al. (2017). Carbon Balance of a Grazed savanna Grassland Ecosystem in South Africa. Biogeosciences 14, 1039–1054. doi:10.5194/bg-14-1039-2017
Reichstein, M., Falge, E., Baldocchi, D., Papale, D., Aubinet, M., Berbigier, P., et al. (2005). On the Separation of Net Ecosystem Exchange into Assimilation and Ecosystem Respiration: Review and Improved Algorithm. Glob. Change Biol 11, 1424–1439. doi:10.1111/j.1365-2486.2005.001002.x
Rippstein, G., Escobar, G., and Motta, F. (2001). Agroecología y Biodiversidad de las Sabanas en los Llanos Orientales de Colombia. Centro Internacional de Agricultura Tropical: Cali.
Rondón, M., Acevedo, D., Hernández, R. M., Rubiano, Y., Rivera, M., Amézquita, E., et al. (2006). “Carbon Sequestration Potential of the Neotropical Savannas of Colombia and Venezuela,” in Carbon Sequestration in Soils of Latin America, 213–244.
San José, J. J. (2001). Evaluación de los efectos del uso de la tierra sobre el contenido y flujos de carbono en los llanos del Orinoco. Available at: http://www.uach.cl/procarbono/pdf/simposio_carbono/01_SanJose.PDF.
San José, J. J., Montes, R. A., and Fariñas, M. R. (1998a). Carbon Stocks and Fluxes in a Temporal Scaling from a savanna to a Semi-deciduous forest. For. Ecol. Manag. 105, 251–262. doi:10.1016/S0378-1127(97)00288-0
San José, J. J., and Montes, R. A. (2007). Resource Apportionment and Net Primary Production across the Orinoco savanna-woodland Continuum, Venezuela. Acta Oecologica 32, 243–253. doi:10.1016/j.actao.2007.05.005
San José, J. J., Montes, R., and Mazorra, M. (1998b). The Nature of Savanna Heterogeneity in the Orinoco Basin. Glob. Ecol Biogeogr. 7, 441–455. doi:10.2307/299771410.1046/j.1466-822x.1998.00309.x
San José, J., Montes, R., Grace, J., and Nikonova, N. (2008). Land-use Changes Alter CO2 Flux Patterns of a Tall-Grass Andropogon Field and a savanna-woodland Continuum in the Orinoco Lowlands. Tree Physiol. 28, 437–450. doi:10.1093/treephys/28.3.437
Santos, A. J. B., Silva, G. T. D. A., Miranda, H. S., Miranda, A. C., and Lloyd, J. (2003). Effects of Fire on Surface Carbon, Energy and Water Vapour Fluxes over campo Sujo savanna in central Brazil. Funct. Ecol. 17, 711–719. doi:10.1111/j.1365-2435.2003.00790.x
Van Gorsel, E., Leuning, R., Cleugh, H. A., Keith, H., and Suni, T. (2007). Nocturnal Carbon Efflux: Reconciliation of Eddy Covariance and Chamber Measurements Using an Alternative to the u.-threshold Filtering Technique. Tellus B: Chem. Phys. Meteorology 59, 397–403. doi:10.1111/j.1600-0889.2007.00252.x
Vejen, F., Jacobsson, C., Fredriksson, U., Moe, M., Andresen, L., Hellsten, E., et al. (2002). Quality Control of Meteorological Observations: Automatic Methods Used in the Nordic Countries. Oslo: Norwegian Meteorological Institute Available at: https://books.google.com.co/books?id=5MtaHQAACAAJ.
Vickers, D., and Mahrt, L. (1997). Quality Control and Flux Sampling Problems for Tower and Aircraft Data. J. Atmos. Oceanic Technol. 14, 512–526. doi:10.1175/1520-0426(1997)014<0512:qcafsp>2.0.co;2
Webb, E. K., Pearman, G. I., and Leuning, R. (1980). Correction of Flux Measurements for Density Effects Due to Heat and Water Vapour Transfer. Q.J R. Met. Soc. 106, 85–100. doi:10.1002/qj.49710644707
Wilczak, J. M., Oncley, S. P., and Stage, S. A. (2001). Sonic Anemometer Tilt Correction Algorithms. Boundary-Layer Meteorology 99, 127–150. doi:10.1023/a:1018966204465
Williams, C. A., Hanan, N., Scholes, R. J., and Kutsch, W. (2009). Complexity in Water and Carbon Dioxide Fluxes Following Rain Pulses in an African savanna. Oecologia 161, 469–480. doi:10.1007/s00442-009-1405-y
Zahumenský, I. (2004). Guidelines on Quality Control Procedures for Data from Automatic Weather Stations. Available at: http://www.wmo.int/pages/prog/www/IMOP/publications/IOM-82-TECO_2005/Papers/3(14)_Slovakia_2_Zahumensky.pdf.
Keywords: Orinoco savanna, eddy covariance carbon dioxide fluxes, carbon uptake, ecosystem respiration, light response curve, drought impact meteorology-based flux model
Citation: Morales-Rincon LA, Hernandez AJ, Rodriguez-Hernandez NS and Jimenez R (2021) Carbon Exchange and Accumulation in an Orinoco High Plains Native Savanna Ecosystem as Measured by Eddy Covariance. Front. Environ. Sci. 9:673932. doi: 10.3389/fenvs.2021.673932
Received: 28 February 2021; Accepted: 07 June 2021;
Published: 21 June 2021.
Edited by:
Carlos Hernando Montenegro, University of Los Andes, ColombiaReviewed by:
Qinghai Song, Xishuangbanna Tropical Botanical Garden (CAS), ChinaJinshu Chi, Swedish University of Agricultural Sciences, Sweden
Copyright © 2021 Morales-Rincon, Hernandez, Rodriguez-Hernandez and Jimenez. This is an open-access article distributed under the terms of the Creative Commons Attribution License (CC BY). The use, distribution or reproduction in other forums is permitted, provided the original author(s) and the copyright owner(s) are credited and that the original publication in this journal is cited, in accordance with accepted academic practice. No use, distribution or reproduction is permitted which does not comply with these terms.
*Correspondence: Rodrigo Jimenez, cmppbWVuZXpwQHVuYWwuZWR1LmNv
 Luis A. Morales-Rincon
 Andrea J. Hernandez
 Nubia S. Rodriguez-Hernandez
 Rodrigo Jimenez