 Nasser M. Hamdan
 Hussain Alawadhi2
- 1Physics Department, The American University of Sharjah, Sharjah, United Arab Emirates
- 2Center for Advanced Materials Research, University of Sharjah, Sharjah, United Arab Emirates
We have conducted a comprehensive sampling campaign of PM10 pollutants at a site next to a major highway, using standard protocols. Particulate matter (PM) total mass, elemental and chemical/mineral compositions of the fine and coarse fractions of traffic-related PM pollutants were determined using several complementary techniques, including gravimetric analysis, x-ray fluorescence, scanning electron microscopy, energy dispersive spectroscopy, and x-ray diffraction. The PM mass concentrations show that PM10 is within acceptable international standards except during dust storms within the sampled periods. Desert dust, crustal minerals, and sea salts are the major natural sources of PM10 pollution. Examples of these minerals are quartz [SiO2], calcite [CaCO3], gypsum [CaSO4·2H2O], palygorskite [(Mg,Al)2Si4O10(OH)•4(H2O], chlorite-serpentine [(Mg,Fe)6AlSi3O10(OH)8], halite [NaCl] and nitratine [NaNO3]. Anthropogenic mineral-based pollutants, such as mascagnite [(NH4)2SO4] and koktaite [(NH4)2Ca(SO4)2·H2O], were also observed to contribute to PM10. Trace elements such as Zn, Cu, Fe, Cr and Mn that are markers for traffic sources, Ni and V that are markers for heavy oil combustion, and Pb, which is attributed to industrial emissions, were also identified in PM10. Seasonal variation of the average total mass concentrations and the average mass concentration of elements emitted from natural sources show that the hot season is associated with higher pollution levels compared to the cold season due to increased dust events in the spring and summer. Correlation coefficients between elements have identified elements originating from common sources such as dust storms (e.g., Si, Ca, Al, Fe, Ti, Mn) and sea breeze (Cl and Na), in addition to anthropogenic elements. Enrichment factors calculations have identified elements that mainly have crustal origins, and elements that are partially or highly enriched by humans. Anthropogenic elements were more enriched during the cold season due to reduced human activities in the summer.
Introduction
Air pollution emission has been increasing over the years, especially in the Middle East and North Africa (MENA) region, due to increased fossil fuel burning and other anthropogenic activities. The Gulf region, including the United Arab Emirates (UAE), experiences frequent dust events from the nearby desert spans such as the Empty Quarter (Rub' al Khali) desert. Being an arid region with an average annual rainfall of about 5 cm/year, this region is more susceptible to pollution from fugitive particulate matter transport (Climate Yearly Report 2013-2017; NCMS, 2019; Hamdan et al., 2018). Pollution due to natural and anthropogenic sources from these dust storms, sea salt from the Arabian Gulf, traffic, and a large number of mega construction and industrial projects have made it necessary to perform intensive investigation of the chemical composition and sources of these pollutants. It is established that fine particulate matter (PM), with mean aerodynamic diameter of 2.5 μm or smaller, usually referred to as PM2.5, are linked to anthropogenic sources such as traffic and industrial emissions, and upstream and downstream oil and gas operations. In contrast, natural sources such as desert dust, construction materials and sea spray contribute to both the fine fraction and the coarse fraction of PM10 (PM with mean aerodynamic diameter of 10 μm or smaller) (Hamdan et al., 2018; Hamdan et al., 2018).
Outdoor PM pollution has adverse health effects and contributes to several disease burdens including heart diseases, strokes, respiratory diseases and cancer, and it is considered to be the leading environmental risk factor in the UAE (Miller et al., 2007; Bener et al., 2009; Al Jaberi et al., 2010; Li et al., 2010; Hochstetler et al., 2011; Al Katheeri et al., 2012; Gibson and Farah, 2012; Gibson et al., 2013; Tsiouri et al., 2015; Wong et al., 2016; Hamdan et al., 2018). The World Health Organization (WHO) in 2018 estimated that globally 4.2 million premature deaths are linked to ambient air pollution induced ailments such as heart disease, stroke, chronic obstructive pulmonary disease, lung cancer, and acute respiratory infections in children (WHO, 2018).
Despite several publications on the deteriorating levels of PM pollution in the region and their health impacts, only a few of such publications deal with elemental composition, chemical speciation and source apportionment of PM pollutants. Saraga et al. (2017), have reported the results of a two-month campaign for PM10 concentration in Doha Qatar. They have found that the WHO guidelines (WHO, 2018) were exceeded in 100% of the outdoor measurements. They have reported mass concentration values of PM10 reaching 1,000 μg/m3. They have also identified both natural and anthropogenic sources of PM10, showing the presence of crustal elements, nitrates and sulfates. Elements with high enrichment factors were identified both indoors and outdoors, indicating infiltration of anthropogenic sources into indoor environments (Saraga et al., 2017). Phanikumar et al. (2020), have recently reported seasonal concentrations of both PM2.5 and PM10 in Abu Dhabi between 2011 and 2013, with the values in summer and spring being higher than those in the fall and winter. They have reported average mass concentrations of PM10 in June and July of about 300 μg/m3 in rural areas and more than 200 μg/m3 in urban areas. They also concluded that the main source of PM10 in Abu Dhabi is desert dust, while PM2.5 was mainly due to local anthropogenic emissions such as traffic and industrial emissions. In a recent article, Javed and Guo (Javed and Guo, 2020) have reported that the average mass concentration of PM10 in Doha was 146 μg/m3 with 50% of the coarse fraction being mineral dust. They have also performed Positive Matrix Factorization (PMF) source apportionment and identified six major sources of both the coarse and the fine fractions, including secondary inorganic aerosols, vehicular emissions, heavy oil combustion, marine aerosols, mineral and fugitive dust (Javed and Guo, 2020).
One of the studies on characterizing mineral dust and other aerosols air pollution in the Middle East is performed by Engelbrecht et al. (Engelbrecht et al., 2009; Engelbrecht et al., 2009). Their work was performed on 15 US military sites in Iraq, Kuwait, Afghanistan, Qatar, and the UAE and was part of the Enhanced Particulate Matter Surveillance Program. Despite being a comprehensive sampling and characterization work, it only investigated samples collected from military bases in the desert, far from urban and residential areas. They identified various minerals in both PM2.5 and PM10 at all these sites and concluded that mineral content of the aerosols is originating mainly from local soil. They also found that the 24-h mean mass concentration of PM2.5 in the UAE site was 52 μg/m3. Tsiouri et al. (2015), have summarized the available source apportionment studies of atmospheric PM in the Middle East. In their summary, they found significant problems in quantifying PM emissions in the region. They also concluded that there is a need for systematic data collection, source apportionment, and assessment of PM levels to help minimize adverse health effects. Reid et al., have performed the United Arab Emirates Unified Aerosol Experiment (UAE2), an atmospheric, thermodynamic, and aerosol data collection on 18 flights in the UAE between August to September 2004 (Reid et al., 2008). They observed high regional dust from 100 to 300 μg/m3 in the background and more than 1.5 mg/m3 during dust events in the first 5 km of the atmosphere. They also observed 10–100 μg/m3 of sulfate-based pollutants originating from the region’s petroleum industry. Al-Salem (2008) have performed a 2-year study of PM10 in an urban site in Kuwait. They reported mean annual mass concentration of PM10 to be about 290 μg/m3 for 2004 and 2005. These values are about twice the accepted averages for PM10 mass concentration. Arashiro and Leith (2013) used a passive personal sampler to study the size distribution and mass concentrations of PM2.5 and PM10–2.5 in the UAE and concluded that these passive samplers can provide reasonably precise measurements.
We have recently reported the chemical composition of the fine fraction of PM10 (PM2.5). Investigating PM10 is of great interest because most of the entrained soil, sea salts and dust from construction sites occur in the coarse size fraction of PM10. This study is part of a comprehensive and systematic investigation of the chemical speciation of PM pollutants and the results will be used for a Positive Matrix Factorization study in the near future (Hamdan et al., 2015; Hamdan et al., 2016; Hamdan et al., 2018). We report here a 10-month campaign of sampling PM10 aerosols from a roadside traffic site. The sampling was performed simultaneously with PM2.5, which allows us to extract mass concentrations of the fine and coarse fractions of PM in this work. We integrate several complementary analytic techniques to identify the elemental and chemical composition of pollutants in this size fraction that will be used as source tags for pollutants (Samek et al., 2016). These techniques include gravimetric analysis, x-ray fluorescence (XRF), x-ray diffraction (XRD), and scanning electron microscopy and energy dispersive spectroscopy (SEM/EDS).
Materials and Methods
Sampling Campaign and Protocol
Sampling was performed using a low volume sampler LVS/LVS6-RV manufactured by Sven Leckel, Ingenieurbüro GmbH Germany. PM samples were collected for 24 h twice a week, using the European standard EN12341 (2.3 m3 h−1) on 47 mm diameter Teflon filters. We have used two sampling stations placed side-by-side: one equipped with PM10 jets and the other with PM2.5 jets. Both PM10 and PM2.5 samples were collected simultaneously from the same site utilizing the same protocol in order to extract the coarse fraction of PM10. The site is an air quality-monitoring station for the Sharjah-based Bee’ah, an environmental management company. The site is within 50 m of the Sharjah International Airport highway and about 15 m above the highway level. The highway usually has high traffic congestions in the morning between 7:00 and 9:00 am, and in the evening between 4:30 and 8:00 pm on weekdays, while it has normal traffic flow outside these intervals and during weekends. Sampling was performed between January 14, 2018, and October 26, 2018 every Tuesday (working days) and Friday (weekends) starting from 00:01 until 23:59. The temperature and relative humidity (RH) were recorded every 5 min and a normalized air volume at normal temperature and pressure (25°C and one atmospheric pressure) was then used to calculate the amount of pollution per cubic meter of air.
Gravimetric Analysis
Airborne PM10 mass concentrations were determined gravimetrically following a standard operating procedure (Hamdan et al., 2018). Teflon filters were preconditioned at 25°C and 55% RH for 24 h and weighed using a Sartorius microbalance with precision better than 1 µg. Prior to weighing, excess electrostatic charge was removed from the filters using a U-shaped electrostatic charge neutralizer. Details of this measurement are published elsewhere (Hamdan et al., 2018; Hamdan et al., 2020).
XRF: Elemental Analysis
A Thermofisher QuantX spectrometer was used for XRF measurements, with a 50 W Rh tube source and a beam size of 8 mm. The spectrometer is equipped with eight source filters to increase the sensitivity for specific elements and a 10-position automatic sample exchanger. All filters were subjected to XRF measurements and analysis. A single point calibration using Micromatter thin films for the twenty-two measured elements (Na, Mg, Al, Si, P, S, Cl, K, Ca, Ti, V, Cr, Mn, Fe, Ni, Cu, Zn, Rb, Sr, Zr, Ba and Pb) was established in addition to quality assurance and control that was validated against a NIST aerosol Standard Reference Material (SRM) 2783 (May and Rumble Jr, 2002). This SRM is an air particulate sample reduced in particle size to simulate PM2.5 and deposited on a polycarbonate filter membrane. It is primarily intended for use in the evaluation and calibration of analysis methods for common and toxic elements contained in various fractions of airborne particulate matter collected on filter media. The SRM 2783 includes loaded filters and blank filters (May and Rumble Jr, 2002). The details of the validation are published elsewhere (Hamdan et al., 2018; Hamdan et al., 2020).
Correlation Coefficients
Correlation coefficients between elements are used to identify elements that are possibly originating from common sources. Equation 1 was used to calculate the correlation coefficients between all the measured elements1:
Here
The interpretation of the results is made based on the value of the correlation coefficients: +1 means 100% correlation, zero means no correlation and negative means the behavior of the measured parameter of one element is opposite to the other.
Elements that have high correlation coefficients over the sampling period can be used as fingerprints for the sources. For examples, positive correlation among elements such as Ca, Si, P, Mg, and Al indicates that they are originating from dust from construction sites and nearby desert spans, while positive correlation between Na and Cl indicates a sea salt origin. Correlation coefficients between all measured elements are calculated in the next section.
Statistical Analysis
Statistical methods are used to confirm the validly of the sample size and the analysis used. The number of samples collected over a period of 10 months was 73. The required sample size that gives 90% confidence level and 10% marginal error are calculated to be 562, which demonstrates that our sample size of 73 samples is sufficient. Furthermore, we have performed statistical significance analysis for the correlation factors between elements calculated below, by evaluating the Pearson coefficients (p) for all correlated coefficients. The correlation would be statistically significant within 95% confidence level, if p < 0.05 (Holmes et al., 2015).
Enrichment Factor Analysis
Enrichment factor (EF) analysis is another technique that is usually used to distinguish between natural and anthropogenic origins of elements, by showing the degree of enrichment of certain elements compared to the relative abundance of these elements in crustal materials. EF is a quantitative measure of the strength of crustal origin, which is calculated by comparing the concentration of a certain element relative to a reference element that is abundant in the earth’s crust. Reference elements are usually Al, Si and Fe (Wang et al., 2006; Zhu et al., 2012). The EF for element X is defined as (Duce et al., 1975; Feng et al., 2016):
where Y is the concentration of the reference element. In our case we have chosen Si as the reference element because it is abundant as quartz in the surrounding deserts. A high enrichment factor for a certain element suggests a prevailing anthropogenic origin. If the EF is small for a certain element, then the element is not enriched, and the main source is natural, such as soil or rock weathering (Feng et al., 2016; Wu et al., 2019). The elemental composition of the crust was obtained from the literature (Rudnick and Gao, 2003; Helmenstine, 2020). Elements can be divided into three groups: not enriched (EF < 10), moderately enriched (10 < EF < 100), and highly enriched (EF > 100).
Equivalent Black Carbon Measurements
Equivalent black carbon (eBC) was determined for the fine fraction of PM10 using a Multi-wavelength Absorption Black Carbon Instrument (MABI). The instrument uses seven lasers to determine the light absorption coefficient of a specimen at different wavelengths. “The laser absorption method relies on mass absorption coefficient, which is a strong function of the particle size, refractive index and density of the eBC particles, as well as the wavelength of light used. The eBC data were not corrected for the contribution of hematite. As fine eBC can be generated from a range of different sources, its particle size and density distribution may also vary in a collected sample depending on the dominant sources of eBC at the site. eBC exists in the fine and ultrafine size fractions. Therefore, eBC should only be performed on PM2.5 and not on PM10, because PM10 will be dominated by the large size PM of natural origin which will affect the absorption measurements from the fine particles” (Hamdan et al., 2020).
SEM/EDS Measurements
A TESCAN environmental scanning electron microscope (VEGA3 XMU) with a LaB6 source and Oxford Aztec X-Max 50 EDS was used for imaging and elemental maps of selected PM10 filters. These measurements were performed to achieve two main objectives: 1) to identify elements that are not detectable by other techniques used in this study (e.g., XRF), such as C, N, and O; 2) to do SEM/EDS elemental maps and correlations of maps of various elements to complement XRD results in identifying crystalline phases. Some of these phases are difficult to identify in the XRD patterns either because of very low peak intensities or because of overlapping of major peaks of different phases. Fourteen Filters representing different weather conditions and different seasons were selected for analysis. The electron beam excitation was set at 20 kV, and low vacuum (10 Pa) and a back-scattered electron detector were used to avoid charging of the filters. Despite their low conductivity, the filters were not coated or treated in any way.
XRD Crystallographic Phase Analysis
A Bruker D8 ADVANCE system with a Cu tube source and a linear detector (LYNXEYE XE) was used for XRD measurements and analysis of 14 representative PM10 filters. The same filters were also subjected to SEM/EDS and mapping analysis. The measurements were performed with a step size of 0.02°, 2θ range of 5°–55°, and time per step of 2.5 s.
Results and Discussions
Gravimetric Analysis and Seasonal Variation
Figure 1 represents the mass concentrations in µg/m3 for each of the PM10 filters collected over the sampling campaign period. Less dust events were observed during the cold season (January to April 2018) than the warm and hot seasons (April to October 2018). During the initial sampling campaign (January 14 to April 3, 2018), 18 samples were collected, among which 13 were below the United States Environmental Protection agency’s (US-EPA) 24 h limit of 150 μg/m3 for PM10. There were only five dusty days during this period. More dust events occurred during April until the end of October. The average mass concentration for the cold season (even with the five dusty days) was 137 μg/m3. 55 samples were collected during the hot season with an average mass concentration of 210 μg/m3. The overall average mass concentration for the sampling campaign using a total of 73 samples was 180 μg/m3, including all dust events. On July 31 there was a severe dust storm with a mass loading of 761 μg/m3.
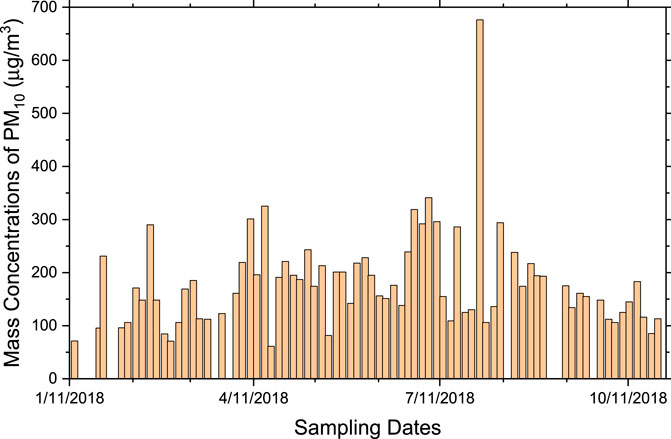
FIGURE 1. Variation of the mass concentrations for PM10, collected over the sampling campaign period.
Figure 2 shows the seasonal variation of the average mass concentrations of PM10 and PM2.5. Most of PM10 constituents are originating from the nearby desert areas, construction projects, and sea-salts originating from the nearby Arabian Gulf. Our seasonal variation results for both PM10 and PM2.5 agree with previous results for Abu Dhabi (Phanikumar et al., 2020).
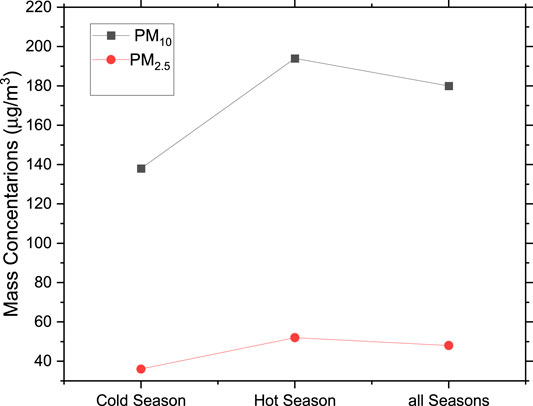
FIGURE 2. Seasonal average mass concentrations of PM10 and PM2.5.
Although natural pollutants contribute mostly to the coarse fraction of PM, they also contribute to the fine particles. We have observed several mineral phases and sea salts in the PM2.5 composition (Hamdan et al., 2020).
XRF Results
All the 73 collected filters of PM10 were analyzed using XRF spectroscopic technique. The mass concentrations and their uncertainties were determined for 22 elements. These elements are Na, Mg, Al, Si, P, S, Cl, K, Ca, Ti, V, Cr, Mn, Fe, Ni, Cu, Zn, Rb, Sr, Zr, Ba and Pb. Ca exists mostly as calcite, as shown in the XRD and EDS results and discussions below. The Supplementary Table S1 shows the concentrations of all elements within the detection limit of the measurements and their uncertainties. The table shows that Si and Ca are the major elements in PM10, with their average contributions to the total mass concentrations being 32 and 45 μg/m3, respectively. S (as sulfates) contributes with an average of 10 μg/m3, while Fe and Al contribute about 6 μg/m3 each. Cl average concentration in PM10 was 7.4 μg/m3 while it was only 0.3 μg/m3 in the fine fraction (Hamdan et al., 2020), showing that sea salts are mostly present in the coarse fraction of PM10. The coarse fractions of pollutants are mostly due to natural sources (crustal materials and sea salt) (Song et al., 2015). Figure 3 shows the concentration variation of S, Si, Ca, and Fe over the whole sampling campaign calculated from the XRF spectra. Ca mass concentrations (mostly in the form of CaCO3) over the year averages to 45 μg/m3, with a few higher values on the days with dust events. The annual average for Si concentration in PM10 (mostly in the form of SiO2) is about 32 μg/m3. High concentrations of quartz and calcite are expected because of the frequent dust events originating from the nearby desert, construction sites and fugitive emissions from entrained soil due to scarcity of rainfall. Road dust resuspension by traffic is a major factor in increasing pollution concentrations. Fe and Al have about the same average concentrations. Other elements such as Mg, K, P and Ti are associated with the presence of several mineral phases, which will be discussed later in the article. Figure 3 also shows that S is present as one of the main pollutants, although its concentration (13 μg/m3) is much less than those of Si and Ca. This value is slightly higher than the value we have observed in PM2.5 (10 μg/m3) because of the presence of gypsum in the coarse fraction, in addition to the other sulfate phases observed in the fine fraction (Hamdan et al., 2020). This shows that sulfates are present mostly in the fine size fraction of PM10 and are mainly due to three minerals: mascagnite, koktaite and gypsum. Mascagnite and koktaite are secondary pollutants that form in the atmosphere as very fine particles (Hamdan et al., 2018).
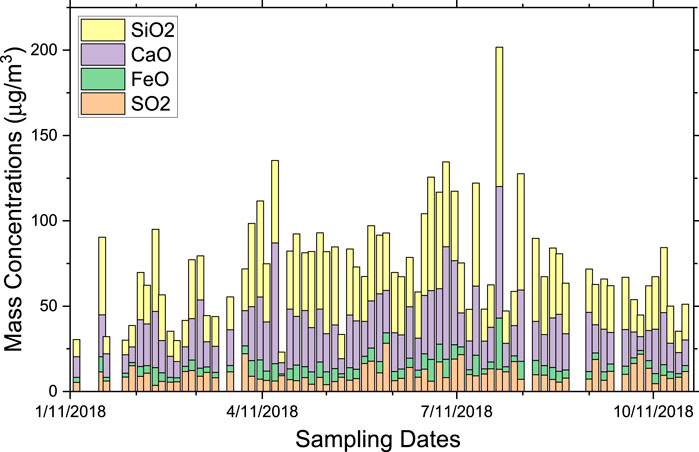
FIGURE 3. Variation of the mass concentrations of Si, Ca, Fe and S in PM10.
Figure 4 shows the seasonal variation of the mass concentrations of Si, Ca, Fe, Al, Cl, and S, for the cold and the hot seasons and for the whole year. The figure clearly shows that for Si, Ca, Fe and Al that are originating from natural sources such as wind-blown dust, and for Cl, which originates from the sea breeze, the average mass concentrations during the hot season are higher than those during the cold season. This is consistent with the mass concentration of the coarse fraction of PM shown in Figure 3 above. In contrast, the average mass concentration of S is almost constant, because S is present mainly in the fine fraction as secondary pollutants in the form of sulfates. There is a slight increase of the S concentration during the hot season due to the presence of gypsum in the coarse fraction of PM10.
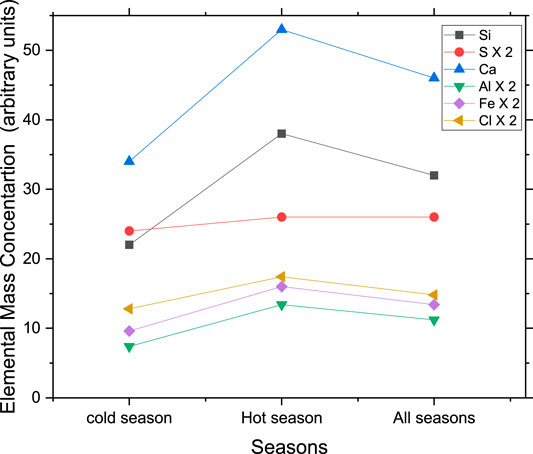
FIGURE 4. Seasonal variation of elemental concentrations for the major elements originating from natural sources and for S, which is an anthropogenic source. The mass concentrations of S, Al, Fe and Cl are multiplied by a factor of 2 for clarity.
Elemental Correlations
Table 1 shows the correlations among the 22 measured elements. All correlation coefficients that are greater than 0.2 are statistically significant with Pearson coefficient p < 0.05. The table shows very strong correlations among elements such as Si, Al, Mn, K, Fe, Rb, Sr, Zr, Cr, and Ti, which are fingerprints for soil and construction site sources. In contrast, Na correlates positively only with Cl (0.36), while it correlates negatively with all other elements. This indicates that halite from sea breeze is the source of both Na and Cl. The relatively low correlation between Na and Cl indicates the loss of Cl from the “aged sea-salt” because of high temperatures, leading to the formation of NaNO3, as evident from XRD and EDS results discussed later. S correlates positively only with V (0.24) and Zn (0.23), while it correlates negatively with all non-anthropogenic elements. A similar correlation between S and each of V and Zn indicates that these two elements originate from traffic emissions. The relatively low correlation factor between S and each of V and Zn also indicates that S originates from sources other than traffic, mainly power generation, industrial emissions and upstream and downstream oil and gas operations. The highly negative correlation factor between S and Cl indicates that Cl is coming mainly from the sea and not from any industrial sources.
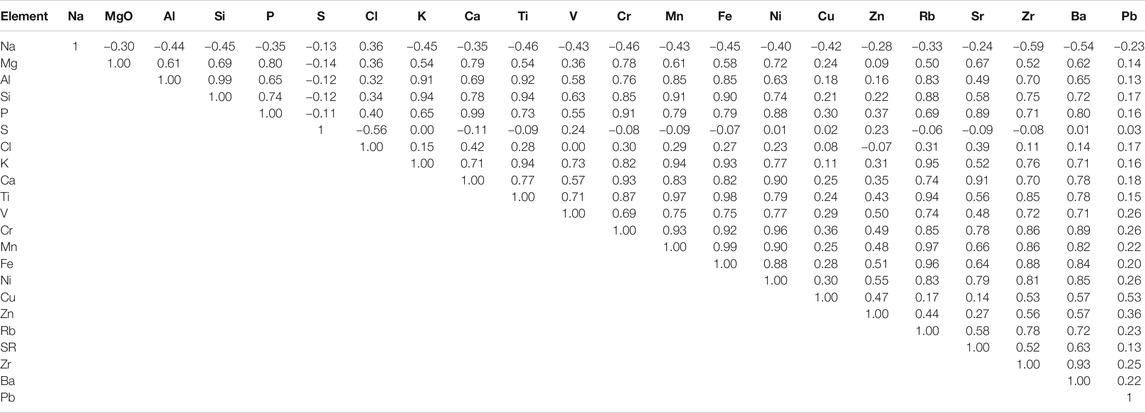
TABLE 1. Correlations among detected elements in PM10.
Pb correlates with Cu (0.53) and Zn (0.36) and has lower or negative correlations with all other measured elements. This is a good indication that industrial emissions are the sources of Pb, Cu and Zn.
XRF analysis also revealed the concentration of trace elements such as Cr, Mn, Ni, V, Pb, Zn, and Cu. These elements can be used as markers for certain pollution sources. For example, V and Ni are known to be originating from heavy oil combustion used in ships (Mazzei et al., 2008; Bove et al., 2014; Manousakas et al., 2017; Manousakas et al., 2018). There is a good correlation (0.77) between these two elements indicating that they are originating from the same source, as expected. This result is consistent with the correlation factor of 0.75 that was found for PM2.5 (Hamdan et al., 2020). The average mass concentration of vanadium was 60 ng/m3 and varied between 10 and 100 ng/m3, while the nickel’s average mass concentration was 40 ng/m3. Heavy oil combustion is emitted from ships at Sharjah port which is located a few miles from the sampling site. The average annual mass concentration of Pb for all sampling days was 30 ng/m3 with a few days spiking as high as 190 ng/m3, which is still well below the EU air quality limit of 500 ng/m3 (Air Quality Standards, 2020). Pb is originating from industrial emissions, mainly car battery recycling plants within a few km from the sampling site (Hamdan et al., 2020).
Enrichment Factors
Figure 5 shows the EFs for both the cold and hot seasons. The figure shows that Na, Al, K, Ti, Mg, Fe, Mn, and P have EF less than 10, for both the cold and the hot seasons, indicating their crustal origin. Enrichment factors for Ca have slightly higher values than 10 in both the cold (13.8) and the hot (12.3) seasons and can be considered an element of crustal origin. Only Rb can be considered as moderately enriched. The remaining elements constitute the third group of elements that are highly enriched by human activity. S and Cl are the most enriched elements, with S originating from anthropogenic sources. Unlike PM2.5 (Hamdan et al., 2020), Cl is the most enriched element in PM10, confirming that it is originating from the sea and not from crustal origin. A careful look at Figure 5 shows that the EFs of all anthropogenic elements (the moderate and the highly enriched) are more enriched during the cold season compared to the hot season. This is because a large fraction of the UAE population leave the country during the hot summer season leading to a considerable reduction in traffic and energy consumption compared to the cold season (Hamdan et al., 2020), while the concentrations of elements from natural sources increase during the summer.
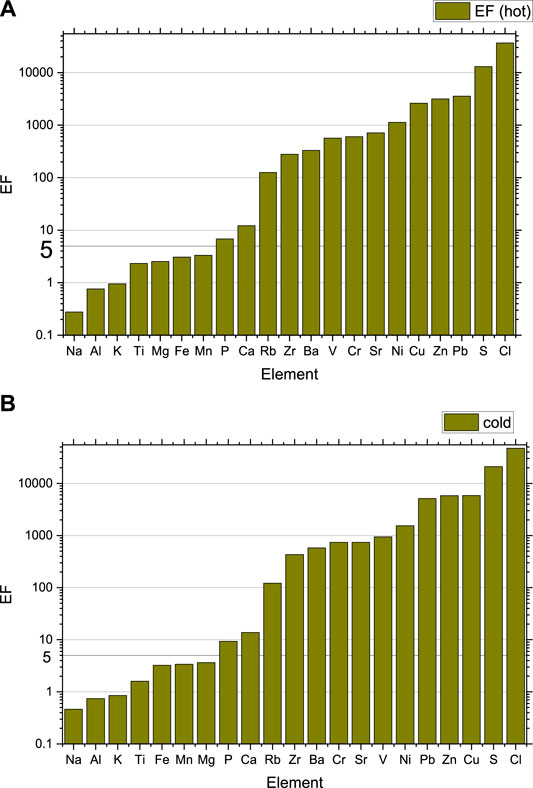
FIGURE 5. EF of different elements for both the (A) hot and (B) cold seasons for PM10.
Carbon Analysis
Equivalent Black Carbon was not measured for PM10. Nevertheless, and because eBC exists in the ultrafine size fraction (less than 0.5 µm aerodynamic diameter) and because we have ran the sampling for both PM10 and PM2.5 simultaneously and following the same protocol, we will use the measured average eBC mass concentration of PM2.5 for the PM10, which is 6.6 μg/m3.
All elemental contributions and the eBC content for each sample were added up and compared with the total mass concentration obtained by gravimetric measurements. The ratio of the reconstructed mass concentrations from XRF and eBC measurements to the total mass concentration obtained by gravimetric measurements were found to have an overall average of 58%. This ratio is about 10% higher than that in PM2.5, showing that organic compound contributions to PM10 is about 10% less than that in its fine fraction (Hamdan et al., 2020). The domination of natural sources in PM10 reduces the percentage contribution of organic matter.
Organic carbon that could be due to both primary and secondary sources that are not detectable by techniques used in this study are secondary aerosol pollutants which are expected to be present in the vicinity of an active traffic highway. Alkanes are among the most abundant organic species (Pant et al., 2015). Other common organic compounds originating from road traffic emissions, solid fuel combustion and industrial emissions are polycyclic aromatic hydrocarbons (PAHs) (Chow et al., 2004). Biological and soil organic matter and organic acids are also reported in the literature as common organic PM (Pant et al., 2015). Pant et al., has reported organic matter contributions of more than 33% of PM2.5 for New Delhi in the summer. Based on organic tracers, Fu et al., has reported that traffic contributions can be as high as 43% (Fu et al., 2010).
XRD and SEM/EDS Results
Several samples were analyzed using XRD, SEM, and EDS, representing different weather condtions and on both dusty and clear days. The results for a few representitive samples are shown below.
Figure 6 shows the XRD pattern for sample #3 which was collected on January 28, 2018. This sample has a low mass concentration of 95 μg/m3. Unlike most other samples, the XRD pattern of this sample shows the presence of a good amount of halite, and low peak intensities for nitratine. The wind on that day was blowing from west starting from 12:00 noon until midnight (during sampling) with a speed of 24 km/h, bringing with it sea salts from the Arabian Gulf. Calcite, quartz, mascagnite, palygorskite, chlorite-serpentine and gypsum are also present in this sample. It is believed that gypsum is a secondary phase formed by the reaction of calcite with mascagnite to form koktaite as an intermediate phase, which is finally converted to gypsum in a few days in the atmosphere and appears in PM10. This explains the large amount of gypsum observed in this sample, the low peak intinsities of mascagnite, and the absence of koktaite. Large amounts of koktaite were observed in PM2.5 because of the lack of sufficient amount of calcite to complete the reaction (Song et al., 2015). These results were also confirmed by EDS elemental maps shown in Figure 7. This figure shows the presence of nitratine (a rectangular crystal in the middle of the SEM micrograph), three aglomorations of halite, calcite, gypsum and the other observed minaral phases in the XRD pattern.
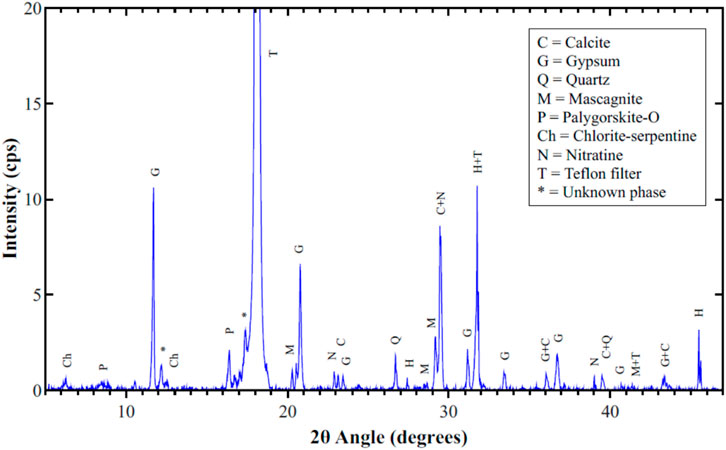
FIGURE 6. XRD pattern of sample # 3 collected on January 28, 3018.
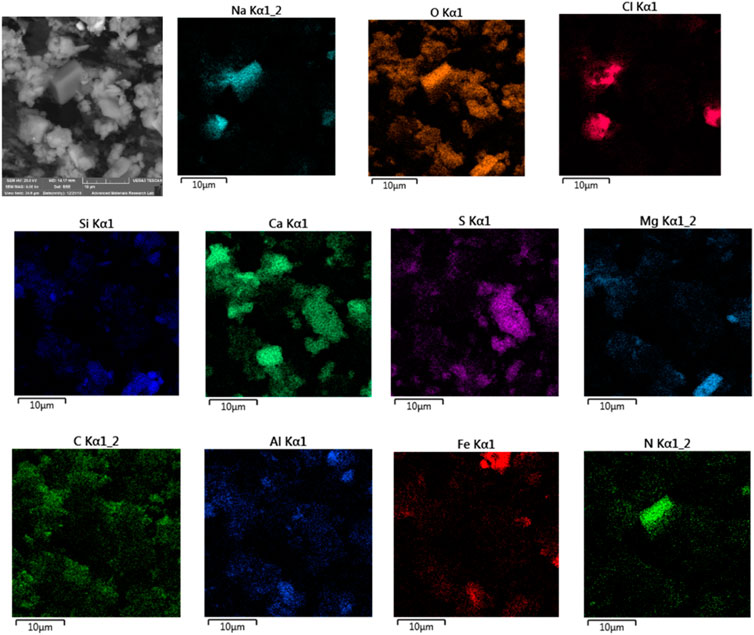
FIGURE 7. SEM micrograph and EDS elemental maps for sample #3.
Figure 8 shows the XRD pattern for filter #50, which was sampled on July 24, 2018 (a clear day) with a mass concentration of 125 μg/m3. It containes several phases with the major three being gypsum, calcite and nitrates. Lower amounts of sulfates (mascagnite and koktaite), palygorskite, and chlorite-serpentine are clear in the figure. Halite was not detected by XRD or even in the elemental maps, because wind on that day blew mostly from the south and south east with moderate wind speeds. Gypsum is a secondary pollutant resulting from the interaction of calcite with koktaite, as was mentioned above. EDS elemntal maps for part of filter #50 showed corrolations among elements of all the observed phases in the XRD pattern. Figure 9 shows the SEM micrograph and elemental maps of oxygen, nitrogen and sodium. The maps show an excellent corrolation among the three elements orginating from nitratine. No Cl was observed in these maps, suggesting that the Na is not due to the presence of halite. The formation of very large crystals of nitratine (∼50 µm in length) is due to melting of sodium nitrate in the early morning of July 25, just after sampling was completed, followed by evaporation of the melt as the temperature rose and RH decreased later in the day. The critical RH for sodium nitrate at 32°C is 72% (Adams and Merz, 1929). The temeperature on July 24, hours after the sampling was completed, ranged between 31 and 35°C, and the RH was above 75%. Later in the day, the temperature rose to 40°C and the RH dropped to 21%, causing the evaporation of the moisture.
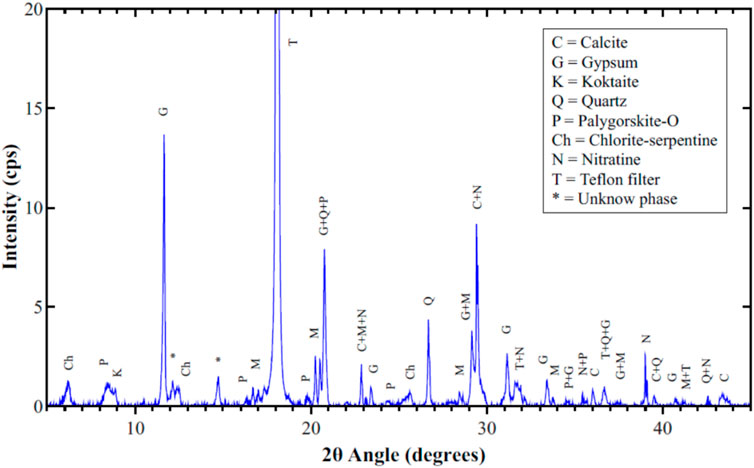
FIGURE 8. XRD pattern for PM10 sample #50, sampled on July 24, 2018, a clear day with PM mass concentration of 125 μg/m3.
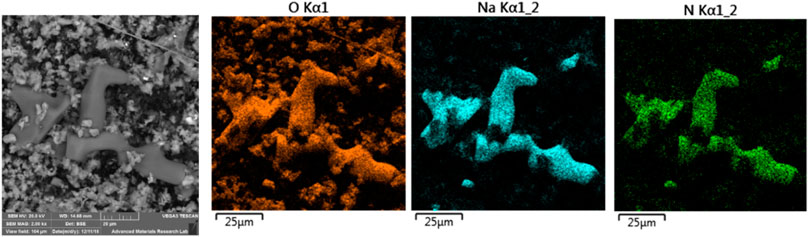
FIGURE 9. SEM micrograph and elemental maps of filter #50.
The phenomena of critical humidity and melting was also obsrved for other minerals, such as halite. Figure 10 shows SEM micrograph and elemental maps of Cl, Na, and O for sample #8. The sample was collected on February 20, 2018. It is clear that Na and Cl correlate well, while both don’t corrolate with oxygen, indicating that the large crystal shown on the micrograph is a halite crystal with dimesions of about 30 × 30 µm. The jets of the sampling head allow only paticles smaller than 10 µm diameter to be collected. Formation of large halite crystals happened because halite grains melted during the early hours of February 21, just after sampling had finished. The temperature on February 21, a few hours after the sampling was complete, reach 16°C, while the RH reached 83%. NaCl has a critical RH value of 76% at 16°C. Therefore, NaCl dissolved in the presence of RH above 76%. Later at mid-day, the RH dropped down to 45% while the temperature rose to 25°C, leading to evaporation of the moisture and formation of the observed large crystals (∼30 µm).
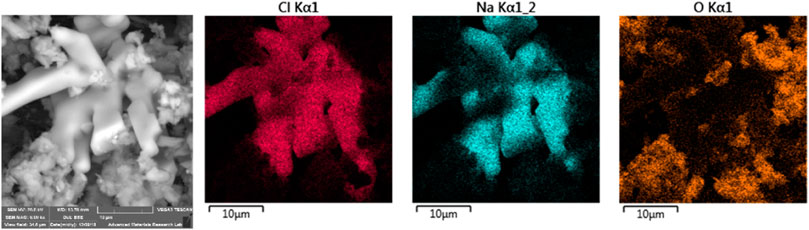
FIGURE 10. SEM micrograph and elemental maps of sample #8, showing large halite crystals.
Our SEM/EDS results for the presence of crustal-origin minerals and anthropogenic compounds agree with other studies in the region. Bulbul et al. (Adams and Merz, 1929), have observed elements such as Si, K, Ca, Mg, Zn, Fe, Cr, Pb, and Al in the PM. They have observed crystalline shaped particles suggesting their soil origin, and round particles suggesting their anthropogenic origin for samples collected in Islamabad, Pakistan. We have observed these crystalline shaped particles that were identified as different crystalline minerals mentioned above.
Conclusion
A systematic sampling campaign of PM10 aerosols was conducted at a site near a major highway in Sharjah, UAE. Samples were collected on Teflon filters following standard protocols. The average mass concentration of PM10 during the cold season was 137 μg/m3, which is below the international standards of 150 μg/m3, while it was 210 μg/m3 during the hot season, which is associated with more dust storms. Both the coarse and the fine fractions of PM10 were higher during the hot season compared to the cold season. This was also reflected by the seasonal variation of the mass concentration of elements from natural origin such as Si, Ca, Al, Fe. In contrast, the average mass concentration of anthropogenic elements, such as S, showed little seasonal variation.
Statistical analysis such as correlation coefficients and enrichment factors helped identify anthropogenic elements from those of natural origin. Ca, Si, Al, Fe, Mg, Mn, and P were identified to be of crustal origin, while Na and Cl are originating from sea breeze. Elements such as Rb, Zr, V, Cr, Ba, and Sr, are crustal elements that have been enriched by human activities. Ni and V are originating from heavy oil combustion, while Cu, Zn, S, and Pb are origination from human activities, mainly traffic exhaust and industrial emissions. Traffic also contributes to other elements through road dust resuspension, and tire and break erosion.
XRD, SEM, and EDS elemental maps were used to identify different mineral phases present in PM10. Calcite, quartz, gypsum, halite and nitratine are commonly observed phases in both the XRD and the elemental maps for most of the samples. Other minerals such as palygorskite, and chlorite-serpentine have also been observed in the XRD patterns. In addition to these natural minerals, secondary phases such as mascagnite and koktaite were observed in most samples. Unlike the case of PM2.5, the peak intensities of mascagnite and koktaite were relatively low compared to those of the natural minerals.
Data Availability Statement
The original contributions presented in the study are included in the section Supplementary Material below, further inquiries can be directed to the corresponding author.
Author Contributions
The authors have contributed to this article as follows: methodology, NH and HA; software, MS; validation, NH and HA; formal analysis, NH and HA; investigation, NH and MS; data curation, MS, HA, and NH; writing–original draft preparation, NH; writing–review and editing, HA and NH; supervision, NH; project administration, NH; funding acquisition, NH. All authors have read and agreed to the published version of the article.
Funding
We have received support from the college of Arts and Sciences at the American University of Sharjah.
Conflict of Interest
The authors declare that the research was conducted in the absence of any commercial or financial relationships that could be construed as a potential conflict of interest.
Acknowledgments
The authors acknowledge the support of the Dean’s office of the American university of Sharjah and the help of the Advanced Materials Research Lab at the University of Sharjah.
Supplementary Material
The Supplementary Material for this article can be found online at: https://www.frontiersin.org/articles/10.3389/fenvs.2021.666678/full#supplementary-material
Footnotes
1https://support.microsoft.com/en-us/office/correl-function-995dcef7-0c0a-4bed-a3fb-239d7b68ca92
2https://www.calculator.net/sample-size-calculator.html
References
Adams, J. R., and Merz, A. R. (1929). Hygroscopicity of Fertilizer Materials and Mixtures. Ind. Eng. Chem. 21, 305–307. doi:10.1021/ie50232a003
Al Jaberi, J., Thomsen, J., Al Hashimi, M., Al Bagham, S., Al Yousuf, M., Jamil, K., et al. (2010). The National Strategy and Action Plan for Environmental Health for the UAE. Abu Dhabi: Environmental Agency-Abu Dhabi.
Al Katheeri, E., Al Jallad, F., and Al Omar, M. (2012). Assessment of Gaseous and Particulate Pollutants in the Ambient Air in Al Mirfa City, United Arab Emirates. Jep 03, 640–647. doi:10.4236/jep.2012.37077
Al-Salem, S. (2008). An Overview of the PM10 Pollution Problem in Fahaheel Urban Area, Kuwait. Emirates J. Eng. Res. 13, 1–9.
Arashiro, M., and Leith, D. (2013). Precision of PM Measurements with the UNC Passive Aerosol Sampler. J. Aerosol Sci. 57, 181–184. doi:10.1016/j.jaerosci.2012.09.001
Bener, A., Dogan, M., Ehlayel, M., Shanks, N., and Sabbah, A. (2009). The Impact of Air Pollution on Hospital Admission for Respiratory and Cardiovascular Diseases in an Oil and Gas-Rich Country. Eur. Ann. Allergy Clin. Immunol. 41, 80–84.
Bove, M. C., Brotto, P., Cassola, F., Cuccia, E., Massabò, D., Mazzino, A., et al. (2014). An Integrated PM2.5 Source Apportionment Study: Positive Matrix Factorisation vs. The Chemical Transport Model CAMx. Atmos. Environ. 94, 274–286. doi:10.1016/j.atmosenv.2014.05.039
Chow, J. C., Watson, J. G., Kuhns, H., Etyemezian, V., Lowenthal, D. H., Crow, D., et al. (2004). Source Profiles for Industrial, Mobile, and Area Sources in the Big Bend Regional Aerosol Visibility and Observational Study. Chemosphere 54, 185–208. doi:10.1016/j.chemosphere.2003.07.004
Saraga, D., Maggos, T., Sadoun, E., Fthenou, E., Hassan, H., Tsiouri, V., et al. (2017). Chemical Characterization of Indoor and Outdoor Particulate Matter (PM2.5, PM10) in Doha, Qatar. Aerosol Air Qual. Res. 17, 1156–1168. doi:10.4209/aaqr.2016.05.0198
Duce, R. A., Hoffman, G. L., and Zoller, W. H. (1975). Atmospheric Trace Metals at Remote Northern and Southern Hemisphere Sites: Pollution or Natural? Science 187, 59–61. doi:10.1126/science.187.4171.59
Engelbrecht, J. P., McDonald, E. V., Gillies, J. A., Jayanty, R. K. M., Casuccio, G., and Gertler, A. W. (2009). Characterizing Mineral Dusts and Other Aerosols from the Middle East-Part 1: Ambient Sampling. Inhalation Toxicol. 21, 297–326. doi:10.1080/08958370802464273
Engelbrecht, J. P., McDonald, E. V., Gillies, J. A., “Jay” Jayanty, R. K. M., Casuccio, G., and Gertler, A. W. (2009). Characterizing Mineral Dusts and Other Aerosols from the Middle East-Part 2: Grab Samples and Re-Suspensions. Inhalation Toxicol. 21, 327–336. doi:10.1080/08958370802464299
EU-Commission (2020). Air Quality Standards. Available at: https://ec.europa.eu/environment/air/quality/standards.htm.
Feng, J., Yu, H., Su, X., Liu, S., Li, Y., Pan, Y., et al. (2016). Chemical Composition and Source Apportionment of PM2.5 during Chinese Spring Festival at Xinxiang, a Heavily Polluted City in North China: Fireworks and Health Risks. Atmos. Res. 182, 176–188. doi:10.1016/j.atmosres.2016.07.028
Fu, P. Q., Kawamura, K., Pavuluri, C. M., Swaminathan, T., and Chen, J. (2010). Molecular Characterization of Urban Organic Aerosol in Tropical India: Contributions of Primary Emissions and Secondary Photooxidation. Atmos. Chem. Phys. 10, 2663–2689. doi:10.5194/acp-10-2663-2010
Gibson, J. M., and Farah, Z. S. (2012). Environmental Risks to Public Health in the United Arab Emirates: a Quantitative Assessment and Strategic Plan. Environ. Health Perspect. 120, 681–686. doi:10.1289/ehp.1104064
Gibson, J. M., Thomsen, J., Launay, F., Harder, E., and DeFelice, N. (2013). Deaths and Medical Visits Attributable to Environmental Pollution in the United Arab Emirates. PloS one 8, e57536.
Hamdan, N., Alawadhi, H., Jisrawi, N., and Shameer, M. (2018). Characterization of Fine Particulate Matter in Sharjah, United Arab Emirates Using Complementary Experimental Techniques. Sustainability 10, 1088. doi:10.3390/su10041088
Hamdan, N. M., Alawadhi, H., Alawadhi, H., and Jisrawi, N. (2015). Elemental and Chemical Analysis of PM10 and PM2.5 Indoor and Outdoor Pollutants in the UAE. Ijesd 6, 566–570. doi:10.7763/ijesd.2015.v6.658
Hamdan, N. M., Alawadhi, H., and Jisrawi, N. (2016). “Particulate Matter Pollution in the United Arab Emirates: Elemental Analysis and Phase Identification of Fine Particulate Pollutants,” in Proceedings of the 2nd World Congress on New Technologies (NewTech'16), Budapest, Hungary, August 18–19, 2016.
Hamdan, N. M., Alawadhi, H., Jisrawi, N., and Shameer, M. (2018). Size-resolved Analysis of Fine and Ultrafine Fractions of Indoor Particulate Matter Using Energy Dispersive X-Ray Fluorescence and Electron Microscopy. X-Ray Spectrom. 47, 72–78. doi:10.1002/xrs.2813
Hamdan, N. M., Alawadhi, H., and Shameer, M. (2020). Characterization of PM 2 .5 at a Traffic Site Using Several Integrated Analytical Techniques. X‐Ray Spectrom. 50, 106–120. doi:10.1002/xrs.3201
Helmenstine, A. M. (2020). Chemical Composition of the Earth's Crust - Elements. Available at: https://www.thoughtco.com/chemical-composition-of-earths-crust-elements-607576.
Hochstetler, H. A., Yermakov, M., Reponen, T., Ryan, P. H., and Grinshpun, S. A. (2011). Aerosol Particles Generated by Diesel-Powered School Buses at Urban Schools as a Source of Children's Exposure. Atmos. Environ. 45, 1444–1453. doi:10.1016/j.atmosenv.2010.12.018
Holmes, A., Illowsky, B., and Dean, S. (2015). “Testing the Significance of the Correlation Coefficient,” in Introductory Business Statistics. (Houston, TX: OpemDtax).
Javed, W., and Guo, B. (2021). Chemical Characterization and Source Apportionment of Fine and Coarse Atmospheric Particulate Matter in Doha, Qatar. Atmos. Pollut. Res. 12, 122–136. doi:10.1016/j.apr.2020.10.015
Reid, J., Westphal, D., Reid, E., Walker, A., Liu, M., Miller, S., et al. (2008). The United Arab Emirates Unified Aerosol Experiment (UAE2). J. Geophys. Res. 113, D14213. doi:10.1029/2007JD009435
Li, Y., Gibson, J. M., Jat, P., Puggioni, G., Hasan, M., West, J. J., et al. (2010). Burden of Disease Attributed to Anthropogenic Air Pollution in the United Arab Emirates: Estimates Based on Observed Air Quality Data. Sci. total Environ. 408, 5784–5793. doi:10.1016/j.scitotenv.2010.08.017
Manousakas, M., Diapouli, E., Papaefthymiou, H., Kantarelou, V., Zarkadas, C., Kalogridis, A.-C., et al. (2018). XRF Characterization and Source Apportionment of PM10 Samples Collected in a Coastal City. X-Ray Spectrom. 47, 190–200. doi:10.1002/xrs.2817
Manousakas, M., Papaefthymiou, H., Diapouli, E., Migliori, A., Karydas, A. G., Bogdanovic-Radovic, I., et al. (2017). Assessment of PM2.5 Sources and Their Corresponding Level of Uncertainty in a Coastal Urban Area Using EPA PMF 5.0 Enhanced Diagnostics. Sci. Total Environ. 574, 155–164. doi:10.1016/j.scitotenv.2016.09.047
May, W., and Rumble, J. (2002). Certificate of Analysis, Standard Reference Material® 2783, Air Particulate on Filter Media. Gaithersburg, MD: National Institute of Standards & Technology.
Mazzei, F., D'alessandro, A., Lucarelli, F., Nava, S., Prati, P., Valli, G., et al. (2008). Characterization of Particulate Matter Sources in an Urban Environment. Sci. Total Environ. 401, 81–89. doi:10.1016/j.scitotenv.2008.03.008
Miller, K. A., Siscovick, D. S., Sheppard, L., Shepherd, K., Sullivan, J. H., Anderson, G. L., et al. (2007). Long-Term Exposure to Air Pollution and Incidence of Cardiovascular Events in Women. N. Engl. J. Med. 356, 447–458. doi:10.1056/nejmoa054409
NCMS (2019). UAE Climate Yearely Report 2003- 2018. Available at: https://www.ncm.ae/en/climate-reports-yearly.html?id=8805.
Pant, P., Shukla, A., Kohl, S. D., Chow, J. C., Watson, J. G., and Harrison, R. M. (2015). Characterization of Ambient PM2.5 at a Pollution Hotspot in New Delhi, India and Inference of Sources. Atmos. Environ. 109, 178–189. doi:10.1016/j.atmosenv.2015.02.074
Phanikumar, D. V., Basha, G., Ratnam, M. V., Kondapalli, N. K., Ouarda, T. B. M. J., and Pangaluru, K. (2020). Assessment of Particulate Matter Concentration and Gaseous Pollutants in Urban and Rural Regions over the Emirate of Abu Dhabi, UAE. J. Atmos. Solar-Terrestrial Phys. 199, 105217. doi:10.1016/j.jastp.2020.105217
Rudnick, R. L., and Gao, S. (2003). Composition of the Continental Crust. The crust 3, 1–64. doi:10.1016/b0-08-043751-6/03016-4
Samek, L., Stegowski, Z., and Furman, L. (2016). Preliminary PM2.5 and PM10 Fractions Source Apportionment Complemented by Statistical Accuracy Determination. Nukleonika 61, 75–83. doi:10.1515/nuka-2016-0014
Song, X., Shao, L., Zheng, Q., and Yang, S. (2015). Characterization of Crystalline Secondary Particles and Elemental Composition in PM10 of North China. Environ. Earth Sci. 74, 5717–5727. doi:10.1007/s12665-015-4589-y
Tsiouri, V., Kakosimos, K. E., and Kumar, P. (2015). Concentrations, Sources and Exposure Risks Associated with Particulate Matter in the Middle East Area-A Review. Air Qual. Atmos. Health 8, 67–80. doi:10.1007/s11869-014-0277-4
Wang, X., Bi, X., Sheng, G., and Fu, J. (2006). Chemical Composition and Sources of PM10 and PM2.5 Aerosols in Guangzhou, China. Environ. Monit. Assess. 119, 425–439. doi:10.1007/s10661-005-9034-3
WHO (2018). WHO Global Ambient Air Quality Database. Available at: https://www.who.int/airpollution/data/en/.
Wong, C. M., Tsang, H., Lai, H. K., Thomas, G. N., Lam, K. B., Chan, K. P., et al. (2016). Cancer Mortality Risks from Long-Term Exposure to Ambient Fine Particle. Cancer Epidemiol. Biomarkers Prev. 25, 839–845. doi:10.1158/1055-9965.epi-15-0626
Wu, L., Luo, X.-S., Li, H., Cang, L., Yang, J., Yang, J., et al. (2019). Seasonal Levels, Sources, and Health Risks of Heavy Metals in Atmospheric PM2.5 from Four Functional Areas of Nanjing City, Eastern China. Atmosphere 10, 419. doi:10.3390/atmos10070419
Keywords: PM10, chemical composition, anthropogenic sources, traffic site, aerosol pollution, seasonal variation
Citation: Hamdan NM, Alawadhi H and Shameer M (2021) Physicochemical Characterization and Seasonal Variations of PM10 Aerosols in a Harsh Environment. Front. Environ. Sci. 9:666678. doi: 10.3389/fenvs.2021.666678
Received: 10 February 2021; Accepted: 22 April 2021;
Published: 07 May 2021.
Edited by:
Manousos-Ioannis Manousakas, Paul Scherrer Institut (PSI), SwitzerlandReviewed by:
Imran Shahid, Qatar University, QatarImoh B. Obioh, Institute for Physics and Ecology Ltd/GTE, Nigeria
Copyright © 2021 Hamdan, Alawadhi and Shameer. This is an open-access article distributed under the terms of the Creative Commons Attribution License (CC BY). The use, distribution or reproduction in other forums is permitted, provided the original author(s) and the copyright owner(s) are credited and that the original publication in this journal is cited, in accordance with accepted academic practice. No use, distribution or reproduction is permitted which does not comply with these terms.
*Correspondence: Nasser M. Hamdan, bmhhbWRhbkBhdXMuZWR1