 Yi-He Fang
 Meng-Meng Zhang4
 Zhi-Qiang Gong
- 1Regional Climate Center of Shenyang, Shenyang, China
- 2The Institute of Atmospheric Environment, China Meteorological Administration, Shenyang, China
- 3Key Opening Laboratory for Northeast China Cold Vortex Research, China Meteorological Administration, Shenyang, China
- 4Liaoning Provincial Meteorological Service Center, Shenyang, China
- 5College of Physics and Electronic Engineering, Changshu Institute of Technology, Jiangsu, China
- 6Laboratory for Climate Studies, National Climate Research Center, China Meteorological Administration, Beijing, China
- 7Sujiatun District Bureau of Meteorology, Shenyang, China
In this study, a K-means clustering (KMC) method was used to identify the paths of the Northeast China (NEC) Cold Vortex (NCCV). The NCCV was divided into four types according to the identified active paths: (1) Eastward movement type (EM); (2) Southeastward long-distance movement type (SLM); (3) Eastward short-distance movement type (ESM); and (4) Southward short-distance movement type (SSM). The characteristics of the four types of the NCCV, along with their impacts on the precipitation during early summer in NEC, were studied. The results showed that the KMC method can effectively divide the NCCV events into four different types. The maintaining days of these four types of the NCCV were found to have obvious interannual and interdecadal variation features. For example, the maintaining days of the EM and ESM types were mainly characterized by interannual variability, while the SLM and SSM types have the obvious 10–13a interdecadal variation along with interannual variability. In terms of the spatial distributions and impacts on precipitation, the EM type was found to appear in the majority of the areas located in NEC, the SLM type mainly occurred in the northwestern region of NEC and the highest rain center was located in the south-central portion, while the ESM type and SSM type were observed precipitation only appear in a small portion of the northeastern region. In addition, it is also observed the distribution of the sea-surface temperature (SST) anomalies had close relationship with the formation of these four types of the NCCV. The tripole distributions of the SST anomalies in the Atlantic Ocean corresponded to the EM type of the NCCV, the positive anomalies of SST in the eastern equatorial Pacific Ocean and negative anomalies in the western equatorial Pacific corresponded to the SLM type, the positive SSTs in the Northwest Pacific correspond to the ESM type, while negative anomalies SST in the western equatorial Pacific Ocean corresponded to the SSM type of the NCCV.
Introduction
Northeast China (NEC) located in the middle and high latitude areas of Northeast Asia, which includes Heilongjiang Province, Jilin Province, Liaoning Province, and the eastern portion of the Inner Mongolia Autonomous Region. The total area of NEC accounts for 13% of the entire country. The region is characterized by mountains and water bodies, as well as vast expanses of fertile land. NEC is considered to be an important commodity grain base, animal husbandry base, forestry base, and heavy industry base in China. The Northeastern China Cold Vortex (NCCV) is a special and important weather system which impacts the region. As an important cutoff low-pressure system affecting NEC, its activities are also key factors involved in the flood, drought, and low-temperature damages which may occur (Sun and An, 2001; Sun et al., 2002; Wang et al., 2007). The NCCV not only has major impacts on the weather and climate conditions in NEC, but its peripheral activities are also of major significance for the weather and climate conditions in eastern China and even Eastern Asia (Sun, 1997; Liu et al., 2002; Lian et al., 2016).
The NCCV can potentially appear during any season, and the activities of the NCCV change significantly among the seasons. Generally speaking, the NCCV system is more active during the summer months, with the most frequent activities of the NCCV occurring in June. Its activities are characterized by mass occurrences and persistence (Zhang and Li, 2009; Shen et al., 2011). The statistical data collected by Liu et al. (2015) revealed that from May to August, the NCCV activities have obvious spatial distribution characteristics, and the main active areas tend to be concentrated in the region of 121 to 131°E, 48 to 53°N. In addition, the previous research results have indicated that under the control of the persistent NCCV in local regions of NEC, the localized precipitation tend to be high in the spring and summer seasons (Hu et al., 2011). In addition, Ding et al. (2019) pointed out that the weak NCCV is one of the reasons for the unusually high summer temperature in China in 2018. Lian et al. (2010) and Liu et al. (2017) proposed that NCCV precipitation has also has significant “cumulative effects,” which are generally reflected in the distribution characteristics of the precipitation anomalies in NEC during the early summer months. In addition, there has been found to be a significant positive correlation between the intensity levels of the NCCV during the summer and the precipitation levels in the Huaihe River Basin during the same periods (Li et al., 2015). Combined with the close relationship between the NCCV and precipitation in China, meteorologists have also carried out extended research and development of summer climate prediction methods (Feng et al., 2001; Fan and Wang, 2010; Gong et al., 2014; Liu and Ren, 2015; Ren et al., 2019). Zhao et al. (2015) found that the dynamical-statistical combining principle can more accurately grasp the summer NCCV trend, providing a strong diagnosis basis for precipitation prediction.
Liang et al. (2009) found through statistical examinations that the spatial distributions of the NCCV are quite different during different seasons. For example, during the early spring (April), the NCCV concentration areas are generally in the north portion of the NEC, which is located at approximately 52°N. However, at the end of the spring season and the beginning of the summer season, the high-frequency areas of NCCV activities will potentially reach the southernmost point of the region, or at approximately 43°N. Fang et al. (2020) found that there is a significant relationship between the interannual anomalies of the south-north positions of the NCCV and the Sea Surface Temperatures (SSTs) During the Early Summer Periods. Liu et al. (2015) found through in-depth analysis of the NCCV activities that there were obvious spatial distribution characteristics for the NCCV from May to August. The concentration areas of longitude circle activity ranged between 121 and 131°E, and the concentration areas of parallel circle activity ranged between 48 and 53°N. Xie and Bueh (2015) got meaningful conclusions on the research of the classification of circulation patterns. From the perspective of research progress to date, there has few studies on the effective classification of the activity range of the NCCV, and the relevant research on its influencing effects and mechanism require further investigation.
The previous studies have generally focused on the climate impacts of all the NCCV processes (Yang et al., 2012; Xie and Buhe, 2016). However, due to the obvious differences in the causes and variation characteristics of the NCCV, as well as its different impacts on climatic conditions in different regions of NEC during early summer, this study considered that the current findings were not enough to meet the urgent need for refined climate predictions in NEC if the NCCV was studied only as a whole. Therefore, this study carried out a classified study based on the characteristics of the activity paths of the NCCV, and then analyzed the climatologic characteristics of the different paths of the NCCV and their impacts on the precipitation in NEC during early summer. The goal of this study was to further the understanding of the causes of the NCCV, as well as potentially providing important references for the cause diagnoses and refined predictions of the NCCV anomalies.
Data and Method
This study’s investigations were mainly based on (1) The daily precipitation observation data of 245 stations in NEC from June of 1979 to June of 2018, which were provided by the National Meteorological Information Center. (2) NCEP/NCAR reanalysis dataset, variables are monthly mean wind field and geopotential height, the grid resolution is 2.5° × 2.5°. (3) Sea surface temperature (SST) data from Hadley Centre, the grid resolution is 1° × 1°, This study classified the NCCV activity paths during the early summer months in NEC by adopting a K-means clustering method (K-Means, KM) (Fang et al., 2020). We use wavelet analysis, correlation analysis and significance testing in this study. The timeframe of study selected in this investigation ranged from June of 1979 to June of 2018.
K-Means Clustering Method (K-Means, KM)
K-means clustering originated from the field of signal processing and belongs to the category of unsupervised clustering in machine learning clustering analysis methods. The Euclidean distance is used to measure the similarity between samples, and data clustering is performed according to the degree of similarity. These methods are widely used in many fields due to their intuitive and fast characteristics (Fang et al., 2021).
The definition of the NCCV index: The absolute values of the field anomaly calculations of the lowest potential height fields in the inner circles of the NCCV occurrence days from June of 1979 to June of 2018. The adopted index calculation method was not only able to accurately reflect the number of cold vortex days, but also represented the intensities of cold vortex centers. At the same time, the cold vortex weather processes within the NEC region were transformed into a climate time scale.
Screening of the NCCV Parameters
The objective identification data of the NCCV processes during the early summer months in the study area were collected, including the duration times, longitudes, latitudes, geopotential heights of the NCCV centers, NCCV radii, and so on. The NCCV processes were screened by the factors of the occurrence times and durations of the NCCV. In the present study, the occurrence time condition of the NCCV was that the process contained at least one record in June, and the duration condition of the NCCV was that the total duration of the process was 72 h in length. The screened NCCV processes were then used as the research samples.
Calculations of the Path Description Parameters of the NCCV Samples
The longitudes and latitudes (source information), radial variances, zonal variances, meridional mean values, latitudinal mean values, diagonal variances (moving directions and distances of the NCCV), and the longitude and latitude of the NCCV process tracks within the geographical range of NEC (relationships between tracks and the geographical locations of NEC) were calculated, respectively. The aforementioned parameters were preliminarily used to describe the activity paths of the NCCV. In addition, other parameters which could be utilized to characterize the properties of the NCCV were also added according to the actual needs of the investigation. The formula was as follows:
Where xi and yi represent the longitude and latitude at time i on the NCCV paths, and n indicates the times of the positioning.
Objective Classifications of the NCCV Paths
Prior to using the KMC method to classify the NCCV activity paths, the values of the number of classifications K were first determined. Then, taking the path parameters obtained in Step 2 as the data set, combined with relevant research findings and expert opinions, the 2–7 initial classification numbers were preliminarily determined in this study in order to calculate the silhouette coefficients corresponding to 2–7 initial classification numbers, respectively. It was found that the closer the silhouette coefficient was to 1, the more reasonable the classification number. Therefore, the optimal classification numbers could be determined. This study’s flow chart of KMC method was as Figure 1:
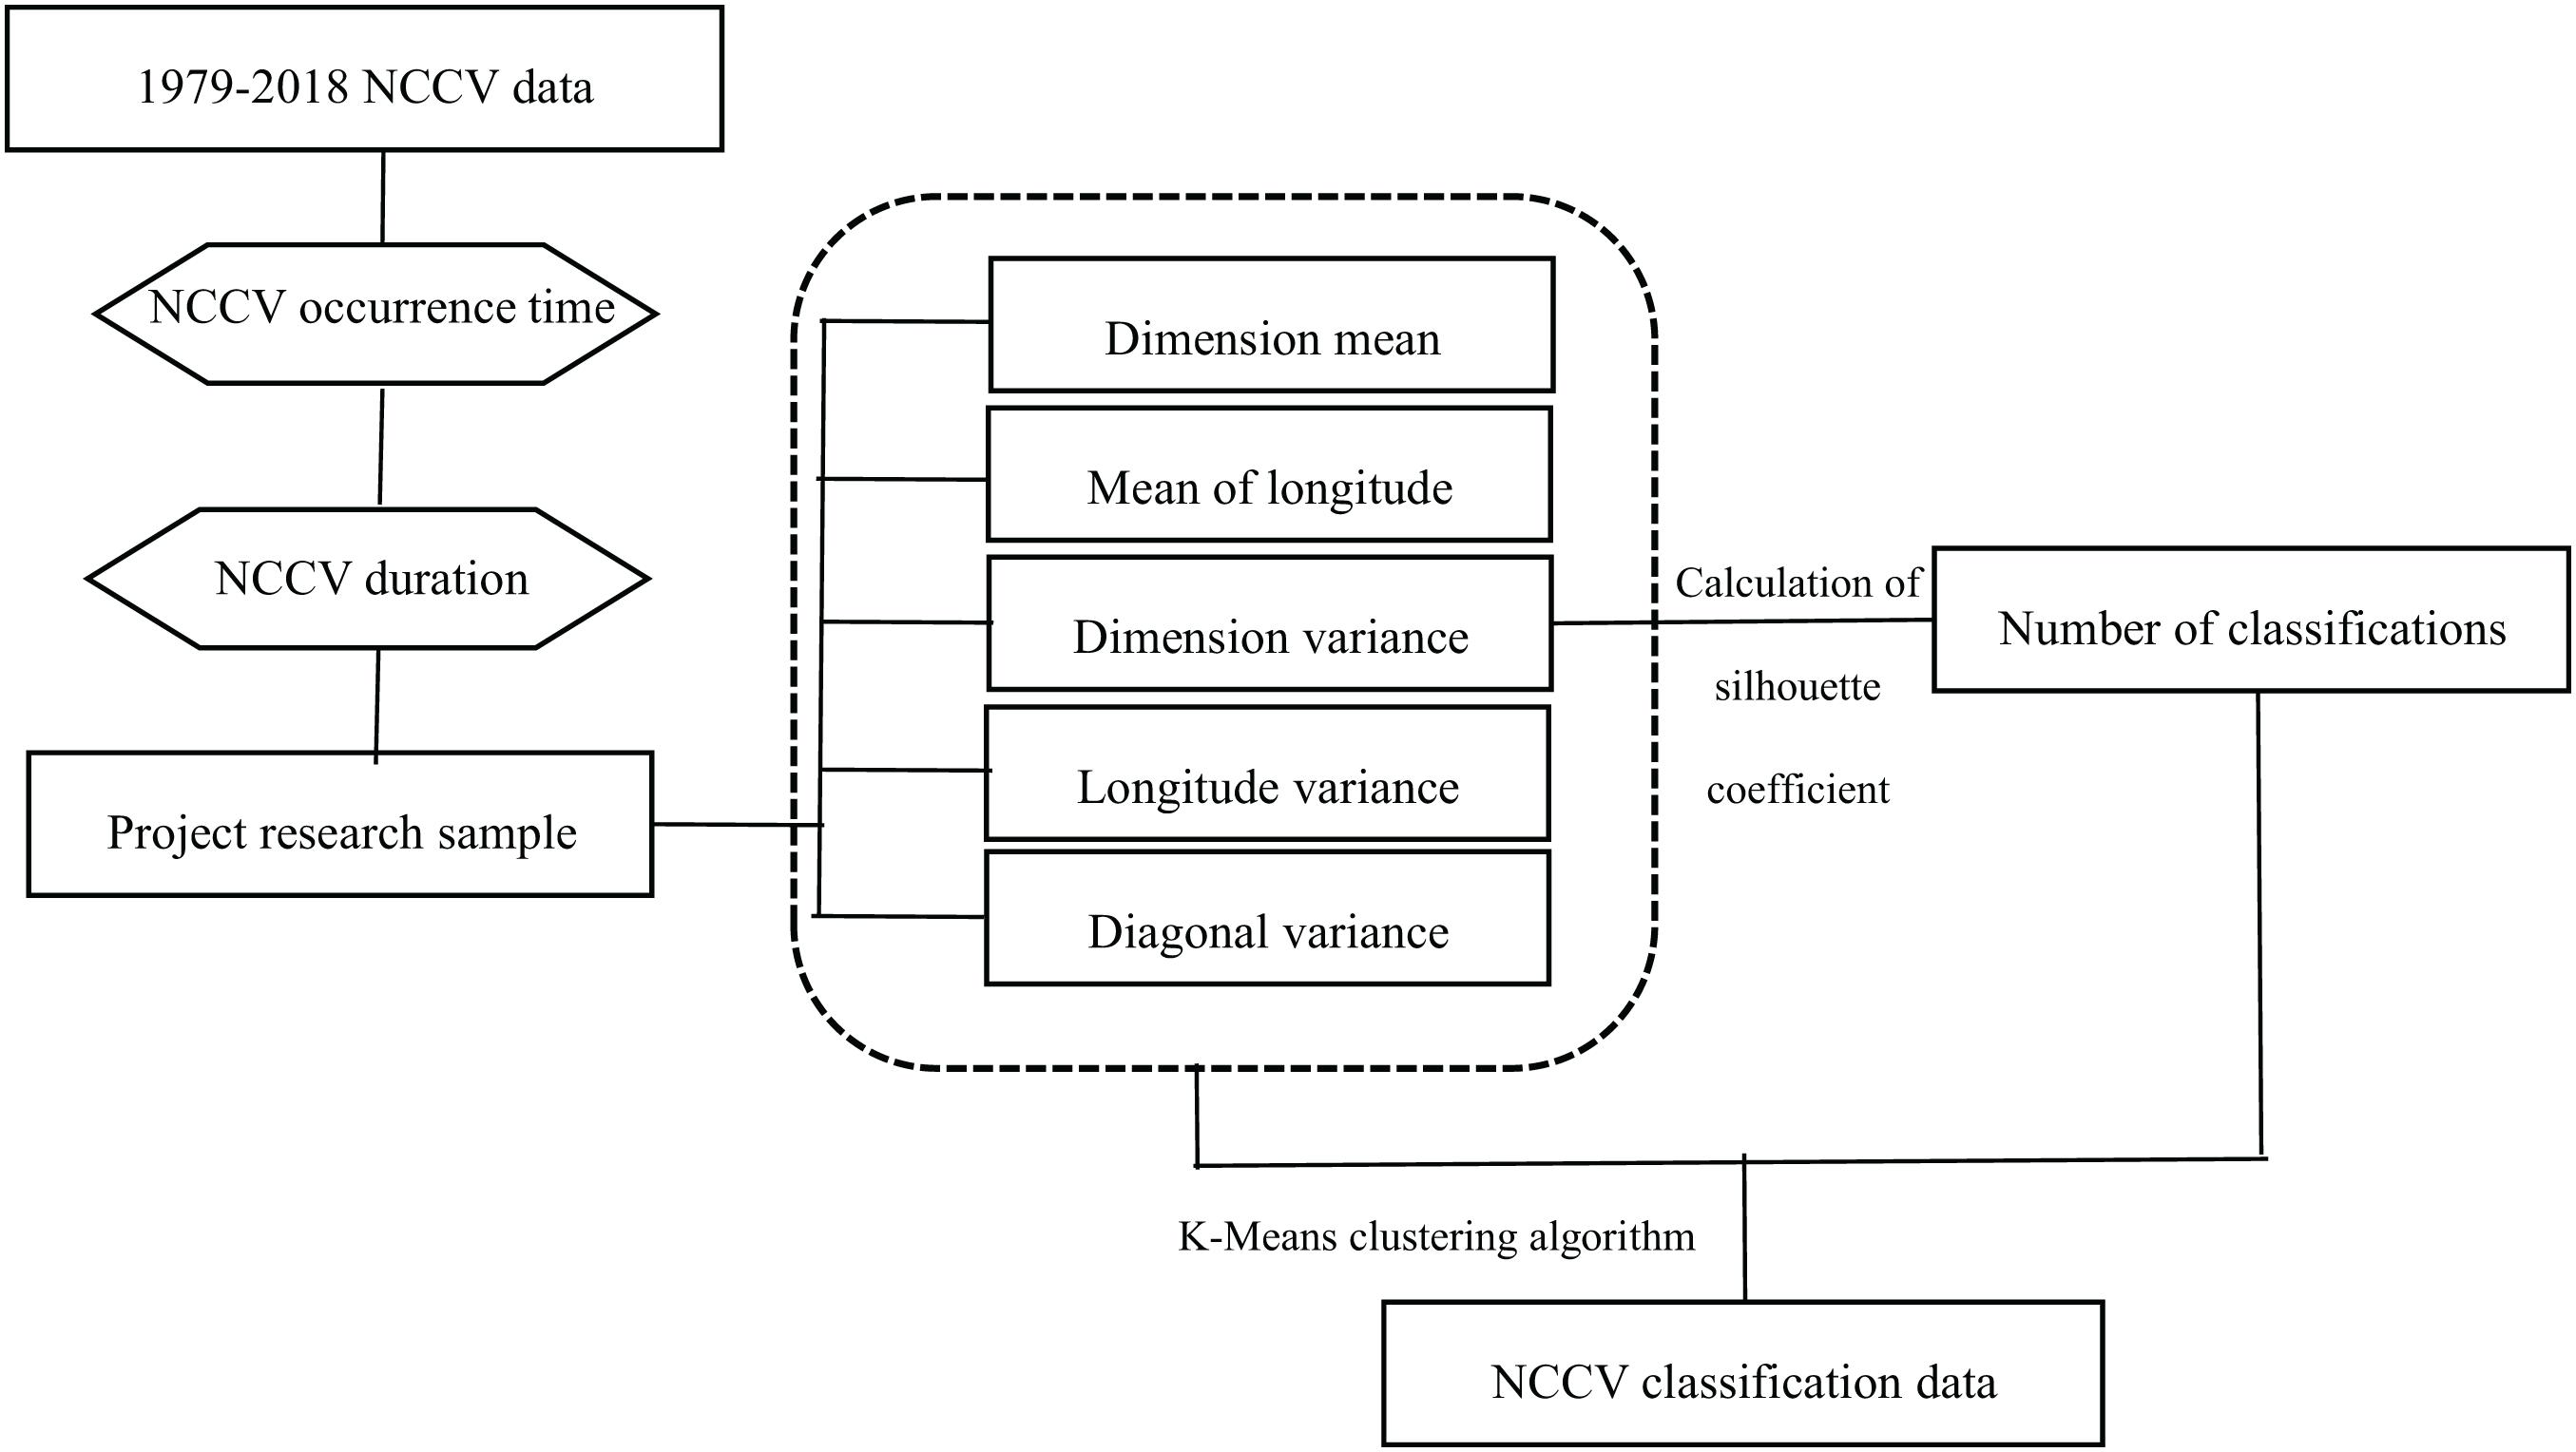
Figure 1. Flow chart of the K-means clustering method for the NCCV path classifications.
Since KMC clustering methods cannot determine the number of classifications independently, this study set the number of clusters as integers between 2 and 9, and then compared the Silhouette Coefficients of the different clustering results. The Silhouette Coefficient is calculated by the dissimilarity degree between inside and outside of the cluster, and its value is between −1 and 1. The closer the value is to 1, the better the classification result is. Because it can show the cohesion and separation of clustering results, the Silhouette Coefficients are important parameters used to measure the clustering effects. The larger the Silhouette Coefficient, the better the classification effects (Wang et al., 2018).
Wavelet Analysis
Wavelet analysis is an important tool for periodic analysis processes (Lau and Weng, 1995; Torrence and Compo, 1998). The most commonly used methods in Morlet wavelet analysis processes are non-orthogonal wavelet methods. The general mathematical form of that method is as follows:
Where ω0 represents the center frequency of a wavelet. Its Fourier Transform can be written as follows:
Morlet wavelets are a type of single frequency complex sinusoidal modulated Gaussian wave, and are also considered to be common complex valued wavelets. Their time-frequency domains have good locality.
Statistical Analysis of the Climatic Characteristics of Various Types of NCCV in NEC
Activity Characteristics of Various NCCV Types in NEC
It was found that from the early summer months of 1979 to the early summer months of 2018, there were 97 NCCV processes which had effects in NEC. A total of 588 NCCV occurrence days were identified, with an average duration of 5.8 days. In the present study, based on a KMC method, the aforesaid 97 NCCV processes were divided into four categories according to the similarities and differences of their main evolution paths (Fang et al., 2021). Figure 2 shows the spatial distributions of the activity path classifications of the NCCV in early summer. Among those, as can be seen in the figure, the Eastward movement type (EM) mainly occurred in the west, at the borders between eastern Inner Mongolia and Mongolia and Russia. The majority then disappeared near the Japanese Sea, with an activity scope covering the entire northeastern region. The southeastward long-distance movement type (SLM) mainly occurred in Baikal Lake area and its northwestern region, with the majority disappearing into the eastern part of Inner Mongolia and dying out. The activity range was found to be concentrated in the eastern section of Inner Mongolia and northeastern Mongolia. The eastward short-distance movement type (ESM) was found to be mainly generated in the northeastern section of Mongolia, and then disappeared into the northern region of the northwestern and northeastern Mongolia, with an activity scope covering the northwestern section of the study region. The southward short-distance movement type (SSM) mainly generated and disappeared in the northeastern section of the study area, with the activity range was found to be limited to the northeastern portion of the region. In the present study, from the perspective of the influencing effects of the NCCV, it was believed that the EM type may have affected the entirety of NEC. The SLM type had potentially mainly affected the central and northern areas of NEC, as well as the northwestern areas in particular. The ESM and SSM type were found to have little influence in NEC, with affects observed only in some parts of the northern areas of the NEC.
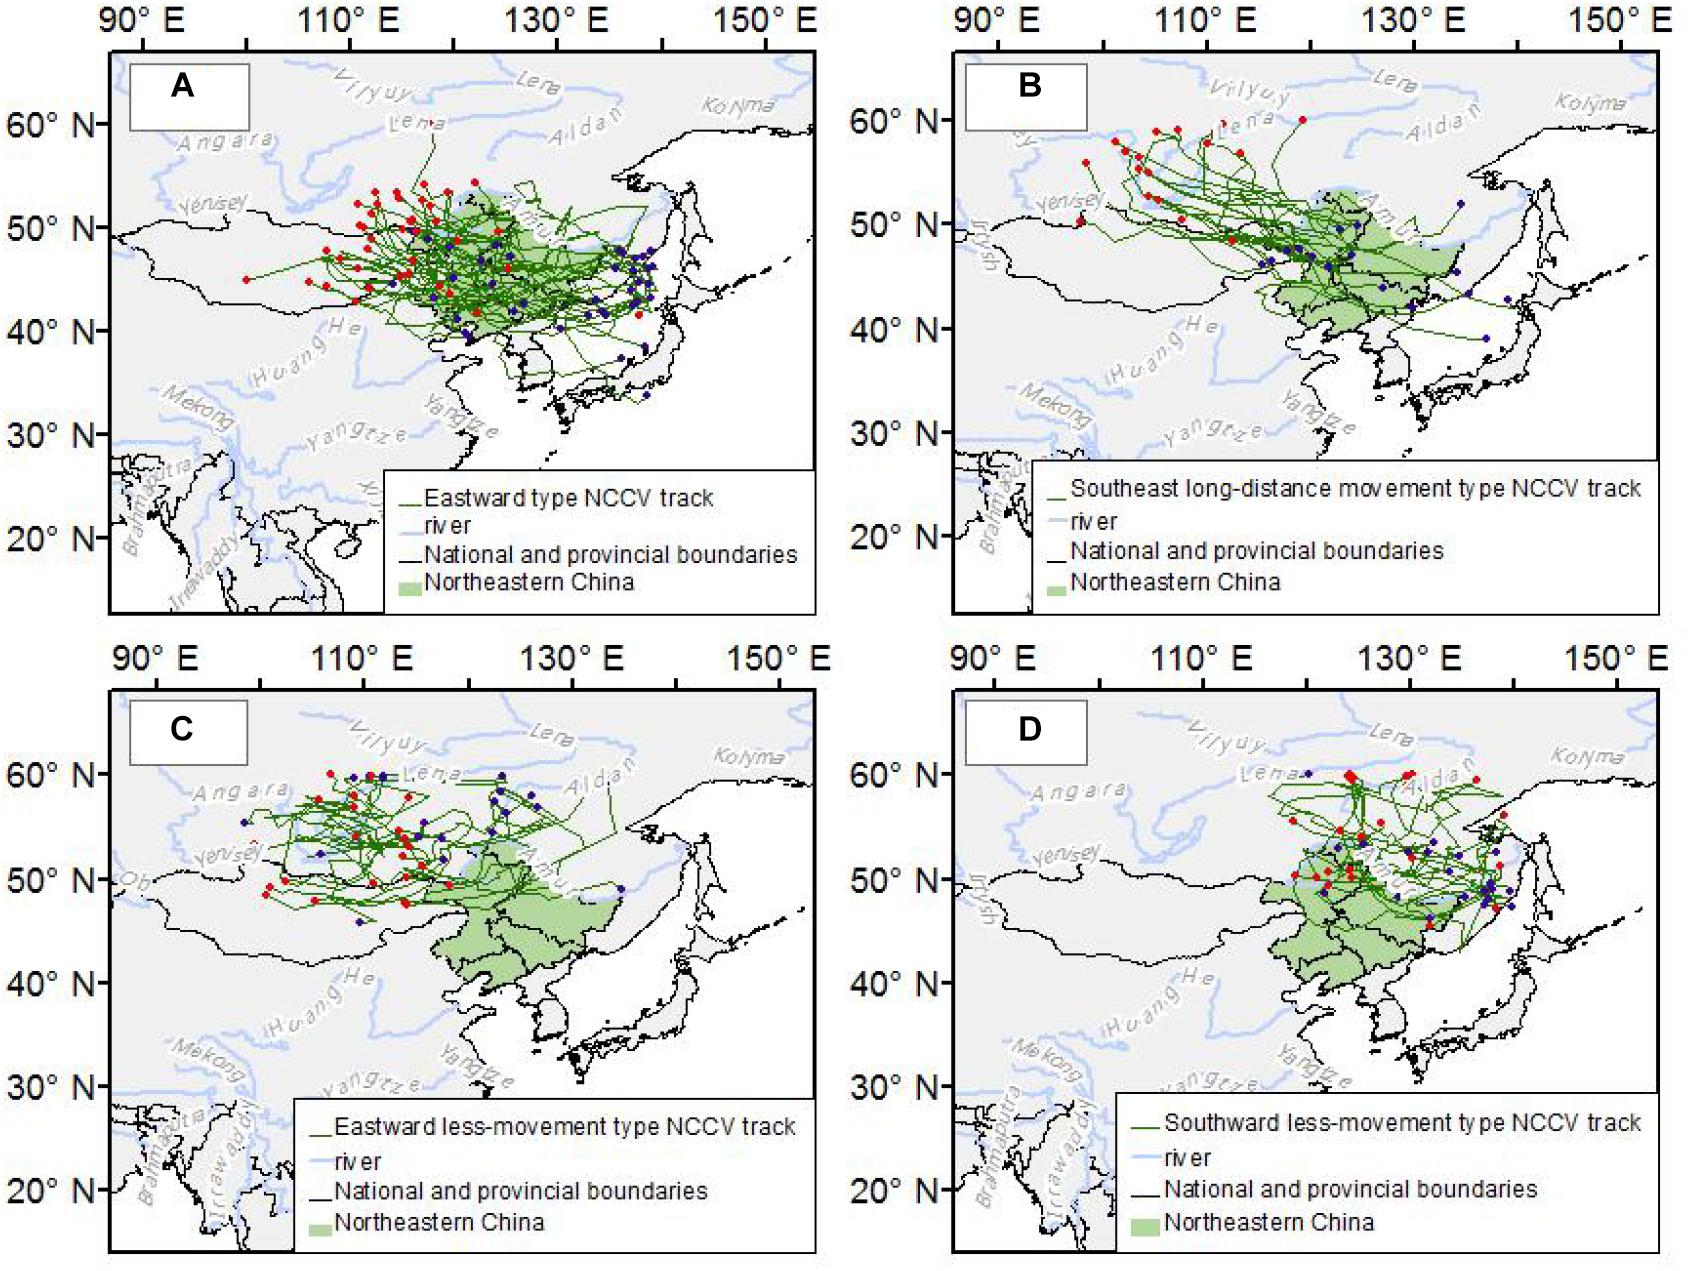
Figure 2. Spatial distributions of the NCCV with four types of paths: (A) EM type; (B) SLM type; (C) ESM type; (D) SSM type.
The activity characteristics of the four types of the NCCV are detailed in Table 1. The EM type NCCV was found to have the highest frequency of occurrence, as well as the longest duration times. It was identified for a total 23 occurrences, which accounted for 31.6% of the total frequency of occurrences during the early summer seasons. The average duration was 9.8 days. The SLM type NCCV had the lowest frequency of occurrence, accounting for 19.2% of the total frequency during the early summer months in the study area. In addition, the SSM type NCCV had the shortest duration, with an average duration of 5.8 days.
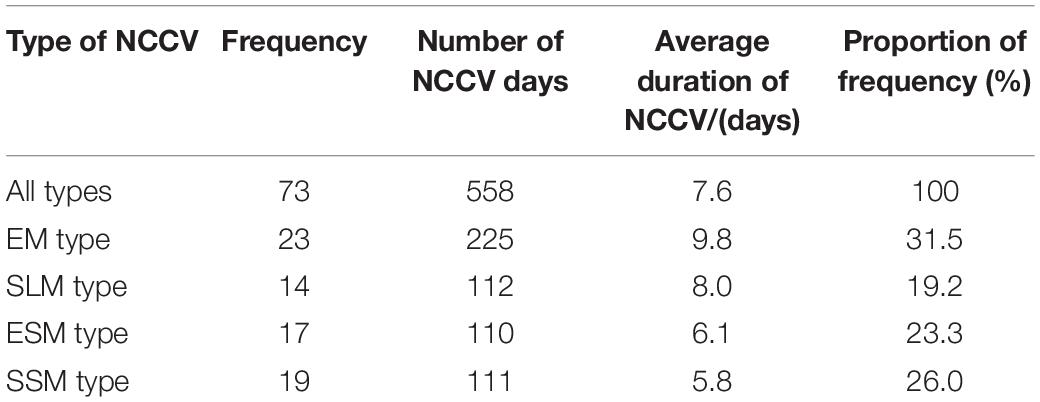
Table 1. Statistical characteristics of the four types of NCCV activities for the period ranging from June of 1979 to June of 2018.
It was found that according to the wavelet analysis spectrum for the durations of the four types of NCCV from June of 1979 to June of 2018 (Figure 3), the number of days of the EM type NCCV mainly averaged 4 to 8a prior to 2010, and a significant power spectrum was concentrated in 3 to 5a frequency band after 2010. In addition to the significant 2 to 3a period before and after the 2010s, there was also a significant interdecadal variation period observed for the SLM type NCCV. The interdecadal variation characteristics were 8 to 12a before 2000 and 10 to 14a after 2000. Then, after 2010, the ESM type NCCV displayed the interannual variation characteristics of 2 to 3a periods. The SSM type NCCV had interannual variations of 4 to 6a periods prior to 2000 and 10 to 14a interdecadal variations after 2000, with 2 to 3a significant periods observed around 2010. Therefore, the number of process days of the EM and ESM type NCCV were also characterized by the interdecadal variations of 10 to 13a as well as interannual periods.
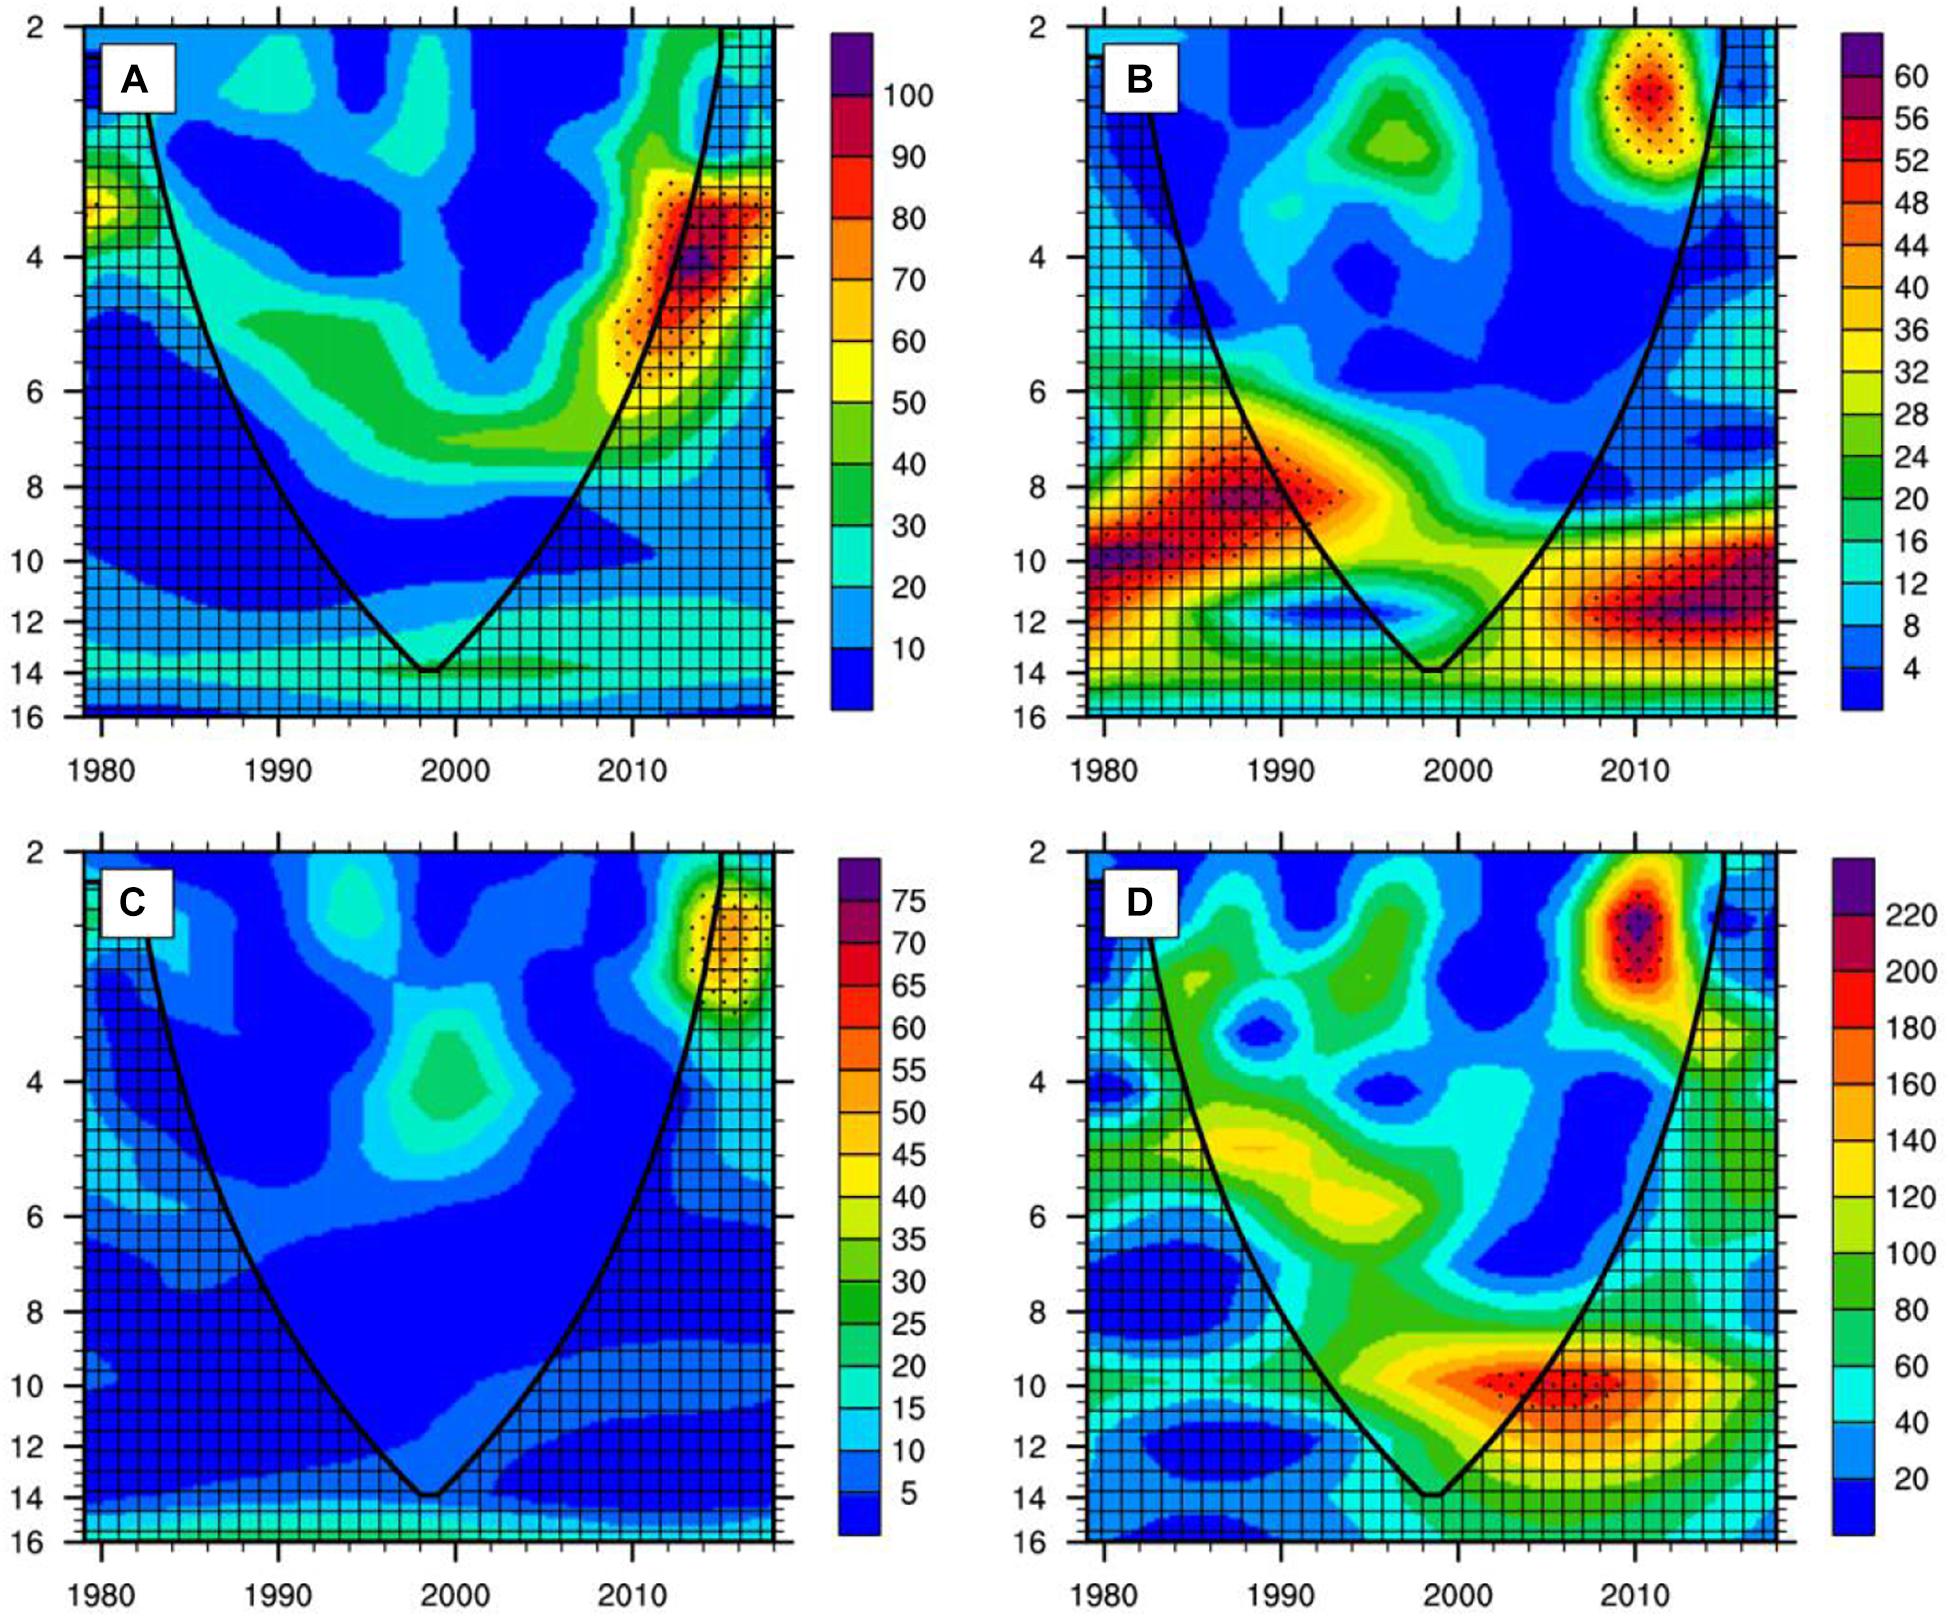
Figure 3. The wavelet analysis spectrogram of the four types of NCCV during 1979–2018: (A) EM type; (B) SLM type; (C) ESM type; (D) SSM type.
Spatial Distributions of Duration Days of NCCV
Figure 4 details the spatial distributions of the number of occurrence days of the northeastern NCCV during the period ranging from June of 1979 to June of 2018. The EM type NCCV was observed to appear in the majority of the areas in NEC, and the high value areas of the number of duration days were mainly distributed in the central and southern sections of the region. The number of duration days reached the highest value at the junction of Liaoning and Jilin. Fang et al. (2020) found that when the SLM type NCCV occurred, the consistent results were that the temperature levels in NEC were relatively low. The high value areas of the number of duration days of the SLM and ESM type NCCV were consistently located in the northwestern sections of the region. It was found that when compared with the SLM type NCCV, the ESM type NCCV had a smaller scope of activity. In addition, the latter type only appeared in a small scope in NEC. The high value areas of the number of duration days of the SSM type NCCV were generally more eastward and northward than those of the other types. Therefore, the distributions of the number of duration days of the NCCV with different paths further indicated the activity scopes of the four types of NCCV, as well as the differences and relationships among the activity intensities.
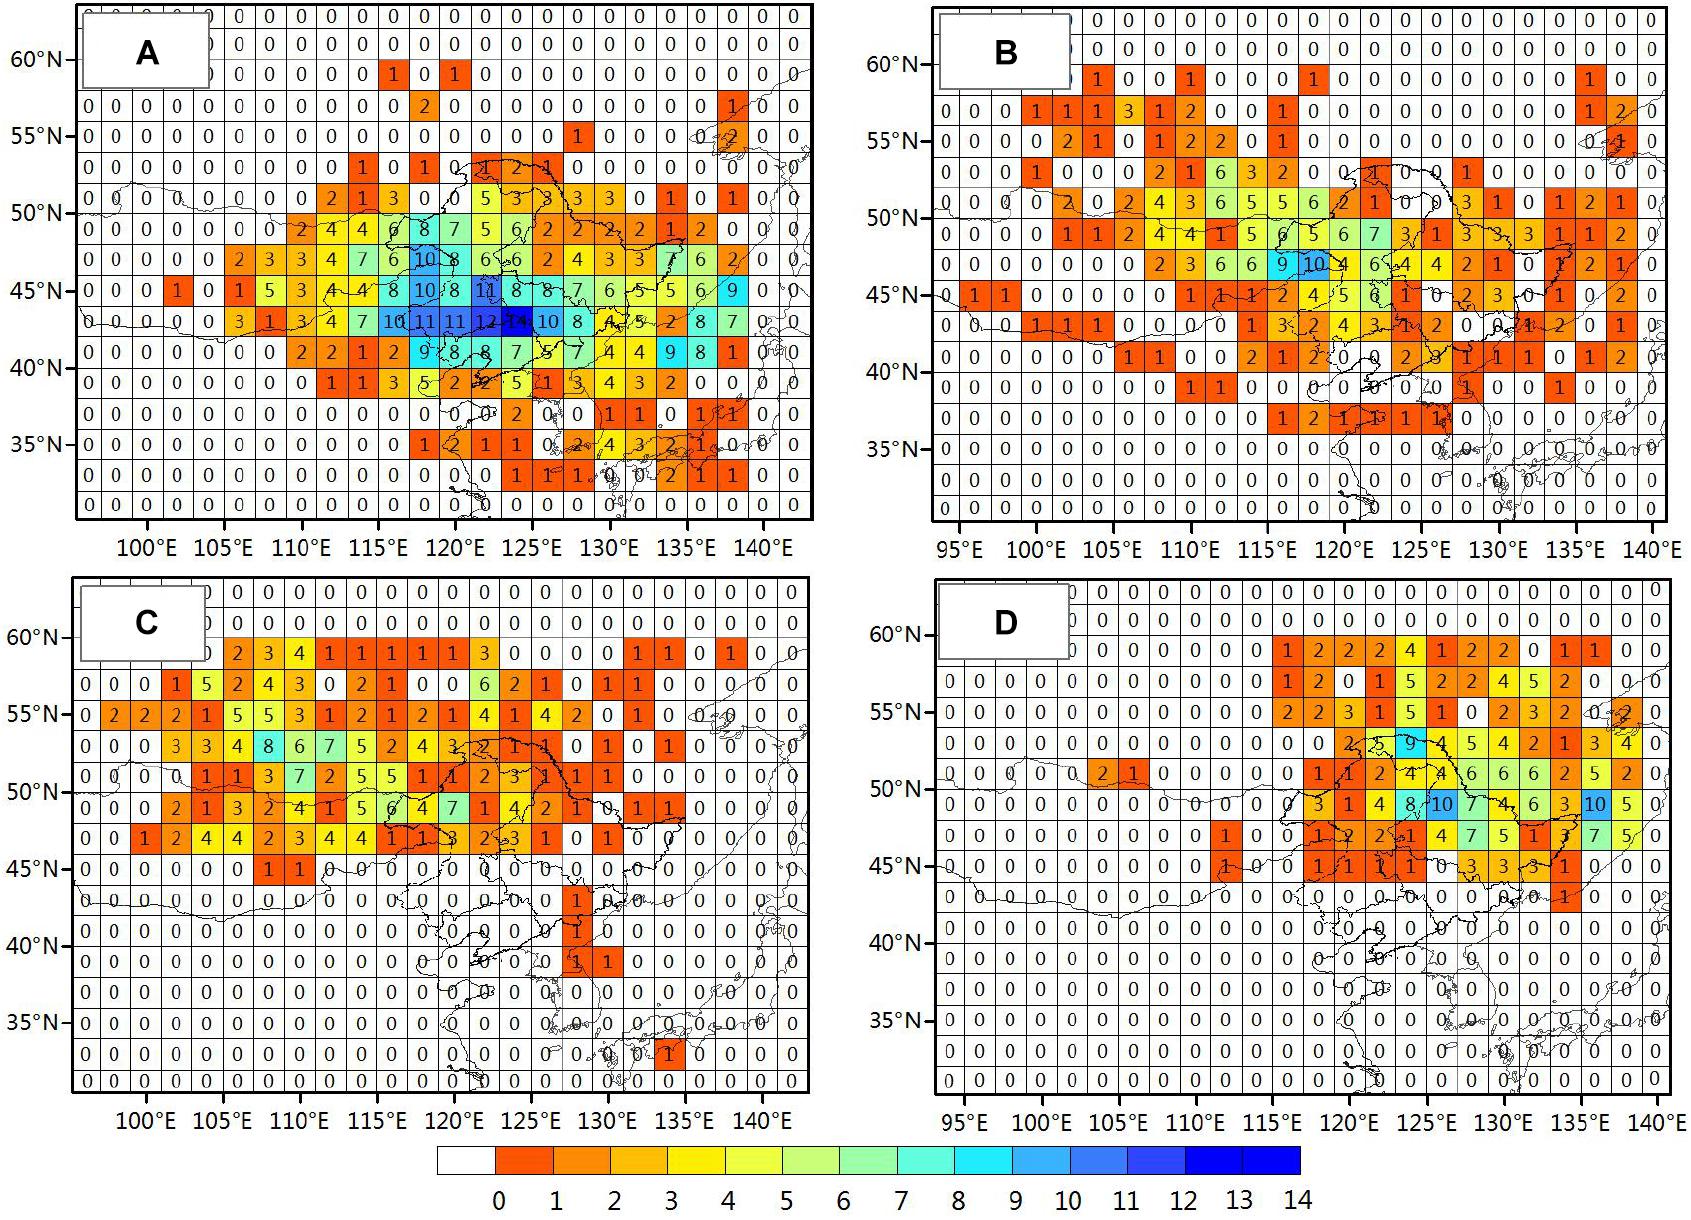
Figure 4. Spatial distributions of duration days of the NCCV during 1979–2018 (unit: day): (A) EM type; (B) SLM type; (C) ESM type; (D) SSM type.
Influencing Effects of the NCCV on the Precipitation in the Study Area
Distribution Patterns of the Precipitation
The influencing factors of terrestrial precipitation are numerous (Li, 2020). The main influencing factors of the precipitation during the early summer months (May to June) in NEC have been determined to be the effects of the NCCV (Shen et al., 2011). Gao and Gao (2018) analyzed the influencing effects of the NCCV on the summer precipitation levels in NEC in 2013 and pointed out that the NCCV played a major role in the abnormally high precipitation levels during that period of time. It has been found that from the perspective of interdecadal differences, some studies have theorized that the interdecadal variations of the NCCV could be considered as being closely related to the interdecadal variations of the summer precipitation patterns in NEC (Han et al., 2015).
In the present study, by synthesizing the precipitation data during the maintenance period (June of 1979 to June of 2018) of the various types of NCCV, it could be concluded that the overall precipitation pattern of the NCCV displayed the distribution characteristics of “more in the east and less in the west.” The characteristics of the precipitation during the process of the eastward moving NCCV were found to be similar to the distribution characteristics of the overall NCCV precipitation, in that they also displayed the distribution characteristics of “more in the east and less in the west.” However, the characteristics of the precipitation during the process of the SLM type NCCV revealed the meridional distribution characteristics of “more in the center and less in the east and west.” In addition, it was found that the characteristics of the precipitation during the eastward short-range NCCV type process showed the meridional distribution characteristics of “more in the north and less in the south.” These findings were observed to be consistent with the synthetic analysis results of Fang et al. (2020).
In the present research investigation, in order to further analyze the impacts of the NCCV with four types of paths on the precipitation patterns in NEC, the correlations between the four types of the NCCV indexes and the precipitation patterns during the maintenance period of various types of NCCV in early summer months from 1979 to 2018 were calculated. Due to the short length of data, the correlation results are mainly reflect interannual characteristics. The results are presented in Figure 5. It can be seen in the figure that there were significant differences in the influence ranges of the four types of the NCCV on the precipitation patterns in NEC. For example, when the EM type NCCV occurred, the range of the NCCV activity was mainly distributed in the central to southern areas of NEC. Overall, the central to the eastern sections of the NEC had more precipitation, as well as the rainy central areas located in the eastern portion of the region. It was observed that when the SLM type NCCV occurred, the high value areas of the number of the NCCV days were located in the northwestern section of NEC. Meanwhile, the central part of the region had more precipitation, and the rainy central area was located in the center of the southern section of the region. This was found to be consistent with the precipitation synthesis results of the four types of the NCCV. In addition, when the ESM type NCCV occurred, the activity scope of the NCCV was small in NEC, and there was a weak correlation observed between the NCCV indexes and the precipitation patterns of the region. However, when the SSM NCCV type occurred, the activity scope of the NCCV was found to be mainly in the northeastern section of the region, with more precipitation occurring in the south. From the above-mentioned data, it was concluded that the precipitation in NEC was obviously greater during the maintenance period of the four types of the NCCV, and there were consistent differences in the ranges of the precipitation. These distribution differences were found to have good corresponding relationships with the precipitation synthesis distributions and the activity ranges of the different types of NCCV.
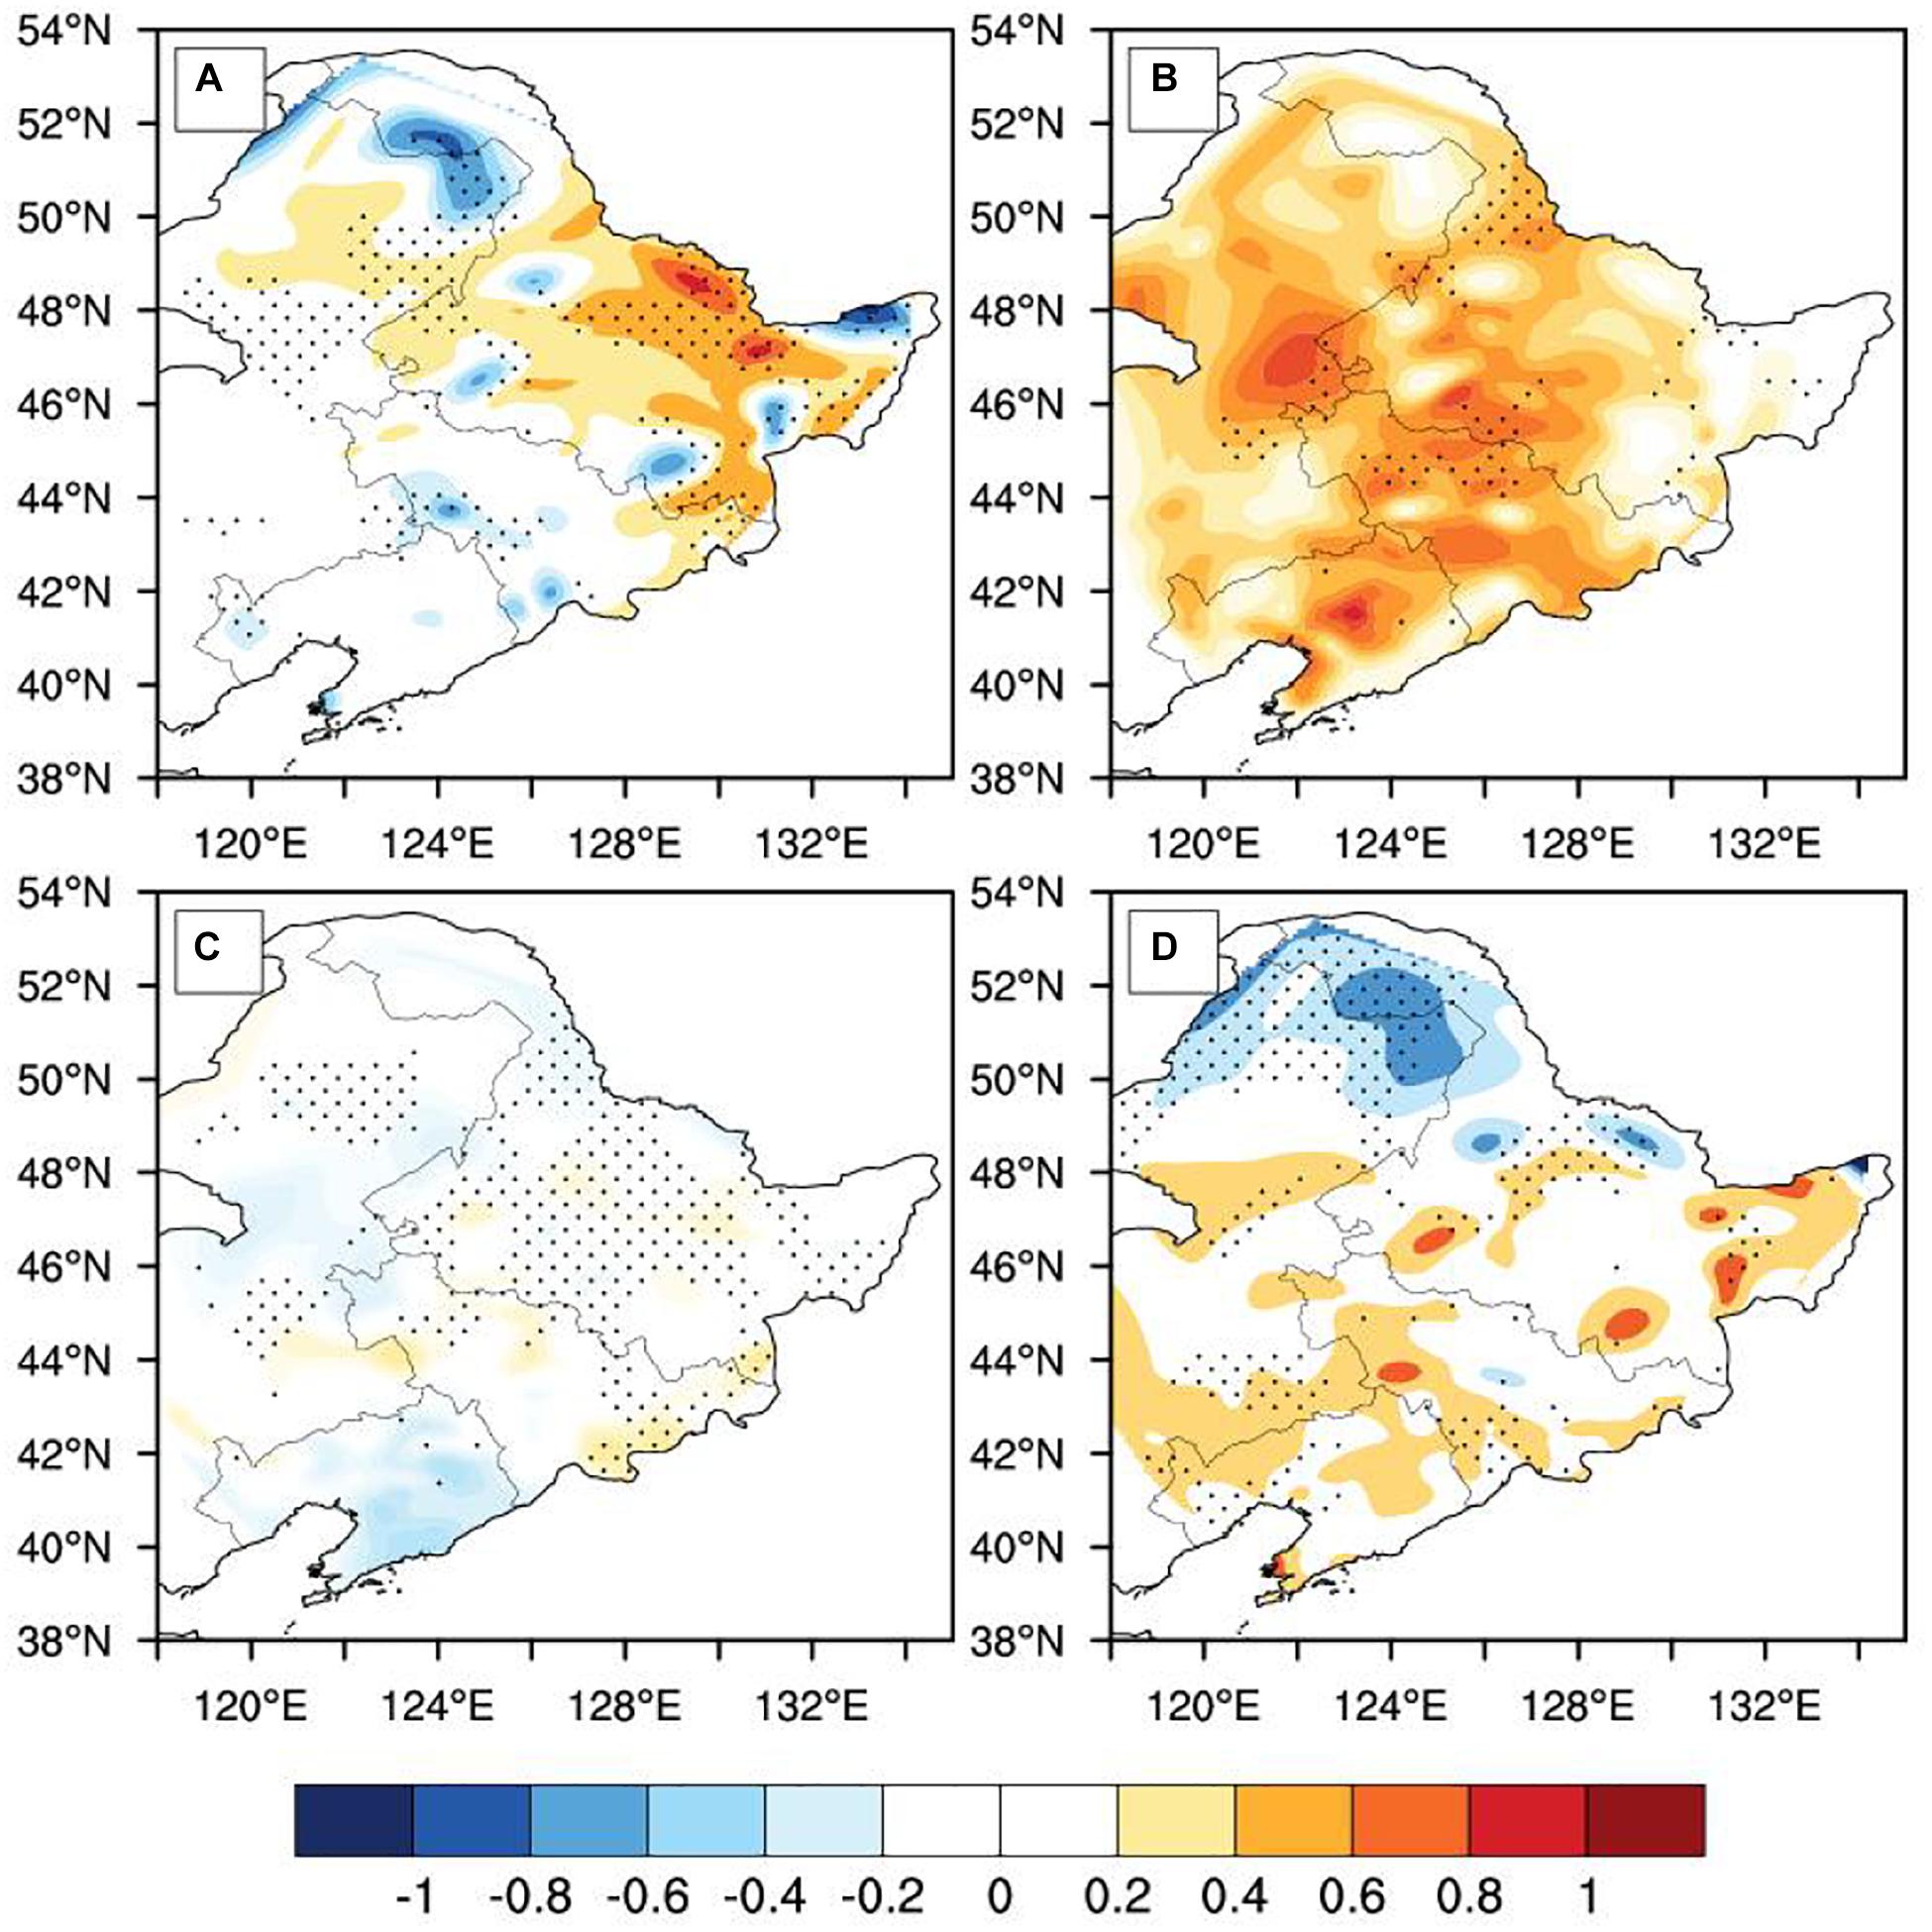
Figure 5. Distribution of the correlation coefficients between the NCCV index and precipitation anomalies in NEC during all the NCCV maintaining days ranging from 1978 to 2018: (A) EM type; (B) SLM type; (C) ESM type; (D) SSM type. In the figure, the dotted areas indicate the areas passed the 95% significance test.
Interannual Variation Characteristics of the Number of Precipitation Days
The days with daily precipitation of 0.1 mm and above were defined as the effective precipitation days. Figure 6 shows the interannual variation sequences of the number of days in which rainstorms (daily precipitation greater than or equal to 50 mm); heavy rain (daily precipitation of 25 to 50 mm); moderate rain (daily precipitation of 10 to 25 mm); and light rain (daily precipitation of 0.1 to 10 mm) occurred during the maintenance period of the NCCV types (1 to 4) in the early summer months of the period ranging from 1979 to 2018. In order to filter out the interdecadal characteristics of more than 8 years, a 9-year moving average was determined for the sequences of the number of precipitation days at various orders of magnitude during the maintenance period of the four NCCV types. The filtered data were observed to exhibit many typical interannual variability characteristics. For example, it could be seen that there were significant interannual variation characteristics in the sequences of the number of precipitation days at various orders of magnitude during the maintenance period of the four NCCV types, and the interannual variation trends of the number of precipitation days at various orders of magnitude were found to be generally consistent. Among those, the number of precipitation days at various orders of magnitude was found to be the highest during the maintenance period of the EM type NCCV. This was followed by the number of precipitation days during the maintenance period of the SLM type NCCV. In addition, it was determined that the number of precipitation days at the various orders of magnitude was the least during the maintenance period of the EM type NCCV. Also, there were observed to be good correspondence relationships between the number of precipitation days corresponding to the four NCCV types and their corresponding activity ranges. That is to say, the EM type NCCV had the widest activity range in NEC and had caused the highest number of precipitation days at the various orders of magnitude. Meanwhile, only a small portion of the ESM type NCCV had passed through the northern part of the NEC, which resulted in the least number of precipitation days at the various orders of magnitude in NEC.
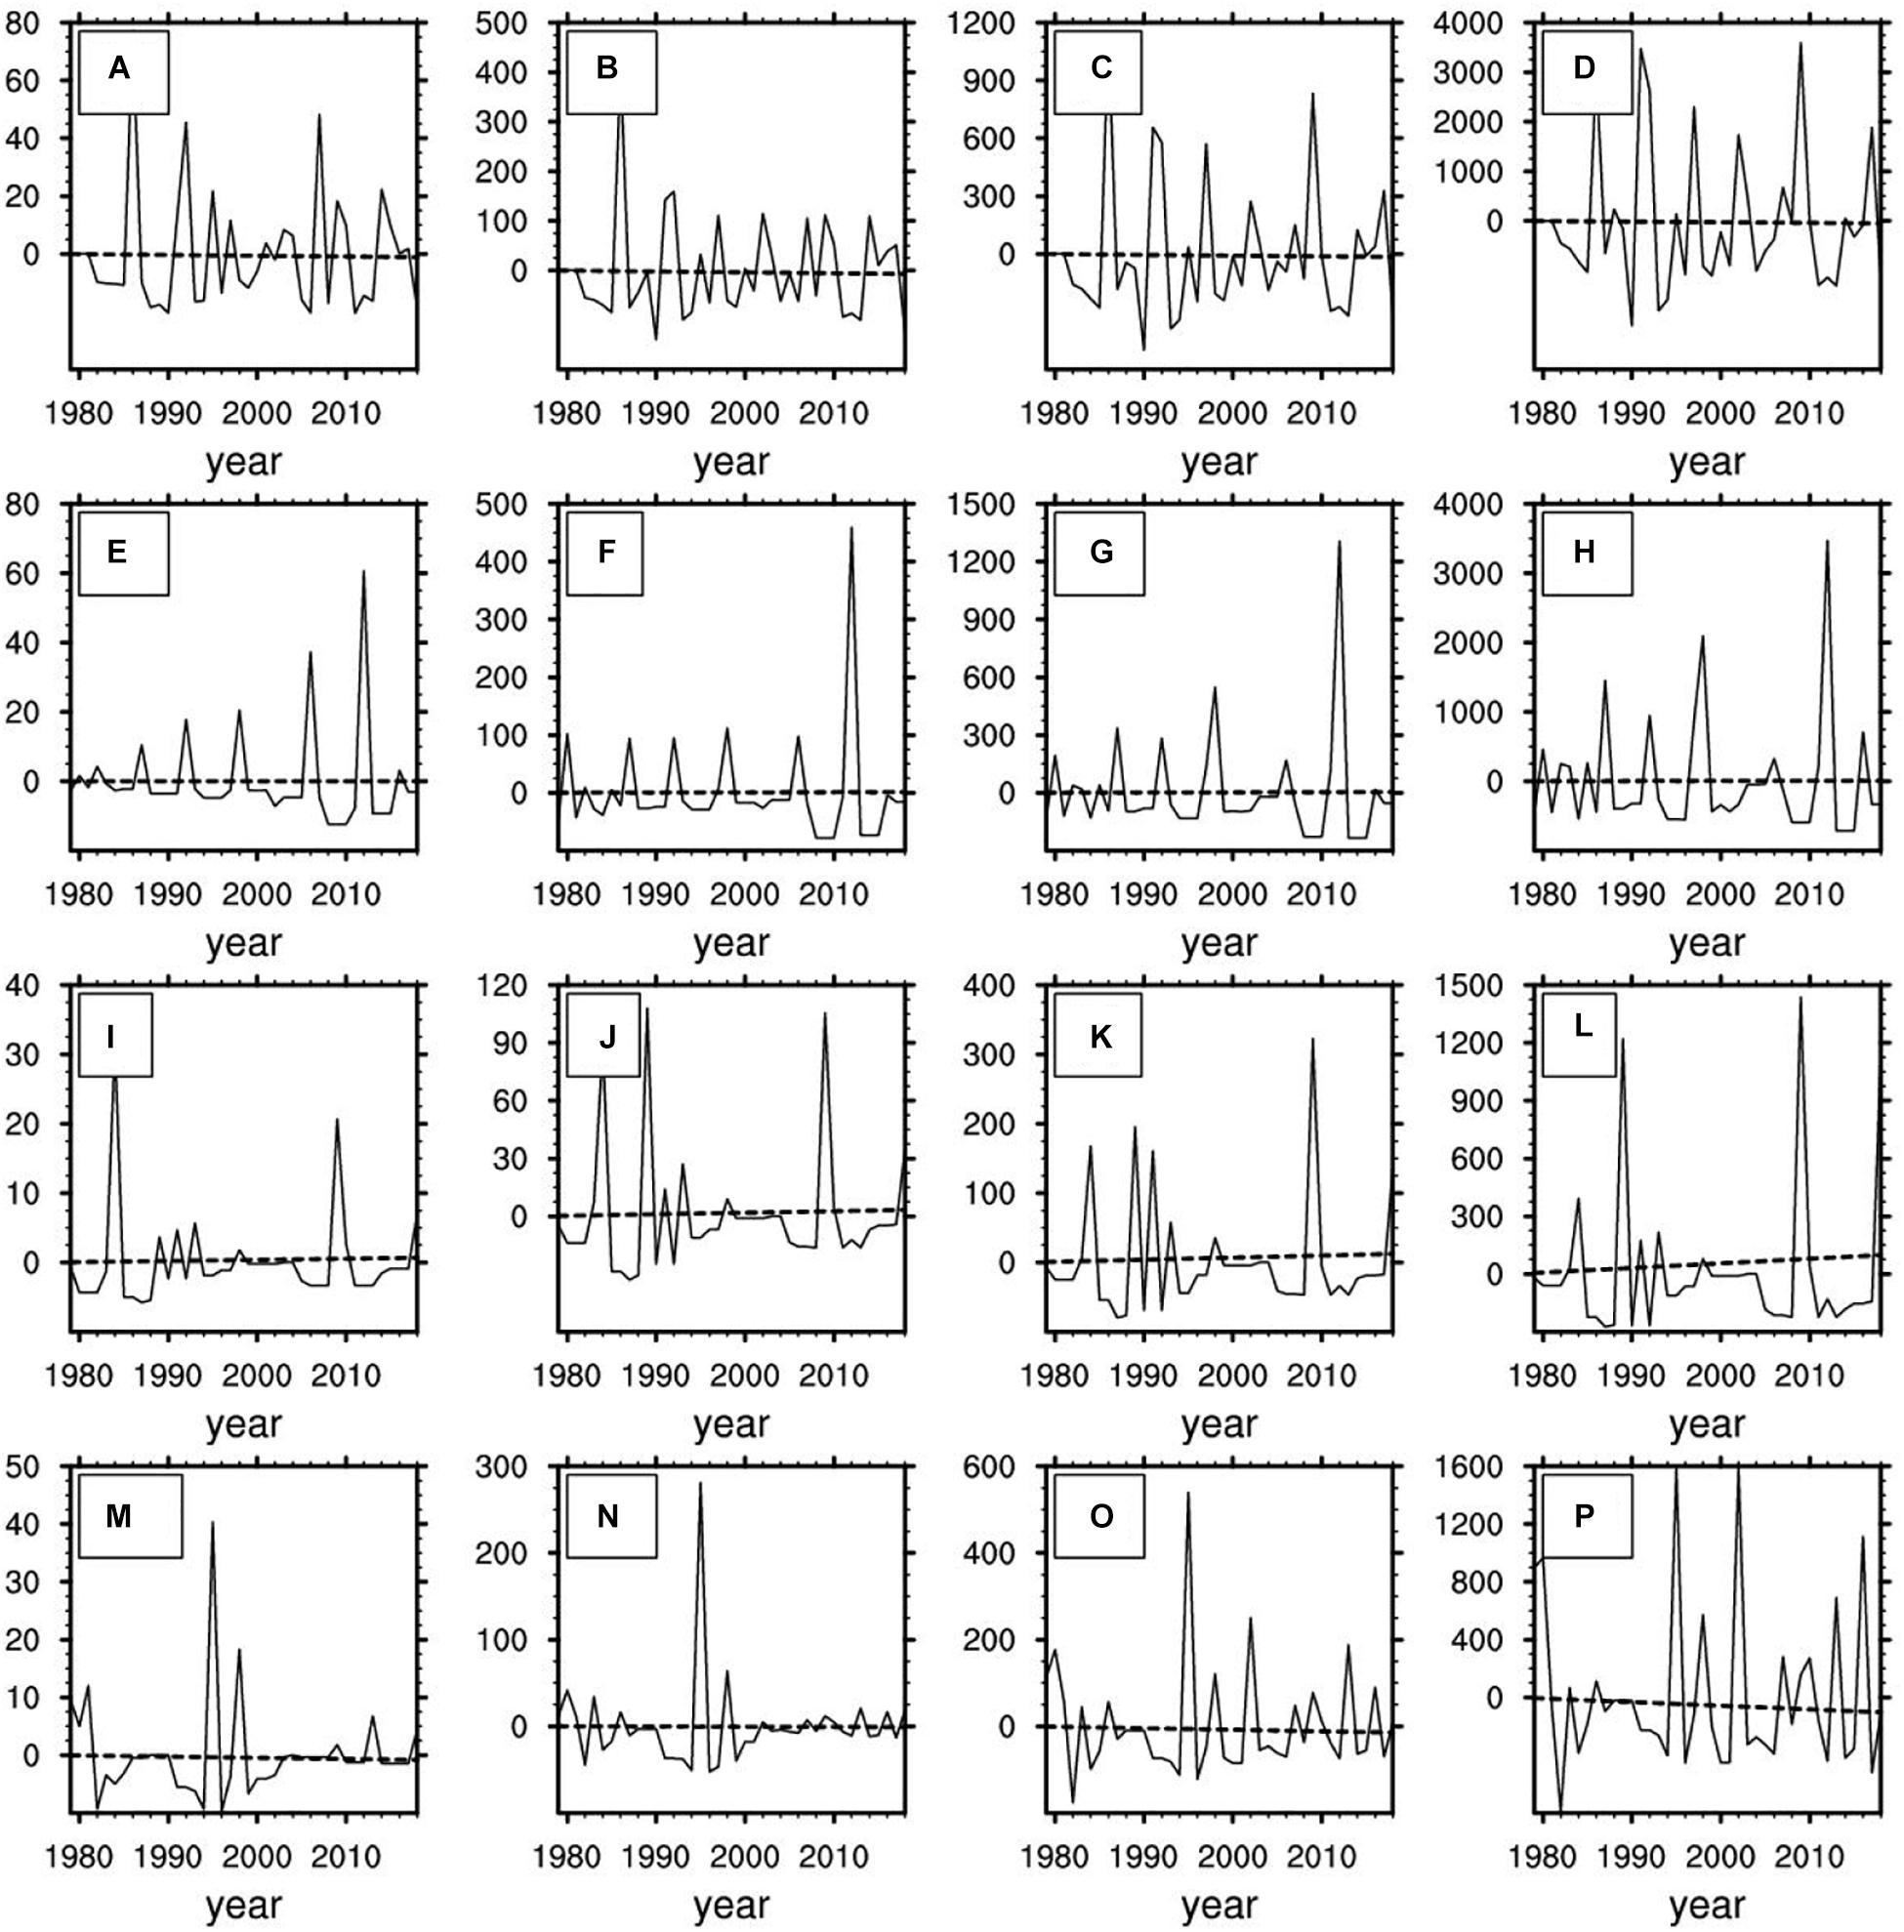
Figure 6. Interannual variation sequences of the precipitation anomalies at various magnitude levels for these four types of NCCV events ranging from 1979 to 2018 (unit: mm): (A,E,I,M) Rainstorms; (B,F,J,M) Heavy rain; (C,G,K,O) Moderate rain; (D,H,L,P) Light rain.
During the maintenance period of the EM and southeast long-distance movement NCCV types, the interannual growth trends of the number of precipitation days at the various orders of magnitude were not obvious. It was found that during the maintenance period of the ESM type NCCV, the precipitation at the various orders of magnitude had displayed a certain growth trend. In particular, a growth trend of light rain days was the most obvious, while the growth trend of heavy rain days had been the weakest. During the maintenance period of the SSM type NCCV, there was a certain decreasing trend observed in the precipitation at various orders of magnitude, with the exception of the occurrences of heavy rain events. A decreasing trend in the light rain days was the most obvious, and the decreasing trend of rainstorm days was observed to be the weakest.
Spatial Distributions of the Precipitation Occurrence Days
The distributions of the number of precipitation days at various orders of magnitude generated by the NCCV types with different paths were also found to differ. Figures 7–9 show the distributions of the number of precipitation days at various orders of magnitude during the maintenance period of the four NCCV types for the period ranging from June of 1979 to June of 2018. It can be seen in the figures that the main differences in the precipitation of four NCCV types were reflected in the number of light rain days and moderate rain days. It was determined that during the maintenance period of the EM type NCCV, the number of light rain and moderate rain days was higher in the southeast section of the NEC. In addition, during the maintenance period of the SLM type NCCV, the number of days in which light rain and moderate rain occurred was consistent in the majority of the areas of NEC, and especially in northwestern China. During the maintenance period of the ESM type NCCV, the days in which light rain and moderate rain had occurred were greater in the northwestern and eastern sections of the NEC. During the maintenance period of the SSM type NCCV, the number of days of light rain and moderate rain were greater in the northeastern area of the region. These findings were found to correspond well with the activity paths of the four types of the NCCV.
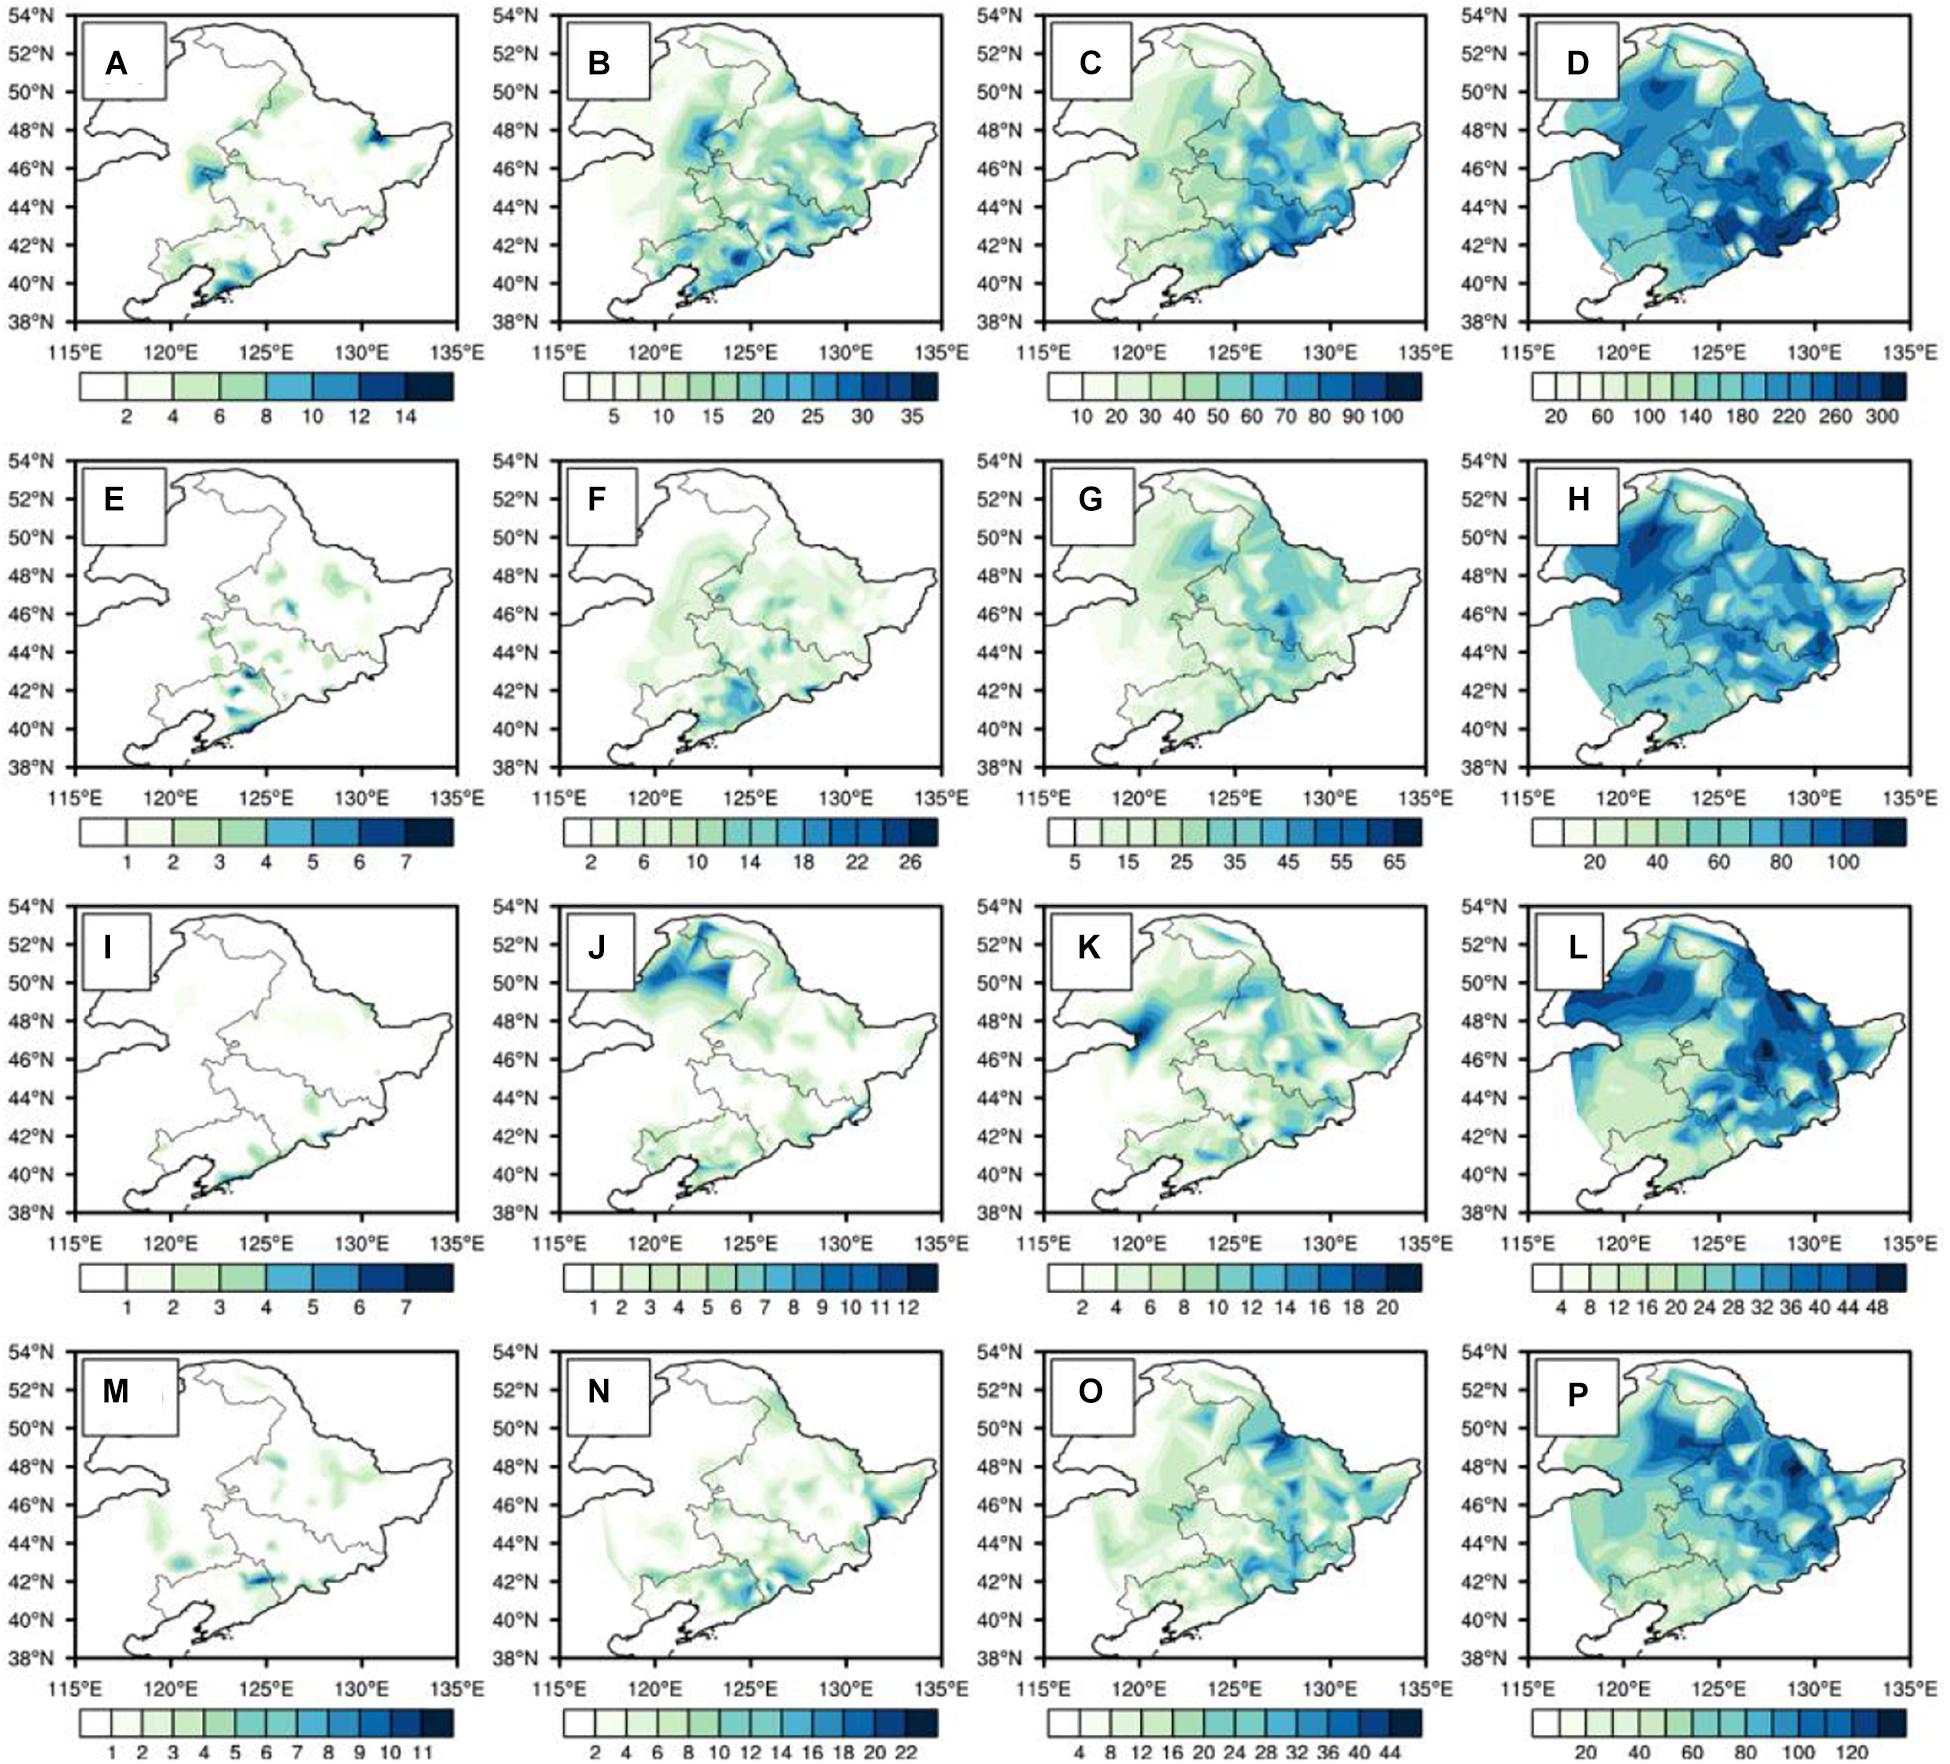
Figure 7. Spatial distribution of the raining days corresponding to various precipitation levels during the NCCV maintaining days ranging from 1979 to 2018 (unit: day): (A,E,I,M) Rainstorms; (B,F,J,M) Heavy rain; (C,G,K,O) Moderate rain; (D,H,L,P) Light rain.
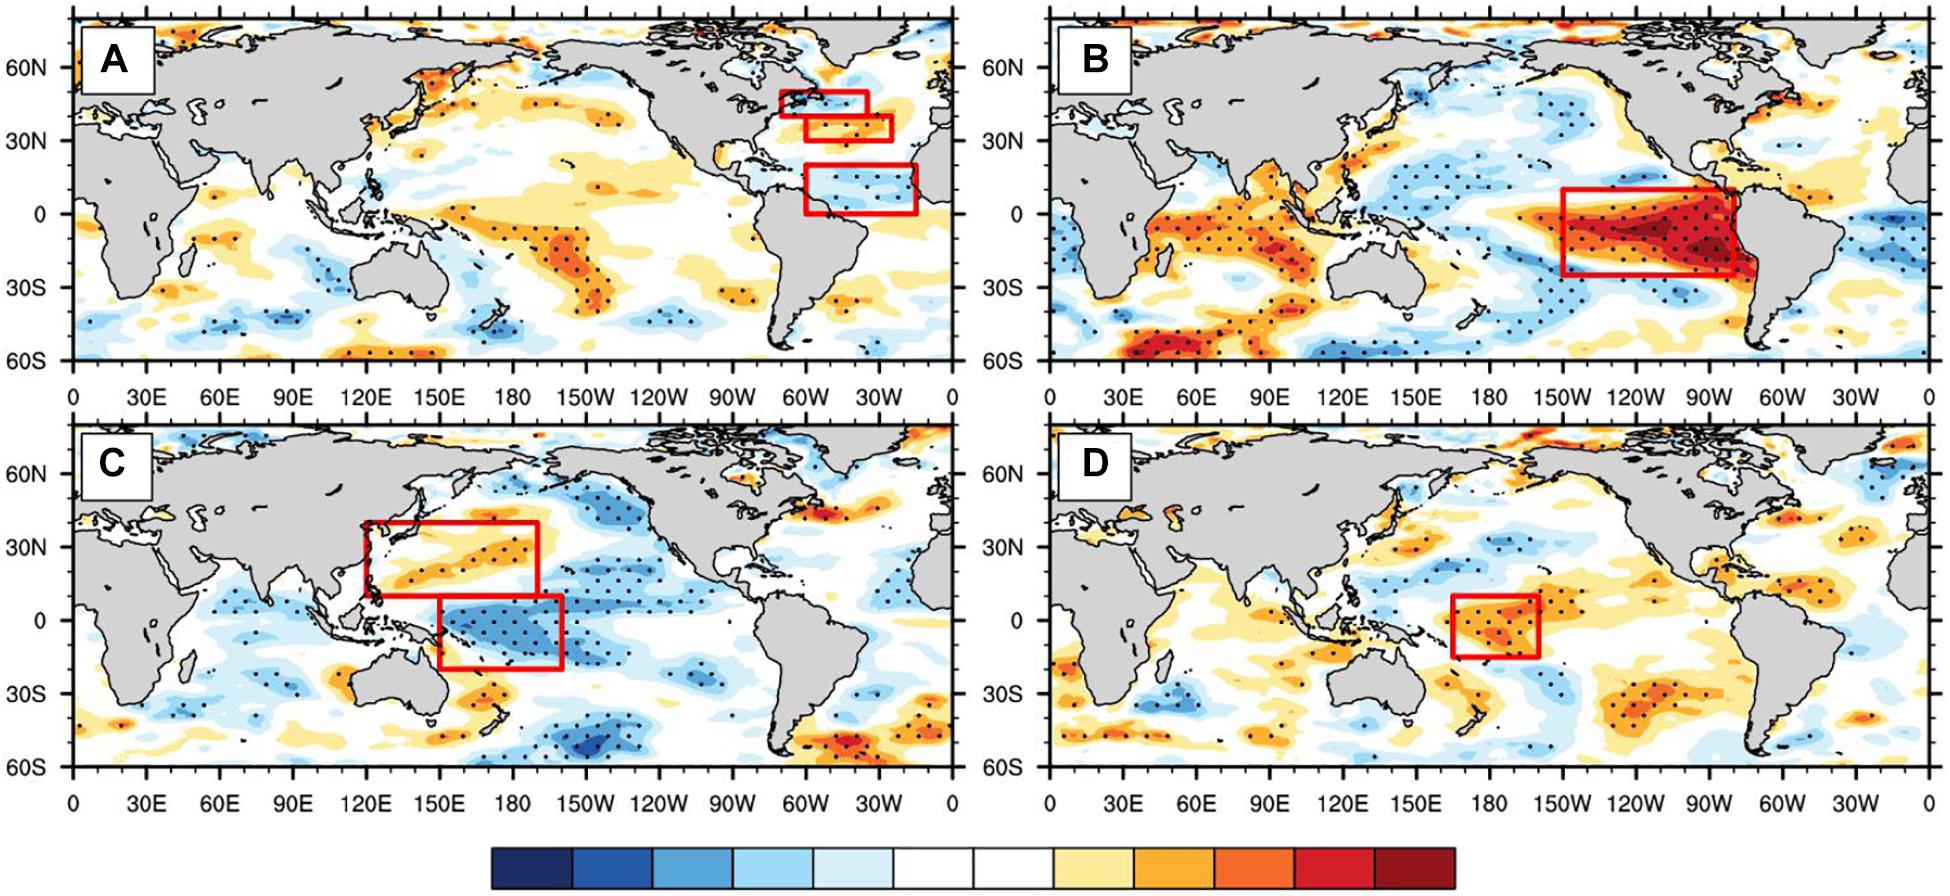
Figure 8. Spatial distribution of the correlation coefficients between the summer NCCV indexes and the proceeding spring SST anomalies during 1979–2018. (A) EM type; (B) SLM type; (C) ESM type; (D) SSM type. Dotted areas indicate the 99% confidence level.
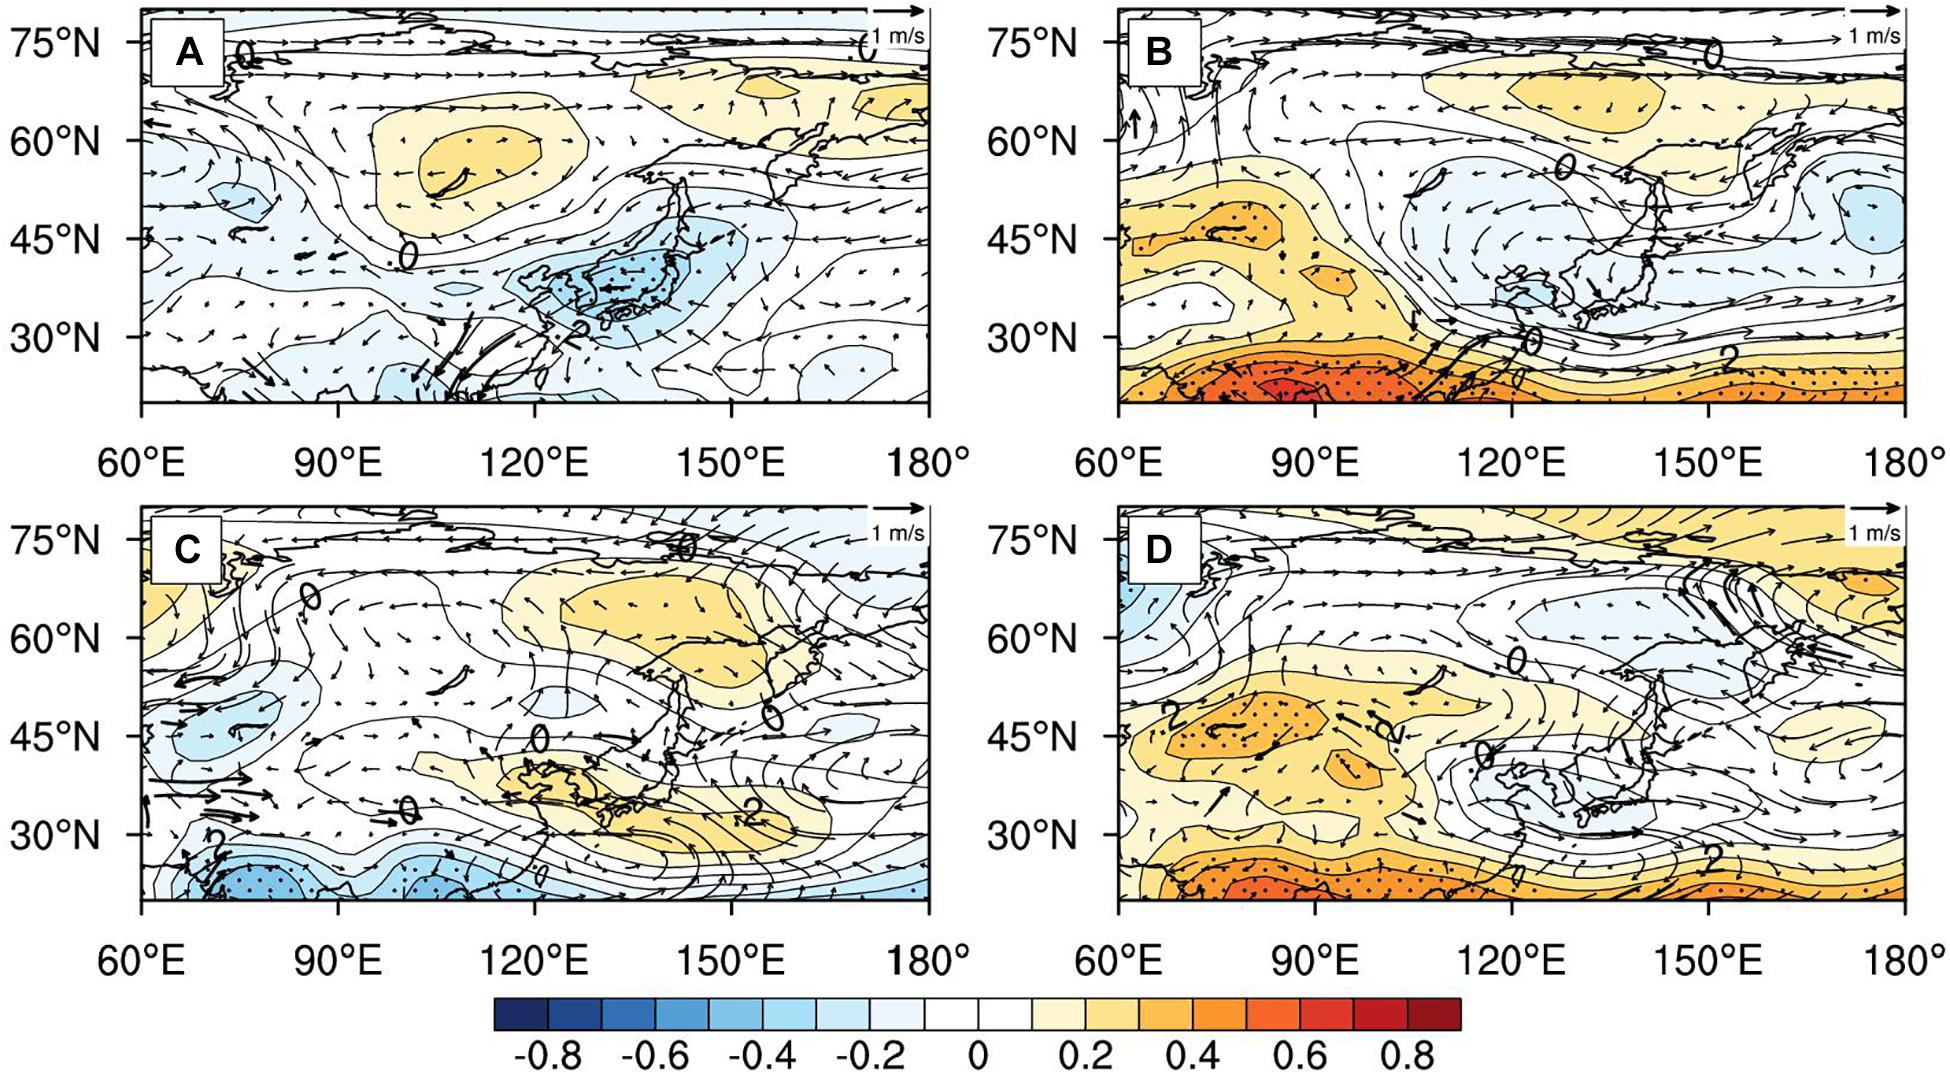
Figure 9. Spatial distribution of regression coefficients of early winter 500 hPa height (contour) and 850 hPa wind (vectors) anomalies against the key area SST indices corresponding to the four types of the NCCV during 1979–2018. (A) EM type; (B) SLM type; (C) ESM type (D) SSM type. Dotted areas and bold arrows indicate the 99% significance level.
Relationships Between the Four NCCV Types and the SST
Fang et al. (2021) completed a great deal of relevant research regarding the analysis of the circulation characteristics corresponding to the four types of the NCCV. It was found that there were obvious differences in the atmospheric circulation configurations of the NCCV with four types of paths when the origins of the generations were considered. For example, it was found that they were consistent with the activity paths of the NCCV. The circulation configurations of the total days, as well as the peak value days, of the NCCV processes with four types of paths were also observed to match well with the NCCV activity paths. This study focused on the analysis of the correlation relationships between the four types of NCCV processes and the previous SSTs.
Figure 8 shows the distributions of correlation coefficients between the NCCV indexes from 1979 to the early summer of 2018, along with the SST anomalies during the early period (March to May). It can be seen in the figure that there were major differences in the distribution patterns of SST anomalies during the early period which corresponded to the four types of NCCV. For example, when there were abnormally more EM and SSM type NCCV during the early summer months, the SSTs in the Equatorial Central Pacific Ocean had also been higher during the early spring months, which were reflected by the CP type ENSO SST distribution characteristics. However, when there were abnormally more SLM type NCCV during the early summer months, it was observed that the SSTs in the Equatorial Pacific Ocean during the early spring months had displayed the EP type ENSO sea surface distribution characteristics of “higher in the east and lower in the west,” and the positive anomaly center was located in the Equatorial Eastern Pacific Ocean.
There were also significant differences observed in the SSTs over the Atlantic Ocean region. For example, when there were abnormally more EM, ESM, and SSM type NCCV observed, the North Atlantic Ocean had presented a negative-positive-negative distribution characteristics of a “tri-pole” during the early spring months. Meanwhile, the SST anomalies in the North Atlantic Ocean during the early spring months were not significant when there was more SSM type NCCV.
This study found that the SSTs of the Indian Ocean showed the distribution characteristics of “positive in the west and negative in the east” of the Indian Ocean positive dipole when the EM type NCCV occurred. However, when the SLM and SSM type NCCV occurred, it was found that the Indian Ocean had large-scaled positive SST anomalies. In particular, the anomalies were more obvious when the SLM type NCCV occurred. Also, when the ESM type NCCV occurred, the Indian Ocean was found to have large-scaled negative SST anomalies.
Fang et al. (2018) carried out diagnostic analysis and numerical simulation processes in order to determine the causes of the precipitation anomalies in NEC during early summer months. It was pointed out that the anomalies in the SST tri-pole of the North Atlantic Ocean, along with the SSTs of the Kuroshio area, had resulted in anomalies of the high pressure circulation system due to the blocking of the upstream and downstream NCCV. It was theorized that this blockage affected the NCCV precipitation during the early summer months in NEC. It was found that the sensitivity tests of numerical models could be used to verify the effects of the SSTs during the earlier periods on the atmospheric circulation processes of the early summer months. Buhe and Xie (2013) summarized the deep dynamic causes for the formation and maintenance of the various types of NCCV and found that the Western Pacific (WP) teleconnection patterns were the downstream background circulation patterns of the NCCV activities, and the negative phases were conducive to the generation and maintenance of the NCCV.
In the present study, in order to further clarify the differences in the influencing effects of different types of SST areas on four types of the NCCV, the characteristic indexes of the early SST anomalies corresponding to the four types of the NCCV were first calculated. These included the Pacific CP type ENSO SST index (the mean SST values of the region [165°E−160°W; 15°S−10°N]); the Pacific EP type ENSO SST index (the mean SST values of the region [80−150°W; 20°S−10°N]); Western Pacific SST positive anomaly index (the mean SST values of the region [150°W−160°E; 20°S−10°N]); Atlantic tri-pole index (the differences in the mean SST values between the region [25°−60°W; 30°−40°N] and the region [15°−60°W; 0°−20°N] and [35°−70°W; 40°−50°N]); and the Indian Ocean positive dipole index (the differences in the mean SST values between the region [40°−80°E; 0°−30°S] and the region [80°−120°E; 0°−30°S]). The results of the regression analysis of the aforementioned indices with the circulation fields of June which corresponded to the four types of the NCCV revealed that the circulation fields of the SST regression in the following four key areas corresponded well to the NCCV circulation situations, which had certain physical significance. Therefore, this study selected the SST of the following four key areas. The tri-pole type SST of the Atlantic Ocean was taken as the characteristic SST region corresponding to the EM type NCCV. In other words, the differences in the mean SST values between the region [25°−60°W; 30°−40°N] and the region [15°−60°W; 0°−20°N] and [35°−70°W; 40°−50°N] (red box area in Figure 8A) from March to May were defined as the SST index N1. Similarly, the mean SST values of the eastern Equatorial Pacific Ocean region [80°−150°W; 20°S−10°N] (red box area in Figure 8B) from March to May were selected and defined as the characteristic SST index N2 of the SLM type NCCV. Subsequently, the differences in the mean SST values between the Equatorial Northwestern Pacific Ocean region [120°E−170°W; 10°−40°N] and the Equatorial Western Pacific Ocean region [150°E−160°W; 20°S−10°N] (red box region in Figure 8C; red box area in Figure 8B) from March to May were defined as the characteristic SST index N3 of the ESM type NCCV. Finally, the mean SST values of the Equatorial Pacific Ocean region [165°E−160°W; 15°S−10°N] (red box area in Figure 8D) from March to May were defined as the characteristic SST index N4 of the SLM type NCCV.
The atmospheric circulation configurations of the four types of NCCV are quite different (Fang et al., 2021). The four types NCCV corresponded to the following circulation configurations: The interaction type between the Okhotsk Sea blockage and the eastern low vortex of the Mongolian Plateau (EM); the interaction type between the Yenisei River blockage and the low vortex of the upper reaches of the Lena River (SLM); the interaction type between the Obi River blockage and Okhotsk Sea-Japan Sea blockage and the low vortex of Baikal Lake (ESM); and the interaction type between the Central Siberia-East Siberia blockage and southern low vortex in East Siberia (SSM). Then, the circulation fields of the four types of NCCV in the month of June from 1979 to 2018 were regressed to the four types of SST indexes, as detailed in Figure 9. It can be seen in the figure that the EM type NCCV corresponded to the abnormally high SSTs in the North Pacific Ocean during the early summer months, resulting in an anticyclonic circulation pattern near Lake Baikal in the early summer and a cyclonic circulation pattern in NEC and its southwestern portion. The generated wind fields were conducive to the NCCV moving from its source to the southwest. These findings were in good agreement with the moving path of the EM type NCCV. During the early stages of the SLM type NCCV, the SSTs in the Equatorial Eastern Pacific Ocean region were abnormally high, which caused the easterly airflow of the source location (upstream of the Lena River) in the northern section of the cyclonic circulation. Therefore, the conditions were not conducive to the movement of the NCCV to the southeast. Furthermore, during the early stages of the ESM type NCCV, it was observed that the SSTs in the Equatorial Western Pacific Ocean region were abnormally low, which caused the NCCV source location (near Lake Baikal) to be controlled by the cyclonic circulation. As a result, the southwestern airflow into the southeast of the circulation assisted the NCCV to move to the northeast, which was consistent with the moving path of the ESM type NCCV. In addition, during the early stages of the SSM type NCCV, the abnormally high SSTs in the Equatorial Western Pacific Ocean region caused the Mongolia area to be controlled by the anticyclone circulation processes. Therefore, since the source location of the NCCV (south of East Siberia) had been affected by the northwest airflow, the conditions were conducive to the NCCV moving to the southeast. These findings were consistent with the moving paths of the SSM type NCCV.
Conclusion and Discussion
In this study, we try to classify the NCCV into different types according to their active path by using the KMC method (Fang et al., 2020). The climatic characteristics of these types of NCCV and their impacts on the precipitation over NEC were analyzed. It is also revealed the distribution of the sea-surface temperature (SST) anomalies had close relationship with the formation of these four types of the NCCV. Main conclusion are listed as follows:
(1) The KMC method can effectively divide the NCCV events into four different types according to the identified active paths and durations: (i) Eastward movement type (EM); (ii) Southeastward long-distance movement type (SLM); (iii) Eastward short-distance movement type (ESM); and (iv) Southward short-distance movement type (SSM). The characteristics of the four types of the NCCV, along with their impacts on the precipitation during early summer in NEC, were studied. The maintaining days of these four types of the NCCV were found to have obvious interannual and interdecadal variation features. For example, the maintaining days of the EM and ESM types were mainly characterized by interannual variability, while the SLM and SSM types have the obvious 10–13a interdecadal variation along with interannual variability.
(2) Climatic features of four types of the NCCV events exist significant differences and their impacts on the precipitation anomalies in NEC also present obvious differences. The activity range of the EM type covered the entire NEC. This type was found to have the highest occurrence frequency and longest maintenance days with the high value area mainly distributed in the central-south area of NEC. The activity range of the SLM type was concentrated in the eastern Inner Mongolia and northeastern Mongolia. This type had the lowest occurrence frequency. The ESM type was found to only have a small activity range concentrated in the northwestern region of NEC with the high value area of maintenance days located near Arxan??? The activity range of the SSM type was found to be limited to the northeastern region of Heilongjiang Province. This type had the least number of maintenance days with large value distributed in the northern Heilongjiang.
(3) Four types of NCCV events had different impacts on the precipitation patterns in NEC. For example, when the EM type occurred, the rainy center mainly located in the eastern part of NEC. The SLM type bring more precipitation in the central part of the NEC. When the ESM type NCCV occurred, it was observed that there was a weak correlation between the NCCV index and the precipitation in NEC. In addition, when the SSM type NCCV occurred, there was generally more precipitation in the northern area of the region. Therefore, this study revealed that the EM and SLM (especially the former type) should be mainly considered when analyzing the impacts of the NCCV events on precipitation patterns in NEC.
(4) Four types of NCCV events were found to have different impacts on precipitation days at various magnitude levels in NEC. The interannual growth trends of precipitation days were not found to be obvious during the maintenance duration of the EM and SLM types. During the maintenance period of the ESM type, the precipitation days displayed a certain growth trend at various magnitude levels, while the SSM type displayed a certain weakening trend. The main differences of precipitation feature among these four types of NCCV events mainly existed in the light rain and moderate rain levels.
(5) The distributions of the SST anomalies which had significant correlation with the four NCCV types were also observed to be quite different from each other. It was found close relationships existed between the circulation fields and the moving paths of the four NCCV types under different SST backgrounds. For example, the Atlantic Ocean tripole distribution of the SSTs corresponded well with the EM type NCCV. The rises of the SSTs in the Equatorial Eastern Pacific Ocean correspond well with the SLM type. Besides, the abnormally low SSTs in the Equatorial Western Pacific Ocean and high SSTs in the Northwestern Pacific Ocean had significant correlation with the ESM type NCCV. Similarly, the abnormally low SSTs in the Equatorial Western Pacific Ocean present the close relationship with the SSM type of NCCV events.
Based on previous similar studies, the Atlantic SST anomalies can induce atmospheric diabatic heating, which stimulates quasi-barotropic mid- to high-latitude Rossby wave trains to the downstream along a parallel circle through the sea-air interactions, which caused the formation of circulation configuration as high resistance on the northwest and southeast sides of Lake Baikal high with NCCV coordination circulation. It is beneficial to the occurrence and development of the NCCV. For The cold vortexes affected by the Pacific SST, by blocking the upstream circulation, atmospheric circulation anomalies such as the EU teleconnection are formed, which causes the anomaly of NCCV in early summer.
This paper only analyze the influence of SST, but in fact, both sea ice and land may affect atmospheric circulation and thus affect the NCCV.
Data Availability Statement
The original contributions presented in the study are included in the article/supplementary material, further inquiries can be directed to the corresponding author/s.
Author Contributions
Y-HF contributed to the data collection and classification of NCCV. M-MZ, C-YZ, Z-QG, X-YZ, and W-QZ contributed to the data processing and analysis. All authors contributed to the article and approved the submitted version.
Funding
This work was jointly supported by the National Key Research and Development Program of China (2018YFC1507702 and 2018YFC1505601); National Natural Science Foundation of China (Grant Nos. 42005037 and 42075057); Special Project of Innovative Development, CMA (CXFZ2021J022 and CXFZ2021Z034); Liaoning Provincial Natural Science Foundation Project (Ph.D. Start-up Research Fund 2019-BS-214); and Research Project of the Institute of Atmospheric Environment, CMA (2020SYIAE08).
Conflict of Interest
The authors declare that the research was conducted in the absence of any commercial or financial relationships that could be construed as a potential conflict of interest.
References
Buhe, C., and Xie, Z. W. (2013). Northeastern China cold vortex circulation and its dynamical features. Adv. Meteorol. Sci. Technol. 3, 34–39.
Ding, T., Yuan, Y., Zhang, J., and Gao, H. (2019). 2018 the hottest summer in China and possible causes. J. Meteorol. Res. 33, 577–592. doi: 10.1007/s13351-019-8178-y
Fan, K., and Wang, H. J. (2010). Seasonal prediction of summer temperature over Northeast China using a year-to-year incremental approach. Acta Meteor. Sin. 24, 269–275.
Fang, Y. H., Chen, H. S., Lin, Y., Zhao, C. Y., Lin, Y. T., and Zhou, F. (2021). Classification of the Northeast China cold vortex activity paths in early summer based on K-means clustering and their climate impact. Adv. Atmos. Sci. 38, 400–412. doi: 10.1007/s00376-020-0118-3
Fang, Y. H., Chen, K. Q., Chen, H., Xu, S.-Q., Geng, X., and Li, T.-Y. (2018). The remote responses of early summer cold vortex precipitation in northeastern china compared with the previous sea surface temperatures. Atmos. Res. 214, 399–409. doi: 10.1016/j.atmosres.2018.08.007
Fang, Y. H., Lin, Y. T., Ren, H. L., Zhao, C. Y., Zhou, F., Li, Q., et al. (2020). Possible relationships between the interannual anomalies of the south-north positions of the northeastern china cold vortexes and the sea surface temperatures (SSTs) during the early summer periods. Front. Earth Sci. 8:557014.
Feng, G. L., Hongxing, C., Xinquan, G., Wenjie, D., and Jifan, C. (2001). Prediction of precipitation during summer monsoon with self-memorial model. Adv. Atmos. Sci. 18, 701–709. doi: 10.1007/bf03403495
Gao, J., and Gao, H. (2018). Influence of the Northeast cold vortex on flooding in Northeast China in summer 2013. J. Meteor. Res. 32, 172–180. doi: 10.1007/s13351-018-7056-3
Gong, Z. Q., Zhao, J. H., Feng, G. L., and Fan, C. J. (2014). Dynamic-statistics combined forecast scheme based on the abrupt decadal change component of summer precipitation in East Asia. Sci. China Earth Sci. 58, 404–419. doi: 10.1007/s11430-014-4967-4
Han, T., Chen, H., and Wang, H. (2015). Recent changes in summer precipitation in Northeast China and the background circulation. Int. J. Climatol. 35, 4210–4219. doi: 10.1002/joc.4280
Hu, K. X., Lu, R. Y., and Wang, D. H. (2011). Cold Vortex over NEC and its climate effect. Chin. J. Atmos. Sci. 35, 179–191.
Lau, K. M., and Weng, H. Y. (1995). Climate signal detection using wavelet transform. How to make a time series sing. Bull. Amer. Meteor. Soc. 76, 2391–2402. doi: 10.1175/1520-0477(1995)076<2391:csduwt>2.0.co;2
Li, C., Han, G. R., and Sun, Y. (2015). Anomalous features of Northeast cold vortex in late 50a and its correlation with rainfall in Huaihe river valley. J. Meteorol. Sci. 35, 216–222.
Li, Q. X. (2020). Statistical modeling experiment of land precipitation variations since the start of the 20th century with external forcing factors. Chin. Sci. Bull. 65, 2266–2278. doi: 10.1360/tb-2020-0305
Lian, Y., Buhe, C., Xie, Z. W., Shen, B. Z., and Li, S. F. (2010). The anomalous cold vortex activity in Northeast China during the early summer and the low-frequency variability of the Northern hemispheric atmosphere circulation. Chin. J. Atmos. Sci. 34, 429–439.
Lian, Y., Shen, B., Li, S., Liu, G., and Yang, X. (2016). Mechanisms for the formation of Northeast China cold vortex and its activities and impacts. An overview. J. Meteor. Res. 30, 881–896. doi: 10.1007/s13351-016-6003-4
Liang, H., Wang, Y., and Guo, Z. Q. (2009). :The teleconnection relationship between the northeast cold vortex and the subtropical high, the Okhotsk high in summer. J. Meteorol. Sci. 29, 793–796.
Liu, G., Feng, G. L., Qin, Y. L., Zeng, Y. X., Yang, X., and Yao, S. (2017). “Cumulative Effect” of Cold Vortex precipitation in Northeast China in early summer. Chin. J. Atmos. Sci. 41, 202–212.
Liu, G., Lian, Y., Yan, P. C., Zeng, Y. X., Yang, X., and Cao, L. (2015). The objective recognition and classification of Northeast Cold Vortex and the Northern hemisphere atmospheric circulation characters in May to August. Sci. Geogr. Sin. 35, 1042–1050.
Liu, Y., and Ren, H. L. (2015). A hybrid statistical downscaling model for prediction of winter precipitation in China. Int. J. Climatol. 35, 1309–1321. doi: 10.1002/joc.4058
Liu, Z. X., Lian, Y., Gao, Z. T., Sun, L., and Shen, B. Z. (2002). Analyses of the Northern hemisphere circulation characters during Northeast Cold Vortex persistence. Chinese J. Atoms Sci. 26, 361–372.
Ren, H.-L., Yujie, W., Bao, Q., Ma, J., Liu, C., and Wan, J. (2019). China multi-model ensemble prediction system version 1.0 (CMMEv1.0) and its application to flood-season prediction in 2018. J. Meteorol. Res. 33, 542–554.
Shen, B. Z., Lin, Z. D., Lu, R. Y., and Lian, Y. (2011). Circulation anomalies associated with interannual variation of early and late summer precipitation in Northeast China. Sci China Earth Sci. 41, 402–412.
Sun, L. (1997). A study of the persistence activity of Northeast Cold Vortex in China. Chinese J. Atoms Sci. 21, 297–307.
Sun, L., and An, G. (2001). A diagnostic study of Northeast Cold Vortex heavy rain over the Songhuajiang-Nenjiang river basin in the summer of 1988. Chin. J. Atmos. Sci. 25, 342–354.
Sun, L., An, G., Gao, C. T., Tang, X. L., Ding, L., and Shen, B. Z. (2002). A composite diagnostic of heavy rain caused by the Northeast Cold Vortex over Songhuajiang-Nenjiang river basin in the summer of 1988. J. Appl. Meteorol. Sci. 13, 156–162.
Torrence, C., and Compo, G. P. (1998). A practical guide to wavelet analysis. Bull. Amer. Meteor. Soc. 79, 61–78.
Wang, D. H., Zhong, S. X., Liu, Y., Li, J., Hu, K. X., and Yang, S. (2007). Advances in the study of rainstorm in Northeast China. Adv. Earth Sci. 22, 549–560.
Wang, M., Abrams, Z. B., Kornblau, S. M., and Coombes, K. R. (2018). Thresher: determining the number of clusters while removing outliers. BMC Bioinformatics 19:9. doi: 10.1186/s12859-017-1998-9
Xie, Z. W., and Bueh, C. (2015). Different types of cold vortex circulations over Northeast China and their weather impacts. Mon. Weather Rev. 43, 845–863. doi: 10.1175/mwr-d-14-00192.1
Xie, Z. W., and Buhe, C. (2016). Cold vortex events over Northeast China associated with the Yakutsk-Okhotsk blocking. Int. J. Climatol. 37, 381–398. doi: 10.1002/joc.4711
Yang, H. Y., Feng, G. L., and Shen, B. Z. (2012). The quantitative research on cold vortex in summer over Northeast China. Chin. J. Atmos. Sci. 36, 487–494.
Zhang, L. X., and Li, Z. C. (2009). A summary of research on cold vortex over Northeast China. Clim. Environ. Res. 14, 218–228.
Keywords: Northeastern China, NCCV, early summer months, precipitation levels, interannual variations
Citation: Fang Y-H, Zhang M-M, Zhao C-Y, Gong Z-Q, Zhou X-Y and Zhang W-Q (2021) The Characteristics of Northeast China Cold Vortex With Different Active Paths in June and Their Relationship With Precipitation and Pre-SST. Front. Environ. Sci. 9:665394. doi: 10.3389/fenvs.2021.665394
Received: 08 February 2021; Accepted: 29 March 2021;
Published: 28 April 2021.
Edited by:
Boyin Huang, National Centers for Environmental Information, National Oceanic and Atmospheric Administration, United StatesReviewed by:
Hailong Liu, Shanghai Jiao Tong University, ChinaShaobo Qiao, Sun Yat-sen University, China
Copyright © 2021 Fang, Zhang, Zhao, Gong, Zhou and Zhang. This is an open-access article distributed under the terms of the Creative Commons Attribution License (CC BY). The use, distribution or reproduction in other forums is permitted, provided the original author(s) and the copyright owner(s) are credited and that the original publication in this journal is cited, in accordance with accepted academic practice. No use, distribution or reproduction is permitted which does not comply with these terms.
*Correspondence: Zhi-Qiang Gong, Z29uZ3pxQGNtYS5nb3YuY24=