Abstract
Grazing intensity (GI) is a major determining factor that controls the functioning of rangelands and the overall nutrient cycle. The Teltele rangeland is used for communal grazing area by the local pastorals; however, to date, there is no documented study data about the impact of GI. The objective of this study was to evaluate the impacts of grazing intensity on selected soil properties in the Teltele rangeland, Ethiopia. Soil samples were collected from different GI sites using different elevation gradient and soil depth from both open grazing and bush-encroached grazing land sand-assessed soil properties. Grazing intensity, elevation, and soil depth significantly (p < 0.05) affected both soils’ physical and chemical properties but rangeland types had no significant effect. The correlation analysis of soil characteristics with the principal component analysis axes showed significant variation. The highly weighted and correlated properties under principal component 1 (PC1) were electrical conductivity, organic carbon, total nitrogen, available phosphorus, and potassium, and under principal component 2, sand and bulk density with equal loaded value (r = −0.998), clay and silt, with silt (0.962) a more loaded one. Soil pH (0.743) demonstrated a significant (p < 0.05) positive correlation with sodium (−0.960) at PC1 (r = 0.610). Based on our results, we recommend further model-based studies on spatial–temporal change of soil properties due to impact of grazing intensity, combined with GIS and remote sensing data to be developed for sustainable rangeland management.
Introduction
Rangelands are lands on which the indigenous vegetation is predominantly grasses, grass-like plants, forbs, or shrubs and is managed as a natural ecosystem (Raj, 2005). Arid and semi-arid rangelands are heterogeneous in space and time because of variation in biotic and abiotic factors related to vegetation and soil properties and provide multiple ecosystem functions and services (Wang et al., 2016; Yang et al., 2016). Rangeland heterogeneity shapes vegetation structure and productivity (IPCC, 2013; Yigini and Panagos, 2016; Ademe et al., 2017). Variability in soil properties is a major main cause of rangeland heterogeneity (Ayalew, 2011). The major properties include soil textural, electrical conductivity (EC), organic matter (OM), and soil pH (Liu et al., 2011b; Abdalla et al., 2018). The primary use of the Teltele rangelands of Ethiopia is for livestock grazing (Derner et al., 2006). These rangelands are almost entirely occupied by a pastoral population using a system of communal resources for livestock production (Solomon et al., 2007). Grazing intensity is a major determining factor controlling rangeland functioning and the overall nutrient cycle (Hafner et al., 2012). Intensive livestock production and grazing gradually modify the soil characteristics, in particular organic carbon (OC), OM, EC, total nitrogen (TN), available phosphorus(P), exchangeable potassium (K), sodium (Na), texture, bulk density (BD), and pH (Pellant et al., 2000; Dessalegn et al., 2015; Zhou et al., 2017). Overgrazing can also cause soil erosion by reducing rangeland productivity and vegetation cover and in the long term, results in loss of environmental services, siltation of dams and river beds, reduction of groundwater, and social-community losses due to malnutrition and poverty (Adimassu et al., 2017). Furthermore, the removal of palatable species due to overgrazing suppresses their growth and facilitates the rapid encroachment of less desirable invasive species, mostly bush and shrubs plants species (Lin et al., 2010; Chen et al., 2015; Hailu et al., 2020).
Previous studies indicated that overgrazing increases soil heterogeneity (Su et al., 2006), while others reported that soil heterogeneity and vegetation diversity decrease with an increasing grazing intensity (Zhou et al., 2010; Zhao et al., 2011; Zhou et al., 2017). However, the majority of studies indicated that continuous and significant grazing intensities are generally accepted as having negative effects on OC (Piñeiro et al., 2010). Similarly, the effects of grazing on the spatial heterogeneity of grassland ecosystems related to soil properties have been inconsistent and need to be clarified in the Borana rangelands of Ethiopia. Evaluating dynamics of soil properties through grazing intensity (GI) requires clear and measurable data using comparable spatial methods at the study site. Therefore, understanding of soil properties is essential for rangeland management because such properties are among the primary factors that determine the forage production potential of an area in a particular climate (Hardy and Mentis, 1986; Aynekulu et al., 2017; Zhang et al., 2018). For centuries, the Teltele rangeland was used for communal grazing area by the local pastoralists, however, to date, there is no documented study data about the impact of GI on the soil properties in the rangeland area. This becomes one of the major gaps for sustainable rangeland management through balancing grazing capacity and maintaining rangeland productivity and livestock performance. Therefore, the objective of this study was to evaluate the soil properties in relation to the GI across different levels of altitude and grazing areas in Teltele rangeland, Ethiopia. So, this study aimed to address the following basic questions that can be used for effective implementation of management strategies and fill the knowledge gap mentioned above: 1) Is the significant difference observed in the soil properties due to variation of GI? 2) Does variation of grazing land type (GLT) had an impact on soil structure? 3) What is the interaction impact of GI with elevation (E) and soil depth (SD) on the soil properties? We hypothesized that 1) GI strongly affected soil properties, 2) GI had a similar impact on the soil properties both at the open grazing site and bush-encroached grazing site, and 3) interaction impact of GI, E, and SD is significant on the Teltele rangeland.
Materials and Methods
Study Area
This study was conducted from January–December 2019 in Teltele district, Borana zone, Ethiopia (Figure 1), which covers an area of 15,430 km2 of which 68% (10,492 km2) is rangeland (Billi et al., 2015). The Teltele rangeland is 666 km south of Addis Ababa. The area is situated approximately between 4° 56′ 23″ and 5° 49′ 21″ N latitude and 37° 41′ 51″ and 38° 39′ 37″ E longitude. Mean elevation is 500–1,500 m with a maximum of 2059 m. The mean annual temperature ranges from 28–33°C with little seasonal variation. The rainfall is distributed with 60% from March–May and 27% from September–November and with high temporal and spatial fluctuations (Dalle et al., 2015). Potential evapotranspiration is 700–3,000 mm (Billi et al., 2015). The soil in the study area includes 53% red sandy loam soil, 30% black clay, and volcanic light-colored silt clay and 17% silt, and the vegetation mainly dominated by encroaching woody species, and those that frequently thinned out, including Senegalia mellifera, Vachellia reficiens, and Vachellia oerfota (Coppock and scarnecchia, 1994; Gemdeo et al., 2005). The 2017 national census data reported a total population of 100,501 in this district, 51,670 men and 48,831 women. Cattle, goats, sheep, camels, mules, donkeys, and horses are the main livestock species.
FIGURE 1

Location map of the study area.
Grazing Site Selection
A reconnaissance survey and discussion were conducted with local pastoralists and district Pastoral Development Officers on grazing intensity issues. The sampling site was selected both from open (free from any bush encroachment) and from bush-encroached grazing site since both grazing land types were available in the study area with different GI. In each grazing land type, three grazing treatments were categorized based on GI. Grazing intensity data were collected using the same procedures described by Fenetahun et al. (2020,2021), the same authors at the same study site. Based on the discussion and survey data, grazing sites were chosen based on similar, uniform, and same soil series. All sites were on the northeast part of Teltele woreda and have laid in similar slope and elevation range, and all sampling sites had been grazed by livestock for several decades up to date and almost have the same seasonal and environmental features. Cattle, goats, and sheep are among the dominant livestock. The grazing sites were used for yearly round, seasonal, and some are already fenced by the government for conservation and rehabilitation purposes in order to use it when the harsh environment like drought will happen. The status of pasture and rangeland condition of grazing site was used to estimate the level of GI (Morteza et al., 2012). We selected a site with two treatments: a non-grazing (NG) (as a control) and a grazing site (moderately grazing and overgrazing) that was considered to see the effect of grazing intensity based on grazing intensity gradient (Fenetahun et al., 2021). The rate of GI was described as follows: non-grazed (NG) (livestock have been excluded from the pasture by fence and the ground was almost completely covered by vegetation) and moderately grazed (MG) (pasture has been used for grazing in regular rotational basis, that is, used during non-dry seasons but not in the rainy season and vegetation covers almost 50–55% and overgrazed (OG) (pasture is used for grazing constantly throughout the year and totally grazed and undergoes degradation, and vegetation cover was in most cases less than 15%) for the last 1.5 years, and also, GI was divided into MG and OG based on the current carrying capacity potential (Fenetahun et al., 2020; Fenetahun et al., 2021). The treatments of sample collection involved at NG (∼0 ha AU−1Y−1), MG (6 ha AU−1 Y−1), and OG (12 ha AU−1 Y−1 and above) grazing area based on the current carrying capacity of rangeland was calculated by Fenetahun et al. (2020) and physical field observation. Also, we have selected the sampling site which has almost similar rainfall pattern and temperature in order to reduce the climate difference effect on soil composition.
Soil Sampling and Analyses
For soil sample collection, we applied the judgment sampling method (USEPA, 2002) to locate sampling sites for both open-grazing land (OGL) and bush encouraged (BE), landscape E lower (LE) (700–1,000 m), medium (ME) (1,001–1,300 m), and higher (HE) (1,301–1,600 m), and at soil depths (SD) of 0–10 cm and 10–20 cm using an auger at all GI because most grass roots are found within this layer (Mekuria et al., 2018; Zhu et al., 2015). Then, established a 5-km transect at each site, three main plots (50 m × 50 m), the western plot having a GI of NG, the middle plot a GI of MG, and the eastern plot a GI of OG, were marked and had a 1 km interval between each GI plots, and in each marked plot, five quadrats of (1 m × 1 m) were placed at 5 m buffer zone for each sampling quadrat that was used for soil sample collection (Figure 2). Soil sampling was done both during the dry season (end of February 2019) and the rainy season (end of May 2019) along each of the grazing sites in order to overcome the season variation effect and we took the mean value. Thus, a total of 108 quadrat samples were collected (2 grazing land types × 3 landscape E × 3 GI plots × 2 SD) × 3 replications. The samples were mixed at the point of sampling and 0.5 kg sub-samples from each sampling point were taken in the laboratory in a plastic bag and were oven-dried at 105°C for 24 h in order to avoid delay. Samples for the BD estimation were collected two days after a rainfall event, a 5 cm × 5 cm soil corer of volume 98.13 cm3 was used, making sure not to disturb soil aggregation (Masebo et al., 2014; Hishe et al., 2017). Samples were analyzed in the soil laboratory at Yabello Pastoral and Dryland Agricultural Soil Research Center. After drying, soil samples were crushed to pass a 2-mm stainless steel sieve to remove foreign bodies (Hishe et al., 2017). Analysis was performed for OC, TN, P, K, Na, pH, EC contents, and particle size distribution (clay, silt, and sand) following standard procedures is described (Table 1) below.
FIGURE 2
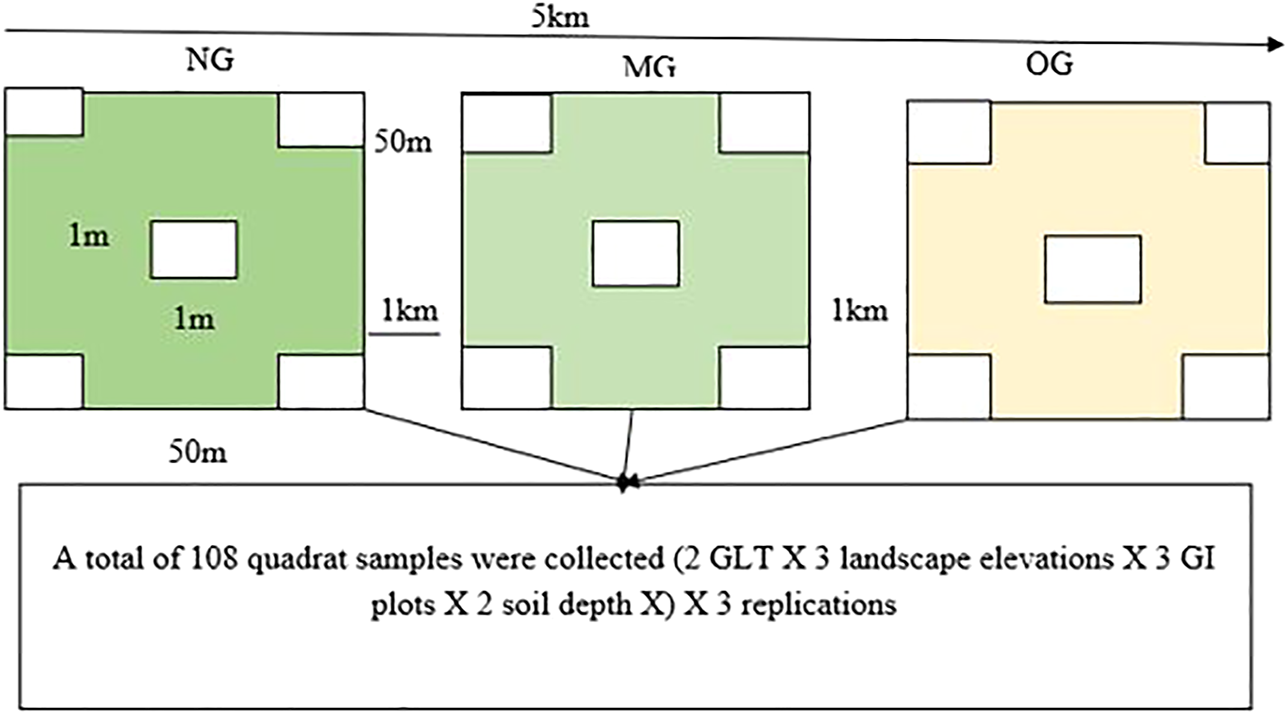
Sampling lay out.
TABLE 1
| Major soil physiochemical properties | Analyses procedures and methods used | References |
|---|---|---|
| Soil texture | Hydrometer procedure | van Reeuwijk (2002) |
| Organic carbon | Wet oxidation method | Walkley and Black (1934) |
| EC and pH | 1:2.5 soil/water suspension | Motsara and Roy (2008) |
| Exchangeable cations | 1-M ammonium acetate solution at pH 7 | Haldar and Sakar (2005) |
| Phosphorus (p) | Olsen’s extraction | Van der Waal (2009) |
| Total N | Kjeldahl procedure | Miles and Farina (2013) |
| Bulk densities | Dividing oven-dry mass to volume of the core sampler | Alemayehu and Fisseha (2018); Wilke (2005) |
Standard procedures and methods used to analyses soil properties.
Data Analysis
The effect of GLT (OGL and BE), GI, and E impact on selected soil properties was analyzed by using analysis of variance (ANOVA) effect in SAS version 9.1.3 (Statistical Analysis System) with different statistical packages. Some of the properties possessed extreme outliers and did not meet the normality assumptions. Then, an assessment of significant differences evaluation at p < 0.05 was used to analyze the impact of treatment using the LSMEANS procedure (Yang and Luo, 2011). A Spearman rank correlation analysis and matrix were carried out to investigate the impact of soil factors resulting from the different GI, and a full set of soil properties data across GI, E, SD, and GLT were subjected to principal component analysis (PCA) to evaluate the impact of GI on each soil properties and also in order to evaluate the bonding characteristics within each soil properties. The criterion used for selecting the optimal subset of the main component (PC) is to select a subset with eigenvalues greater than 1.
Results
Physical Properties
From our result, we can understand that both levels of GI, E, and SD, had significant (p < 0.05) effects whereas GLT (OGL and BE) had no significant (p > 0.05) effect on all of the soil physical properties. Sand soil content was highest on the OG level of grazing than the MG and NG, at both SD and E, particularly at HE grazing position and at the 0–10 cm of SD and lowest on the NG level of grazing, at LE grazing position and at the 10–20 cm of SD in both GLT. Clay and silt soil content were highest on NG level of grazing than MG and OG at both SD and E, particularly at LE grazing position and at 10–20 cm of SD and lowest on OG level of grazing, at HE grazing position and at 0–10 cm of SD (Table 2). Also, the interaction (X) effect of both GI, E, and SD, across GLT had significant effects on all of the physical properties of the soil, both within and across the different grazing sites (Table 3 and Figure 3). The highest sand soil particle distribution was recorded at OG X BE X HE X 0–10 cm depth and the lowest was recorded at NG X BE X LE X 10–20 cm depth. The highest clay and silt soil particle distribution were recorded at NG X BE X LE X 10–20 cm depth and the lowest clay and silt were recorded at OG X BE X HE X 0–10 cm depth. The highest concentration of BD was observed at 0–10 cm depth in all GI and E. The highest BD was recorded at OG, in the BE site, at HE of 0–10 cm depth and lowest was recorded at NG, in the BE site at LE of 10–20 cm depth. This indicated that the interaction effect of GLT had significant effects on all of the physical properties of the soil.s
TABLE 2
| Impacting factors and class | Soil particle size distribution (%) | BD (gcm−3) | |||
|---|---|---|---|---|---|
| Sand | Clay | Silt | |||
| Grazing land type (GLT) | OGL | 43.22 ± 0.05 | 36.01 ± 0.04 | 20.77 ± 0.14 | 1.16 ± 0.12 |
| BE | 45.34 ± 0.02 | 35.03 ± 0.05 | 19.63 ± 0.07 | 1.18 ± 0.23 | |
| Grazing intensity (GI) | NG | 42.38 ± 0.04a | 38.76 ± 0.62a | 18.86 ± 0.17a | 1.14 ± 0.08a |
| MG | 50.56 ± 0.03b | 31.65 ± 0.21b | 17.79 ± 0.09b | 1.36 ± 0.17b | |
| OG | 61.92 ± 0.17c | 27.63 ± 0.17c | 10.45 ± 0.31c | 1.67 ± 0.15c | |
| Elevation (E) (m) | LE | 39.18 ± 0.16a | 38.24 ± 0.89a | 22.58 ± 0.03a | 1.05 ± 0.05a |
| ME | 50.54 ± 0.09b | 33.39 ± 0.71b | 16.07 ± 0.14b | 1.34 ± 0.13b | |
| HE | 58.37 ± 0.11c | 30.19 ± 0.09c | 11.44 ± 0.18c | 1.57 ± 0.11c | |
| Soil depth (SD) (cm) | 0–10 | 49.18 ± 0.05a | 32.16 ± 0.14a | 18.66 ± 0.06a | 1.32 ± 0.08a |
| 10–20 | 40.71 ± 0.12b | 35.0 ± 0.42b | 24.29 ± 0.03b | 1.09 ± 0.10b | |
| P-GLT | Ns | Ns | Ns | Ns | |
| P-GI | ** | ** | * | ** | |
| P-E | ** | * | ** | ** | |
| P-SD | * | * | * | * | |
Mean (±SE) value of soil physical particle size distribution under different grazing land type, elevation, grazing intensity, and soil depths.
Mean values within columns under each topic followed by different letters are significantly different from each other at p < 0.05, OGL = open-grazing land, BE, bush encroached; NG, non-grazing; MG, moderately grazing; OG, overgrazing; LE, lower elevation; ME, middle elevation; HE, higher elevation; BD, bulk density; ns, nonsignificant, * significant, ** highly significant. SE = standard error.
TABLE 3
| Interactive factors (GI X GLT X E X SD) | Soil particle size distribution (%) | BD (gcm−3) | |||||
|---|---|---|---|---|---|---|---|
| Sand | Clay | Silt | |||||
| NG | OGL | LE | 0–10 | 45.49 ± 0.91a | 33.01 ± 0.19a | 21.5 ± 0.30a | 1.22 ± 0.05a |
| 10–20 | 39.80 ± 0.22b | 36.89 ± 0.17b | 23.31 ± 0.09b | 1.07 ± 0.08b | |||
| ME | 0–10 | 49.91 ± 0.14c | 30.08 ± 0.91c | 20.01 ± 0.54c | 1.34 ± 0.14c | ||
| 10–20 | 40.62 ± 0.07d | 35.93 ± 0.28d | 23.45 ± 0.41d | 1.09 ± 0.03d | |||
| HE | 0–10 | 54.11 ± 0.18e | 27.71 ± 0.33e | 18.18 ± 0.05e | 1.45 ± 0.06e | ||
| 10–20 | 41.34 ± 0.23f | 30.98 ± 0.41f | 27.69 ± 0.66f | 1.11 ± 0.03f | |||
| BE | LE | 0–10 | 45.92 ± 0.51a | 32.67 ± 0.08a | 21.41 ± 0.37a | 1.23 ± 0.07a | |
| 10–20 | 38.95 ± 0.09b | 37.31 ± 0.58b | 23.74 ± 0.28b | 1.05 ± 0.21b | |||
| ME | 0–10 | 50.33 ± 0.33c | 30.65 ± 0.61c | 19.02 ± 0.33c | 1.35 ± 0.08c | ||
| 10–20 | 41.57 ± 0.61d | 34.95 ± 0.04d | 23.48 ± 0.09d | 1.12 ± 0.31d | |||
| HE | 0–10 | 55.05 ± 0.42e | 26.55 ± 0.77e | 18.4 ± 0.29e | 1.48 ± 0.04e | ||
| 10–20 | 42.09 ± 0.18f | 31.89 ± 0.02f | 26.02 ± 0.44f | 1.13 ± 0.02f | |||
| MG | OGL | LE | 0–10 | 52.76 ± 0.22aa | 30.99 ± 0.03aa | 16.25 ± 0.45aa | 1.42 ± 0.06aa |
| 10–20 | 47.09 ± 0.41ba | 34.45 ± 0.36ba | 18.46 ± 0.05ba | 1.26 ± 0.03ba | |||
| ME | 0–10 | 56.79 ± 0.09ca | 28.99 ± 0.07ca | 14.22 ± 0.12ca | 1.52 ± 0.06ca | ||
| 10–20 | 49.06 ± 0.17da | 32.45 ± 0.06da | 18.49 ± 0.16da | 1.32 ± 0.17da | |||
| HE | 0–10 | 58.10 ± 0.31ea | 27.87 ± 0.15ea | 14.03 ± 0.06ea | 1.56 ± 0.14ea | ||
| 10–20 | 52.21 ± 0.06fa | 30.04 ± 0.27fa | 17.75 ± 0.07fa | 1.40 ± 0.05fa | |||
| BE | LE | 0–10 | 53.67 ± 0.41aa | 29.99 ± 0.16aa | 16.34 ± 0.33aa | 1.44 ± 0.39aa | |
| 10–20 | 48.49 ± 0.05ba | 33.87 ± 0.02ba | 17.64 ± 0.36ba | 1.30 ± 0.53ba | |||
| ME | 0–10 | 57.63 ± 0.36ca | 28.02 ± 0.51ca | 14.35 ± 0.11ca | 1.55 ± 0.04ca | ||
| 10–20 | 50.18 ± 0.38da | 32.20 ± 0.31da | 17.62 ± 0.08da | 1.35 ± 0.37da | |||
| HE | 0–10 | 59.64 ± 0.06ea | 27.07 ± 0.22ea | 13.29 ± 0.19ea | 1.60 ± 0.29ea | ||
| 10–20 | 53.78 ± 0.04fa | 29.82 ± 0.08fa | 16.40 ± 0.12fa | 1.44 ± 0.18fa | |||
| OG | OGL | LE | 0–10 | 58.66 ± 0.06ab | 26.77 ± 0.15ab | 14.57 ± 0.21ab | 1.57 ± 0.17ab |
| 10–20 | 53.05 ± 0.18bb | 28.84 ± 0.23bb | 18.11 ± 0.32bb | 1.42 ± 0.39bb | |||
| ME | 0–10 | 63.71 ± 0.23cb | 24.41 ± 0.04cb | 13.88 ± 0.07cb | 1.69 ± 0.33cb | ||
| 10–20 | 54.06 ± 0.25db | 25.97 ± 0.51db | 19.97 ± 0.42db | 1.45 ± 0.07db | |||
| HE | 0–10 | 64.07 ± 0.04eb | 23.80 ± 0.04eb | 12.13 ± 0.05eb | 1.72 ± 0.06eb | ||
| 10–20 | 55.93 ± 0.08fb | 25.79 ± 0.18fb | 18.28 ± 0.36fb | 1.50 ± 0.23fb | |||
| BE | LE | 0–10 | 59.09 ± 0.44ab | 26.10 ± 0.17ab | 14.81 ± 0.03ab | 1.59 ± 0.14ab | |
| 10–20 | 54.10 ± 0.27bb | 28.2 ± 0.32bb | 17.70 ± 0.39bb | 1.45 ± 0.11bb | |||
| ME | 0–10 | 64.0 ± 0.15cb | 23.94 ± 0.08cb | 12.06 ± 0.02cb | 1.72 ± 0.18cb | ||
| 10–20 | 55.71 ± 0.14db | 24.69 ± 0.13db | 20.33 ± 0.09db | 1.50 ± 0.44db | |||
| HE | 0–10 | 65.31 ± 0.07eb | 23.05 ± 0.34eb | 11.64 ± 0.12eb | 1.74 ± 0.03eb | ||
| 10–20 | 56.08 ± 0.07eb | 23.98 ± 0.28fb | 19.94 ± 0.16fb | 1.51 ± 0.07fb | |||
| P-GI X GLT X E X SD | ** | ** | ** | ** | |||
Mean (±SE) value of soil physical particle size distribution under the interaction effects of grazing intensity with grazing land type, elevation, and soil depths.
Mean values within columns under each topic followed by different letters are significantly different at p < 0.05 and with same letter under row in each grazing intensity within different grazing land type are no significantly different (p > 0.05) from each other. ** highly significant, BD, bulk density; NG, non-grazing; OGL, open-grazing land; LE, lower elevation; ME, middle elevation; HE, higher elevation; BE, bush encroached; MG, moderately grazing; OG, overgrazing; GI, grazing intensity; GLT, grazing land type; E, elevation (m); SD, soil depth (cm); SE, standard error.
FIGURE 3

Mean ± SE particle size distribution across grazing intensity. Bars with different letters are significantly different for each grazing intensity site, PSD, particle size distribution; NG, non-grazing; MG, moderately grazing; OG, overgrazing.
Chemical Properties
Results indicated that both levels of GI, E, and SD, exhibited a significant (p < 0.05) effect but GLT had no significant (p > 0.05) effect on all of the soil chemical properties. The highest EC, OC, TN, P, and K contents were recorded at NG than the MG and OG level of grazing at both SD and E, particularly at HE grazing position and at the 10–20 cm of SD and lowest at OG level of grazing at both SD and E, particularly at LE grazing position and at the 0–10 cm of SD in both GLT. The highest pH and Na values were recorded at OG than NG and MG level of grazing at both SD and E, particularly at LE and at the 0–10 cm of SD and lowest at NG level of grazing, especially at HE and at the 10–20 cm of SD (Table 4). Interaction (X) effects of both GI, E, and SD, across GLT had significant effects on all of the chemical properties of the soil, both within and across the different grazing sites (Table 5 and Figure 4). The highest EC, OC, TN, P, and K contents were recorded at NG X OGL X HE X 10–20 cm depth and the lowest was recorded at OG X BE X LE X 0–10 cm depth. The highest pH and Na values were recorded at OG X BE X LE X 0–10 cm depth and the lowest was recorded at NG X OGL X HE X 10–20 cm depth. Further, the interaction effect of bush encroachment also had affected the soil chemical properties distribution in the grazing rangeland.
TABLE 4
| Impacting factors and class | Soil chemical properties | |||||||
|---|---|---|---|---|---|---|---|---|
| EC (dSm−1) | OC (%) | TN (%) | Av. p (%) | Av. K (%) | Ex. Na (%) | pH (pH m) | ||
| GLT | OGL | 0.07 ± 0.01 | 1.00 ± 0.03 | 0.18 ± 0.07 | 12.03 ± 0.09 | 0.76 ± 0.03 | 0.41 ± 0.01 | 6.74 ± 0.08 |
| BE | 0.07 ± 0.01 | 0.99 ± 0.02 | 0.16 ± 0.01 | 11.98 ± 0.17 | 0.74 ± 0.02 | 0.42 ± 0.01 | 6.78 ± 0.12 | |
| GI | NG | 0.09 ± 0.01a | 1.07 ± 0.08a | 0.19 ± 0.02a | 12.08 ± 0.38a | 0.89 ± 0.05a | 0.38 ± 0.01a | 5.45 ± 0.07a |
| MG | 0.06 ± 0.03b | 0.68 ± 0.03b | 0.10 ± 0.01b | 8.20 ± 0.44days | 0.71 ± 0.01b | 0.64 ± 0.08b | 6.03 ± 0.10b | |
| OG | 0.04 ± 0.01c | 0.48 ± 0.06c | 0.08 ± 0.03c | 6.09 ± 0.21c | 0.39 ± 0.02c | 0.91 ± 0.05c | 6.91 ± 0.04c | |
| E | LE | 0.03 ± 0.02a | 0.49 ± 0.09a | 0.06 ± 0.02a | 5.98 ± 0.14a | 0.41 ± 0.01a | 0.92 ± 0.08a | 6.88 ± 0.14a |
| ME | 0.06 ± 0.04b | 0.72 ± 0.12b | 0.11 ± 0.04b | 7.07 ± 0.04b | 0.59 ± 0.03b | 0.61 ± 0.03b | 6.03 ± 0.21b | |
| HE | 0.08 ± 0.01c | 1.03 ± 0.03c | 0.17 ± 0.05c | 11.97 ± 0.06c | 0.79 ± 0.03c | 0.44 ± 0.07c | 5.42 ± 0.006c | |
| SD | 0–10 | 0.05 ± 0.03a | 0.61 ± 0.07a | 0.05 ± 0.02a | 8.09 ± 0.09a | 0.5 ± 0.02a | 0.89 ± 0.09a | 6.86 ± 0.19a |
| 10–20 | 0.07 ± 0.01b | 1.04 ± 0.04b | 0.18 ± 0.06b | 11.88 ± 0.11b | 0.83 ± 0.04b | 0.45 ± 0.02b | 5.96 ± 0.03b | |
| P-GLT | Ns | Ns | Ns | Ns | Ns | ns | Ns | |
| P-GI | * | ** | ** | ** | ** | ** | ** | |
| P-E | * | ** | * | ** | * | ** | ** | |
| P-SD | * | ** | ** | ** | * | ** | * | |
Mean (±SE) value of soil chemical properties distribution under different grazing land type, elevation, grazing intensity, and soil depths.
Mean values within columns under each topic followed by different letters are significantly different from each other at p < 0.05, EC, electrical conductivity; OC, organic carbon; TN, total nitrogen; Av. p, available phosphorus; Av. K, available potassium; Ex. Na, exchangeable sodium; pH, soil reaction; OGL, open-grazing land; BE, bush encroached; NG, non-grazing; MG, moderately grazing; OG, overgrazing; LE, lower elevation; ME, middle elevation; HE, higher elevation; SD, soil depth (cm); E, elevation(m); GI, grazing intensity; GLT, grazing land type; ns, nonsignificant, * significant, ** highly significant.
TABLE 5
| Interactive factors (GI X GLT X E X SD) | Soil chemical properties | |||||||||
|---|---|---|---|---|---|---|---|---|---|---|
| EC (dSm−1) | OC (%) | TN (%) | Av. p (%) | Av. K (%) | Ex. Na (%) | pH (pH m) | ||||
| NG | OGL | LE | 0–10 | 0.05 ± 0.02a | 0.46 ± 0.02a | 0.08 ± 0.03a | 10.21 ± 0.07a | 0.58 ± 0.02a | 0.45 ± 0.02a | 5.92 ± 0.12a |
| 10–20 | 0.09 ± 0.01b | 0.61 ± 0.04b | 0.11 ± 0.01b | 10.82 ± 0.12b | 0.69 ± 0.06b | 0.37 ± 0.01b | 5.78 ± 0.16b | |||
| ME | 0–10 | 0.08 ± 0.03c | 0.57 ± 0.05c | 0.07 ± 0.02c | 10.48 ± 0.07c | 0.62 ± 0.02c | 0.33 ± 0.01c | 5.63 ± 0.20c | ||
| 10–20 | 0.13 ± 0.07d | 0.92 ± 0.12d | 0.12 ± 0.02d | 11.05 ± 0.41d | 0.81 ± 0.08d | 0.27 ± 0.02d | 5.42 ± 0.05d | |||
| HE | 0–10 | 0.08 ± 0.04e | 0.79 ± 0.03e | 0.09 ± 0.01e | 10.98 ± 0.04e | 0.78 ± 0.01e | 0.31 ± 0.03e | 5.36 ± 0.18e | ||
| 10–20 | 0.19 ± 0.02f | 1.18 ± 0.21f | 0.19 ± 0.07f | 12.13 ± 0.18f | 0.99 ± 0.09f | 0.22 ± 0.04f | 5.27 ± 0.03f | |||
| BE | LE | 0–10 | 0.04 ± 0.01a | 0.47 ± 0.03a | 0.07 ± 0.01a | 10.22 ± 0.11a | 0.58 ± 0.04a | 0.47 ± 0.05a | 5.94 ± 0.06a | |
| 10–20 | 0.07 ± 0.02b | 0.60 ± 0.01b | 0.10 ± 0.03b | 10.80 ± 0.22b | 0.66 ± 0.02b | 0.38 ± 0.08b | 5.79 ± 0.44b | |||
| ME | 0–10 | 0.07 ± 0.01c | 0.56 ± 0.05c | 0.06 ± 0.01c | 10.46 ± 0.06c | 0.62 ± 0.03c | 0.35 ± 0.03c | 5.66 ± 0.06c | ||
| 10–20 | 0.09 ± 0.03d | 0.92 ± 0.03d | 0.12 ± 0.04d | 11.06 ± 0.08d | 0.79 ± 0.01d | 0.29 ± 0.04d | 5.44 ± 0.15d | |||
| HE | 0–10 | 0.07 ± 0.02e | 0.78 ± 0.02e | 0.08 ± 0.01e | 10.96 ± 0.33e | 0.76 ± 0.05e | 0.31 ± 0.05e | 5.39 ± 0.08e | ||
| 10–20 | 0.18 ± 0.06f | 1.16 ± 0.09f | 0.18 ± 0.06f | 12.11 ± 0.03f | 0.98 ± 0.08f | 0.24 ± 0.06f | 5.29 ± 0.11f | |||
| MG | OGL | LE | 0–10 | 0.04 ± 0.01aa | 0.41 ± 0.01aa | 0.08 ± 0.02aa | 10.33 ± 0.08aa | 0.39 ± 0.02aa | 0.72 ± 0.07aa | 6.05 ± 0.10aa |
| 10–20 | 0.07 ± 0.02ba | 0.58 ± 0.03ba | 0.10 ± 0.01ba | 10.54 ± 0.03ba | 0.54 ± 0.01ba | 0.6 ± 0.03ba | 6.02 ± 0.19ba | |||
| ME | 0–10 | 0.08 ± 0.01ca | 0.47 ± 0.07ca | 0.09 ± 0.01ca | 10.59 ± 0.10ca | 0.60 ± 0.04ca | 0.60 ± 0.07ca | 6.02 ± 0.07ca | ||
| 10–20 | 0.10 ± 0.07da | 0.71 ± 0.02da | 0.12 ± 0.03da | 10.87 ± 0.12da | 0.80 ± 0.05da | 0.50 ± 0.01da | 5.95 ± 0.13da | |||
| HE | 0–10 | 0.09 ± 0.02ea | 0.82 ± 0.05ea | 0.11 ± 0.02ea | 10.96 ± 0.07ea | 0.72 ± 0.01ea | 0.47 ± 0.04ea | 5.93 ± 0.06ea | ||
| 10–20 | 0.13 ± 0.07fa | 0.97 ± 0.06fa | 0.14 ± 0.04fa | 11.05 ± 0.51fa | 0.83 ± 0.05fa | 0.44 ± 0.07fa | 5.88 ± 0.23fa | |||
| BE | LE | 0–10 | 0.04 ± 0.01aa | 0.40 ± 0.02aa | 0.07 ± 0.01aa | 10.33 ± 0.18aa | 0.38 ± 0.01aa | 0.73 ± 0.02aa | 6.07 ± 0.44aa | |
| 10–20 | 0.09 ± 0.01ba | 0.58 ± 0.03ba | 0.09 ± 0.02ba | 10.53 ± 0.07ba | 0.52 ± 0.07ba | 0.61 ± 0.08ba | 6.01 ± 0.08ba | |||
| ME | 0–10 | 0.08 ± 0.02ca | 0.45 ± 0.07ca | 0.09 ± 0.01ca | 10.60 ± 0.43ca | 0.59 ± 0.02ca | 0.61 ± 0.05ca | 6.04 ± 0.45ca | ||
| 10–20 | 0.09 ± 0.02da | 0.70 ± 0.02da | 0.11 ± 0.03da | 10.87 ± 0.27da | 0.78 ± 0.08da | 0.52 ± 0.03da | 6.02 ± 0.33da | |||
| HE | 0–10 | 0.08 ± 0.01ea | 0.82 ± 0.09ea | 0.10 ± 0.03ea | 10.94 ± 0.33ea | 0.72 ± 0.04ea | 0.48 ± 0.01ea | 5.93 ± 0.13ea | ||
| 10–20 | 0.13 ± 0.03fa | 0.95 ± 0.07fa | 0.12 ± 0.01fa | 11.04 ± 0.39fa | 0.81 ± 0.05fa | 0.46 ± 0.02fa | 5.90 ± 0.05fa | |||
| OG | OGL | LE | 0–10 | 0.02 ± 0.01ab | 0.38 ± 0.02ab | 0.05 ± 0.01ab | 5.96 ± 0.20ab | 0.38 ± 0.02ab | 0.97 ± 0.07ab | 6.93 ± 0.16ab |
| 10–20 | 0.04 ± 0.01bb | 0.43 ± 0.07bb | 0.07 ± 0.01bb | 6.03 ± 0.09bb | 0.51 ± 0.08bb | 0.91 ± 0.01bb | 6.92 ± 0.14bb | |||
| ME | 0–10 | 0.04 ± 0.02cb | 0.50 ± 0.03cb | 0.04 ± 0.02cb | 5.99 ± 0.17cb | 0.42 ± 0.01cb | 0.91 ± 0.09cb | 6.87 ± 0.07cb | ||
| 10–20 | 0.06 ± 0.01db | 0.56 ± 0.04db | 0.08 ± 0.01db | 6.68 ± 0.04db | 0.63 ± 0.04db | 0.82 ± 0.02db | 6.78 ± 0.44db | |||
| HE | 0–10 | 0.06 ± 0.01eb | 0.61 ± 0.07eb | 0.07 ± 0.01eb | 6.83 ± 0.41eb | 0.47 ± 0.03eb | 0.86 ± 0.06eb | 6.81 ± 0.31eb | ||
| 10–20 | 0.08 ± 0.02fb | 0.67 ± 0.04fb | 0.11 ± 0.07fb | 7.89 ± 0.44fb | 0.66 ± 0.05fb | 0.77 ± 0.03fb | 6.53 ± 0.06fb | |||
| BE | LE | 0–10 | 0.03 ± 0.01ab | 0.38 ± 0.02ab | 0.04 ± 0.01ab | 5.94 ± 0.24ab | 0.36 ± 0.02ab | 0.98 ± 0.08ab | 6.95 ± 0.22ab | |
| 10–20 | 0.03 ± 0.01bb | 0.42 ± 0.01bb | 0.06 ± 0.01bb | 6.02 ± 0.07bb | 0.51 ± 0.03bb | 0.93 ± 0.03bb | 6.92 ± 0.08bb | |||
| ME | 0–10 | 0.03 ± 0.01cb | 0.50 ± 0.05cb | 0.03 ± 0.01cb | 5.98 ± 0.16cb | 0.40 ± 0.01cb | 0.91 ± 0.04cb | 6.89 ± 0.12cb | ||
| 10–20 | 0.05 ± 0.01db | 0.55 ± 0.03db | 0.08 ± 0.02db | 6.68 ± 0.06db | 0.63 ± 0.06db | 0.84 ± 0.02db | 6.78 ± 0.13db | |||
| HE | 0–10 | 0.06 ± 0.01eb | 0.60 ± 0.07eb | 0.07 ± 0.01eb | 6.83 ± 0.11eb | 0.47 ± 0.03eb | 0.87 ± 0.07eb | 6.81 ± 0.06eb | ||
| 10.20 | 0.07 ± 0.02fb | 0.67 ± 0.04fb | 0.10 ± 0.03fb | 7.88 ± 0.05fb | 0.65 ± 0.02fb | 0.77 ± 0.01fb | 6.55 ± 0.41fb | |||
| P-GI X GLT X E X SD | * | ** | ** | ** | * | * | ** | |||
Mean (±SE) value of soil chemical properties distribution under the interaction effects of grazing intensity with grazing land type, elevation and soil depths.
Mean values within columns under each effect followed by different letters are significantly different from each other at p < 0.05, EC, electrical conductivity; OC, organic carbon; TN, total nitrogen; Av. p, available phosphorus; Av. K, available potassium; Ex. Na, exchangeable sodium; pH, soil reaction; OGL, open-grazing land; BE, bush-encroached grazing land; NG, non-grazing; MG, moderately grazing; OG, overgrazing; LE, lower elevation; ME, middle elevation; E, elevation (m); GI, grazing intensity; HE, higher elevation; SD, soil depth(cm); ns, nonsignificant; * significant, ** highly significant.
FIGURE 4

Mean ± SE soil chemical properties abundance across grazing intensity. Bars with different letters are significantly different for each grazing intensity site. SCP, soil chemical properties; GI, grazing intensity; NG, non-grazing; MG, moderately grazing; OG, overgrazing.
Correlation Analysis of Soil Properties With Grazing Intensity
The correlation analysis of the regression lines describes the relationship between the soil properties and the GI. In relation to soil physical properties, there is a positive correlation between sand and BD contents with the GI but a negative correlation with clay and silt contents with the rate of GI (Figure 5). In the case of soil chemical properties, GI showed a negative correlation with the soil EC, OC, TN, P, and K contents and a positive correlation with soil pH and Na contents (Figure 6).
FIGURE 5
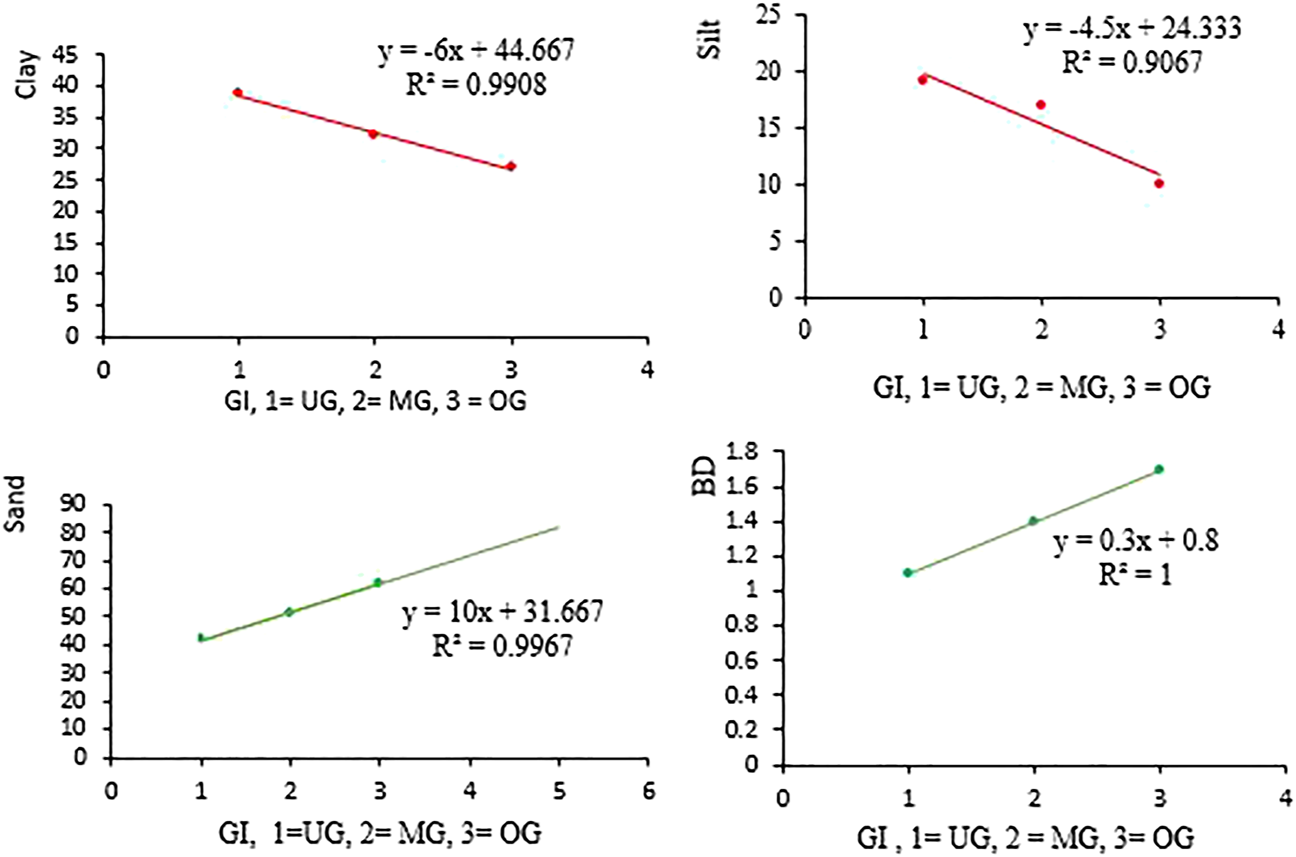
Correlations between soil physical properties and grazing intensity. GI, grazing intensity; NG, non-grazing; MG, moderately grazing; OG, overgrazing.
FIGURE 6
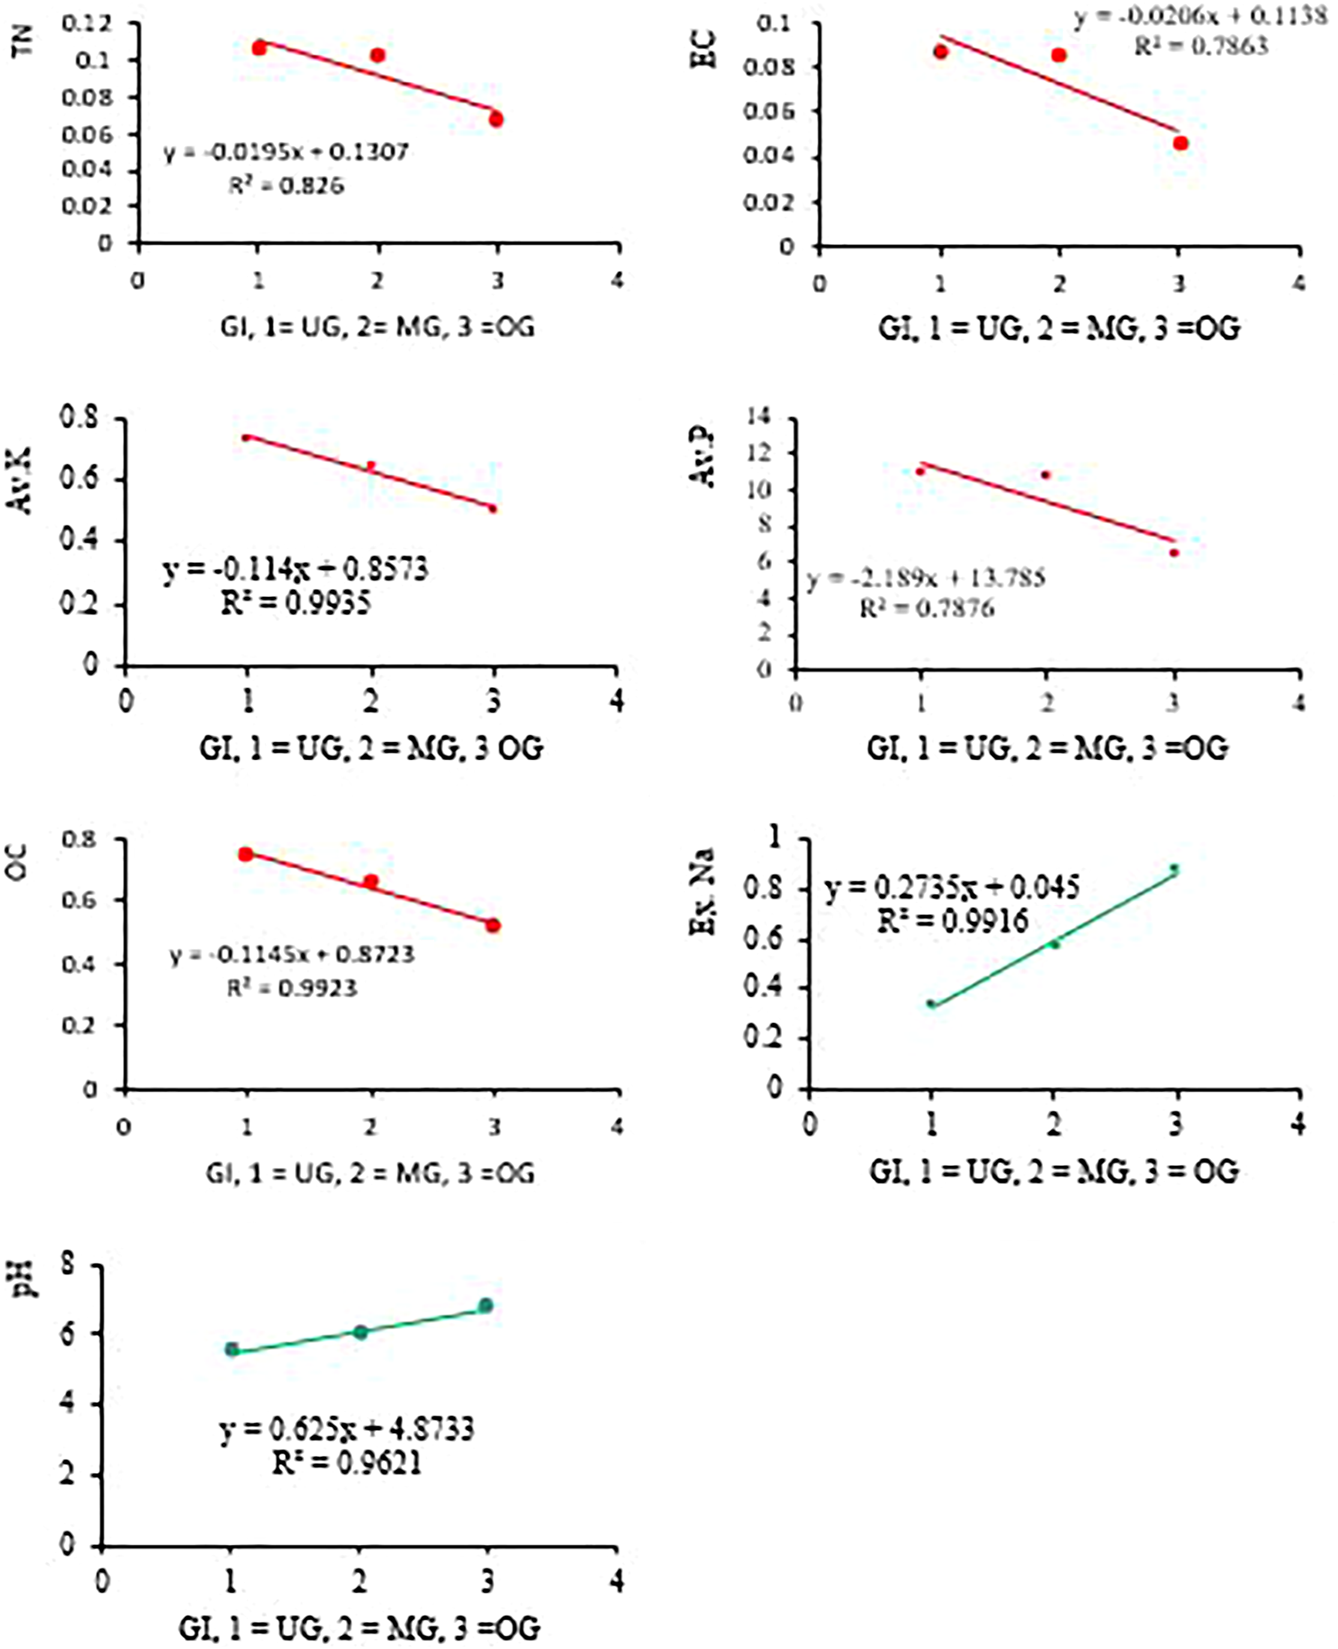
Correlations between soil chemical properties and grazing intensity (GI, grazing intensity; NG, non-grazing; MG, moderately grazing; OG, overgrazing.
Correlation Matrix and Principal Component Analysis of Soil Particle
Observing the correlation matrix and PCA that were computed for each pair of soil properties at each GLT along with the interaction effect of GI, E, and SD, and EC, OC, TN, P, and K showed positive correlations with each other and with clay and silt soil contents, whereas, a negative correlation with Na, pH, and sand soil contents across both GLT, GI, E, and SD (Table 6 and Figure 7B). The location of soil properties under different regions of the PCA axes is based on the correlation coefficient between each variable. Since the main components are orthogonal, this defines a projection of the data on vector space spanned by the first two principal components. Thus, we used two PCs with eigenvalues >1 for our study (Table 6 and Figure 7A). Therefore, the location of each soil property in the PCA diagram is very significant and important. The highly weighted and positively correlated properties under PC1 were EC, OC, TN, P, and K and highly impacted or negatively correlated with Na and pH (Figure 7B). Under PC2, the highly weighted and positively correlated properties were sand and BD with a high negative correlation of the other weighted and positively correlated properties of clay and silt. Soil pH showed a strong positive correlation with Na at PC1 with a more loaded value of Na, and this result strongly agrees with the data reported by Kane (2015).
TABLE 6
| EC | OC | TN | Av. p | Av. K | Ex. Na | pH | Sand | Clay | Silt | BD | |
|---|---|---|---|---|---|---|---|---|---|---|---|
| EC | 1.000 | ||||||||||
| OC | 0.933 | 1.000 | |||||||||
| TN | 0.891 | 0.961 | 1.000 | ||||||||
| Av. p | 0.887 | 0.974 | 0.917 | 1.000 | |||||||
| Av. K | 0.949 | 0.948 | 0.913 | 0.912 | 1.000 | ||||||
| Ex. Na | −0.928 | −0.967 | −0.963 | −0.914 | −0.951 | 1.000 | |||||
| pH | −0.746 | −0.594 | −0.584 | −0.471 | −0.713 | 0.610 | 1.000 | ||||
| Sand | −0.112 | −0.298 | −0.248 | −0.290 | −0.306 | 0.266 | −0.064 | 1.000 | |||
| Clay | 0.226 | 0.354 | 0.330 | 0.318 | 0.345 | −0.339 | −0.069 | −0.934 | 1.000 | ||
| Silt | 0.010 | 0.225 | 0.159 | 0.241 | 0.246 | -0.182 | 0.164 | −0.959 | 0.793 | 1.000 | |
| BD | −0.118 | −0.308 | −0.254 | −0.298 | −0.309 | 0.280 | −0.076 | 0.998 | −0.932 | −0.957 | 1.000 |
Correlation matrix within each pair of soil properties across the interaction effect of impacting factors.
EC, electrical conductivity; OC, organic carbon; TN, total nitrogen; Av. p, available phosphorus; Av. K, available potassium; Ex. Na, exchangeable sodium; pH, soil reaction.
FIGURE 7
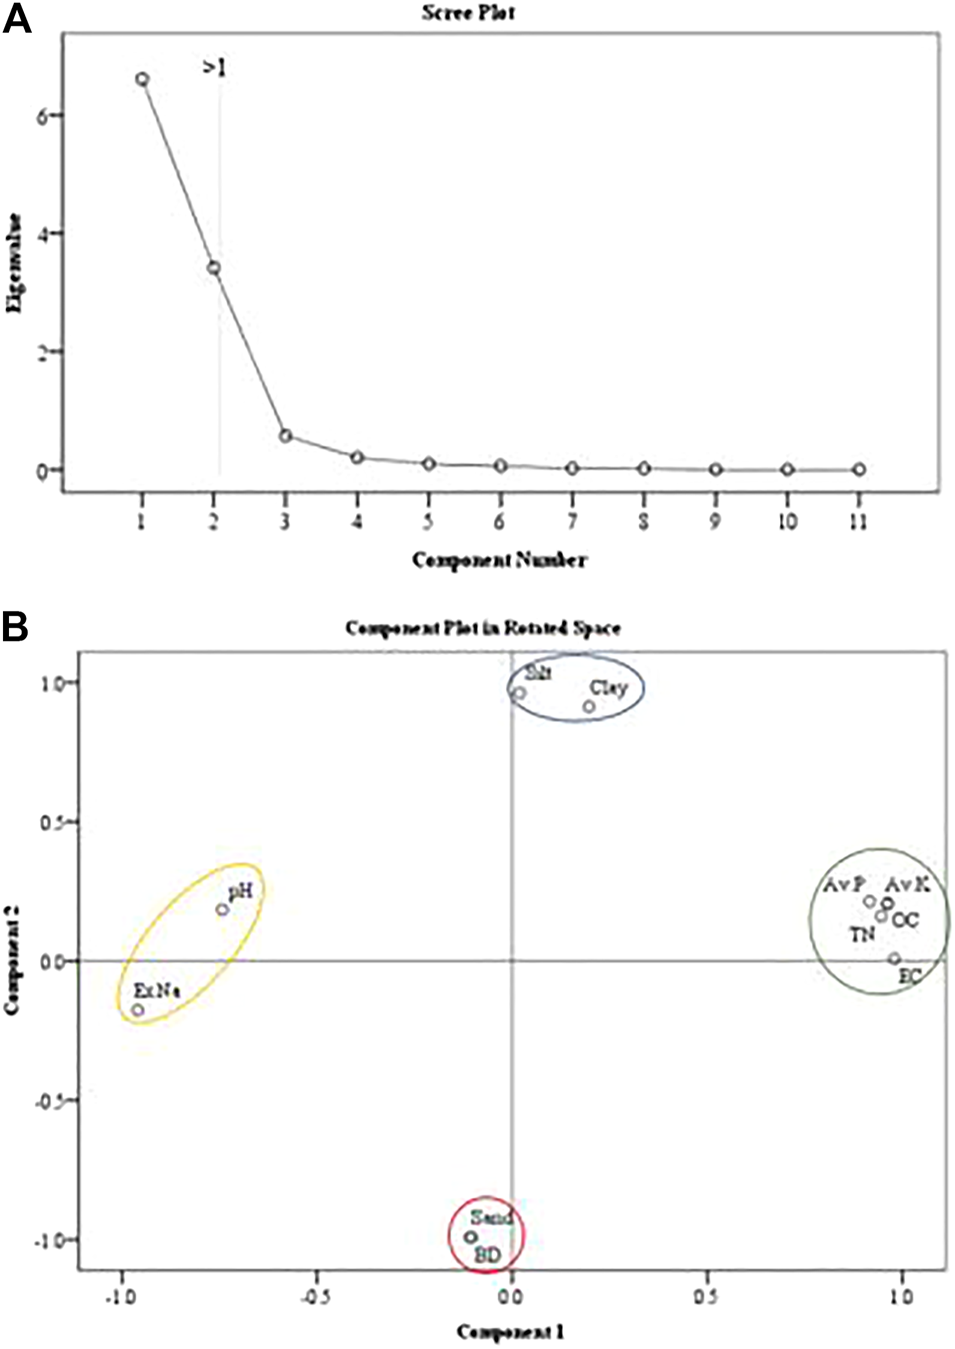
(A) Scree plot for the different components considered for the principal component analysis with eigenvalues greater than one and (B) principal component analysis (PCA) of the overall data set. OC, organic carbon; TN, total nitrogen; Av. p, available phosphorus; Av. K, available potassium; Ex. Na, exchangble sodium; BD, bulk density; EC, electrical conductivity.
Discussion
Impact of Grazing Intensity on Soil Properties
Grazing Intensity Impact on Soil Physical Properties
The Teltele rangeland site was selected because it is one of the driest parts of the Borana region and therefore the pastoral communities in this region are the most vulnerable to rangeland degradation due to overgrazing. The GI significantly affected all the soil properties that we measured. The clay and silt soil contents distribution were decreased with increasing GI and decreased SD and decreased with increasing E, while the sand soil content distribution was increased with decreasing GI and increasing E and decreased with increasing SD (Stavi et al., 2008; Larreguy et al., 2014; Yun and Wesche, 2016; Lu et al., 2017; Zhang et al., 2018). In general, in this study, grazing was associated with higher BD, increase in the sand, decreased clay and silt, decreased soil moisture, decreased diversity and coverage of grass species, and results increasing in unpalatable plant species. The result showed a positive relationship between sand and BD soil contents with GI, that is, increased while GI increasing and vice versa. This indicates the direct linkage of BD with sand content and an inverse linkage with clay and silt content and results in line with data reported by Gashaw et al. (2017), Tufa et al. (2019). In addition, the major cause for increasing of BD on the grazing site is the presence of high sand soil content distribution and higher porous spaces compared with other soil particles (Adesodun et al., 2007; Wolka et al., 2011; Chaudhari et al., 2013; Adimassu et al., 2017; Zhou et al., 2017; Paulo et al., 2018). The soil structure, moisture content, OM composition, and GI determine the soil content distribution in the grazing site (Liu et al., 2011b; Ademe et al., 2017; Tufa et al., 2019). For instance, the NG site has a better OM and moisture content and in the NG grazing level, clay and silt soil contents were observed dominantly and mainly at LE position of 10–20 cm of SD. This is due to the upper part of 0–10 cm SD, easily exposed to any livestock trampling during grazing and facilitates wind and flood erosion. This speedup water runoff and loss of soil moisture and changes to bare land, resulting in clay and silt soil particle easily eroded from the site and dominated with sand soil content (Fei et al., 2010; Zhou et al., 2010; Morteza et al., 2012; Descalzi et al., 2018). The data reported by Alemayehu and Fisseha (2018), Demelash and Karl (2010) indicated that higher clay and lower sand content was recorded at non-conserving or OG sites without any influence of the difference in E in contrast to our current result. Consequently, the linear regression analysis showed that the GI had a positive relationship with sand and BD soil contents and a negative relationship with clay and silt contents (Ademe et al., 2017).
Grazing Intensity Impact on Soil Chemical Properties
The soil chemical properties are soil management properties dependent on the soil structure, air and water conductivity, and highly influenced by grazing management. As a result, grazing significantly affected the soil chemical properties concentration found at the grazing rangeland site. At the grazing site of LE, the density of livestock was higher than that of ME and HE and had a great effect on the soil chemical properties distribution of the grazing site, even under similar GI and GLT. The soil EC was high at the NG grazing level than that in the MG and OG. The reason for the highest EC observed at the NG site mainly at HE in the soil surface of 10–20 cm is due to the high availability of OC, TN, P, and K, resulting in high cation and anion concentration, and EC is the sum of two ions (Kidane, 2006; Yan et al., 2013; Zhang et al., 2018; Guo et al., 2019). The major reason for the distribution of OC, TN, P, and K was higher in the managed area or NG area is due to the availability of higher grass biomass which results in increased availability of soil nutrients during decomposition (Hamilton and Frank, 2001; Wang et al., 2018),but when the rangeland was exposed to continuous grazing and transformed into OG degraded area, the aboveground grass biomass declined and the formation of OM was affected. The rangeland site exposed to different erosion agents like wind and water resulted in a lower distribution of OC, TN, P, and K and lead to the distribution of Na and pH become higher (Zhang et al., 2009; Chaudhari et al., 2013; Guo et al., 2019). The other possible reason for the highest EC, OC, TN, P, and K values was recorded at soil surface of 10–20 cm depth compared to the soil surface of 0–10 cm was due to high distribution of clay and silt soil particle at soil surface of 10–20 cm than 0–10 cm (Demelash and Karl, 2010; Aytenew and Kibret, 2016; Ademe et al., 2017). Those soil chemical properties had an abundance of direct linkage between them. The pH and Na showed higher values at 0–10 cm of SD across all grazing level, especially at the OG site of HE, and this was due to the high distribution of sand soil particles and a positive relationship with pH and Na (Tufa et al., 2019; Yang et al., 2016; Wolka et al., 2011). As pH increases, the availability of certain major basic cations like Na, clay, and CEC are positively correlated because clay minerals provide the negative charge to attract the cations. The variation of GLT does not show a significant effect on the soil chemical properties except with slight variation. This means the values of EC, OC, TN, P, and K showed slightly higher value at OGL compared to BE grazing site, whereas pH and Na values showed higher at BE at OGL grazing site and our result is in agreement with the data reported by Mulder et al. (2015). Further, the linear regression analysis showed that a significant negative relationship with the soil EC, OC, TN, P, and K and a positive relationship with Na and pH as GI increased, and this result supported with the data reported by Kate (2019), Hao and He (2019). Overall, grazing has shown a decreasing effect on the abundance of soil organic matter and the water-holding capacity, which leads to an increase in soil BD, sandy soil particles, and Na and pH and decrease in EC, OC, TN, P, and K; therefore, our hypothesis was accepted. Managing rangeland grazing used to protect not only the soil contents of the rangeland but also the water availability, and this research will be used as a reference and initiative for further research and aware the pastoralist community through showing how over stoking currently impacts both the rangeland soil and productivity in the Teltele rangeland, and this was the implication of our current work.
Conclusion
In the Teltele rangeland, grazing intensity strongly influenced the soil properties of the grazing rangeland. The increase in the distribution of the apparent density of the soil was mainly due to the increase in the distribution of sand soil particles and decline of sand and silt soil particle. This caused speedup of water infiltration, changes in chemical properties, and fertility of the soil and is among the major impacts of overgrazing. It can be concluded that managing the level of grazing is an essential technique used for improving arid and semi-arid rangeland areas including Teltele. Managing the grazing period and balancing the number of livestock grazed on the grazing land help reduce the grazing density and restore the soil properties, through improved vegetation cover and reduced runoff and erosion. Variation of grazing land type had less impact on the soil properties as compared with grazing intensity, elevation, and soil depth difference effect. Further, studies are needed for better understanding of seasonal management of grazing intensity for a better improvement of the grazing land soil properties and enhanced general ecosystem function of rangeland. Timely reform and balancing of carrying capacity of livestock at a certain grazing area are needed for proper rehabilitation of rangeland through providing a recovery period and for the proper implementation of the limited number of livestock and reduce grazing intensity, introduction and application of appropriate laws that is formulated by both the local communities and government official that govern the way how to use of communal grazing areas. Based on our result, we also recommend that the influence of grazing intensity should be further studied by combining GIS, remote sensing, and NDVI data to see temporal and spatial changes due to the effect of grazing and model-based data that showed a change of soil properties is more reliable in the Teltele rangeland site.
Statements
Data availability statement
The original contributions presented in the study are included in the article/Supplementary Material, further inquiries can be directed to the corresponding author.
Author contributions
YF: data collection, writing up, gap assessment and design of the experiments. XX, WD, TF, and VN: editing, proofing, laboratory assistance, provide important advice as well as supervision of the whole work.
Funding
This study received financial support from CAS-TWAS fellowship program and African Great Green Wall Adaptation Technical Cooperation Research and Demonstration (Grant No. 2018YFE0106000), Science and Technology Partnership Program, Ministry of Science and Technology of China (Grant No. KY 201702010), Integration and application of appropriate technologies for desertification control in Africa (Grant No. SAJC2021080, and International cooperation and Exchanges NSFC (Grant No. 41861144020).
Acknowledgments
The authors wish to thank the University of Chinese Academy of Science and CAS-TWAS fellowship program that provides funding and the PhD Scholarship for the first author. They also acknowledge the African Great Green Wall Adaptation Technical Cooperation Research and Demonstration (2018YFE0106000), Science and Technology Partnership Program, Ministry of Science and Technology of China (Grant Nos. KY 201702010), and International cooperation and Exchanges NSFC (Grant Nos. 41861144020) financial support to do this paper, also our great thanks go to the local community and stakeholder of the Teltele district for giving us the basic information that is still the challenge for them for our next research step. Once again, Yabello Pastoral and Dryland Agricultural Soil Research Center deserve many thanks for providing us the laboratory and other facilitates while conducting our experiment.
Conflict of interest
The authors declare that the research was conducted in the absence of any commercial or financial relationships that could be construed as a potential conflict of interest.
References
1
Abdalla M. Hastings A. Chadwick D. R. Jones D. L. Evans C. D. Jones M. B. et al (2018). Critical Review of the Impacts of Grazing Intensity on Soil Organic Carbon Storage and Other Soil Quality Indicators in Extensively Managed Grasslands. Agric. Ecosyst. Environ.253, 62–81. 10.1016/j.agee.2017.10.023
2
Ademe Y. Temesgen K. Alemayehu M. Toyiba S. (2017). Evaluation of the Effectiveness of Soil and Water Conservation Practices on Improving Selected Soil Properties in Wonago District, Southern Ethiopia. J. Soil Sci. Environ. Manage.8, 70–79. 10.5897/jssem2016.0601
3
Adesodun J. Adeyemi E. Oyegoke C. (2007). Distribution of Nutrient Elements within Water-Stable Aggregates of Two Tropical Agro-Ecological Soils under Different Land Uses. Soil Tillage Res.92, 190–197. 10.1016/j.still.2006.03.003
4
Adimassu Z. Langan S. Johnston R. Mekuria W. Amede T. (2017). Impacts of Soil and Water Conservation Practices on Crop Yield, Run-Off, Soil Loss and Nutrient Loss in Ethiopia: Review and Synthesis. Environ. Manage.59, 87–101. 10.1007/s00267-016-0776-1
5
Alemayehu T. Fisseha G. (2018). Effects of Soil and Water Conservation Practices on Selected Soil Physico-Chemical Properties in Debre-Yakob Micro-watershed, Northwest Ethiopia. Eth J. Sci. Technol.11, 29–38. 10.4314/ejst.v11i1.3
6
Ayalew A. (2011). Construction of Soil Conservation Structures for Improvement of Crops and Soil Productivity in the Southern Ethiopia. J. Environ. Earth Sci.1, 21–29.
7
Aynekulu E. Mekuria W. Tsegaye D. Feyissa K. Angassa A. De leeuw J. et al (2017). Long-term Livestock Exclosure Did Not Affect Soil Carbon in Southern Ethiopian Rangelands. Geoderma307, 1–7. 10.1016/j.geoderma.2017.07.030
8
Aytenew M. Kibret K. (2016). Assessment of Soil Fertility Status at Dawja Watershed in Enebse Sar Midir District, Northwestern Ethiopia. Ijpss11, 1–13. 10.9734/ijpss/2016/21646
9
Billi P. Alemu Y. T. Ciampalini R. (2015). Increased Frequency of Flash Floods in Dire Dawa, Ethiopia: Change in Rainfall Intensity or Human Impact?Nat. Hazards76 (2), 1373–1394. 10.1007/s11069-014-1554-0
10
Chaudhari P. R. Ahire D. V. Ahire V. D. Chkravarty M. Maity S. (2013). Soil Bulk Density as Related to Soil Texture, Organic Matter Content and Available Total Nutrients of Coimbatore Soil. Int. J. Sci. Res. Publ.3, 1–8.
11
Chen W. Huang D. Liu N. Zhang Y. Badgery W. B. Wang X. et al (2015). Improved Grazing Management May Increase Soil Carbon Sequestration in Temperate Steppe. Scientific Rep.5, 10892. 10.1038/srep10892
12
Coppock D. L. Scarnecchia D.L. , (1994). The Borana Plateau of Southern Ethiopia: Synthesis of Pastoral Research, Development and Change. J. Range Management.48(6):566. 10.2307/4003073
13
Dalle G. Maass B. L. Isselstein J. (2015). Rangeland Condition and Trend in the Semi-arid Borana Lowlands, Southern Oromia, Ethiopia. Afr. J. Range Forage Sci.23 (1), 49–58. 10.2989/10220110609485886
14
Demelash M. Karl S. (2010). Assessment of Integrated Soil and Water Conservation Measures on Key Soil Properties in South Gonder, North-Western Highlands of Ethiopia. J. Soil Sci. Environ. Manage.1, 164–176.
15
Derner J. D. Boutton T. W. Briske D. D. (2006). Grazing and Ecosystem Carbon Storage in the North American Great Plains. Plant and Soil280 (1-2), 77–90. 10.1007/s11104-005-2554-3
16
Descalzi C. Balocchi O. López I. Kemp P. Dörner L. (2018). Different Soil Structure and Water Conditions Affect the Growing Response of Lolium Perenne L. And Bromus Valdivianus Phil. Growing Alone or in Mixture. J. Soil Sci. Plant Nutr.18 (3), 617–635. 10.4067/s0718-95162018005001901
17
Dessalegn C. D. Christian D. G. Assefa D. Z. Tigist Y. T. Menelik G. Solomon A. et al (2015). Impact of Conservation Practices on Runoff and Soil Loss in the Sub-humid Ethiopian Highlands: the Debre Mawi Watershed. J. Hydrol. Hydromechanics.63, 210–219. 10.1515/johh-2015-0021
18
Fei P. Tao W. Xian X. Fang Z. (2010). Soil and Plant Responses to Degradation of Alpine Grassland in Source Region of the Yellow River. Sci. Cold Arid Regions2 (4), 0364–0370. 10.1016/j.proenv.2010.01.090
19
Fenetahun Y. Wang Y. D. You Y. Xu X. (2020). Dynamics of Forage and Land Cover Changes in Teltele District of Borana Rangelands, Southern Ethiopia: Using Geospatial and Field Survey Data. BMC Ecol.20, 55. 10.1186/s12898-020-00320-8
20
Fenetahun Y. Yuan Y. Xinwen X. Yongdong W. (2021). Effects of Grazing Enclosures on Species Diversity, Phenology, Biomass, and Carrying Capacity in Borana Rangeland, Southern Ethiopia. Front. Ecol. Evol.8, 623627. 10.3389/fevo.2020.623627
21
Gashaw T. Taffa T. Mekuria A. (2017). Erosion Risk Assessment for Prioritization of Conservation Measures in Geleda Watershed, Blue Nile Basin, Ethiopia. Environ. Syst. Res.6, 1–14. 10.1186/s40068-016-0078-x
22
Gemedo D. Maass B. L. Isselstein J. (2005). Plant Communities and Their Species Diversity in the Semi-arid Rangelands of Borana Lowlands, Southern Oromia, Ethiopia. Community Ecol.6 (2), 167–176. 10.1556/comec.6.2005.2.5
23
Guo X. Chen L. Zheng R. Zhang K. Qiu Y. Yue H. (2019). Differences in Soil Nitrogen Availability and Transformation in Relation to Land Use in the Napahai Wetland, Southwest China. J. Soil Sci. Plant Nutr.19, 92–97. 10.1007/s42729-019-0013-0
24
Hafner S. Unteregelsbacher S. Seeber E. Lena B. Xu X. Li X. et al (2012). Effect of Grazing on Carbon Stocks and Assimilate Partitioning in a Tibetan Montane Pasture Revealed by 13CO2 Pulse Labeling. Glob. Change Biol.18 (2), 528–538. 10.1111/j.1365-2486.2011.02557.x
25
Hailu T. Mekuria A. Lulseged T. Kindu M. John R. Dawit S. (2020). Effects of Sustainable Land Management Interventions on Selected Soil Properties in Geda Watershed, Central Highlands of Ethiopia. Ecol. Process.9, 14. 10.1186/s13717-020-0216-2
26
Haldar A. Sakar D. (2005). Physical and Chemical Method in Soil Analysis: Fundamental Concepts of Analytical Chemistry and Instrumental Techniques. New Delhi: New Age International (P) Ltd. 10.1145/1065907.1066039
27
Hamilton E. W. Frank D. A. (2001). Can Plants Stimulate Soil Microbes and Their Own Nutrient Supply? Evidence from a Grazing Tolerant Grass. Ecology82, 2397–2402. 10.1890/0012-9658(2001)082[2397:cpssma]2.0.co;2
28
Hao Y. He Z. (2019). Effects of Grazing Patterns on Grassland Biomass and Soil Environments in China: A Meta-Analysis. PLoS ONE14 (4), e0215223. 10.1371/journal.pone.0215223
29
Hardy M. B. Mentis M. T. (1986). Grazing Dynamics in Sour Grassveld. S. Afr. J. Sci.82, 566–572.
30
Hishe S. Lyimo J. Bewket W. (2017). Soil and Water Conservation Effects on Soil Properties in the Middle Silluh Valley, Northern Ethiopia. Int. Soil Water Conservation Res.5, 231–240. 10.1016/j.iswcr.2017.06.005
31
IPCC (2013). Climate Change 2013-The Physical Science Basis: Working Group I Contribution to the Fifth Assessment Report of the Intergovernmental Panel on Climate Change. Cambridge University Press. 10.1017/CBO9781107415324
32
Kane D. (2015). Carbon Sequestration Potential on Agricultural Lands: A Review of Current Science and Available practicesAssociation with: National Sustainable Agriculture Coalition Breakthrough Strategies and Solutions. Washington, DC, United States: LLC.
33
Kate K. (2019). in Sustainable International Agriculture Specialization in Tropical Agriculture Faculty of Agricultural Sciences Institute of Grassland Science (Georg-August-Universität- Göttingen, Germany). Model-Based Assessment of Grazing Impact on Soil Organic Carbon Stocks and Dynamics of a Kenyan. Rangeland. M.Sc. Thesis. Nairobi-Kenya.
34
Kidane G. (2006). Rangeland Potential, Quality and Restoration Strategies in North-Eastern Ethiopia: a Case Study Conducted in the Southern Afar Region. Dissertation Submitted in Partial Fulfillment of the Requirements for the Degree Doctor of Philosophy at the University of Stellenbosch.
35
Larreguy C. Carrera A. L. Bertiller M. B. (2014). Effects of Long-Term Grazing Disturbance on the Belowground Storage of Organic Carbon in the Patagonian Monte, Argentina. J. Environ. Manage.134, 47–55. 10.1016/j.jenvman.2013.12.024
36
Lin Y. Hong M. Han G. Zhao M. Bai Y. Chang S. X. (2010). Grazing Intensity Affected Spatial Patterns of Vegetation and Soil Fertility in a Desert Steppe. Agric. Ecosyst. Environ.138, 282–292. 10.1016/j.agee.2010.05.013
37
Liu T. Nan Z. Hou F. (2011b). Grazing Intensity Effects on Soil Nitrogen Mineralization in Semi-arid Grassland on the Loess Plateau of Northern China. Nutr. Cycl Agroecosyst91, 67–75. 10.1007/s10705-011-9445-1
38
Lu X. Kelsey K. C. Yan Y. Sun J. Wang X. Cheng G. et al (2017). Effects of Grazing on Ecosystem Structure and Function of Alpine Grasslands in Qinghai-Tibetan Plateau: a Synthesis. Ecosphere8. 10.1002/ecs2.1656
39
Masebo N. Abdellkadir A. Mohammed A. (2014). Evaluating the Effect of Agroforestry-Based Soil and Water Conservation Measures on Selected Soil Properties at Tembaro District, SNNPR, Ethiopia. Direct Res. J. Agric. Food Sci.2, 141–146.
40
Mekuria W. Menale W. Tadele A. Asmare W. Tesfaye F. Birru Y. (2018). Restoration of Degraded Landscapes for Ecosystem Services in North-Western Ethiopia. Heliyon4, e00764. 10.1016/j.heliyon.2018.e00764
41
Miles N. Farina M. (2013). Soil Acidity and its Management in Crop Production, Available from http://www.grainsa.co. 10.4324/9781315024653
42
Morteza M. Mehdi R. Hassan A. Ali E. Esmaeil S. Javad M. (2012). Impact of Grazing on Chemical, Physical and Biological Properties of Soils in the Mountain Rangelands of Sahand, Iran. Rangeland J.34, 297–303. 10.1071/RJ11087
43
Motsara N. R. Roy R. N. (2008). Guide to Laboratory Establishment for Plant Nutrient analysisFAO Fertilizer and Plant Nutrition Bulletin. United Nations: Food and agriculture organization.
44
Mulder V. L. Lacoste M. Martin M. P. Richer‐de‐Forges A. Arrouays D. (2015). Understanding Large‐extent Controls of Soil Organic Carbon Storage in Relation to Soil Depth and Soil‐landscape Systems. Glob. Biogeochem. Cycles29 (8), 1210–1229. 10.1002/2015gb005178
45
Paulo R. Paulo H. R. Luiz F. M. Felipe V. A. Eduardo S. M. (2018). Distribution of C and Inorganic Phosphorus Fractions in Different Aggregate Sizes under Forestry, Agroforestry System and Pasture. J. Soil Sci. Plant Nutr.18 (2), 361–375. 10.4067/S0718-95162018005001202
46
Pellant M. Shaver P. Pyke D. Herrick J. (2000). Interpreting Indicators of Rangeland Health. available at: ftp://ftp.ftw.nrcs.usda.gov/pub/glti/IntIndRangeHealth.pdf.Version 3. Technical Reference 1734–1736,
47
Piñeiro G. Paruelo J. M. Oesterheld M. Jobbágy E. G. (2010). Pathways of Grazing Effects on Soil Organic Carbon and Nitrogen. Rangeland Ecol. Management63 (1), 109–119. 10.2111/08-255.1
48
Raj K. (2005). The Impact of Rangeland Condition and Trend to the Grazing Resources of a Semi-arid Environment in Kenya. J. Hum. Ecol.17 (2), 143–147. 10.1080/09709274.2005.11905769
49
Solomon T. Snyman H. A. Smit G. N. (2007). Rangeland Dynamics in Southern Ethiopia: (1) Botanical Composition of Grasses and Soil Characteristics in Relation to Land-Use and Distance from Water in Semi-arid Borana Rangelands. J. Environ. Manage.85, 429–442. 10.1016/j.jenvman.2006.10.007
50
Stavi I. Ungar E. D. Lavee H. Sarah P. (2008). Grazing-induced Spatial Variability of Soil Bulk Density and Content of Moisture, Organic Carbon and Calcium Carbonate in a Semi-arid Rangeland. Catena75, 288–296. 10.1016/j.catena.2008.07.007
51
Su Y. Z. Li Y. L. Zhao H. L. (2006). Soil Properties and Their Spatial Pattern in a Degraded Sandy Grassland under Post-grazing Restoration, Inner Mongolia, Northern China. Biogeochemistry79, 297–314. 10.1007/s10533-005-5273-1
52
Tufa M. Melese A. Tena W. (2019). Effects of Land Use Types on Selected Soil Physical and Chemical Properties: The Case of Kuyu District, Ethiopia. Eur. J. Soil Sci.8, 94–109. 10.18393/ejss.510744
53
United States Environmental Protection Agency (2002). Guidance on Choosing a Sampling Design for Environmental Data Collection. Washington, DC: Office of Environmental Information, 20460.
54
Van der Waal B. (2009). The Influence of Acacia Mearnsii Invasion on Soil Properties in the Kouga Mountains, Eastern Cape, South Africa. Master’s Thesis. Grahamstown: Rhodes University. Online.
55
Van Reeuwijk L. P. (2002). Procedures for Soil Analysis. International Soil Reference and Information Center. Technical paper 96th edn. 10.1145/583810.583831
56
Walkeley A. Black C. A. (1934). An Examination of Degtjareff Method for Determining Soil Organic Matter and Proposed Modification of the Chromic Acid Titration Method. Soil Sci.37, 29–38. 10.1097/00010694-193401000-00003
57
Wang L. Gan Y. Wiesmeier M. (2018). Grazing Exclusion. An Effective Approach for Naturally Restoring Degraded Grasslands in Northern China. L China. Land Degrad. Dev.1-18. 10.1002/ldr.3191
58
Wang Z. Johnson D. A. Rong Y. Wang K. (2016). Grazing Effects on Soil Characteristics and Vegetation of Grassland in Northern China. Solid Earth7, 55–65. 10.5194/se-7-55-2016
59
Wilke B. M. (2005). “Determination of Physical and Chemical Soil Properties,” in Manual of Soil Analysis: Monitoring and Assessing Soil Bioremediation (3). Editors MargesinR.SchinnerF. (Berlin: Springer-Verlag).
60
Wolka K. Moges A. Yimer F. (2011). Effects of Level Soil Bunds and Stone Bunds on Soil Properties and its Implications for Crop Production: the Case of Bokole Watershed, Dawuro Zone, Southern Ethiopia. As02, 357–363. 10.4236/as.2011.23047
61
Yan L. Zhou G. Zhang F. (2013). Effects of Different Grazing Intensities on Grassland Production in China: a Meta-Analysis. PLoS ONE8 (12), 1466–1475. 10.1371/journal.pone.0081466
62
Yang Y. H. Luo Y. Q. (2011). Isometric Biomass Partitioning Pattern in Forest Ecosystems: Evidence from Temporal Observations during Stand Development. J. Ecol.99, 431–437. 10.1111/j.1365-2745.2010.01774.x
63
Yang Z. Xiong W. Xu Y. Jiang L. Zhu E. Zhan W. et al (2016). Soil Properties and Species Composition under Different Grazing Intensity in an Alpine Meadow on the Eastern Tibetan Plateau, China. Environ. Monit. Assess.188, 678–688. 10.1007/s10661-016-5663-y
64
Yigini Y. Panagos P. (2016). Assessment of Soil Organic Carbon Stocks under Future Climate and Land Cover Changes in Europe. Sci. Total Environ.557-558, 838–850. 10.1016/j.scitotenv.2016.03.085
65
Yun W. Wesche K. (2016). Vegetation and Soil Responses to Livestock Grazing in Central Asian Grasslands: a Review of Chinese Literature. Biodivers Conserv25 (12), 2401–2240. 10.1007/s10531-015-1034-1
66
Zhang H. Xu M. Zhang W. He X. (2009). Factors Affecting Potassium Fixation in Seven Soils under 15-year Long-Term Fertilization. Sci. Bull.54, 1773–1780. 10.1007/s11434-009-0164-9
67
Zhang X. Liu M. Zhao X. Li Y. Zhao W. Li A. et al (2018). Topography and Grazing Effects on Storage of Soil Organic Carbon and Nitrogen in the Northern China Grasslands. Ecol. Indicators93, 45–53. 10.1016/j.ecolind.2018.04.068
68
Zhao Y. Peth S. Hallett P. Wang X. Giese M. Gao Y. et al (2011). Factors Controlling the Spatial Patterns of Soil Moisture in a Grazed Semi-arid Steppe Investigated by Multivariate Geostatistics. Ecohydrol.4, 36–48. 10.1002/eco.121
69
Zhou G. Zhou X. He Y. Shao J. Hu Z. Liu R. et al (2017). Grazing Intensity Significantly Affects Belowground Carbon and Nitrogen Cycling in Grassland Ecosystems: a Meta-Analysis. Glob. Change Biol.23, 1167–1179. 10.1111/gcb.13431
70
Zhou Z. C. Gan Z. T. Shangguan Z. P. Dong Z. B. (2010). Effects of Grazing on Soil Physical Properties and Soil Erodibility in Semiarid Grassland of the Northern Loess Plateau (China). Catena82, 87–91. 10.1016/j.catena.2010.05.005
71
Zhu L. Johnson D. A. Wang W. Ma L. Rong Y. (2015). Grazing Effects on Carbon Fluxes in a Northern China Grassland. J. Arid Environments114, 41–48. 10.1016/j.jaridenv.2014.11.004
Summary
Keywords
stocking rate, soil depth, elevation, soil indicators, management practice 2
Citation
Fenetahun Y, Yuan Y, Xinwen X, Fentahun T, Nzabarinda V and Yong-dong W (2021) Impact of Grazing Intensity on Soil Properties in Teltele Rangeland, Ethiopia. Front. Environ. Sci. 9:664104. doi: 10.3389/fenvs.2021.664104
Received
02 March 2021
Accepted
09 April 2021
Published
04 May 2021
Volume
9 - 2021
Edited by
Rosa Francaviglia, Council for Agricultural and Economics Research, Italy
Reviewed by
Jian Sun, Institute of Tibetan Plateau Research, China
Manuel Pulido Fernández, University of Extremadura, Spain
Updates
Copyright
© 2021 Fenetahun, Yuan, Xinwen, Fentahun, Nzabarinda and Yong-dong.
This is an open-access article distributed under the terms of the Creative Commons Attribution License (CC BY). The use, distribution or reproduction in other forums is permitted, provided the original author(s) and the copyright owner(s) are credited and that the original publication in this journal is cited, in accordance with accepted academic practice. No use, distribution or reproduction is permitted which does not comply with these terms.
*Correspondence: Wang Yong-dong, wangyd@ms.xjb.ac.cn
This article was submitted to Soil Processes, a section of the journal Frontiers in Environmental Science
Disclaimer
All claims expressed in this article are solely those of the authors and do not necessarily represent those of their affiliated organizations, or those of the publisher, the editors and the reviewers. Any product that may be evaluated in this article or claim that may be made by its manufacturer is not guaranteed or endorsed by the publisher.