 Richard J. Boothroyd
 Michael Nones
 Massimo Guerrero
94% of researchers rate our articles as excellent or good
Learn more about the work of our research integrity team to safeguard the quality of each article we publish.
Find out more
ORIGINAL RESEARCH article
Front. Environ. Sci., 04 May 2021
Sec. Freshwater Science
Volume 9 - 2021 | https://doi.org/10.3389/fenvs.2021.657354
This article is part of the Research TopicRivers, Science, and Society: The Role of Numerical Models, Remote-Sensing, and Citizen-Science in Flood Risk ManagementView all 4 articles
With the increasing availability of big geospatial data (e.g., multi-spectral satellite imagery) and access to platforms that support multi-temporal analyses (e.g., cloud-based computing, Geographical Information Systems, GIS), the use of remotely sensed information for monitoring riverine hydro-morpho-biodynamics is growing. Opportunities to map, quantify and detect changes in the wider riverscape (i.e., water, sediment and vegetation) at an unprecedented spatiotemporal resolution can support flood risk and river management applications. Focusing on a reach of the Po River (Italy), satellite imagery from Landsat 5, 7, and 8 for the period 1988–2018 were analyzed in Google Earth Engine (GEE) to investigate changes in river planform morphology and vegetation dynamics associated with transient hydrology. An improved understanding of these correlations can help in managing sediment transport and riparian vegetation to reduce flood risk, where biogeomorphic processes are commonly overlooked in flood risk mapping. In the study, two established indices were analyzed: the Modified Normalized Difference Water Index (MNDWI) for monitoring changes in the wetted river planform morphology, inferring information about sediment dynamics, and the Normalized Difference Vegetation Index (NDVI) for evaluating changes in vegetation coverage. Results suggest that planform changes are highly localized with most parts of the reach remaining stable. Using the wetted channel occurrence as a measure of planform stability, almost two-thirds of the wetted channel extent (total area = 86.4 km2) had an occurrence frequency >90% (indicating stability). A loss of planform complexity coincided with the position of former secondary channels, or zones where the active river channel had narrowed. Time series analysis of vegetation dynamics showed that NDVI maxima were recorded in May/June and coincided with the first peak in the hydrological regime (occurring in late spring and associated with snowmelt). Seasonal variation in vegetation coverage is potentially important for local hydrodynamics, influencing flood risk. We suggest that remotely sensed information can provide river scientists with new insights to support the management of highly anthropized watercourses.
Floods are a recognized hazard having both direct and indirect effects on the global economy (Hallegatte et al., 2013; Nones, 2015). During flooding conditions, high-velocity flows cause damages to infrastructure and increased erosion of floodplains and bank channels, resulting in declining water quality and ecosystem health. While direct costs associated with structural damages are relatively easy to calculate, indirect costs associated with declining ecosystem services are rarely quantified. To overcome such limitations, recent studies have indicated the need to develop future integrative catchment plans that account for the presence of vegetation and sediment in reducing the potentially deleterious effects of flooding on in-channel water quality (Croke et al., 2017; Nones et al., 2017). Shifts in sediment flux and/or vegetation may have a substantial role in controlling both flood hazard frequency (Slater et al., 2016) and water quality, but geomorphological processes are commonly overlooked in flood risk mapping (Lane et al., 2007). Understanding the spatiotemporal distribution of these surface characteristics (sediment and vegetation) is therefore essential for developing more reliable numerical models (Straatsma and Baptist, 2008).
Alluvial river channels are dynamic systems with erodible boundaries, self-adjusting to changes of water discharge and sediment flux supplied from upstream (e.g., Leopold and Maddock, 1953; Yalin, 1992; Nones and Di Silvio, 2016; Slater, 2016; Slater et al., 2019). Because a flood starts when water levels in the main channels are sufficient to exceed the bank height, flood risk is locally driven by changes in river channel stage, which may be driven by changes in both flow magnitude and river channel conveyance (Stover and Montgomery, 2001; Neuhold et al., 2009; Merz et al., 2012), especially when considering a series of repeated floods instead of a single event (Guan et al., 2016). If changes in flood magnitude and frequency is influenced by natural and human-driven changes (e.g., Doocy et al., 2013), variations in river channel conveyance can be due to changes in channel morphology (Slater and Singer, 2013; Slater et al., 2015; Nones, 2019).
Flood risk studies are typically associated with extreme hydrological events, assuming only clear water and non-erodible channels in implementing numerical codes to prepare flood risk management plans (Villarini and Smith, 2010; Alfieri et al., 2014; Nied et al., 2017). However, geomorphic processes and anthropogenic alterations of the topography (Costabile and Macchione, 2015) can mediate and increase the impacts of extreme events (Bohorquez and del Moral-Erencia, 2017). Moreover, management practices can change the catchment flow regime, determining the geomorphological behavior and response to flooding (Wheater and Evans, 2009), especially along floodplains that are subjected to cyclical erosion and deposition processes. As shown by Sofia and Nikolopoulos (2020), ignoring the interdependencies of flood driver and channel morphology implicitly promotes a simplified view of the challenges inherent to flood management. For this reason, additional effort is needed to integrate river morphology and vegetation coverage in the evaluation of flood risk, to better understand how the connections between channel conveyance and other flood-drivers look under different boundary conditions, such as climate, water and sediment characteristics, and in response to natural and anthropogenic alterations. Accounting for these connections in planning future flood risk management strategies could be beneficial, as recent studies have demonstrated (e.g., Bohorquez and del Moral-Erencia, 2017; Sofia et al., 2017).
Vegetation can control river form and morphodynamics (Gurnell, 2014; Gurnell and Bertoldi, 2020), mean and turbulent flow fields (Nepf, 2012a) and sediment dynamics (Corenblit et al., 2009). From a flood risk perspective, vegetation extracts energy from open channel flows through the process of drag, adding additional local and boundary flow resistance, modifying flow velocity and reducing channel conveyance (Kouwen et al., 1969; Järvelä, 2002; Nepf et al., 2007). In compound channels, increased flow resistance produces higher water levels per unit discharge due to continuity constraints (Petryk and Bosmajian, 1975). Vegetative flow resistance has been investigated across multiple spatial scales, including the sub-plant (e.g., Västilä and Järvelä, 2014), plant (e.g., Boothroyd et al., 2017), patch (e.g., Marjoribanks et al., 2017) and reach scale (e.g., Clark et al., 2020); where the magnitude of energy losses depend on plant mechanical and morphological properties, such as seasonality, foliage, vegetation density, and patchiness (Shields et al., 2017). At the reach scale, in-channel and riparian vegetation is rarely distributed uniformly, so the extent and spatial distribution of vegetation are fundamental in setting reach scale flow resistance (Darby, 1999; Nepf, 2012b). Temporally, seasonal changes in plant morphological properties modify local hydrodynamic flow structures and the drag response (e.g., Cotton et al., 2006; Caroppi et al., 2019), and flow disturbance from transient hydrology (i.e., floods) can transform vegetation coverage through the erosion of vegetation and fine sediment (e.g., Bertoldi et al., 2011; Henshaw et al., 2013; Gurnell, 2016). A correct understanding of the spatiotemporal distribution of vegetation is therefore essential for effective river management, particularly in support of flood risk modeling (Vermuyten et al., 2020).
Remote sensing opportunities to map and quantify the wider riverscape (i.e., water, sediment and vegetation) at an unprecedented spatiotemporal resolution can support fluvial geomorphology, riparian vegetation and flood risk management applications (Dufour et al., 2019; Boothroyd et al., 2021a). Viewing the river corridor as an inseparable unit consisting of river channels, fluvial deposits, riparian zones and floodplains (Harvey and Gooseff, 2015), remotely sensed data can reveal fluvial dynamics and support bio-geomorphological applications (Henshaw et al., 2013). Google Earth Engine (GEE), a cloud-based computing platform for planetary-scale geospatial analyses, offers access to petabytes worth of remotely sensed Earth observation data (Gorelick et al., 2017), enabling meaningful geomorphological analyses at higher spatial resolutions, over greater spatial extents and at finer temporal resolutions than ever before (Vos et al., 2019; Boothroyd et al., 2021a). For monitoring river planform dynamics, GEE has been used to map the wetted parts of river channels (e.g., Tobón-Marín and Cañón Barriga, 2020) and the active parts of river channels (including unvegetated gravel bars, e.g., Boothroyd et al., 2021a; Vercruysse and Grabowski, 2021). Relevant to flood risk management, recent applications of GEE include the integration of Synthetic Aperture Radar (SAR) imagery with optical satellite imagery (e.g., Landsat collections) for event-scale flood detection and monitoring (e.g., DeVries et al., 2020), through to nationwide mapping of flood risk index (e.g., Phongsapan et al., 2019). To date, GEE has not been used to assess the role of sediment and vegetation on channel conveyance.
Focusing on an anthropogenically modified reach of the Po River (Italy) for the observation period 1988–2018, we assess spatiotemporal changes in wetted river planform morphology and vegetation coverage associated with transient hydrology. Located in the Pianura Padana (one of the most industrialized areas of Italy), the reach of the Po River is socially and economically important. The flood-prone area is protected from frequent inundations by a complex system of embankments and other hydraulic structures (Domeneghetti et al., 2015) and the embanked floodplains are used for agricultural purposes (Domeneghetti et al., 2014). Practical tools that support flood risk and river management applications are needed in this area. Using freely available multi-temporal satellite imagery, we leverage the cloud-based computing platform Google Earth Engine to evaluate changes in planform morphology and vegetation coverage that are relevant to these challenges. The aims of the study are threefold, namely:
(1) Identify inter-annual changes in river planform morphology.
(2) Identify intra-annual and annual changes in vegetation coverage for (i) the main levee and, (ii) mid-channel bars.
(3) Interpret changes in channel conveyance that are relevant for flood risk.
The Po River is the longest watercourse in Italy, flowing eastward across northern Italy for around 660 km and draining a catchment area of approximately 74,700 km2 (Figure 1). The middle and lower portions of the Po River are subjected to high flood-hazard and have been heavily impacted by anthropogenic interventions (Domeneghetti et al., 2015). Reaches have been artificially straightened by levees, modifying the planform configuration, with extensive longitudinal bank protection works altering the lateral sediment exchange (Lanzoni et al., 2015). Degradation has been exacerbated by the construction of dams and groynes (Maselli et al., 2018), as well as large-scale sediment excavation activities in the period 1960–1990 (Lamberti and Schippa, 1994). The morphological consequence of anthropogenic activities includes channel deepening and the loss of channel pattern complexity (Castiglioni et al., 1999; Marchetti, 2002; Guerrero et al., 2013). A reduction in anthropogenic pressures over the last two decades has resulted in a shift toward quasi-equilibrium sediment conditions, whereby eroded and deposited volumes of sediment tend to be approximately equal (Lanzoni et al., 2015).

FIGURE 1. Location map of the Po River catchment, major stream network (drainage area > 1,000 km2), study reach and gauging stations used for hydrological analysis. Topographic data from NASADEM (30 m spatial resolution).
We focus on a ∼130 km reach of the Po River between Boretto and Pontelagoscuro (lower Po River, Figure 1). A region of interest (ROI) that defined the area of the river normally occupied by high water flow (i.e., within the main levees) was digitized from Google Earth 2019 imagery (175 km2; Figure 2A). Within the study reach, the channel is mainly single-threaded with a straight to meandering channel pattern. Point bars, mid-channel bars and chute channels are the most common geomorphic units. The largest mid-channel bars (>0.1 km2) were digitized from Google Earth 2019 imagery (n = 14; total area = 6.1 km2). In the studied section, the alluvial bed is composed of well-sorted coarse sand with a median size D50 = 0.4 mm and sorting of 1.2 ϕ (Guerrero et al., 2013), while finer sediment can be found at the river delta (Maselli et al., 2020; Nones et al., 2020a). Repeat imagery from a time-lapse camera located within the ROI and positioned toward a vegetated sandbar (upstream of the Boschina Island, Ostiglia; Figures 2B,C) has indicated the contribution of the transient hydrology on the river morphodynamics and vegetation growth patterns (Nones et al., 2018; Nones et al., 2020b).
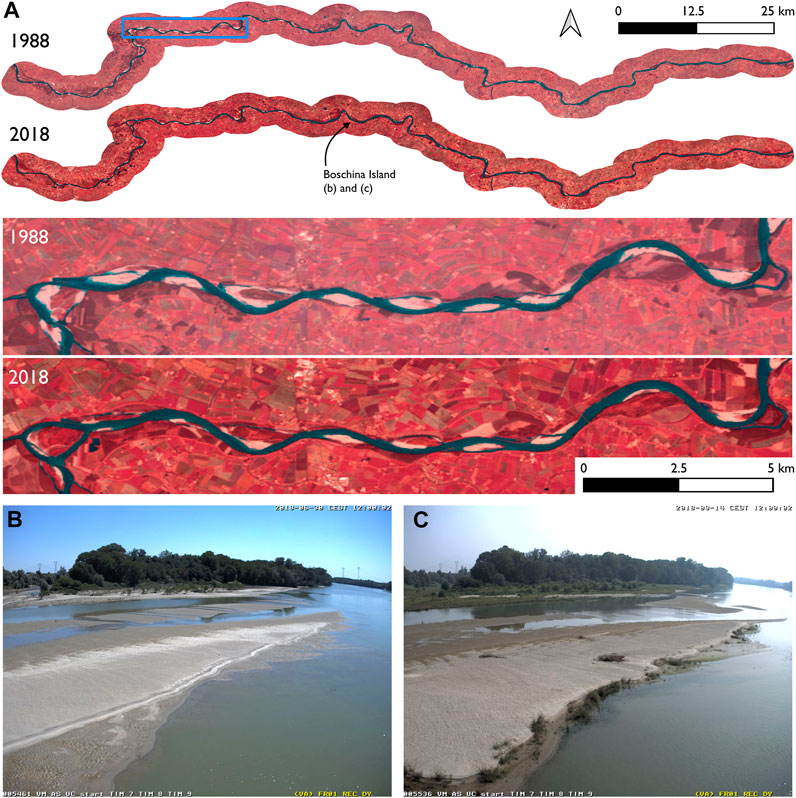
FIGURE 2. (A) False color temporal composite imagery (Landsat bands: shortwave infrared, red and green) for the ∼130 km study reach between Boretto and Pontelagoscuro in 1988 and 2018. Closer view of the blue rectangle is highlighted below. Flow direction is from west to east. Photos taken with a fixed camera Nones et al. (2018) looking downstream toward the Boschina Island, Ostiglia (45°03′12.8″N 11°08′15.1″E): (B) vegetated minima on June 30, 2018, and (C) vegetated maxima on September 14, 2018.
Google Earth Engine was used to extract information on river planform morphology and vegetation coverage from multi-temporal, multi-spectral satellite imagery. Landsat surface reflectance products (Landsat 5 Thematic Mapper, Landsat 7 Enhanced Thematic Mapper and Landsat 8 Operational Land Imager) were selected as the primary source of satellite imagery. Available through the GEE data catalog (https://developers.google.com/earth-engine/datasets/catalog), the surface reflectance products have been atmospherically corrected, facilitating a more reliable comparison of spectral reflectance measurements between acquisitions. With a nearly continuous coverage of satellite imagery for the analysis period (1988–2018), temporal revisit times spanning between 9 and 17 days (Drusch et al., 2012) and most spectral bands having a spatial resolution of 30 m, Landsat products are suitable for assessing spatiotemporal changes in river planform morphology and vegetation coverage along the study reach of the Po River.
The GEE workflow to indicate changes in river planform morphology is summarized in Figure 3 (example GEE code available here: https://code.earthengine.google.com/1d1cc675904221567886f2e91b21d87d). A region of interest for the Po River main levee was first defined (Figure 3A; 175 km2). Date ranges were specified (e.g., 01 January 1988 to 01 January 1989) and time filters were applied to select all available Landsat surface reflectance imagery for one-year time periods. For each calendar year (1988–2018), available Landsat imagery was collated into annual image collections (Figure 3B). The CFmask algorithm that is based on pixel quality assessment was applied to each image in the collection to mask obstructions from cloud and cloud shadow pixels (Figure 3C; Foga et al., 2017). To generate a single image from several images contained within the annual image collection, a median reducer was applied to aggregate all spatially overlapping non-cloud pixels, generating a temporal composite (Figure 3D). Calculated pixel-wide, the output from the median reducer is the median value of all the input images at that location, calculated independently for each spectral band. The output represents an “average” or composite multi-spectral image for each calendar year. Different multi-spectral indices support highly differentiated fluvial geomorphology applications (Spada et al., 2018); here we selected an established multi-spectral index to map surface water and indicate the wetted channel position. The modified normalized difference water index, MNDWI (Xu, 2006) produced 30 m resolution water maps following:
where
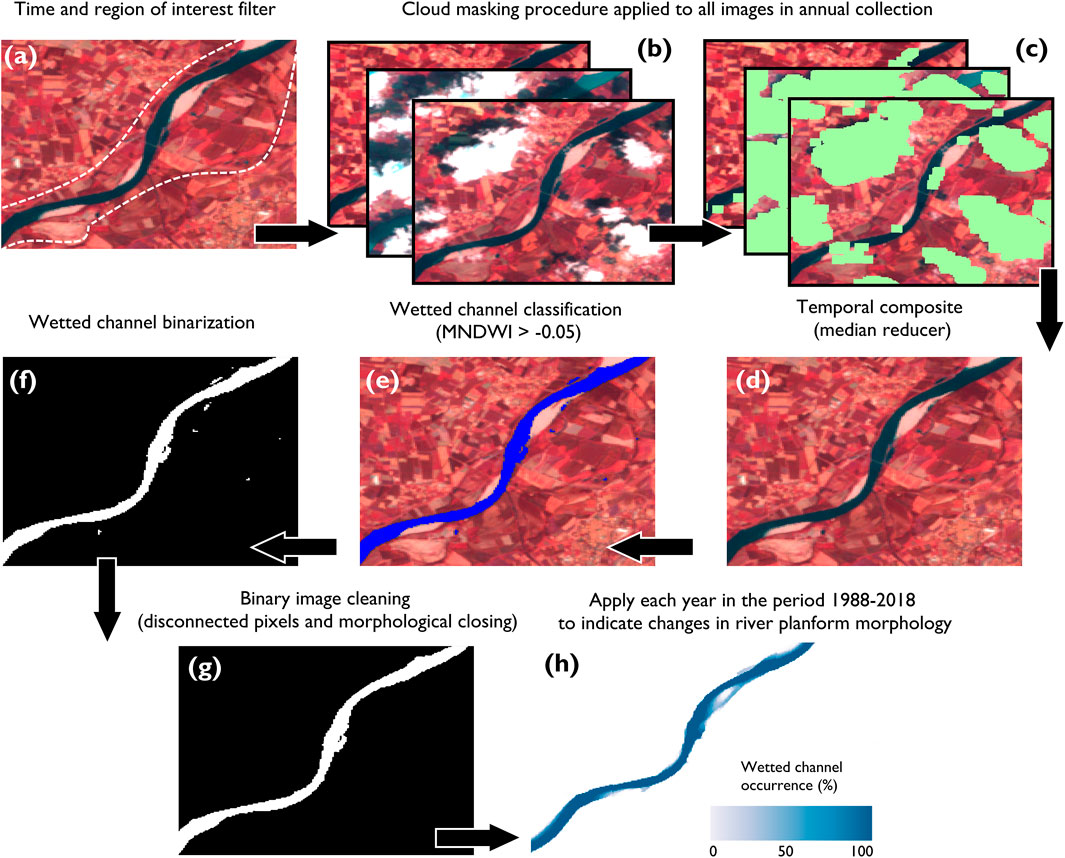
FIGURE 3. GEE workflow for identifying changes in wetted river planform morphology. This includes (A,B) time and region of interest filtering (annual collections within the Po River main levee), (C) cloud masking procedure following Foga et al. (2017); (D) temporal composition using a median reducer; (E) wetted channel classification applying a constant MNDWI threshold (>−0.05); (F) conversion to an intermediate binary wetted channel mask; (G) application of standard image processing morphological filtering to clean the representation and remove erroneously classified pixels; and, (H) wetted channel occurrence mapping at pixels over the 30 year period.
The GEE workflow to quantify changes in vegetation coverage is summarized in Figure 4 (example GEE code available here: https://code.earthengine.google.com/741689a850ec8ab604d6c7089d7d43a0). Regions of interest for the Po River main levee (175 km2) and large vegetated mid-channel bars (6.1 km2) were first defined. A date range that covered the analysis period (01 January 1988 to 01 January 2019) was specified and a time filter was applied to select all available Landsat surface reflectance imagery. As before, the CFmask algorithm was applied to each image in the collection to mask obstructions from cloud and cloud shadow pixels (Figure 4B; Foga et al., 2017). Then, wetted channel pixels were classified where MNDWI > −0.05 (Figure 4C). Only cloud-free, non-water (or “dry”) pixels were retained for analysis (Figure 4D). The method is advantageous in providing a dynamic mask, accounting for hydrodynamic changes in river stage between images. Using only the retained pixels, the normalized difference vegetation index, NDVI (Rouse et al., 1974) produced proxy maps for live green vegetation (Figure 4E) following:
where
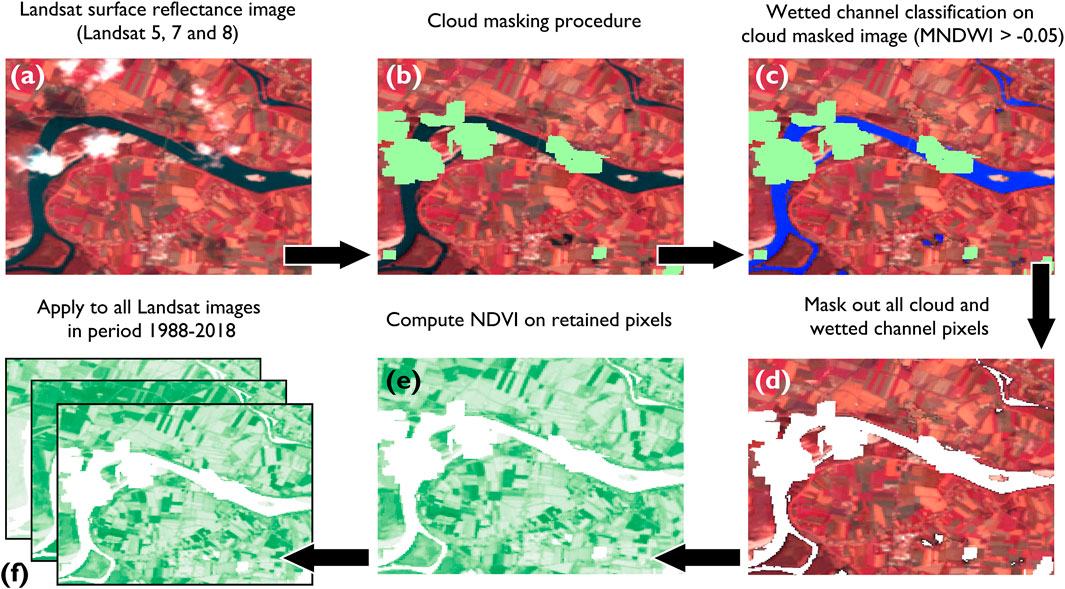
FIGURE 4. GEE workflow for identifying changes in vegetation coverage. This includes: (A) filtering all available Landsat surface reflectance imagery for the 1988–2018 analysis period; (B) per image application of cloud masking procedure following Foga et al. (2017); (C) per image wetted channel classification applying a constant MNDWI threshold; (D) per image dynamic masking of cloud and wetted channel pixels; (E) per image calculation of NDVI from retained pixels; and, (F) outputting NDVI time series for mean NDVI, 25th percentile NDVI and 75th percentile NDVI for the Po River main levee and vegetated bars.
Freshwater of the Po River is intensely used for irrigation, hydropower production and domestic purposes (Coppola et al., 2014). The average volume of annual precipitation is approximately 78 km3 but only around 60% (47 km3) is outflow volume at the closure section; evapotranspiration represents 20–25 km3, 17 km3 is used for irrigation purposes, 5 km3 is for civil and industrial users and the rest is charged into groundwater (Pham et al., 2019).
For the observation period 1988–2018, we used daily river discharge evaluations based on flow-discharge rating curves from four nearby gauging stations (Boretto, Borgoforte, Sermide and Pontelagoscuro; Figure 1) to assess discharge variability and calculate descriptive flow statistics (Figure 5 and Table 1). Mean daily discharge were in the range 1180–1470 m3 s−1, with several high-magnitude flood events (>5,000 m3 s−1) recorded over the observation period. The largest flood event (Qmax = 9,520–11,500 m3 s−1) occurred in October 2000 and has been described as a significant flood (Castellarin et al., 2011). Previous analysis of long-term time series evaluations of discharge along the Po River has shown peak discharge in autumn and spring, generated by rainfall and snowmelt events (Zanchettin et al., 2008; Montanari, 2012), while low discharges are typically observed in February and July (Baruffi et al., 2012). We calculated the mean daily discharge for each calendar day across all data years and showed a similarly strong component of discharge variability for the four gauging stations (Figure 5B). The discharge variability reflects the dominant climatic behaviors (Montanari, 2012), with the hydrological regime of the study reach dominated by peak flow periods in late spring and late autumn. Overall, the study reach exhibits transient hydrology interspersed with discrete, high-magnitude flood events.
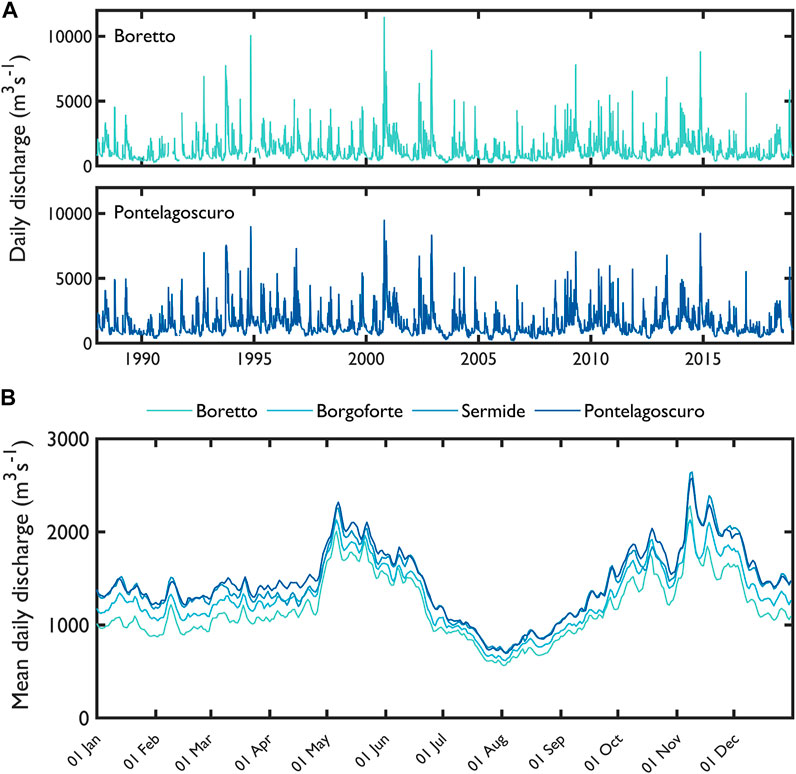
FIGURE 5. (A) Daily discharge of the Po River at the Boretto and Pontelagoscuro gauging stations for the observation period 1988–2018. (B) Seasonal component of daily flow showing discrete peaks in the hydrological regime at Boretto, Borgoforte, Sermide, and Pontelagoscuro.
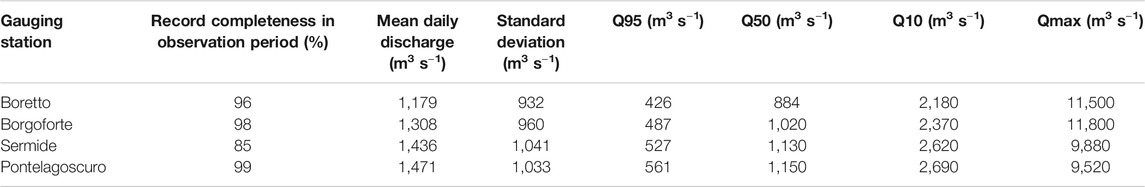
TABLE 1. Gauging station information and derived flow statistics for the observation period 1988–2018.
Wetted channel occurrence is used to visualize changes in river planform morphology for the period 1988–2018 (Figure 6). For the 30 year period, the maximum area of the wetted channel extent is 86.4 km2, covering 49.2% of the Po River main levee. The channel pattern is largely single-threaded, although a number of secondary channels around mid-channel bars are established. The position of the wetted river channel has remained approximately stable during the analysis period. Large parts of the studied reach are stable, with 77.6% of the maximum wetted channel area having an occurrence frequency >50%, and 60.3% of the area having an occurrence frequency >90%. For sub-reaches (i) and (ii), regions where the wetted channel occurrence is low (<50%) coincide with secondary channels (Figure 6). Toward the downstream end of the studied reach (iii), regions where the wetted channel occurrence is low (<50%) tend to be located at the edges of the wetted channel (Figure 6). The center of the wetted channel is relatively stable (wetted channel occurrence >90%), whereas surface water is more inconsistently observed toward the channel edges. The intermittency in wetted channel occurrence for secondary channels (e.g., sub-reaches (i) and (ii) and at the edges of single-threaded channels (e.g., sub-reach (iii) could indicate the combined effects of inter-annual differences in the transient hydrology, or large-scale morphological changes in river planform morphology (i.e., erosion and/or deposition).
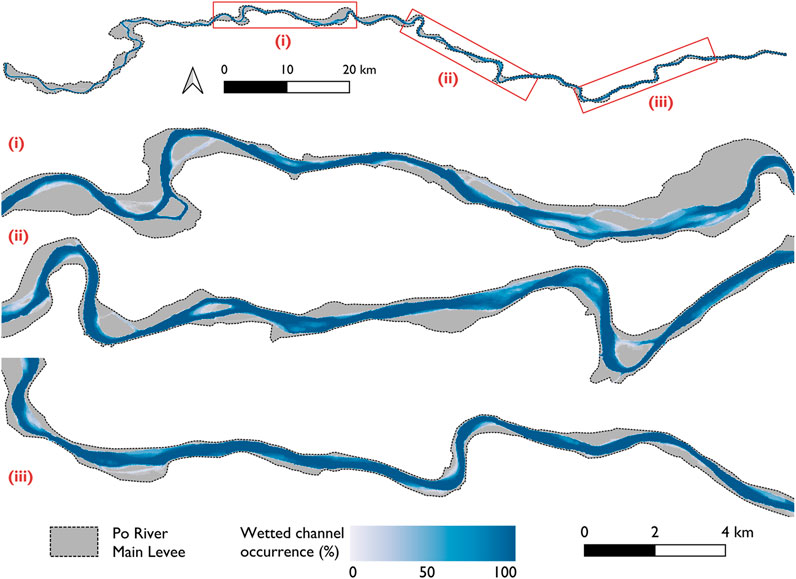
FIGURE 6. Wetted channel occurrence for the Po River between 1988 and 2018 from Landsat satellite imagery. Darker blues represent more frequent wetted channel occurrence within the Po River main levee; flow direction is from west to east. Sub-reaches (∼25 km length) shown in the red rectangles are rotated and enlarged for a closer visual inspection (flow direction is from left to right).
Local changes in river planform morphology are further investigated when comparing false color temporal composite images from 1988, 2003, and 2018 and plotting the wetted channel occurrence (Figure 7). Visually, a reduction in the number and area of exposed sediment bars, and a narrowing in width of the active channel (wetted channel and alluvial deposits), indicate morphological changes in river planform. These changes are most clearly observed toward the northern edge of the Po River main levee (Figure 7), which indicate sediment bars have been vegetated and the active channel width has narrowed over the 30 year period. Morphological changes are highly localized, i.e., the entire reach has not responded uniformly through time. Although the overall planform of the Po River has remained approximately stable (Figure 6), multi-temporal satellite imagery reveals the local hotspots of planform change.
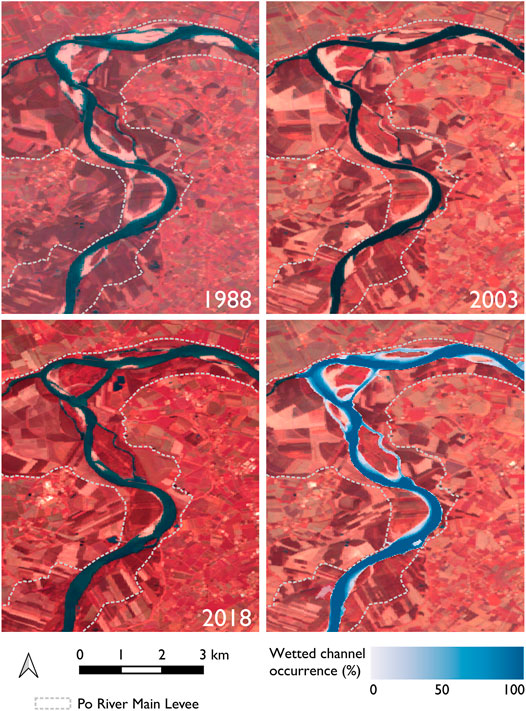
FIGURE 7. Po River planform configuration in 1988, 2003, and 2018 near to Scorzarolo (map center: 45°00′44.2″N 10°41′24.4″E). Wetted channel occurrence calculated for the period 1988–2018.
NDVI time series for the analysis period (1988–2018) are shown for the area within the Po River main levee (Figure 8) and for vegetated bars (Figure 9), with summary statistics provided in Tables 2, 3. Mean NDVI values were computed for each region of interest (i.e., averaged over the spatial area) using cloud-free, non-water acquisitions (Po River main levee, n = 1211; vegetated bars, n = 845). To indicate the lower and upper quartile of the NDVI response, the 25th and 75th percentiles of NDVI were computed for each region of interest. There are fewer acquisitions for vegetated bars because the probability of the area being obscured by cloud or inundated during high flows (and therefore dynamically masked) is greater. More acquisitions are made for the Po River main levee, although these may be incomplete and cover only a part of the region of interest. Averaged over the analysis period, summary statistics are similar for the area within the Po River main levee and vegetated bars (Table 2). The mean NDVI (0.49 and 0.50), standard deviation of mean NDVI (0.16 and 0.18) and range in mean NDVI (0.77 and 0.78) are all very similar. Likewise, the 25th and 75th percentiles of NDVI show a high degree of similarity between the Po River main levee and vegetated bars.

FIGURE 8. Multi-temporal changes in vegetation coverage for the period 1988–2018 within the Po River main levee: (A) long-term mean NDVI time series; (B) day of year (DOY) NDVI with fitted LOWESS curve (span = 0.25) to model the seasonal component; and, (C) long-term deseasonalized NDVI time series.
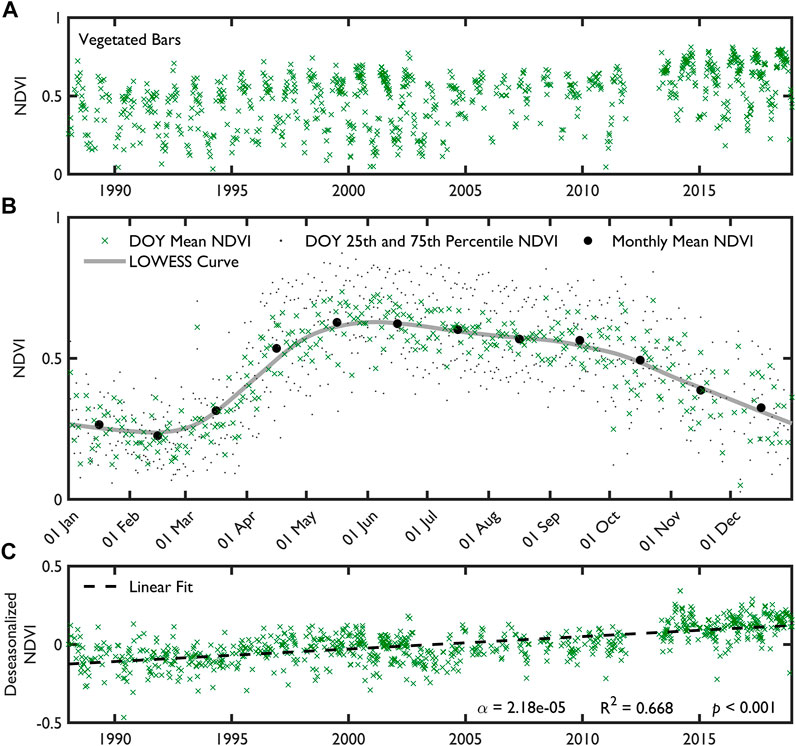
FIGURE 9. Multi-temporal changes in vegetation coverage for the period 1988–2018 for vegetated bars: (A) long-term mean NDVI time series; (B) day of year (DOY) NDVI with fitted LOWESS curve (span = 0.25) to model the seasonal component; and, (C) long-term deseasonalized NDVI time series.
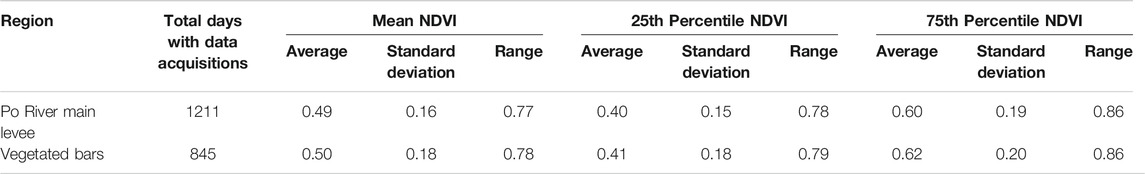
TABLE 2. Summary statistics from the NDVI time series for the period 1988–2018 (includes seasonal component).
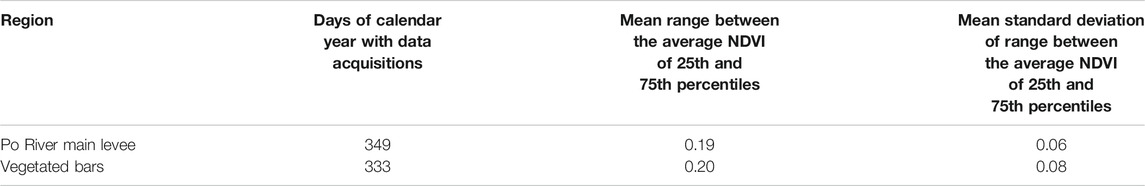
TABLE 3. Summary statistics from the day of year (DOY) NDVI time series for the period 1988–2018.
The mean NDVI time series contain a seasonal component (Figures 8A, 9A) and this seasonality is further assessed by calculating the day of year (DOY) mean, 25th and 75th percentile NDVI (Figures 8B, 9B). The patterns of DOY mean NDVI are similar for the Po River main levee and vegetated bars. DOY mean NDVI values are lowest in January-February, increase through March-April, reach a peak in May/June, then fall away throughout the remainder of the year. With DOY mean NDVI values averaged per month, monthly NDVI minima are recorded in February, while monthly NDVI maxima are recorded in May (vegetated bars) and June (Po River main levee). Seasonal NDVI patterns are exemplified for a sub-reach of the Po River in 2018, whereby the second and third quarters of the calendar year show enhanced vegetation greenness (Figure 10) and these changes are coherent across the full extent of the sub-reach (including vegetated bars).
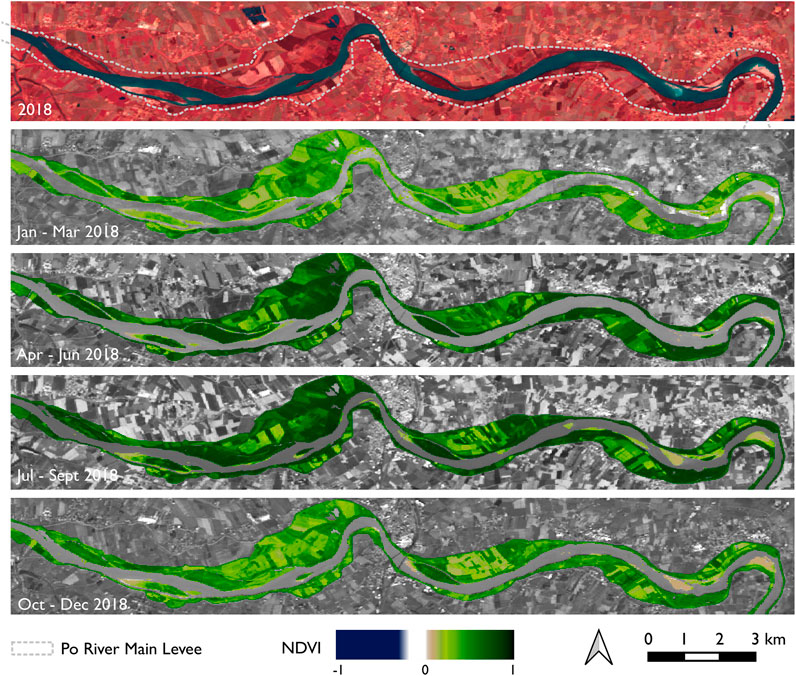
FIGURE 10. Quarterly changes in vegetation coverage using temporal composites of Landsat imagery from 2018, displayed as the mean NDVI for each period for each pixel. Map center near Ostiglia (45°03′12.0″N 11°08′15.2″E).
To model the seasonal component of the mean NDVI time series, we fitted a LOWESS (Locally Weighted Scatterplot Smoothing) curve to the DOY mean NDVI (Figures 8B, 9B). The non-parametric LOWESS function performs a weighted linear least-squares regression using a first-degree polynomial. The span was set to 0.25 to represent a quarter of the annual period (i.e., 3 months). Considerable scatter in the DOY mean NDVI is likely a result of the dynamic masking procedure (i.e., different parts of each region are represented for different days of the year). However, summary statistics of the seasonal dynamics show similarities between the regions (Table 3), with consistent mean ranges between the average NDVI of 25th and 75th percentiles (0.19 and 0.20), and similar mean standard deviation of range between the average NDVI of 25th and 75th percentiles (0.06 and 0.08). Figures 8B, 9B, 10 exemplify the strong seasonal component of vegetation dynamics within the Po River main and for vegetated bars, the timing of which will have important implications for flood risk management.
Finally, we assessed the long-term trend in mean NDVI for the Po River main levee (Figure 8C) and for vegetated bars (Figure 9C). For trend analysis, the seasonal component of the time series should be removed because it introduces seasonal correlation (Forkel et al., 2013). We deseasonalize the time series by subtracting the seasonal model (LOWESS curve) from the mean NDVI. Having removed the seasonal component, the deseasonalized NDVI data meets the assumption of linearity and allows for linear regression between the deseasonalized NDVI and time (date). For the Po River main levee, the statistical relationship is characterized by a moderate coefficient of determination (R2 = 0.497) and a statistically significant positive slope (α = 0.000014 and p-value < 0.001). The slope of the regression corresponds to an NDVI increase of 0.051/decade. For the vegetated bars, the statistical relationship is characterized by a higher coefficient of determination (R2 = 0.668) and a statistically significant positive slope (α = 0.000022 and p-value < 0.001). The slope of the regression corresponds to an NDVI increase of 0.080/decade. Analysis of the long-term trend in mean NDVI indicates that the vegetation dynamics are similar for both regions. Similar greening trends have been observed across Europe (e.g., Liu et al., 2015) and could be driven by human activities (e.g., intensification of agricultural practices; Levers et al., 2016).
In evaluating fluvial dynamics, researchers must consider the complex interactions between water, sediment and vegetation, which act across multiple spatiotemporal scales (Wintenberger et al., 2019). Even if the process relationships between water, sediment and vegetation are documented in the literature (e.g., Wang et al., 2015), there is still the need for developing innovative approaches to investigate and observe fluvial dynamics at the reach scale, potentially using non-invasive and inexpensive remote sensing techniques.
The present work used Google Earth Engine for deriving the variations caused by transient hydrology on the bio-morphodynamics of the Po River. Looking at wetted channel occurrence, the overall planform morphology is relatively stable; with some highly localized zones of morphological change (Figure 6). During recent years, a slight decrease of the summer flood magnitude and frequency (Figure 5) may have contributed to a narrowing of the main channel of the Po River, providing new room for vegetation, which fixed the banks and further reduced the sediment load, causing a simplification of the river planform morphology. The simplification is also shown by well-established surface water databases including the Deltares Aqua Monitor (Donchyts et al., 2016b) and the Global Surface Water dataset (Pekel et al., 2016). Looking at the changes observed during the period 1986–2015 in the Deltares Aqua Monitor, areas along the Po River main channel have been transformed from surface water into land (accretion). This signifies a loss of structural complexity, a key characteristic of less anthropized systems. Vegetation has a recognized feedback on fluvial morphodynamics, influencing the patterns of sediment deposition and modifying the channel pattern toward a single-thread (Tal and Paola, 2007; Bertoldi et al., 2014; Lightbody et al., 2019). The planform changes for the studied reach of the Po River are typical of anthropogenically impacted large rivers, which usually have an oversimplified planform morphology, banks mostly covered by stable vegetation and a relatively deep main channel as a consequence of the low variability of the hydrological regime (Pettit et al., 2001; Camporeale and Ridolfi, 2006; Guerrero et al., 2013).
Comparing the hydrological regime with the observed vegetation dynamics, we note synchronicity between the spring peak of water flow (Figure 5B) and the peak in NDVI (Figures 8B, 9B). The results reported in the present paper are in line with those derived from a field study performed along a tributary of the Po River (Gumiero et al., 2015). Despite the uncertainties associated with field observations and the relatively small database used, Gumiero et al. (2015) showed that the maximum vegetation coverage is usually attained between spring and mid-summer on the Po River plain. A second hydrological peak in late autumn is associated with a period of reduced vegetation coverage. Where the vegetative resistance is likely to be lower, this can cause remobilization of deposited sediment (Nones et al., 2018).
Freshwater ecosystem services are negatively affected by factors such as climate change (e.g., variations in temperature, precipitation and sea-level rise) and human interventions (e.g., agriculture practices, impoundment and land use/land cover change). Moreover, the potential synergic impacts of these factors on ecosystems are unevenly distributed, depending on geographical, climatic and socio-economic conditions (Pham et al., 2019). In highly anthropized catchments like the Po, the major stresses can be related to humans. In fact, the appropriation of water resources may induce water stress in such freshwater ecosystems when ecosystem needs are not met (Sabater et al., 2018). Intensive exploitation and regulation, as performed along the Po River, cause river ecosystems to shift toward non-natural flow regimes, which might have implications for their water quality and quantity, morpho-biological structure and functioning.
As discussed by Dufour and Rodríguez-González (2019), riparian areas are driven by both human and natural processes, showing complex trajectories over time and space, and therefore should be considered as co-constructed socio-ecological systems. The Po River case study demonstrates this behavior, as the long-term vegetation change, identified via the deseasonalized NDVI time series (Figures 8C, 9C), can be related to both natural (hydrologic) and anthropogenic conditions. Positive trends in the deseasonalized NDVI are recognizable for both the main channel and the vegetated bars, indicating that the 30 years vegetation dynamics are similar for both regions. This increase in NDVI could be eventually enhanced by a reduction of water flow variability because of natural trends and human pressures.
Historically, the removal of vegetation has been implemented to accelerate the passage of flow (Nepf et al., 2007). Although this can increase the flood frequency downstream, it can also negatively impact the river ecology, and may provide only a short-term solution (Trepel et al., 2003). Therefore, river management is shifting toward a more nature-based approach (Rowiński et al., 2018). Besides addressing societal needs like flood management, river management should increasingly address the ecosystem requirements for improved water quality and biodiversity, but this cannot be sustainably completed by using intensive restoration projects. Rather, solutions that are less resource-intensive (e.g., re-establishing natural channel processes and features, including vegetation) are preferable.
However, as shown by Vermuyten et al., (2020), the vegetation along a river reach varies throughout a year, and such seasonal changes in vegetation coverage may significantly affect the hydro-morphodynamic behavior of the river system. The present results exemplify the strong seasonal component of vegetation dynamics within the Po River main levee and for vegetated bars, the timing of which may have important implications for flood risk management. In developing flood risk management tools in this area, or sustainable river management strategies, it is necessary to account for the seasonal variability of riparian vegetation, and how it can impact the overall dynamics of the fluvial system.
Remote sensing can help in addressing fluvial-hydro-morphological challenges and monitoring vegetation changes at the reach scale (Nones, 2020), suggesting future trends based on past observations, which can be eventually modeled numerically. Emerging Earth observation platforms will continue to make remote sensing data even more accessible to non-technical users, particularly when capturing vegetation dynamics (e.g., CQuest.Earth). Remote sensing approaches therefore represent a near-operational application for riparian vegetation managers (Huylenbroeck et al., 2020), especially when used to estimate long-term changes in channel conveyance. However, fluvial systems are complex and dynamic; flood events can disturb and uproot vegetation, modifying the spatial distribution (Crouzy et al., 2013) and its influence on the riverine hydro-morphodynamics (Nones and Di Silvio, 2016).
From a hydraulic modeling perspective, vegetation can significantly impact both the hydrodynamics and the morphodynamics of fluvial systems (Przyborowski et al., 2019). Focusing on the latter aspect, more important in the case of flood risk modeling (Nones, 2019), riparian vegetation is often parameterized as roughness (e.g., Manning’s n). However, several limitations arise in adopting this schematization (e.g., Lane, 2005). Despite standard one- and two-dimensional models being particularly sensitive to floodplain roughness values (Straatsma and Baptist, 2008), usually they adopt a relatively simple divided channel method (DCM) with the Manning formula, without accounting for the uncertainties associated with such an assumption (Kiczko et al., 2020). Past studies show how spatially distributed vegetation roughness values are responsible for increases in mean flow depth and reductions in mean velocity relative to an unvegetated roughness scenario (Abu-Aly et al., 2014). Using the same reach of the Po River, Domeneghetti et al. (2021) evaluated the performance of several satellite altimetry products to calibrate a two-dimensional hydraulic model, but the roughness coefficient was assumed to be constant through time. Remote sensing data from multi-temporal satellite imagery could provide spatially distributed roughness parameterizations that are dynamic (i.e., representing intra-annual and annual changes in vegetation coverage). Aiming to account for the seasonal variability of vegetation and its influence on the roughness in real-time forecasting, innovative models should be developed in the future, possibly via a unique conceptual approach that use data assimilation for inferring trends on the vegetation encroachment and development. In the last decades, the exponential growth in computer storage and computational capacity allowed for the use of more complex algorithms and methods in flood risk computing (Nones and Caviedes-Voullième, 2020), and the spatial discretization of hydraulic models is getting smaller, suggesting for the need of adopting a similar level of detail in dynamic roughness parameterization (Abu-Aly et al., 2014).
Remote sensing can provide insights on fluvial dynamics at the reach scale, but field evidence is still necessary for checking the accuracy and calibrating satellite-derived indices. The accuracy of NDVI-derived vegetation estimates can be checked by comparing NDVI-derived vegetation estimates against high-resolution aerial or satellite imagery (e.g., Henshaw et al., 2013). On the one hand, satellite-derived data having a higher spatial resolution (e.g., Sentinel collections) can provide more detailed information on recent fluvial change. Besides obtaining information on the growing season, high-resolution images (e.g., Cosmo Sky-Med archive) can also give additional insights into the presence of different vegetation species, and eventually on their relationship with the local hydrology. Indeed, one of the limitations of the present study is the consideration of only a single class of vegetation, but this was intrinsically correlated to the resolution of the satellite images. The opportunity for data fusion (e.g., combining high spatial resolution unoccupied erial vehicle (UAV) imagery with high temporal resolution satellite imagery) and the use of UAVs as field validation tools can improve the spatiotemporal quantification of fluvial dynamics and help to bridge the gap between local and regional studies (Carbonneau et al., 2020; Morgan et al., 2021). On the other hand, detailed topographic and flow field measurements across a variety of scales e.g., Terrestrial Laser Scanning (e.g., Jalonen et al., 2015), Mobile Laser Scanning (e.g., Nylén et al., 2019), Airborne Laser Scanning (e.g., Antonarakis et al., 2008; Straatsma and Baptist, 2008), aDcp and multibeam (e.g., Guerrero and Lamberti, 2011) acquired during field campaigns are often needed to assess the uncertainties correlated with remote sensing techniques. Multiplatform and multisensor integration may lead to the largest gains in understanding across the river corridor (Tomsett and Leyland, 2019).
Multi-temporal satellite imagery analyses over three decades show planform adjustments and capture the vegetation dynamics of a highly anthropized reach of the Po River, associated with transient hydrology. Using established multi-spectral indices to indicate changes in river planform morphology, there has been a limited reduction in the planform complexity during the period 1988–2018. Within the Po River main levee, annually resolved imagery reveals that planform changes are highly localized (Figure 6); most parts of the studied reach remain stable, but localized zones show more substantial planform change (Figure 7). Using the wetted channel occurrence as a measure of planform stability, almost two-thirds of the wetted channel extent (total area = 86.4 km2) had an occurrence frequency >90% (i.e., most parts of the reach had remained unchanged). For zones where the wetted channel occurrence was low (<50%), a loss of planform complexity coincided with the position of former secondary channels, or zones where the active river channel had narrowed. Consequently, extreme flooding events, which are forecasted to increase because of climate change, will be conveyed through a reduced channel capacity, thus possibly increasing the flood risk. Using all available Landsat imagery and a dynamic masking procedure to retain only cloud-free, non-water pixels from each image in the studied reach, changes in vegetation coverage are indicated during the analysis period. A long-term increase in deseasonalized NDVI could indicate the response of vegetation to human activities (e.g., agricultural intensification). With the NDVI maxima recorded in May (for vegetated bars) and June (for the Po River main levee), the maxima in vegetation coverage coincides with the first discrete peak in the hydrological regime (occurring in late spring and associated with snowmelt). The second discrete peak in the hydrological regime occurs in late autumn (rainfall driven) but is associated with lower NDVI values for both regions of interest. Given the influence of vegetation on channel conveyance, seasonal variation in vegetation coverage is potentially important for local hydrodynamics, influencing flood risk.
From a flood risk and river management perspective, we suggest that remotely sensed information can provide river scientists with new insights to support the management of highly anthropized watercourses. Big geospatial data (e.g., freely accessible satellite imagery) and access to platforms that support multi-temporal analyses (e.g., cloud-based computing and GIS) enable riverine hydro-morpho-biodynamics to be monitored at spatiotemporal scales relevant to river management activities. Remotely sensed data can be coupled with long-term hydrological records to help in managing sediment transport and riparian vegetation to reduce flood risk.
The raw data supporting the conclusion of this article will be made available by the authors, without undue reservation. Google Earth Engine code to extract river planform morphology is available here: https://code.earthengine.google.com/1d1cc675904221567886f2e91b21d87d. Google Earth Engine code to assess changes in vegetation coverage is available here: https://code.earthengine.google.com/741689a850ec8ab604d6c7089d7d43a0. Datasets underlying the analysis are available here: https://dataportal.igf.edu.pl/dataset/po-river-dynamics.
RB and MN contributed equally to the manuscript. MG contributed toward writing—review and editing.
The manuscript was developed as part of a short-term scientific mission (STSM) awarded to RB from EU COST Action 16208 Knowledge Conversion For Enhancing Management Of European Riparian Ecosystems And Services (CONVERGES). This work was supported by a subsidy from the Polish Ministry of Education and Science for the Institute of Geophysics, Polish Academy of Sciences.
The authors declare that the research was conducted in the absence of any commercial or financial relationships that could be construed as a potential conflict of interest.
We are grateful to the Associate Editor and two reviewers for providing helpful comments that led to improvements in this manuscript. We would like to thank Trevor Hoey (Brunel University London) for advice on seasonal trend removal.
Abu-Aly, T. R., Pasternack, G. B., Wyrick, J. R., Barker, R., Massa, D., and Johnson, T. (2014). Effects of LiDAR-Derived, Spatially Distributed Vegetation Roughness on Two-Dimensional Hydraulics in a Gravel-Cobble River at Flows of 0.2 to 20 Times Bankfull. Geomorphology, 206, 468–482. doi:10.1016/j.geomorph.2013.10.017
Alfieri, L., Salamon, P., Bianchi, A., Neal, J., Bates, P., and Feyen, L. (2014). Advances in Pan-European Flood Hazard Mapping. Hydrol. Process. 28 (13), 4067–4077. doi:10.1002/hyp.9947
Antonarakis, A. S., Richards, K. S., and Brasington, J. (2008). Object-based Land Cover Classification Using Airborne LiDAR. Remote Sensing Environ. 112 (6), 2988–2998. doi:10.1016/j.rse.2008.02.004
Baruffi, F, Cisotto, A, Cimolino, A, Ferri, M,, Monego, M, Norbiato, D., et al. (2012). Climate Change Impact Assessment on Veneto and Friuli Plain Groundwater. Part I: An Integrated Modeling Approach For Hazard Scenario Construction. Sci. Total Environ. 440, 154–166. doi:10.1016/j.scitotenv.2012.07.070
Bertoldi, W., Drake, N. A., and Gurnell, A. M. (2011). Interactions between River Flows and Colonizing Vegetation on a Braided River: Exploring Spatial and Temporal Dynamics in Riparian Vegetation Cover Using Satellite Data. Earth Surf. Process. Landforms 36 (11), 1474–1486. doi:10.1002/esp.2166
Bertoldi, W., Siviglia, A., Tettamanti, S., Toffolon, M., Vetsch, D., and Francalanci, S. (2014). Modeling Vegetation Controls on Fluvial Morphological Trajectories. Geophys. Res. Lett. 41 (20), 7167–7175. doi:10.1002/2014gl061666
Bohorquez, P., and del Moral-Erencia, J. D. (2017). 100 Years of Competition between Reduction in Channel Capacity and Streamflow during Floods. Remote Sensing 9 (7), 727. doi:10.3390/rs9070727
Boothroyd, R. J., Williams, R. D., Hoey, T., Barrett, B., and Prasojo, O. A. (2021a). Applications of Google Earth Engine in Fluvial Geomorphology for Detecting River Channel Change. WIREs Water 8 (1), e21496. doi:10.1002/wat2.1496
Boothroyd, R. J., Williams, R. D., Hoey, T. B., Tolentino, P. L. M., and Yang, X. (2021b). National-scale Assessment of Decadal River Migration at Critical Bridge Infrastructure in the Philippines. Sci. Total Environ. 768, 144460. doi:10.1016/j.scitotenv.2020.144460
Boothroyd, R. J., Hardy, R. J., Warburton, J., and Marjoribanks, T. I. (2017). Modeling Complex Flow Structures and Drag Around a Submerged Plant of Varied Posture. Water Resour. Res. 53 (4), 2877–2901. doi:10.1002/2016wr020186
Borgogno-Mondino, E., Lessio, A., and Gomarasca, M. A. (2016). A Fast Operative Method for NDVI Uncertainty Estimation and its Role in Vegetation Analysis. Eur. J. Remote Sensing 49 (1), 137–156. doi:10.5721/eujrs20164908
Camporeale, C., and Ridolfi, L. (2006). Riparian Vegetation Distribution Induced by River Flow Variability: A Stochastic Approach. Water Resour. Res. 42 (10), W10415. doi:10.1029/2006wr004933
Carbonneau, P. E., Belletti, B., Micotti, M., Lastoria, B., Casaioli, M., Mariani, S., et al. (2020). UAV‐based Training for Fully Fuzzy Classification of Sentinel‐2 Fluvial Scenes. Earth Surf. Process. Landforms 45 (13), 3120–3140. doi:10.1002/esp.4955
Caroppi, G., Västilä, K., Järvelä, J., Rowiński, P. M., and Giugni, M. (2019). Turbulence at Water-Vegetation Interface in Open Channel Flow: Experiments with Natural-like Plants. Adv. Water Resour. 127, 180–191. doi:10.1016/j.advwatres.2019.03.013
Castellarin, A., Di Baldassarre, G., and Brath, A. (2011). Floodplain Management Strategies for Flood Attenuation in the River Po. River Res. Applic. 27 (8), 1037–1047. doi:10.1002/rra.1405
Castiglioni, G. B., Biancotti, A., Bondesan, M., Cortemiglia, G. C., Elmi, C., Favero, V., et al. (1999). Geomorphological Map of the Po Plain, Italy, at a Scale of 1: 250 000. Earth Surf. Process. Landforms 24 (12), 1115–1120.doi:10.1002/(SICI)1096-9837(199911)24:12<1115::AID-ESP38>3.0.CO;2-Z
Clark, S. D. A., Cooper, J. R., Rameshwaran, P., Naden, P., Li, M., and Hooke, J. (2020). “Modelling River Flow through In-Stream Natural Vegetation for a Gravel-Bed River Reach,” in Recent Trends in Environmental Hydraulics. GeoPlanet: Earth and Planetary Sciences. Editors M. Kalinowska, M. Mrokowska, and P. Rowiński (Cham: Springer). doi:10.1007/978-3-030-37105-0_3
Coppola, E., Verdecchia, M., Giorgi, F., Colaiuda, V., Tomassetti, B., and Lombardi, A. (2014). Changing Hydrological Conditions in the Po Basin under Global Warming. Sci. Total Environ. 493, 1183–1196. doi:10.1016/j.scitotenv.2014.03.003
Corenblit, D., Steiger, J., Gurnell, A. M., Tabacchi, E., and Roques, L. (2009). Control of Sediment Dynamics by Vegetation as a Key Function Driving Biogeomorphic Succession within Fluvial Corridors. Earth Surf. Process. Landforms 34 (13), 1790–1810. doi:10.1002/esp.1876
Costabile, P., and Macchione, F. (2015). Enhancing River Model Set-Up for 2-D Dynamic Flood Modelling. Environ. Model. Softw. 67, 89–107. doi:10.1016/j.envsoft.2015.01.009
Cotton, J. A., Wharton, G., Bass, J. A. B., Heppell, C. M., and Wotton, R. S. (2006). The Effects of Seasonal Changes to In-Stream Vegetation Cover on Patterns of Flow and Accumulation of Sediment. Geomorphology 77 (3-4), 320–334. doi:10.1016/j.geomorph.2006.01.010
Croke, J., Thompson, C., and Fryirs, K. (2017). Prioritising the Placement of Riparian Vegetation to Reduce Flood Risk and End-Of-Catchment Sediment Yields: Important Considerations in Hydrologically-Variable Regions. J. Environ. Manage. 190, 9–19. doi:10.1016/j.jenvman.2016.12.046
Darby, S. E. (1999). Effect of Riparian Vegetation on Flow Resistance and Flood Potential. J. Hydraulic Eng. 125 (5), 443–454. doi:10.1061/(asce)0733-9429(1999)125:5(443)
DeVries, B., Huang, C., Armston, J., Huang, W., Jones, J. W., and Lang, M. W. (2020). Rapid and Robust Monitoring of Flood Events Using Sentinel-1 and Landsat Data on the Google Earth Engine. Remote Sensing Environ. 240, 111664. doi:10.1016/j.rse.2020.111664
Domeneghetti, A., Carisi, F., Carisi, F., Castellarin, A., and Brath, A. (2015). Evolution of Flood Risk over Large Areas: Quantitative Assessment for the Po River. J. Hydrol. 527, 809–823. doi:10.1016/j.jhydrol.2015.05.043
Domeneghetti, A., Molari, G., Tourian, M. J., Tarpanelli, A., Behnia, S., Moramarco, T., et al. (2021). Testing the Use of Single- and Multi-Mission Satellite Altimetry for the Calibration of Hydraulic Models. Adv. Water Resour. 151, 103887. doi:10.1016/j.advwatres.2021.103887
Domeneghetti, A., Tarpanelli, A., Brocca, L., Barbetta, S., Moramarco, T., Castellarin, A., et al. (2014). The Use of Remote Sensing-Derived Water Surface Data for Hydraulic Model Calibration. Remote Sensing Environ. 149, 130–141. doi:10.1016/j.rse.2014.04.007
Donchyts, G., Baart, F., Winsemius, H., Gorelick, N., Kwadijk, J., and Van De Giesen, N. (2016b). Earth's Surface Water Change over the Past 30 Years. Nat. Clim Change 6 (9), 810–813. doi:10.1038/nclimate3111
Donchyts, G., Schellekens, J., Schellekens, J., Winsemius, H., Eisemann, E., and van de Giesen, N. (2016a). A 30 M Resolution Surface Water Mask Including Estimation of Positional and Thematic Differences Using Landsat 8, SRTM and OpenStreetMap: a Case Study in the Murray-Darling Basin, Australia. Remote Sensing 8 (5), 386. doi:10.3390/rs8050386
Doocy, S., Daniels, A., Murray, S., and Kirsch, T. D. (2013). The Human Impact of Floods: a Historical Review of Events 1980-2009 and Systematic Literature Review. Plos Curr. 5. doi:10.1371/currents.dis.f4deb457904936b07c09daa98ee8171a
Drusch, M., Del Bello, U., Carlier, S., Colin, O., Fernandez, V., Gascon, F., et al. (2012). Sentinel-2: ESA's Optical High-Resolution Mission for GMES Operational Services. Remote Sensing Environ. 120, 25–36. doi:10.1016/j.rse.2011.11.026
Dufour, S., and Rodríguez-González, P. M. (2019). Riparian Zone/Riparian Vegetation Definition: Principles and Recommendations. Report, COST Action CA16208 CONVERGES, 20 pp. Available at: https://converges.eu/wp-content/uploads/2019/04/Report_definitions_Riparian_V1-2.pdf (Accessed January 15, 2021).
Dufour, S., Rodríguez-González, P. M., and Laslier, M. (2019). Tracing the Scientific Trajectory of Riparian Vegetation Studies: Main Topics, Approaches and Needs in a Globally Changing World. Sci. Total Environ. 653, 1168–1185. doi:10.1016/j.scitotenv.2018.10.383
Džubáková, K., Molnar, P., Schindler, K., and Trizna, M. (2015). Monitoring of Riparian Vegetation Response to Flood Disturbances Using Terrestrial Photography. Hydrol. Earth Syst. Sci. 19, 195–208. doi:10.5194/hess-19-195-2015
Foga, S., Scaramuzza, P. L., Guo, S., Zhu, Z., Dilley, R. D., Beckmann, T., et al. (2017). Cloud Detection Algorithm Comparison and Validation for Operational Landsat Data Products. Remote Sensing Environ. 194, 379–390. doi:10.1016/j.rse.2017.03.026
Forkel, M., Carvalhais, N., Verbesselt, J., Mahecha, M., Neigh, C., and Reichstein, M. (2013). Trend Change Detection in NDVI Time Series: Effects of Inter-annual Variability and Methodology. Remote Sensing 5 (5), 2113–2144. doi:10.3390/rs5052113
Gilvear, D., and Bryant, R. (2016). “Analysis of Remotely Sensed Data for Fluvial Geomorphology and River Science,” in Tools in Fluvial Geomorphology. Editors M. Kondolf, and H. Piégay (Chichester, England: John Wiley & Sons), 103–132. doi:10.1002/9781118648551.ch6
Glenn, E., Huete, A., Nagler, P., and Nelson, S. (2008). Relationship between Remotely-Sensed Vegetation Indices, Canopy Attributes and Plant Physiological Processes: What Vegetation Indices Can and Cannot Tell Us about the Landscape. Sensors 8 (4), 2136–2160. doi:10.3390/s8042136
Gorelick, N., Hancher, M., Dixon, M., Ilyushchenko, S., Thau, D., and Moore, R. (2017). Google Earth Engine: Planetary-Scale Geospatial Analysis for Everyone. Remote Sensing Environ. 202, 18–27. doi:10.1016/j.rse.2017.06.031
Guan, M., Carrivick, J. L., Wright, N. G., Sleigh, P. A., and Staines, K. E. H. (2016). Quantifying the Combined Effects of Multiple Extreme Floods on River Channel Geometry and on Flood Hazards. J. Hydrol. 538, 256–268. doi:10.1016/j.jhydrol.2016.04.004
Guerrero, M., Di Federico, V., and Lamberti, A. (2013). Calibration of a 2-D Morphodynamic Model Using Water-Sediment Flux Maps Derived from an ADCP Recording. J. Hydroinformatics 15 (3), 813–828. doi:10.2166/hydro.2012.126
Guerrero, M., and Lamberti, A. (2011). Flow Field and Morphology Mapping Using ADCP and Multibeam Techniques: Survey in the Po River. J. Hydraul. Eng. 137 (12), 1576–1587. doi:10.1061/(asce)hy.1943-7900.0000464
Guerrero, M., Nones, M., Saurral, R., Montroull, N., and Szupiany, R. N. (2013). Parana River Morphodynamics in the Context of Climate Change. Int. J. River Basin Manage. 11 (4), 423–437. doi:10.1080/15715124.2013.826234
Gumiero, B., Rinaldi, M., Belletti, B., Lenzi, D., and Puppi, G. (2015). Riparian Vegetation as Indicator of Channel Adjustments and Environmental Conditions: the Case of the Panaro River (Northern Italy). Aqua. Sci. 77, 563–582. doi:10.1007/s00027-015-0403-x
Gurnell, A. M., and Bertoldi, W. (2020). Extending the Conceptual Model of River Island Development to Incorporate Different Tree Species and Environmental Conditions. River Res. Appl. 36 (8), 1730–1747. doi:10.1002/rra.3691
Gurnell, A. M. (2016). “Trees, Wood and River Morphodynamics: Results from 15 Years Research on the Tagliamento River, Italy,” in River Science. Editors D. J. Gilvear, M. T. M. C. GreenwoodThoms, and P. J. Wood. Chichester: John Wiley & Sons. doi:10.1002/9781118643525.ch7
Gurnell, A. (2014). Plants as River System Engineers. Earth Surf. Process. Landforms 39 (1), 4–25. doi:10.1002/esp.3397
Hallegatte, S., Green, C., Nicholls, R. J., and Corfee-Morlot, J. (2013). Future Flood Losses in Major Coastal Cities. Nat. Clim Change 3 (9), 802–806. doi:10.1038/nclimate1979
Harvey, J., and Gooseff, M. (2015). River Corridor Science: Hydrologic Exchange and Ecological Consequences from Bedforms to Basins. Water Resour. Res. 51 (9), 6893–6922. doi:10.1002/2015wr017617
Henshaw, A. J., Gurnell, A. M., Bertoldi, W., and Drake, N. A. (2013). An Assessment of the Degree to Which Landsat TM Data Can Support the Assessment of Fluvial Dynamics, as Revealed by Changes in Vegetation Extent and Channel Position, along a Large River. Geomorphology 202, 74–85. doi:10.1016/j.geomorph.2013.01.011
Huete, A., Didan, K., Miura, T., Rodriguez, E. P., Gao, X., and Ferreira, L. G. (2002). Overview of the Radiometric and Biophysical Performance of the MODIS Vegetation Indices. Remote Sensing Environ. 83 (1-2), 195–213. doi:10.1016/s0034-4257(02)00096-2
Huylenbroeck, L., Laslier, M., Dufour, S., Georges, B., Lejeune, P., and Michez, A. (2020). Using Remote Sensing to Characterize Riparian Vegetation: A Review of Available Tools and Perspectives for Managers. J. Environ. Manage. 267, 110652. doi:10.1016/j.jenvman.2020.110652
Jalonen, J., Järvelä, J., Virtanen, J.-P., Vaaja, M., Kurkela, M., and Hyyppä, H. (2015). Determining Characteristic Vegetation Areas by Terrestrial Laser Scanning for Floodplain Flow Modeling. Water 7 (2), 420–437. doi:10.3390/w7020420
Järvelä, J. (2002). Flow Resistance of Flexible and Stiff Vegetation: a Flume Study with Natural Plants. J. Hydrol. 269 (1-2), 44–54. doi:10.1016/s0022-1694(02)00193-2
Kiczko, A., Västilä, K., Kozioł, A., Kubrak, J., Kubrak, E., and Krukowski, M. (2020). Predicting Discharge Capacity of Vegetated Compound Channels: Uncertainty and Identifiability of One-Dimensional Process-Based Models. Hydrol. Earth Syst. Sci. 24 (8), 4135–4167. doi:10.5194/hess-24-4135-2020
Kouwen, N., Unny, T. E., and Hill, H. M. (1969). Flow Retardance in Vegetated Channels. J. Irrig. Drain. Div. 95 (2), 329–342. doi:10.1061/jrcea4.0000652
Lamberti, A., and Schippa, L. (1994). “Studio dell’abbassamento del fiume Po: Previsioni trentennali di abbassamento a Cremona. Supplemento a Navigazione Interna, rassegna trimestrale di studi e informazioni, 3/4,” in Azienda Regionale per i porti di Cremona e Mantova (Cremona, Italy: Italian).
Lane, S. N. (2005). Roughness - Time for a Re-evaluation? Earth Surf. Process. Landforms 30 (2), 251–253. doi:10.1002/esp.1208
Lane, S. N., Tayefi, V., Reid, S. C., Yu, D., and Hardy, R. J. (2007). Interactions between Sediment Delivery, Channel Change, Climate Change and Flood Risk in a Temperate Upland Environment. Earth Surf. Process. Landforms 32 (3), 429–446. doi:10.1002/esp.1404
Lanzoni, S., Luchi, R., and Bolla Pittaluga, M. (2015). Modeling the Morphodynamic Equilibrium of an Intermediate Reach of the Po River (Italy). Adv. Water Resour. 81, 92–102. doi:10.1016/j.advwatres.2014.11.004
Legleiter, C. J., and Fonstad, M. A. (2012). “An Introduction to the Physical Basis for Deriving River Information by Optical Remote Sensing,” in Fluvial Remote Sensing for Science and Management. Editors P. E. Carbonneau, and H. Piégay (Chichester, UK: Wiley), 42–69.
Leopold, L. B., and Maddock, T. (1953). The Hydraulic Geometry of Stream Channels and Some Physiographic Implications. Washington, DC: U.S. Geological Survey. doi:10.3133/pp252
Levers, C., Butsic, V., Verburg, P. H., Müller, D., and Kuemmerle, T. (2016). Drivers of Changes in Agricultural Intensity in Europe. Land Use Policy 58, 380–393. doi:10.1016/j.landusepol.2016.08.013
Lightbody, A. F., Kui, L., Stella, J. C., Skorko, K. W., Bywater-Reyes, S., and Wilcox, A. C. (2019). Riparian Vegetation and Sediment Supply Regulate the Morphodynamic Response of an Experimental Stream to Floods. Front. Environmental Sci. 7 (40). doi:10.3389/fenvs.2019.00040
Liu, Y., Li, Y., Li, S., and Motesharrei, S. (2015). Spatial and Temporal Patterns of Global NDVI Trends: Correlations with Climate and Human Factors. Remote Sensing 7 (10), 13233–13250. doi:10.3390/rs71013233
Marchetti, M. (2002). Environmental Changes in the Central Po Plain (Northern Italy) Due to Fluvial Modifications and Anthropogenic Activities. Geomorphology 44 (3-4), 361–373. doi:10.1016/s0169-555x(01)00183-0
Marjoribanks, T. I., Hardy, R. J., Lane, S. N., and Tancock, M. J. (2017). Patch-scale Representation of Vegetation within Hydraulic Models. Earth Surf. Process. Landforms 42 (5), 699–710. doi:10.1002/esp.4015
Maselli, V., Normandeau, A., Nones, M., Tesi, T., Langone, L., Trincardi, F., et al. (2020). Tidal Modulation of River-Flood Deposits: How Low Can You Go? Geology 48 (7), 663–667. doi:10.1130/g47451.1
Maselli, V., Pellegrini, C., Del Bianco, F., Mercorella, A., Nones, M., Crose, L., et al. (2018). River Morphodynamic Evolution under Dam-Induced Backwater: An Example from the Po River (Italy). J. Sediment. Res. 88 (10), 1190–1204. doi:10.2110/jsr.2018.61
Merz, B., Delgado, J., Hundecha, Y., Kreibich, H., and Kreibich, H. (2012). “Detection and Attribution of Changes in Flood Hazard and Risk,”. Changes in Flood Risk in Europe. Editor Z. W. Kundzewicz (IAHS Spec. Publ.), 10, 435–458. doi:10.1201/b12348-29
Montanari, A. (2012). Hydrology of the Po River: Looking for Changing Patterns in River Discharge. Hydrol. Earth Syst. Sci. 16 (10), 3739–3747. doi:10.5194/hess-16-3739-2012
Morgan, B. E., Chipman, J. W., Bolger, D. T., and Dietrich, J. T. (2021). Spatiotemporal Analysis of Vegetation Cover Change in a Large Ephemeral River: Multi-Sensor Fusion of Unmanned Aerial Vehicle (UAV) and Landsat Imagery. Remote Sensing 13 (51). doi:10.3390/rs13010051
Nepf, H. M., White, B., Lightbody, A., and Ghisalberti, M. (2007). “Transport in Aquatic Canopies,” in Flow and Transport Processes with Complex Obstructions: Applications to Cities, Vegetative Canopies, and Industry. Editors Y. A. Gayev, and J. C. R. Hunt (Dordrecht: Springer Netherlands), 221–250.
Nepf, H. M. (2012a). Flow and Transport in Regions with Aquatic Vegetation. Annu. Rev. Fluid Mech. 44, 123–142. doi:10.1146/annurev-fluid-120710-101048
Nepf, H. M. (2012b). Hydrodynamics of Vegetated Channels. J. Hydraulic Res. 50 (3), 262–279. doi:10.1080/00221686.2012.696559
Neuhold, C., Stanzel, P., and Nachtnebel, H. P. (2009). Incorporating River Morphological Changes to Flood Risk Assessment: Uncertainties, Methodology and Application. Nat. Hazards Earth Syst. Sci. 9 (3), 789–799. doi:10.5194/nhess-9-789-2009
Nied, M., Schröter, K., Lüdtke, S., Nguyen, V. D., and Merz, B. (2017). What Are the Hydro-Meteorological Controls on Flood Characteristics? J. Hydrol. 545, 310–326. doi:10.1016/j.jhydrol.2016.12.003
Nones, M., and Caviedes‐Voullième, D. (2020). Computational Advances and Innovations in Flood Risk Mapping. J. Flood Risk Manage. 13 (4), e12666. doi:10.1111/jfr3.12666
Nones, M., and Di Silvio, G. (2016). Modeling of River Width Variations Based on Hydrological, Morphological, and Biological Dynamics. J. Hydraulic Eng. 142 (7), 04016012. doi:10.1061/(asce)hy.1943-7900.0001135
Nones, M., Guerrero, M., and Archetti, R. (2020b). “Monitoring of Riparian Vegetation Growth on Fluvial Sandbars,” in Recent Trends in Environmental Hydraulics. GeoPlanet: Earth and Planetary Sciences. Editors M. Kalinowska, M. Mrokowska, and P. Rowiński (Cham: Springer). doi:10.1007/978-3-030-37105-0_17
Nones, M.(2020). Remote Sensing and GIS Techniques to Monitor Morphological Changes along the Middle-Lower Vistula River, Poland. Int. J. River Basin Manage. 13, 1–13. doi:10.1080/15715124.2020.1742137
Nones, M., Archetti, R., and Guerrero, M. (2018). Time-lapse Photography of the Edge-Of-Water Line Displacements of a Sandbar as a Proxy of Riverine Morphodynamics. Water 10 (5), 617. doi:10.3390/w10050617
Nones, M. (2019). Dealing with Sediment Transport in Flood Risk Management. Acta Geophys. 67, 677–685. doi:10.1007/s11600-019-00273-7
Nones, M., Gerstgraser, C., and Wharton, G. (2017). Consideration of Hydromorphology and Sediment in the Implementation of the EU Water Framework and Floods Directives: A Comparative Analysis of Selected EU Member States. Water Environ. J. 31 (3), 324–329. doi:10.1111/wej.12247
Nones, M. (2015). Implementation of the Floods Directive in Selected EU Member States. Water Environ. J. 29 (3), 412–418. doi:10.1111/wej.12129
Nones, M., Maselli, V., and Varrani, A. (2020a). Numerical Modeling of the Hydro-Morphodynamics of a Distributary Channel of the Po River Delta (Italy) during the Spring 2009 Flood Event. Geosciences 10 (6), 209. doi:10.3390/geosciences10060209
Nylén, T., Kasvi, E., Salmela, J., Kaartinen, H., Kukko, A., Jaakkola, A., et al. (2019). Improving Distribution Models of Riparian Vegetation with Mobile Laser Scanning and Hydraulic Modelling. PLOS ONE 14 (12), e0225936. doi:10.1371/journal.pone.0225936
Pekel, J.-F., Cottam, A., Gorelick, N., and Belward, A. S. (2016). High-resolution Mapping of Global Surface Water and its Long-Term Changes. Nature 540, 418–422. doi:10.1038/nature20584
Petryk, S., and Bosmajian, G. (1975). Analysis of Flow through Vegetation. J. Hydr. Div. 101 (7), 871–884. doi:10.1061/jyceaj.0004397
Pettit, N. E., Froend, R. H., and Davies, P. M. (2001). Identifying the Natural Flow Regime and the Relationship with Riparian Vegetation for Two Contrasting Western Australian Rivers. Regul. Rivers: Res. Mgmt. 17 (3), 201–215. doi:10.1002/rrr.624
Pham, H. V., Torresan, S., Critto, A., and Marcomini, A. (2019). Alteration of Freshwater Ecosystem Services under Global Change - A Review Focusing on the Po River Basin (Italy) and the Red River Basin (Vietnam). Sci. Total Environ. 652, 1347–1365. doi:10.1016/j.scitotenv.2018.10.303
Phongsapan, K., Chishtie, F., Poortinga, A., Bhandari, B., Meechaiya, C., Kunlamai, T., et al. (2019). Operational Flood Risk Index Mapping for Disaster Risk Reduction Using Earth Observations and Cloud Computing Technologies: a Case Study on Myanmar. Front. Environ. Sci. 7, 191. doi:10.3389/fenvs.2019.00191
Przyborowski, Ł., Łoboda, A. M., and Bialik, R. J. (2019). Effect of Two Distinct Patches of Myriophyllum Species on Downstream Turbulence in a Natural River. Acta Geophysica 67 (3), 987–997. doi:10.1007/s11600-019-00292-4
Rouse, J. W., Haas, R. H., Schell, J. A., and Deering, D. W. (1974). Monitoring Vegetation Systems in the Great Plains with ERTS. NASA Spec. Publ. 351, 309.
Rowiński, P. M., Västilä, K., Aberle, J., Järvelä, J., and Kalinowska, M. B. (2018). How Vegetation Can Aid in Coping with River Management Challenges: A Brief Review. Ecohydrology & Hydrobiology 18 (4), 345–354. doi:10.1016/j.ecohyd.2018.07.003
Sabater, S., Bregoli, F., Acuña, V., Barceló, D., Elosegi, A., Ginebreda, A., et al. (2018). Effects of Human-Driven Water Stress on River Ecosystems: a Meta-Analysis. Scientific Rep. 8 (1), 1–11. doi:10.1038/s41598-018-29807-7
Shields, F. D., Coulton, K. G., and Nepf, H. (2017). Representation of Vegetation in Two-Dimensional Hydrodynamic Models. J. Hydraulic Eng. 143 (8), 02517002. doi:10.1061/(asce)hy.1943-7900.0001320
Slater, L. J., Khouakhi, A., and Wilby, R. L. (2019). River Channel Conveyance Capacity Adjusts to Modes of Climate Variability. Scientific Rep. 9, 12619. doi:10.1038/s41598-019-48782-1
Slater, L. J., and Singer, M. B. (2013). Imprint of Climate and Climate Change in Alluvial Riverbeds: Continental United States, 1950-2011. Geology 41 (5), 595–598. doi:10.1130/g34070.1
Slater, L. J., Singer, M. B., and Kirchner, J. W. (2015). Hydrologic versus Geomorphic Drivers of Trends in Flood Hazard. Geophys. Res. Lett. 42 (2), 370–376. doi:10.1002/2014gl062482
Slater, L. J. (2016). To what Extent Have Changes in Channel Capacity Contributed to Flood Hazard Trends in England and Wales? Earth Surf. Process. Landforms 41 (8), 1115–1128. doi:10.1002/esp.3927
Sofia, G., and Nikolopoulos, E. I. (2020). Floods and Rivers: a Circular Causality Perspective. Scientific Rep. 10 (1), 1–17. doi:10.1038/s41598-020-61533-x
Sofia, G., Roder, G., Dalla Fontana, G., and Tarolli, P. (2017). Flood Dynamics in Urbanised Landscapes: 100 Years of Climate and Humans’ Interaction. Scientific Rep. 7, 40527. doi:10.1038/srep40527
Spada, D., Molinari, P., Bertoldi, W., Vitti, A., and Zolezzi, G. (2018). Multi-Temporal Image Analysis for Fluvial Morphological Characterization with Application to Albanian Rivers. Ijgi 7 (8), 314. doi:10.3390/ijgi7080314
Stover, S., and Montgomery, D. R. (2001). Channel Change and Flooding, Skokomish River, Washington. J. Hydrol. 243 (3-4), 272–286. doi:10.1016/s0022-1694(00)00421-2
Straatsma, M. W., and Baptist, M. J. (2008). Floodplain Roughness Parameterization Using Airborne Laser Scanning and Spectral Remote Sensing. Remote Sensing Environ. 112, 1062–1080. doi:10.1016/j.rse.2007.07.012
Tal, M., and Paola, C. (2007). Dynamic Single-Thread Channels Maintained by the Interaction of Flow and Vegetation. Geol 35 (4), 347–350. doi:10.1130/g23260a.1
Tobón-Marín, A., and Cañón Barriga, J. (2020). Analysis of Changes in Rivers Planforms Using Google Earth Engine. Int. J. Remote Sensing 41 (22), 8654–8681. doi:10.1080/01431161.2020.1792575
Tomsett, C., and Leyland, J. (2019). Remote Sensing of River Corridors: A Review of Current Trends and Future Directions. River Res. Applic 35, 779–803. doi:10.1002/rra.3479
Trepel, M., Holsten, B., Kieckbusch, J., Otten, I., and Pieper, F. (2003). Influence of Macrophytes on Water Level and Flood Dynamics in a Riverine Wetland in Northern Germany. In: Proceedings of the International Conference “EcoFlood: Towards Natural Flood Reduction Strategies”, Raszyn: Institute for Land Reclamation and Grassland Farming, 1–6.
Västilä, K., and Järvelä, J. (2014). Modeling the Flow Resistance of Woody Vegetation Using Physically Based Properties of the Foliage and Stem. Water Resour. Res. 50 (1), 229–245. doi:10.1002/2013wr013819
Vercruysse, K., and Grabowski, R. C. (2021). Human Impact on River Planform within the Context of Multi-Timescale River Channel Dynamics in a Himalayan River System. Geomorphology 381, 107659. doi:10.1016/j.geomorph.2021.107659
Vermuyten, E., Meert, P., Wolfs, V., and Willems, P. (2020). Impact of Seasonal Changes in Vegetation on the River Model Prediction Accuracy and Real‐time Flood Control Performance. J. Flood Risk Manage. 13 (4), e12651. doi:10.1111/jfr3.12651
Villarini, G., and Smith, J. A. (2010). Flood Peak Distributions for the Eastern United States. Water Resour. Res. 46 (6), W06504. doi:10.1029/2009wr008395
Vos, K., Splinter, K. D., Harley, M. D., Simmons, J. A., and Turner, I. L. (2019). CoastSat: A Google Earth Engine-Enabled Python Toolkit to Extract Shorelines from Publicly Available Satellite Imagery. Environ. Model. Softw. 122, 104528. doi:10.1016/j.envsoft.2019.104528
Wang, C., Zheng, S.-s., Wang, P.-f., and Hou, J. (2015). Interactions between Vegetation, Water Flow and Sediment Transport: A Review. J. Hydrodyn 27 (1), 24–37. doi:10.1016/s1001-6058(15)60453-x
Wheater, H., and Evans, E. (2009). Land Use, Water Management and Future Flood Risk. Land Use Policy 26 (1), S251–S264. doi:10.1016/j.landusepol.2009.08.019
Wintenberger, C. L., Rodrigues, S., Greulich, S., Bréhéret, J. G., Jugé, P., Tal, M., et al. (2019). Control of Non-migrating Bar Morphodynamics on Survival of Populus Nigra Seedlings during Floods. Wetlands 39 (2), 275–290. doi:10.1007/s13157-018-1121-7
Xu, H. (2006). Modification of Normalised Difference Water Index (NDWI) to Enhance Open Water Features in Remotely Sensed Imagery. Int. J. Remote Sensing 27 (14), 3025–3033. doi:10.1080/01431160600589179
Keywords: remote sensing, river science, multi-temporal, multi-spectral, Po river, google earth engine
Citation: Boothroyd RJ, Nones M and Guerrero M (2021) Deriving Planform Morphology and Vegetation Coverage From Remote Sensing to Support River Management Applications. Front. Environ. Sci. 9:657354. doi: 10.3389/fenvs.2021.657354
Received: 22 January 2021; Accepted: 22 April 2021;
Published: 04 May 2021.
Edited by:
Xinyi Shen, University of Connecticut, United StatesReviewed by:
Hongtao Duan, Nanjing Institute of Geography and Limnology (CAS), ChinaCopyright © 2021 Boothroyd, Nones and Guerrero. This is an open-access article distributed under the terms of the Creative Commons Attribution License (CC BY). The use, distribution or reproduction in other forums is permitted, provided the original author(s) and the copyright owner(s) are credited and that the original publication in this journal is cited, in accordance with accepted academic practice. No use, distribution or reproduction is permitted which does not comply with these terms.
*Correspondence: Richard J. Boothroyd, cmljaGFyZC5ib290aHJveWRAZ2xhc2dvdy5hYy51aw==
Disclaimer: All claims expressed in this article are solely those of the authors and do not necessarily represent those of their affiliated organizations, or those of the publisher, the editors and the reviewers. Any product that may be evaluated in this article or claim that may be made by its manufacturer is not guaranteed or endorsed by the publisher.
Research integrity at Frontiers
Learn more about the work of our research integrity team to safeguard the quality of each article we publish.