 Xiaoqing Luo
 Jianjun Xu1,2*
95% of researchers rate our articles as excellent or good
Learn more about the work of our research integrity team to safeguard the quality of each article we publish.
Find out more
ORIGINAL RESEARCH article
Front. Environ. Sci. , 09 April 2021
Sec. Interdisciplinary Climate Studies
Volume 9 - 2021 | https://doi.org/10.3389/fenvs.2021.655521
This article is part of the Research Topic Advances in Global Warming Observations and their Uncertainties View all 17 articles
Under the background of global warming, the summer land-sea thermal contrasts at the upper troposphere exists great discrepancies in radiosonde data (IUK, RICH, and RAOBCORE), reanalysis data (JRA-55, NCEP/DOE, and ERA5) and CMIP6 models results (MPI, FGOALS, and CESM2) for the period of 1979-2014. It can be found that the descriptive statistical indicators (i.e., maximum, minimum, and skewness) of the summer land-sea thermal contrasts index (TTI) between the Tibetan Plateau (TP) and the Tropical Indian Ocean (TIO) vary greatly. The ERA5 and JRA-55 data have the best correlation with radiosonde data. The linear trend and running linear trend (RTL) of the radiosonde data are significantly correlated with the reanalysis data, and both show that the land-sea thermal contrast rapidly increasing are in 1990s and the late 2000s, and the period of rapid weakening was early 2000s. This interannual variation may modulated by the decadal signals such as Pacific Decadal Oscillation (PDO). Except for the NCEP/DOE and IUK, other data show that the most significant warming in the TP-TIO region is at the upper troposphere, and the vertical profiles of the summer temperature trend are quite different in different data, and CMIP6 shows an obvious warm bias in the upper troposphere.
The Asian monsoon onset that results from the land–sea thermal contrast between Eurasia and the tropical ocean (Webster et al., 1998) is characterized by changes in the prevailing wind direction and the appearance of severe precipitation (Wu et al., 2013). Several studies have been carried out on the relationship between the meridional land–sea thermal contrast (Li and Yanai, 1996; Sun et al., 2010; Zhang et al., 2017; Luo et al., 2021), or the zonal land–sea thermal contrast (Qian et al., 2004; Qi et al., 2007; Si et al., 2019), and the Asian monsoon. He et al. (2003) revealed that the reversal time of the meridional temperature gradient in upper troposphere is concurrent with (one pentad earlier than) the onset time of the summer monsoon. Dai et al. (2013) showed that the summer thermal structure and winds over Asia produce a larger land–sea thermal gradient in the upper than in the lower troposphere, and identified the greater role of the upper troposphere in driving the Asian summer monsoon circulation.
The South Asian summer monsoon (SASM) is the strongest among the three members of the Asian monsoon system (Wang et al., 2017), and its onset and intensity are regulated by the meridional thermal contrast in the upper troposphere (Dai et al., 2013; Luo et al., 2021). The obvious features during summer in the upper troposphere of the Asian monsoon region are the warm center and the South Asian high located on the southern side of the TP (Boos and Kuang, 2010). The thermal condition of the Tibetan Plateau (TP) and tropical Indian Ocean (TIO) are the two key impact factors and the interactive system to modulate SASM. In summer, the thermal contrast between the TP and TIO reaches the strongest, and the SASM region is accompanied by strong baroclinicity (Luo et al., 2021). A reduced (increased) meridional upper-tropospheric thermal contrast will lead to a weakened (strengthened) SASM circulation in climate models (Sun et al., 2010) and reanalysis data (Luo et al., 2021). The physical explanation is the thermal wind relationship (Holton, 2004).
Since the rapid warming period after the 1970s (IPCC, 2014), the degree of warming has varied greatly in the radiosonde and satellite data for the mid-troposphere (Thorne et al., 2011; Guo et al., 2020a), and there are also many uncertainties in the trend of the upper tropospheric temperature (Seidel et al., 2004). The upper troposphere above the TP and TIO is warming (Zhao et al., 2015; Ming et al., 2019; Shangguan et al., 2019), and there are uncertainties in the interannual variation of the meridional land–sea thermal contrast (Dai et al., 2013; Guo et al., 2017). Due to the strong positive relationship between the summer thermal contrast between TP-TIO with SASM, and the it is necessary to discussed the discrepancies of upper troposphere summer thermal contrast between TP and TIO in multiple data, especially the discrepancies of the trends. This work can provide a foundation for our further research on the relationship between the TP-TIO thermal contrasts and the SASM in interannual and interdecadal scale. The article is organized as follows. In section “Data and Methods,” we describe the data and the procedure. We then introduce two SASM indices (SASMIs) and the definition of the meridional land–sea thermal contrast index (TTI). Section “Results” presents the results and section “Summary and Discussion” provides a summary and discussion.
The data used in this article are listed in Table 1, and the details are as follows.
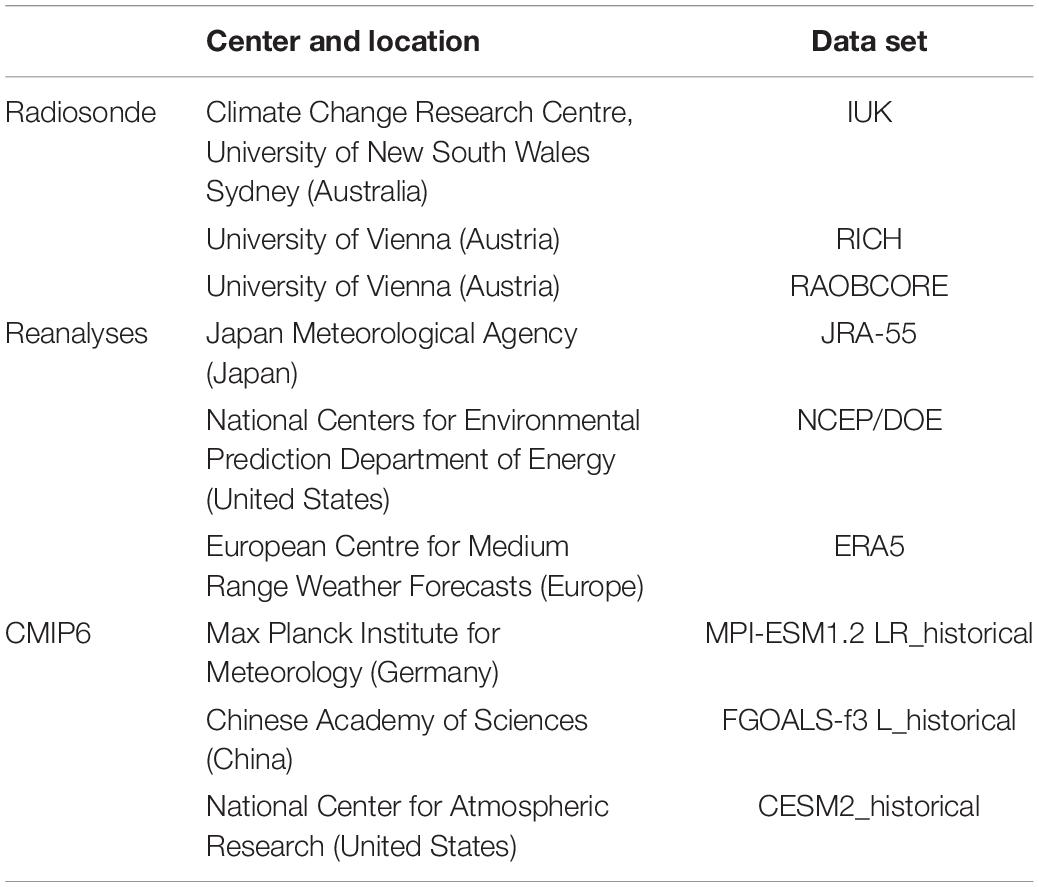
Table 1. Data used in this study.
The Iterative Universal Kriging (IUK) radiosonde dataset since 1959 from 527 radiosonde stations was developed by Sherwood et al. (2008) using a statistical model to simultaneously identify artificial shifts and natural atmospheric fluctuations. Haimberger (2007) and Haimberger et al. (2008, 2012) carried out homogeneity adjustments of the Radiosonde Observation Correction using reanalysis (RAOBCORE) and Radiosonde Innovation Composite Homogenization (RICH) for the upper air temperatures from the global radiosonde network. The resulting datasets include the RAOBCORE and RICH data. The former was calculated from the mean of the radiosonde minus the reference time series before and after breakpoints. The latter is based on the breakpoint detection method of RAOBCORE, but it also considers neighbor station time series as a reference (Pattantyús-Ábrahám and Steinbrecht, 2015). The RAOBCORE and RICH 10° × 5° gridded data were averaged over 108 latitude bands, while the IUK is the station data averaged by latitude band without gridding (Free, 2011). According to the area of the TP (75°E –103°E, 28°N–38°N) and TIO (60°E- 100°E, 15°S–5°N), we choose 3 stations (station number: 61967,48657,48698) represent the TIO, and 5 stations (42027,42101,42182,51828,51848) represent the TP, and then defined the thermal contrast for IUK data.
The JRA-55, which is the second Japanese global atmospheric reanalysis based on TL319, is the first comprehensive reanalysis to apply four-dimensional variational analysis up to the present (Kobayashi et al., 2015). The NCEP–Department of Energy (DOE) reanalysis is an updated version of the NCEP–NCAR reanalysis (Kanamitsu et al., 2002). It has good applicability in describing precipitation and temperature (Chen et al., 2014; Harada et al., 2016). ERA5 is the fifth-generation ECMWF (European Centre for Medium-Range Weather Forecasts) global atmospheric reanalysis from 1950 to the present, based on the Integrated Forecasting System (IFS) Cy41r2, which started operation in 2016. Compared with the 80 km horizontal resolution of the ERA Interim reanalysis data, ERA5 has a horizontal resolution of 31 km, which performs better in describing temperature, wind, precipitation, and weather systems (Hersbach et al., 2020). The present study used temperature at 1000–200hPa from 1979 to 2014 for ERA5 (1° ×1°), JRA-55 (1.25° ×1.25°) and NCEP/DOE (2.5° ×2.5°).
The Max Planck Institute for Meteorology Earth System Model version 1.2 (MPI-ESM1.2, hereafter MPI) is the update of MPI-ESM1.1 and includes improvements in all its components (Mauritsen et al., 2019). The MPI-ESM1.2 LR is the low-resolution version. The low-resolution version of the Chinese Academy of Sciences (CAS) Flexible Global Ocean–Atmosphere–Land System model finite-volume version 3 (FGOALS-f3-L, hereafter FGOALS) climate system model was developed at the State Key Laboratory of Numerical Modeling for Atmospheric Sciences and Geophysical Fluid Dynamics (LASG) which has six tiles and is irregular in the horizonal direction (He et al., 2019). The Community Earth System Model Version 2 (CESM2) has improved historical simulations compared with CESM1 and available observations (Danabasoglu et al., 2020). In this study, we used the simulated historical temperatures of three models from Phase 6 of the Coupled Model Intercomparison Project (CMIP6). The CMIP6 includes the latest generation of comprehensive Earth Systems, driven by historical greenhouse gas concentrations, and followed by different future greenhouse gas and aerosol concentrations according to the Shared Socioeconomic Pathways (SSP) scenarios (Tokarska et al., 2020). The historical forcings of CMIP6 are based as far as possible on observations and cover the period from 1850 to 2014 (Eyring et al., 2016). The present study used temperatures at 1000–200hPa from the above three historical simulation results of CMIP6 for the period from 1979 to 2014.
The thermal contrast between the TP and the TIO reaches the maximum in summer (Luo et al., 2021), while the vertical fall in TP-TIO is reached at about 5000 m. Dai et al. (2013) found that the land–sea thermal contrast in the mid-upper troposphere contributes about three times more than the thermal contrast in the mid-lower troposphere in determining the Asian summer monsoon circulation. Therefore, this study applies the thermal contrast index (TTI), which is the meridional gradient of the 400-200 hPa average summer temperature in the TP-TIO region [formula (1)] to represents the summer thermal contrast between land and sea. The larger (smaller) the positive TTI, the stronger (weaker) the meridional thermal contrast in the upper troposphere. In formula (1), T represents the area-averaged of monthly temperature anomaly in summer at 400–200hPa.
There are several SASMIs to describe the different features of the monsoon (Webster and Yang, 1992; Wang and Fan, 1999; Li and Zeng, 2002, 2003). This study used two SASMIs, one of which is the Webster and Yang (1992) index, here named MI-2, and the other is MI-1. The atmospheric kinetic energy of the vertical mean flow and the shear flow can be referred to as the barotropic and baroclinic component, respectively. MI-1 is based on the atmospheric baroclinic component over the region (0°–20°N, 60°–100°E) due to the strong baroclinicity in the SASM region (Xu and Chan, 2002). For the specific definition of MI-1, please refer to our previous publication (Luo et al., 2021). MI-2 is defined by the zonal wind difference between 850 and 200 hPa over the region (0°–20°N, 40°–110°E), which can reflect the variability of the broad-scale SASM (Wang and Fan, 1999). MI-1 and MI-2 have a significant positive correlation (Luo et al., 2021).
The trend is computed using linear least squares fitting (Wei, 2007) and running linear least square fitting (Zhao et al., 2013). The running linear least square fitting is used to estimate the thermal contrast trends with a moving 10-year temporal window that can describe the variations of the trend with time. The t-statistic is used to test for a significant linear regression relationship and correlation coefficient relationship (Wei, 2007). The significance level is set to be 0.05.
In addition, because RAOBCORE and RICH are anomaly monthly data based on 1981-2010, in order to maintain consistency, the rest data in our study also used this basis to calculate anomalies.
There are great differences in the different data describing the basic characteristics of the thermal contrasts (Figure 1 and Table 2). The maximum TTI varied from 0.94°C (JRA-55) to 1.59°C (FGOALS), and the minimum TTI changed from –2.87°C (IUK) to –1.08°C (CESM2). The IUK data were relatively scattered (range value = 4.3°C) and had the largest standard deviation (σ = 1.02), while the ERA5 was the most concentrated (range value = 2.28°C) with the smallest standard deviation (σ = 0.49). The reason for this is that the IUK data consist of 460 radiosonde stations (Sherwood et al., 2008), while the RAOBCORE and RICH are assimilated from more than 1000 daily radiosonde stations (Haimberger et al., 2008). The ERA5 provides a detailed record of the global atmosphere, land surface and ocean waves from 1950 onward with a horizontal resolution of up to 0.28° (Hersbach et al., 2020). It also assimilates the RAOBCORE and RICH. In addition, NCEP/DOE in the reanalysis data and the FGOALS in the models are also relatively scattered. According to the skewness coefficient, the results are left-biased, except for NCEP/DOE, CESM2, and MPI. The models and NCEP/DOE have insufficient kurtosis distribution, whereas the others have excessive kurtosis distribution.
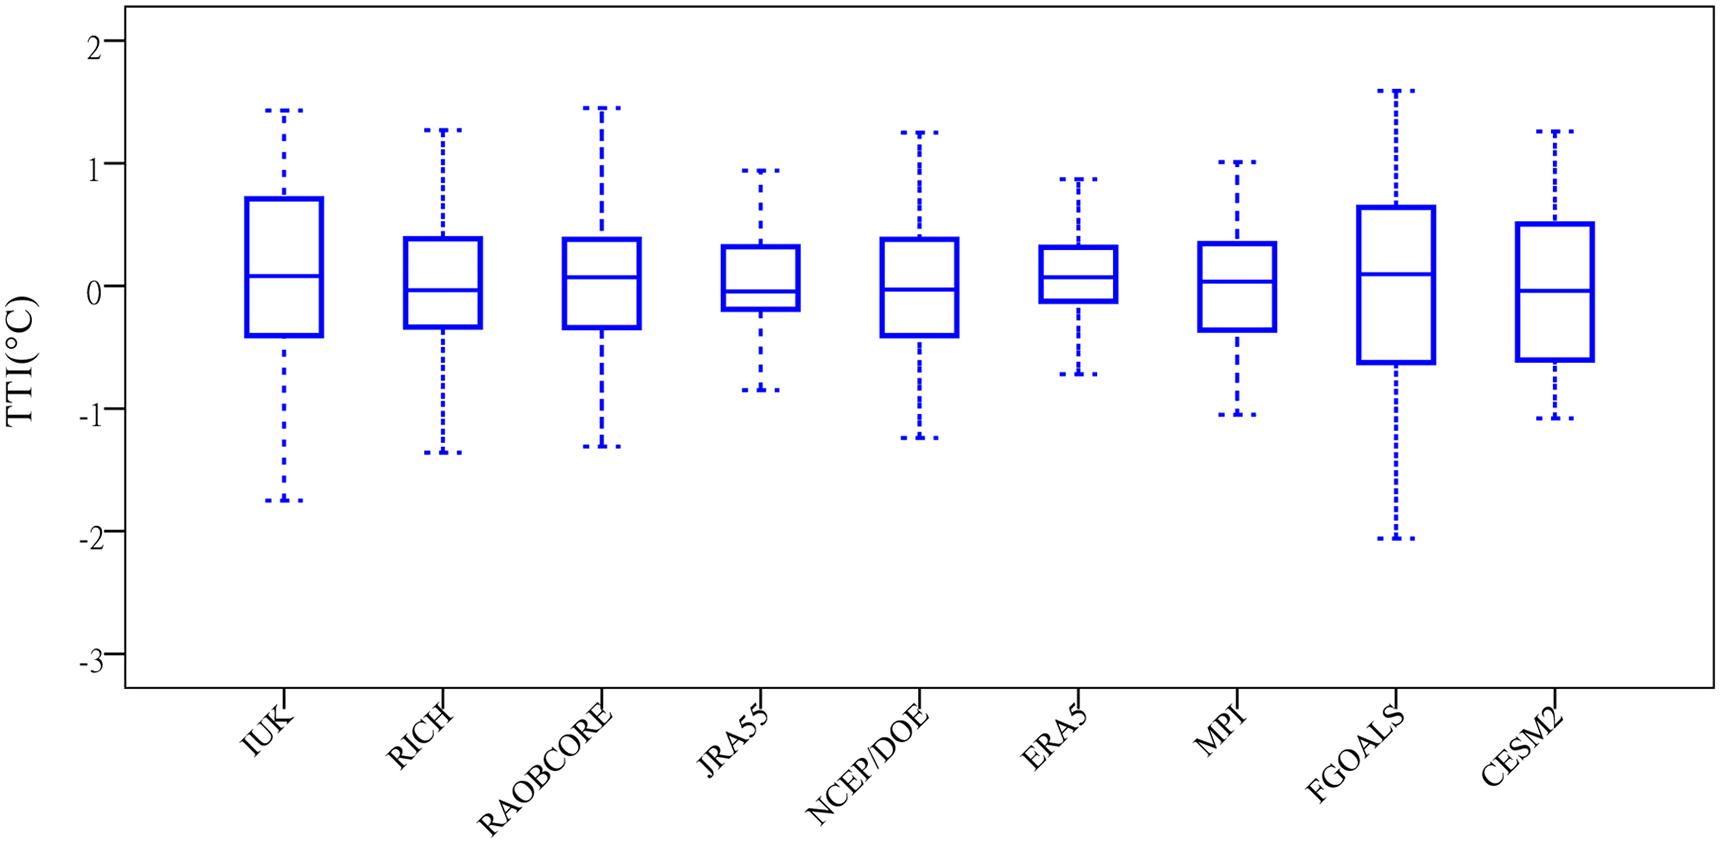
Figure 1. Boxplot of the summer land–sea thermal contrasts (TTI) (°C).
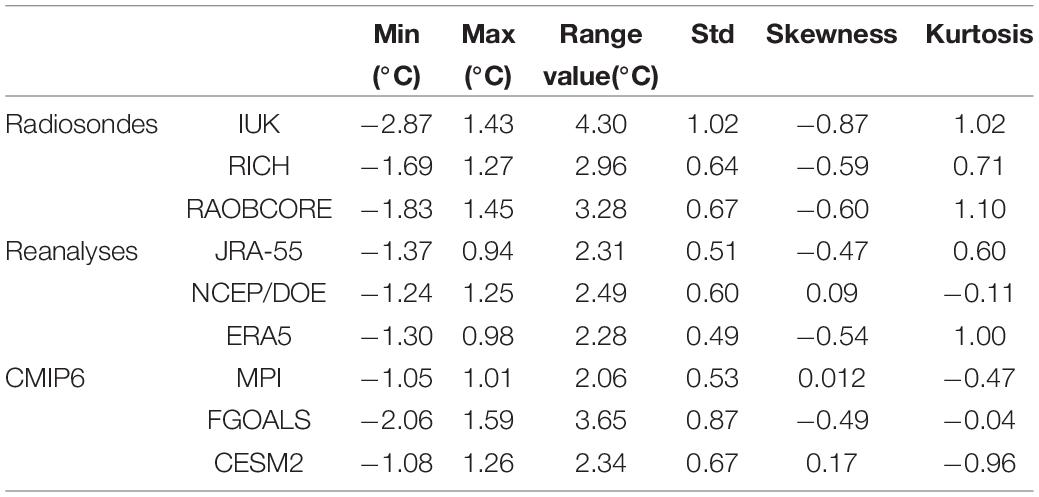
Table 2. The statistics of the summer thermal contrasts (TTI) for the different data.
The reanalysis data have significant correlation with the radiosonde data, and the results of JRA-55 and ERA5 are the most significant. This indicates that reanalysis data, especially ERA5 and JRA-55, can reproduce the summer land–sea thermal contrasts in the upper troposphere of the TP-TIO region. Because the model simulation were not designed to match the temporal evolution of observed climate, or the raw climate variables at interannual or decadal time scale, our research wasn’t analyze the correlation between the simulation results and other data. The standard deviation of IUK is the largest, and the standard deviation of RICH and RAOBCORE is relatively small (Table 3), resulting in the ratios of the standard deviation in Figure 2 are different from each other. In addition, the standard deviation of the reanalyses are smaller than the value of the radiosonde data.
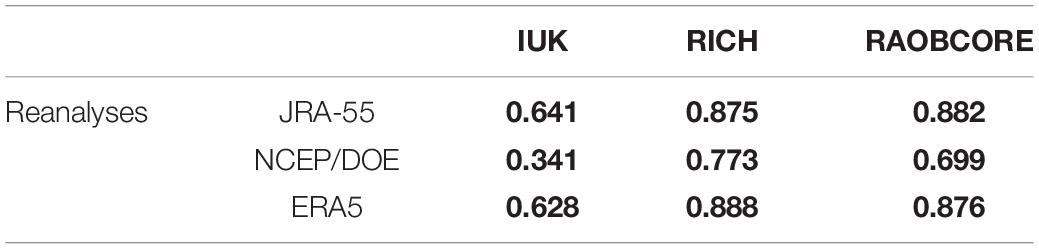
Table 3. Correlation coefficients of TTI between radiosonde and the reanalysis data (bold indicates a correlation coefficient above 0.32, representing the significance test at the 95% confidence level).
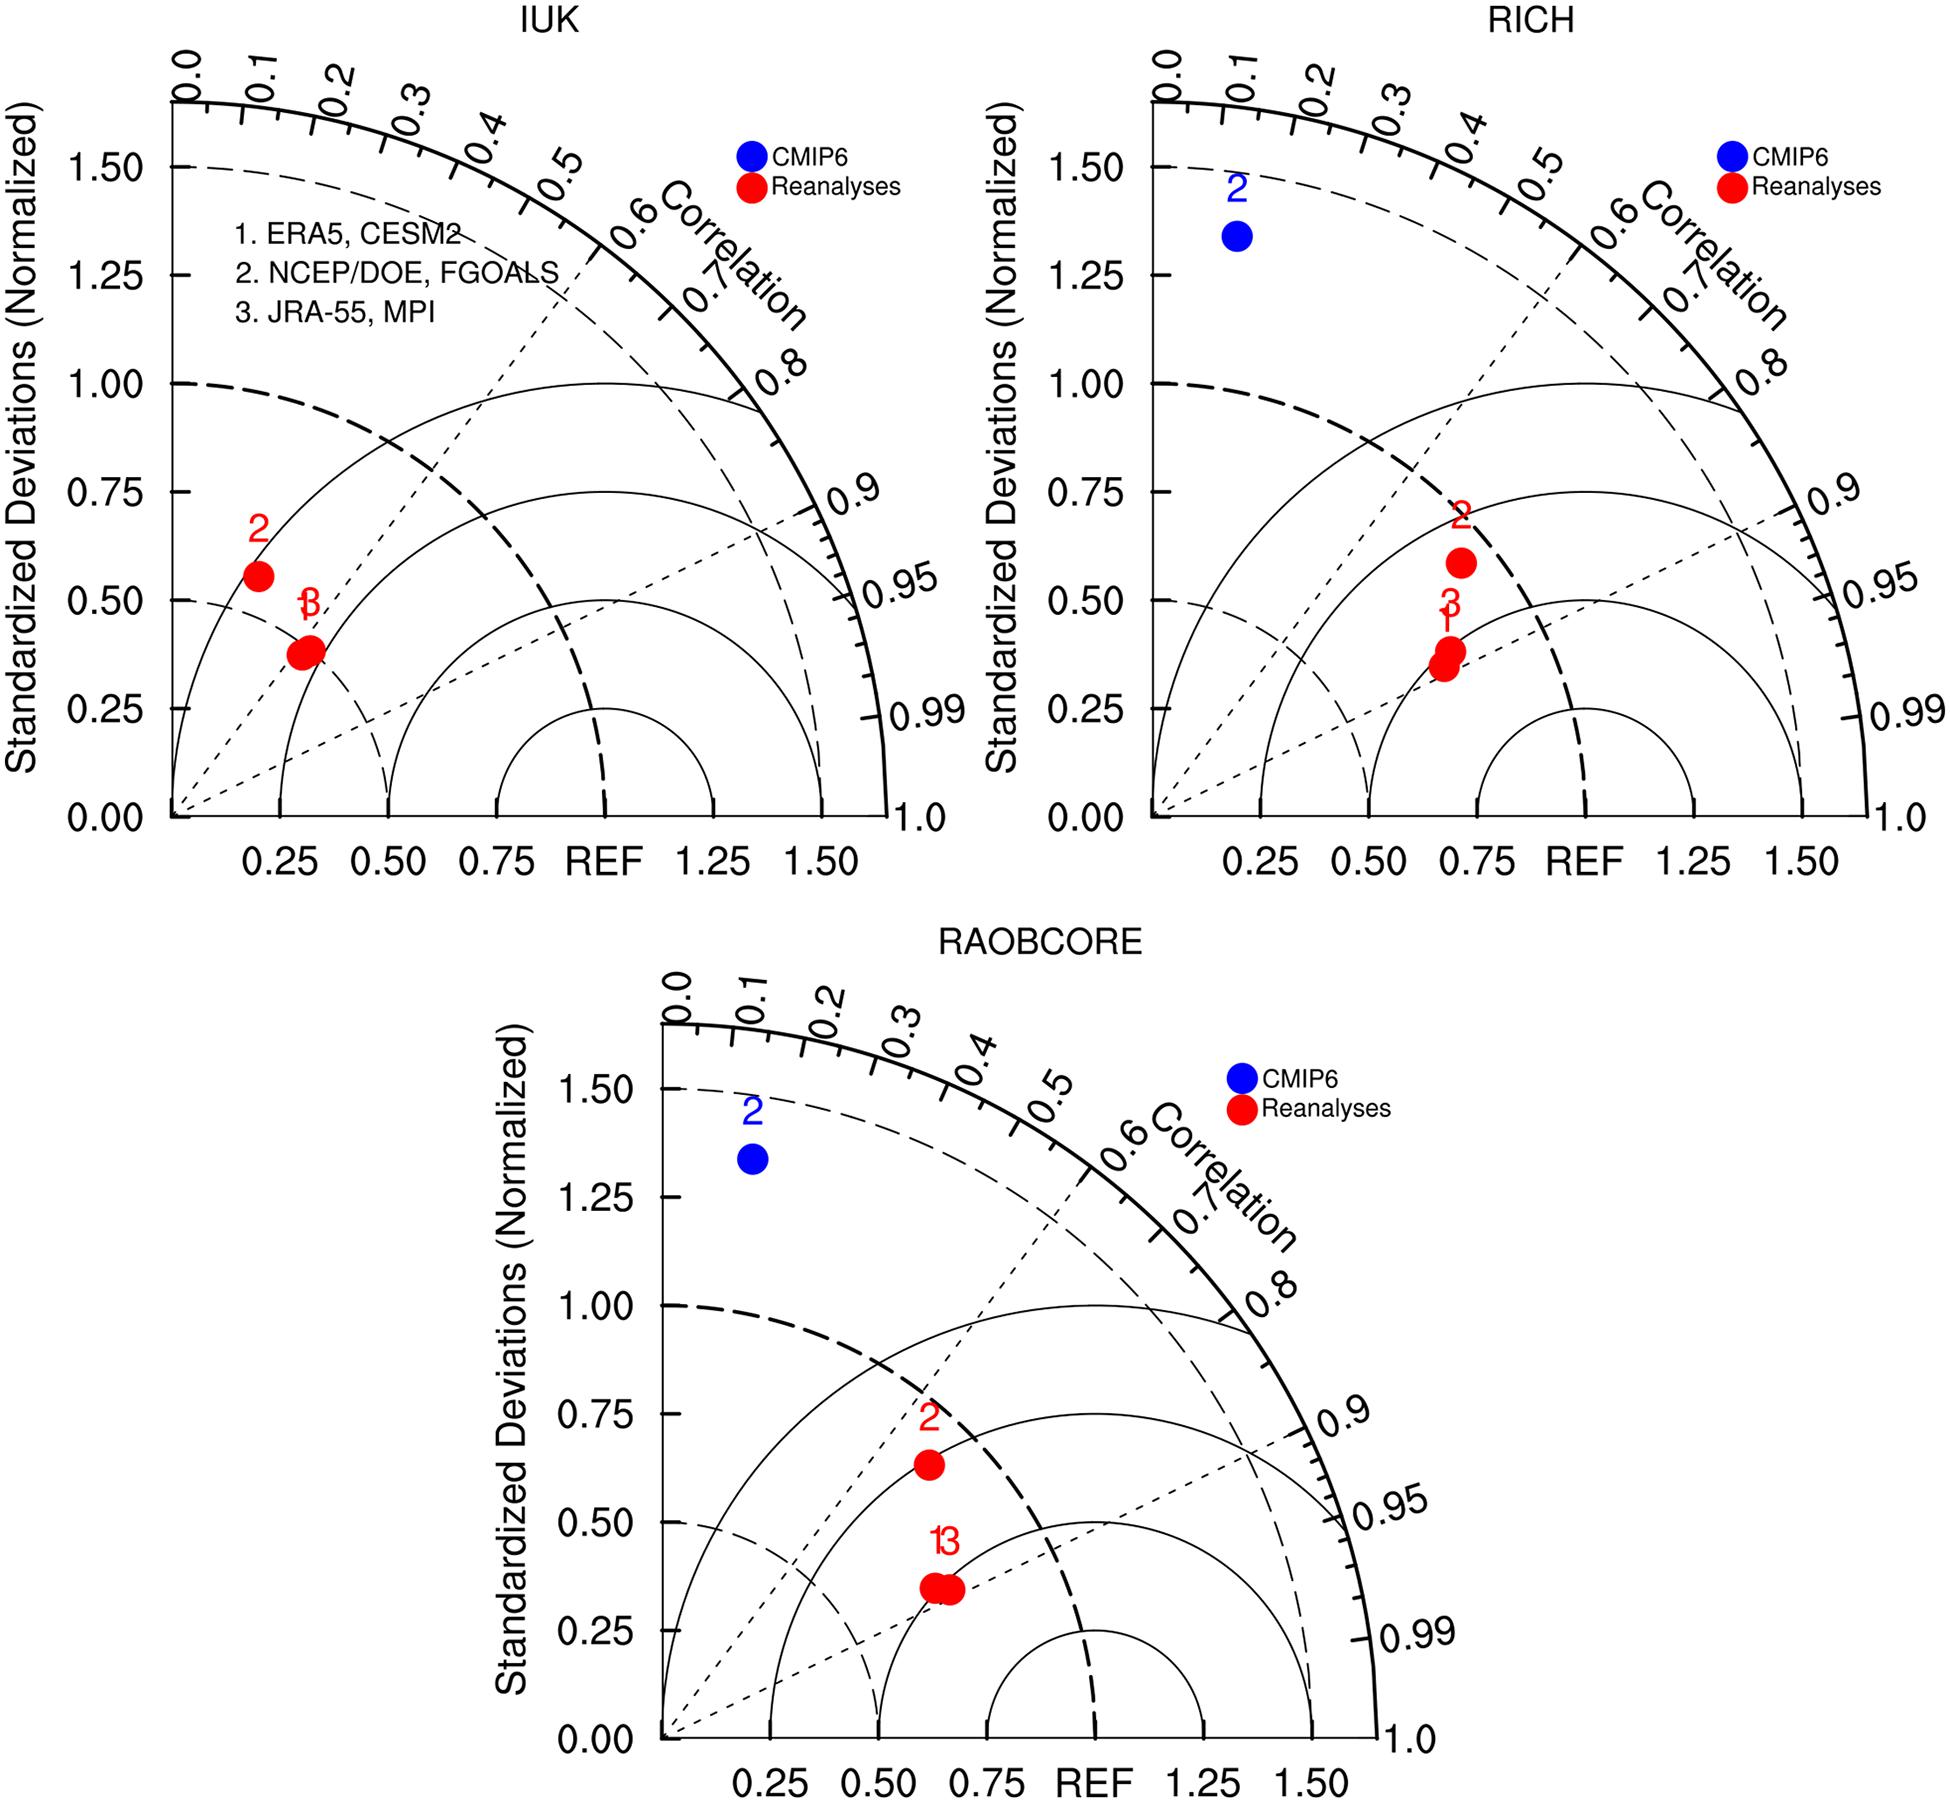
Figure 2. Taylor plot of the reanalysis data and model results with radiosonde data.
The maximum and minimum values of the TTI are inconsistent with their corresponding years (Figure 3), but the interannual fluctuations of summer land–sea thermal contrast in the reanalysis and radiosonde data are more consistent (Figures 3A,B). The TTI is relatively strong in 1981, 2000, and 2013 and weak in 1983, 1987, 1992, and 2011. Radiosonde data show an obvious increasing trend of summer thermal contrast (0.4 °C/dec), the reanalysis data have a slight increasing trend (0.1°C/dec), and models show no clear trend. The increasing trends of IUK, RICH, and RAOBCORE are 0.62°C/dec, 0.15°C/dec and 0.28°C/dec, respectively (Figure 4B), and the trends of JRA-55 (0.13°C/dec) and ERA5 (0.08°C/dec) are positive, while the NCEP/DOE (−0.07°C/dec) is negative. There is also a decreasing trend in the 1980s and an increasing trend in the 2000s in the reanalysis data. ERA5 shows improved quality compared with ERA-Interim and performs the best agreement with the Global Positioning System radio occultation (GPS RO) data for the 2002-2017 trends of upper troposphere and lower stratosphere (0.2–0.3°C/dec) (Shangguan et al., 2019). In our research we found that the ERAI trends are all stronger than the ERA. The upper troposphere in TP and TIO have warming trends in ERA5 and ERA-I, and the trend of the land-sea thermal contrasts of TTI are 0.08°C/dec and 0.15°C/dec, respectively (Figure omitted). After 1999, the warming bias of ERAI was obvious until 2006 due to the variation of data assimilation (Simmons et al., 2014).
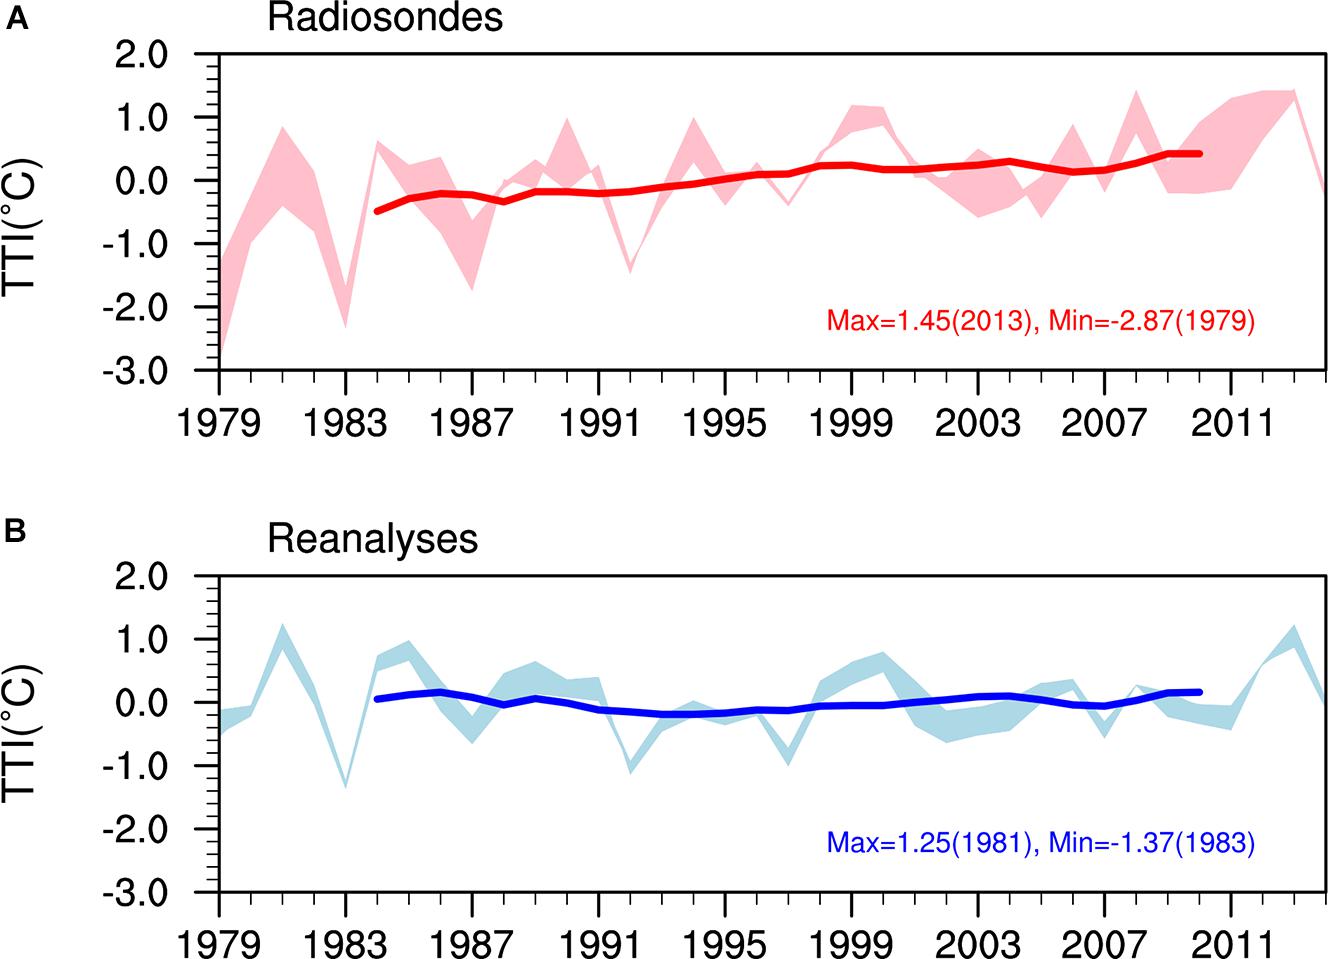
Figure 3. The interannual variations of the thermal contrasts TTI in Radiosondes (A) and Reanalyses (B) (solid lines represent 10-year running averaged of three datasets in each panel, and the shading represents the ensemble of the three datasets).
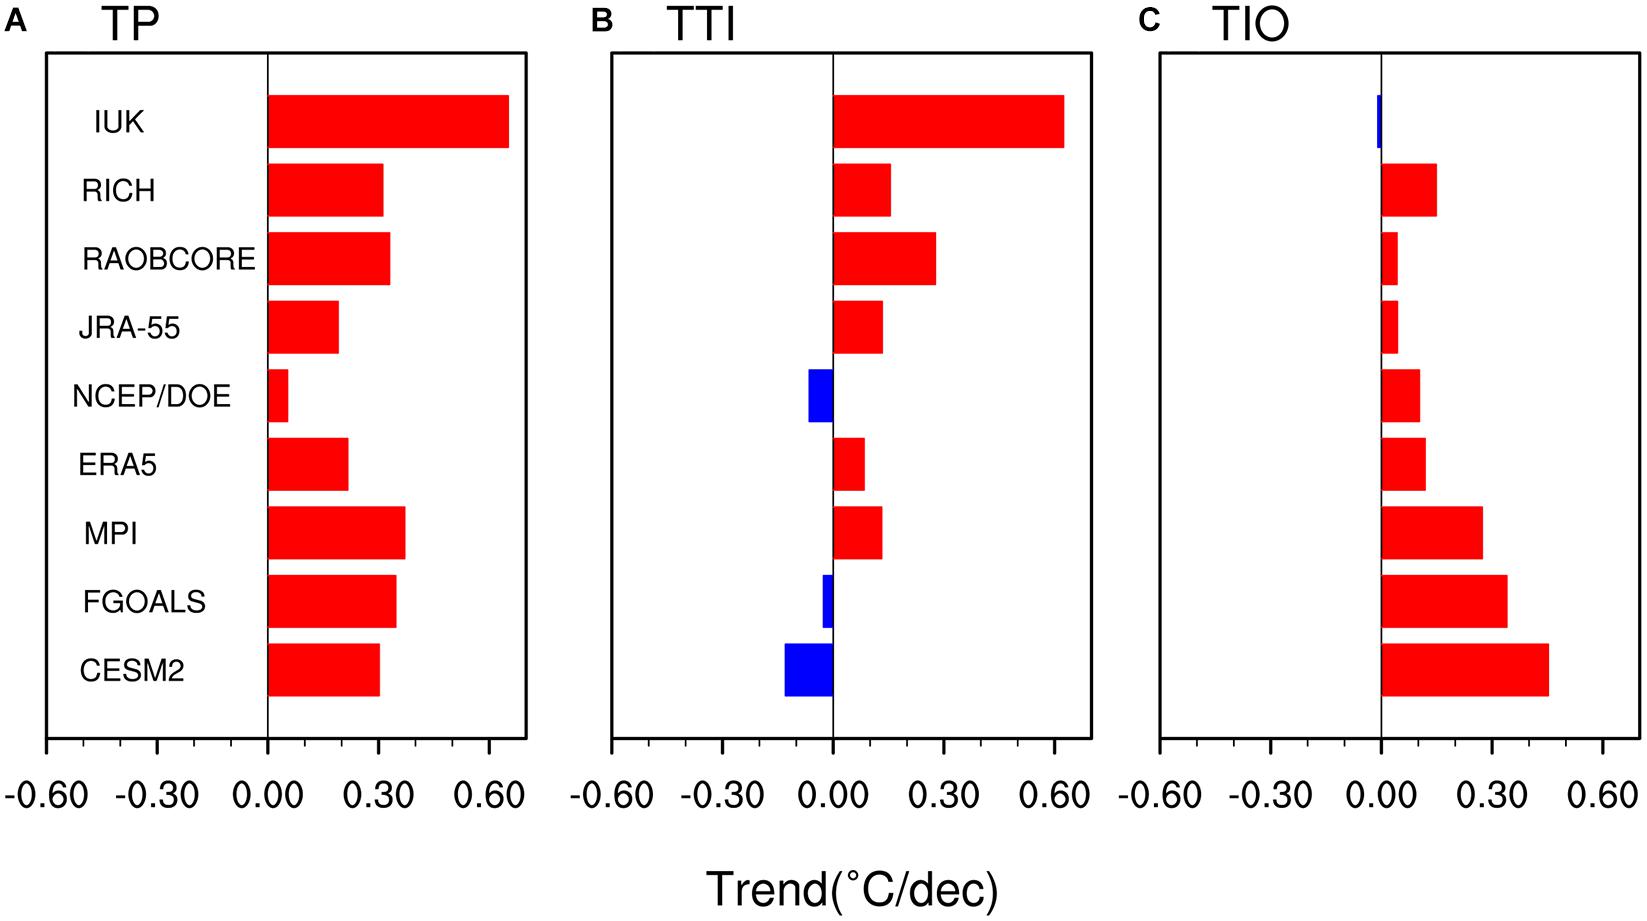
Figure 4. The trends for the (B) TTI and (A,C) the summer temperature at 400–200 hPa in the troposphere for TP and TIO, respectively (°C/dec).
All data show a warming trend in the summer temperature of the upper troposphere in the TP (Figure 4A), and in the TIO, except for the IUK data (Figures 4A,C). The warming of the summer temperature over the TP and the TIO has been noted in many previous studies (Zhao et al., 2015; Ming et al., 2019). Comparing the trend of the TP and TIO for radiosonde data, the thermal contrast is dominated by the TP heating. Under the background of global warming, the tropospheric temperature of the TP in summer increases faster than the TIO, which leads to the increasing land–sea thermal contrast. However, the simulation results of CESM2 and FGOALS show that the increasing temperature trend of the TIO was stronger than that of the TP, which led to the weakening of the thermal contrast.
The running linear trends (RLTs) of the thermal contrast of TTI show a similar fluctuation, especially after 1995, for reanalysis and radiosonde data (Figures 5A,B). Furthermore, the correlations of the RLTs all passed the significance test (Table 4), which further illustrates the similarity between the reanalysis and the radiosonde data in describing the land–sea thermal contrast. Figure 5 shows that the RLTs are positive, negative, and positive from approximately 1995–1999, 2003–2005, and 2006–2010, respectively, indicating that the land–sea thermal contrasts between the TP and the TIO increased in the 1990s and the late 2000s, and weakened in the early 2000s. The most rapid period of land–sea thermal contrast strengthening occurred in the 1990s. This is because the maximum of the RLT was in 1997, which indicates that from 1992 to 2001, especially from 1997 to 2000, the summer TP-TIO thermal contrast increased rapidly. The model results are very different from the reanalysis and radiosonde data (Figure 5), including the RLT after the 2000s.
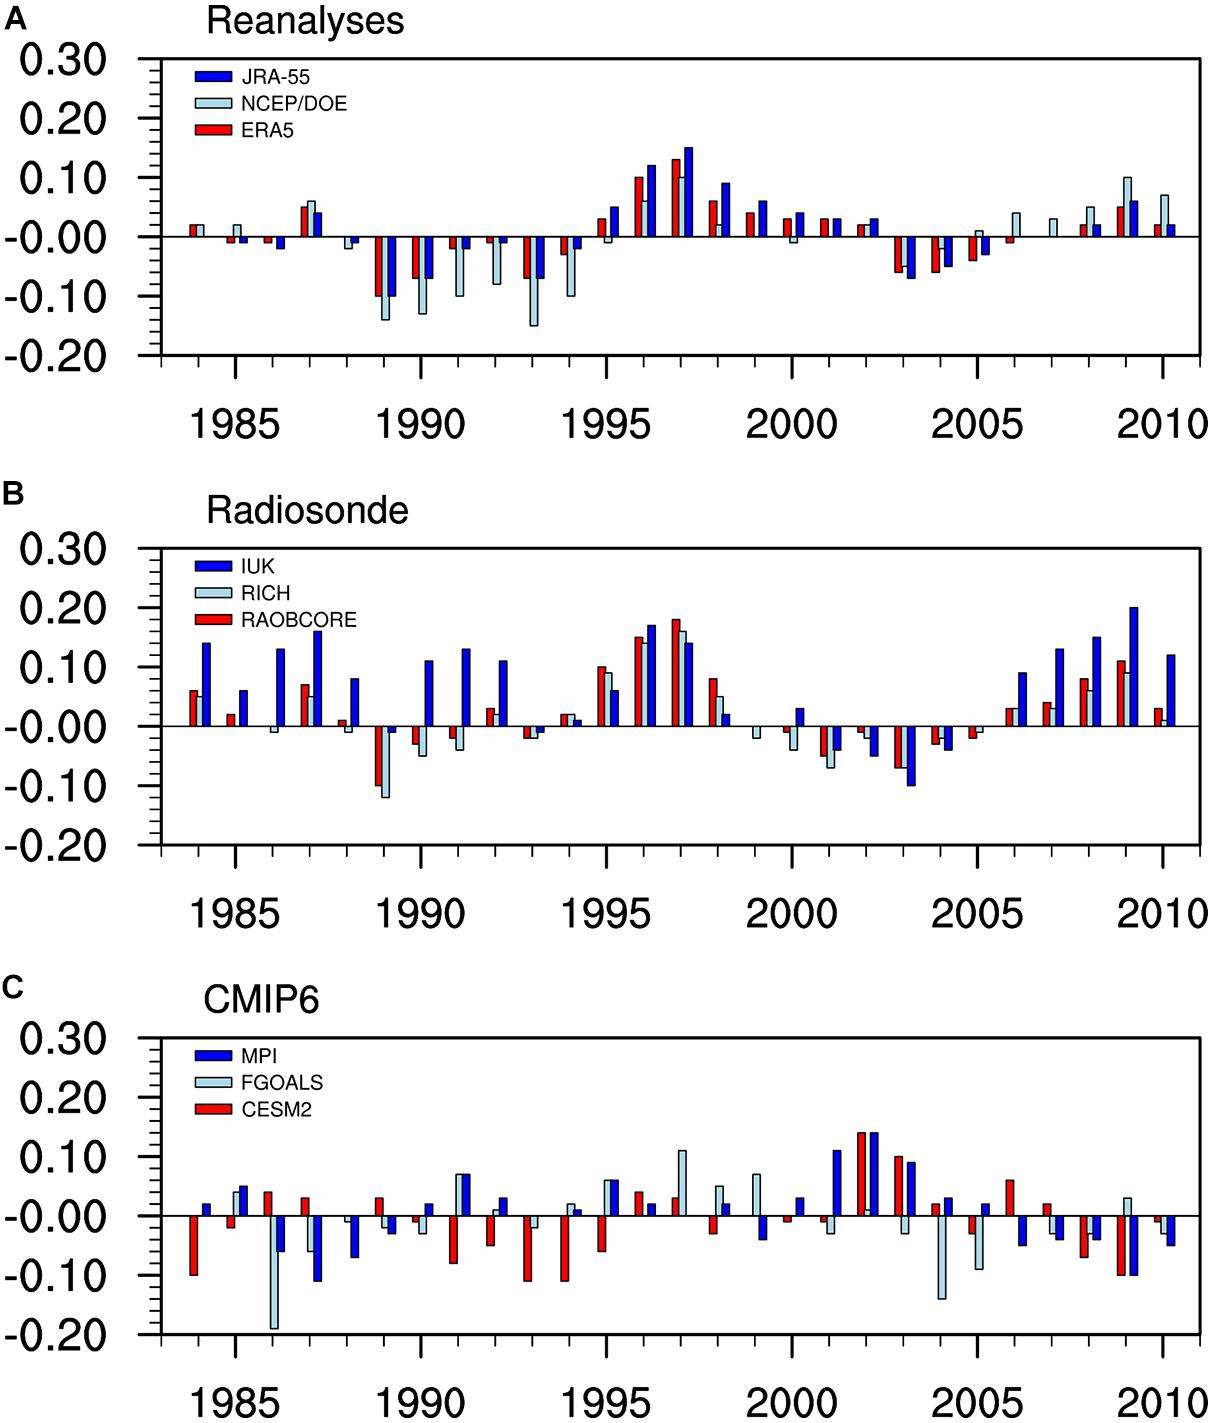
Figure 5. The RLTs of TTI (°C/dec) in Reanalyses (A), Radiosondes (B), and CMIP6 (C).
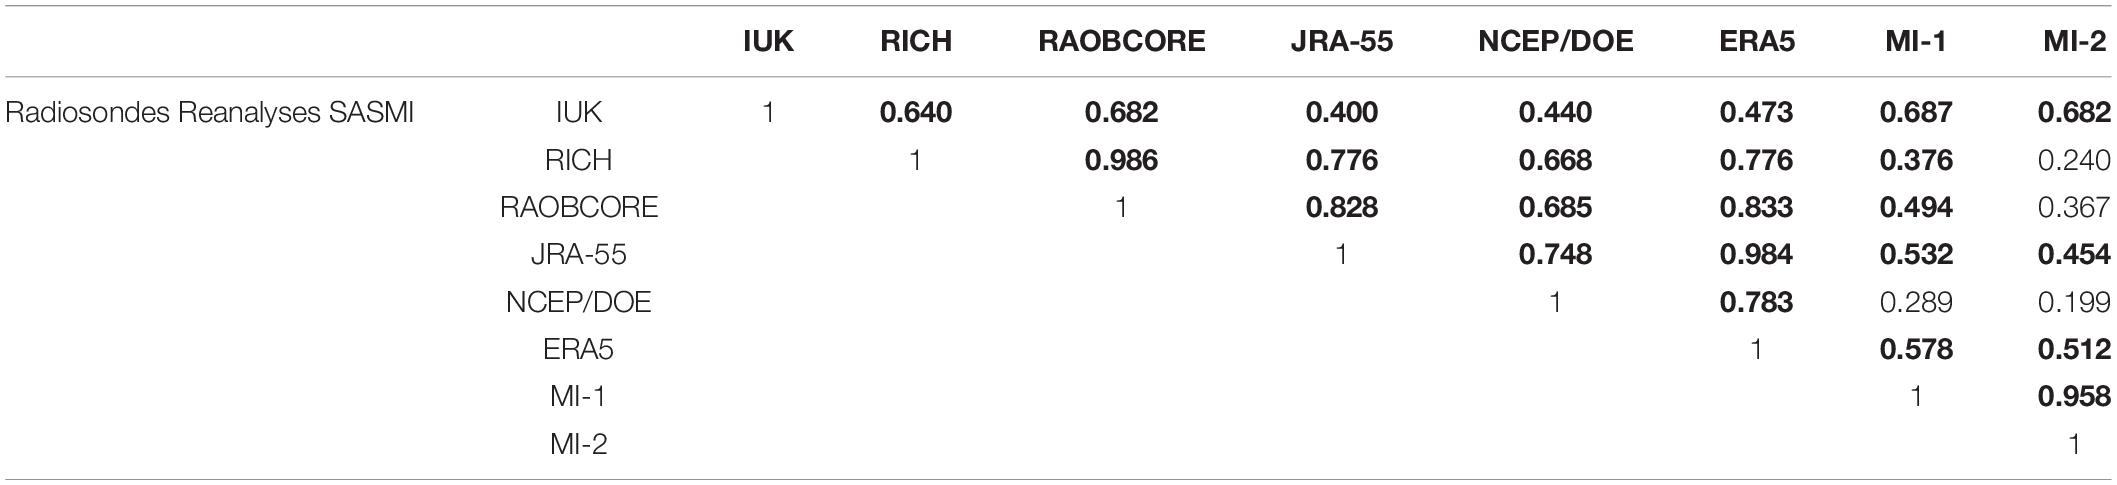
Table 4. Correlation of the RLTs of TTI between reanalysis data and radiosonde data the SASMIs (bold indicate a correlation coefficient above 0.37, representing a significance test at the 95% confidence level).
The land-sea thermal contrast is significantly positive correlation with SASM, and the interannual variations of the SASM indices (MI-1 and MI-2) and the land-sea thermal contrast index (TTI) are basically the same (Figure omitted). The RLTs of TTI is also consistent with the change of the SASMI (Figure 6). The RLTs calculated by the JRA-55, ERA5, IUK, and RAOBCORE have a strong positive correlation with MI-1 and MI-2, indicating that when the summer land–sea thermal contrast increased rapidly, the intensity of the SASM and the atmospheric baroclinic component also increased rapidly in the monsoon region, and vice versa. For example, from 1997 to 2000, the thermal contrasts in the TP-TIO region increased rapidly, accompanied by a rapid increasing intensity of the SASM. This was the time period when the El Niño–Southern Oscillation (ENSO) event changed from the strong warm phase to the strong cold phase. Figure 6 shows that the TTI weakened rapidly in the early 2000s (at about 2002–2006), and increased rapidly in the late 2000s (after 2007) with the rapid weakening and strengthening of the SASM. This is due to the fact that the RLTs of upper troposphere summer temperature in the TIO is greater than that in the TP in early 2000s, and smaller in the late 2000s (Figure omitted). We speculate that this interannual transition is likely to be related to the Pacific Decadal Oscillation (PDO). In the first period, the summer PDO index is a small positive value, while in the second period, the PDO index is a larger negative value. During positive PDO phases, the transport of moisture from the Bay of Bengal and the South China Sea to Eurasia is inhibited (Lyu, 2019), and Indian rainfall decrease with weaker SASM (Krishnan and Sugi, 2003), which accompanied by the weak thermal contrast in the TP-TIO (Luo et al., 2021). During positive PDO phases, the situation is almost opposite.
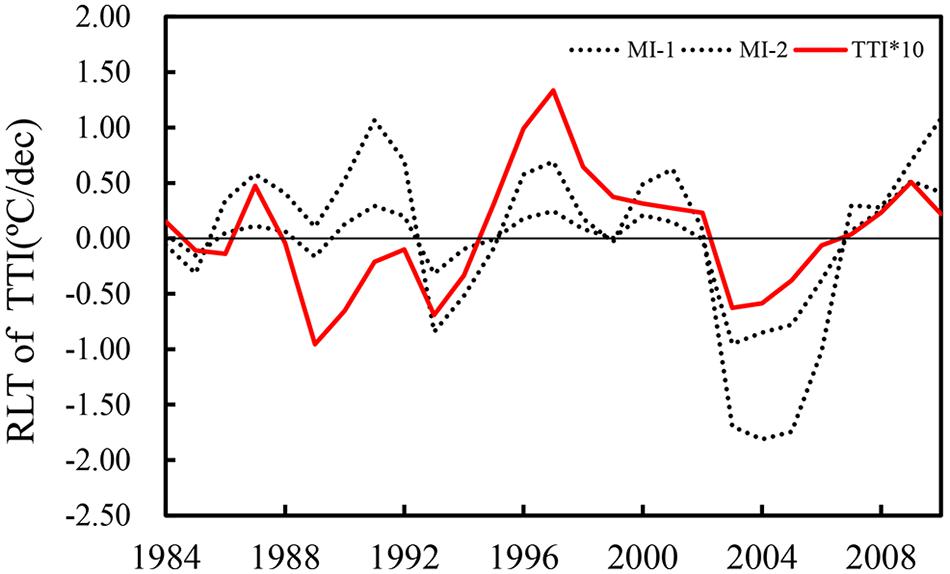
Figure 6. The RLTs of the (TTI, °C/dec) and SAMIs (MI1-1, MI-2) based on ERA5.
The vertical profiles of the summer temperature trend are quite different in the TP-TIO region (Figure 7). Radiosonde data, reanalysis data (except NCEP/DOE and IUK) and the model results all show that the temperature in the upper troposphere are increasing significantly in the TP-TIO region. In climate models, with increasing greenhouse gas concentrations, the surface and troposphere are consistently projected to warm, with an enhancement of that warming in the tropical upper troposphere (Thorne et al., 2011). Allen and Sherwood (2008) analyzed thermal winds and suggested a warming maximum in the tropical upper troposphere. The TP has a stronger warming trend in the upper troposphere than the TIO area for the radiosonde and reanalysis data (except for NCEP/DOE), while the model results generally display a significant warming, which is consistent with Figure 4C. The clear warm bias in CMIP6 in the troposphere has received a lot of attention (Li et al., 2020; McKitrick and Christy, 2020; Mitchell et al., 2020). Figure 7 also shows a warm bias in the upper troposphere. In the troposphere, the observed warming trends are located in the upper troposphere, which are correctly captured by FGOALS (Guo et al., 2020b). The CMIP6 historical simulations aim to evaluate the ability of models to reproduce the climate on various time scales (Guo et al., 2020b), and serve as important tools to determine consistency of climate model forcing and sensitivity with the observational record (Eyring et al., 2016; Srivastava et al., 2020). However, observational data are scarce in the upper troposphere, and the satellite data (Mears and Wentz, 2009) is inconsistent with the altitude selected in our research. In the absence of numerical simulation experiments, it is necessary to use the CMIP6 historical simulations for research. Of course, there are also some studies that have used models simulations to study interannual issues (Zhao et al., 2013, 2015). Therefore, we still use CMIP6 historical simulations for interannual scale analysis in this study.
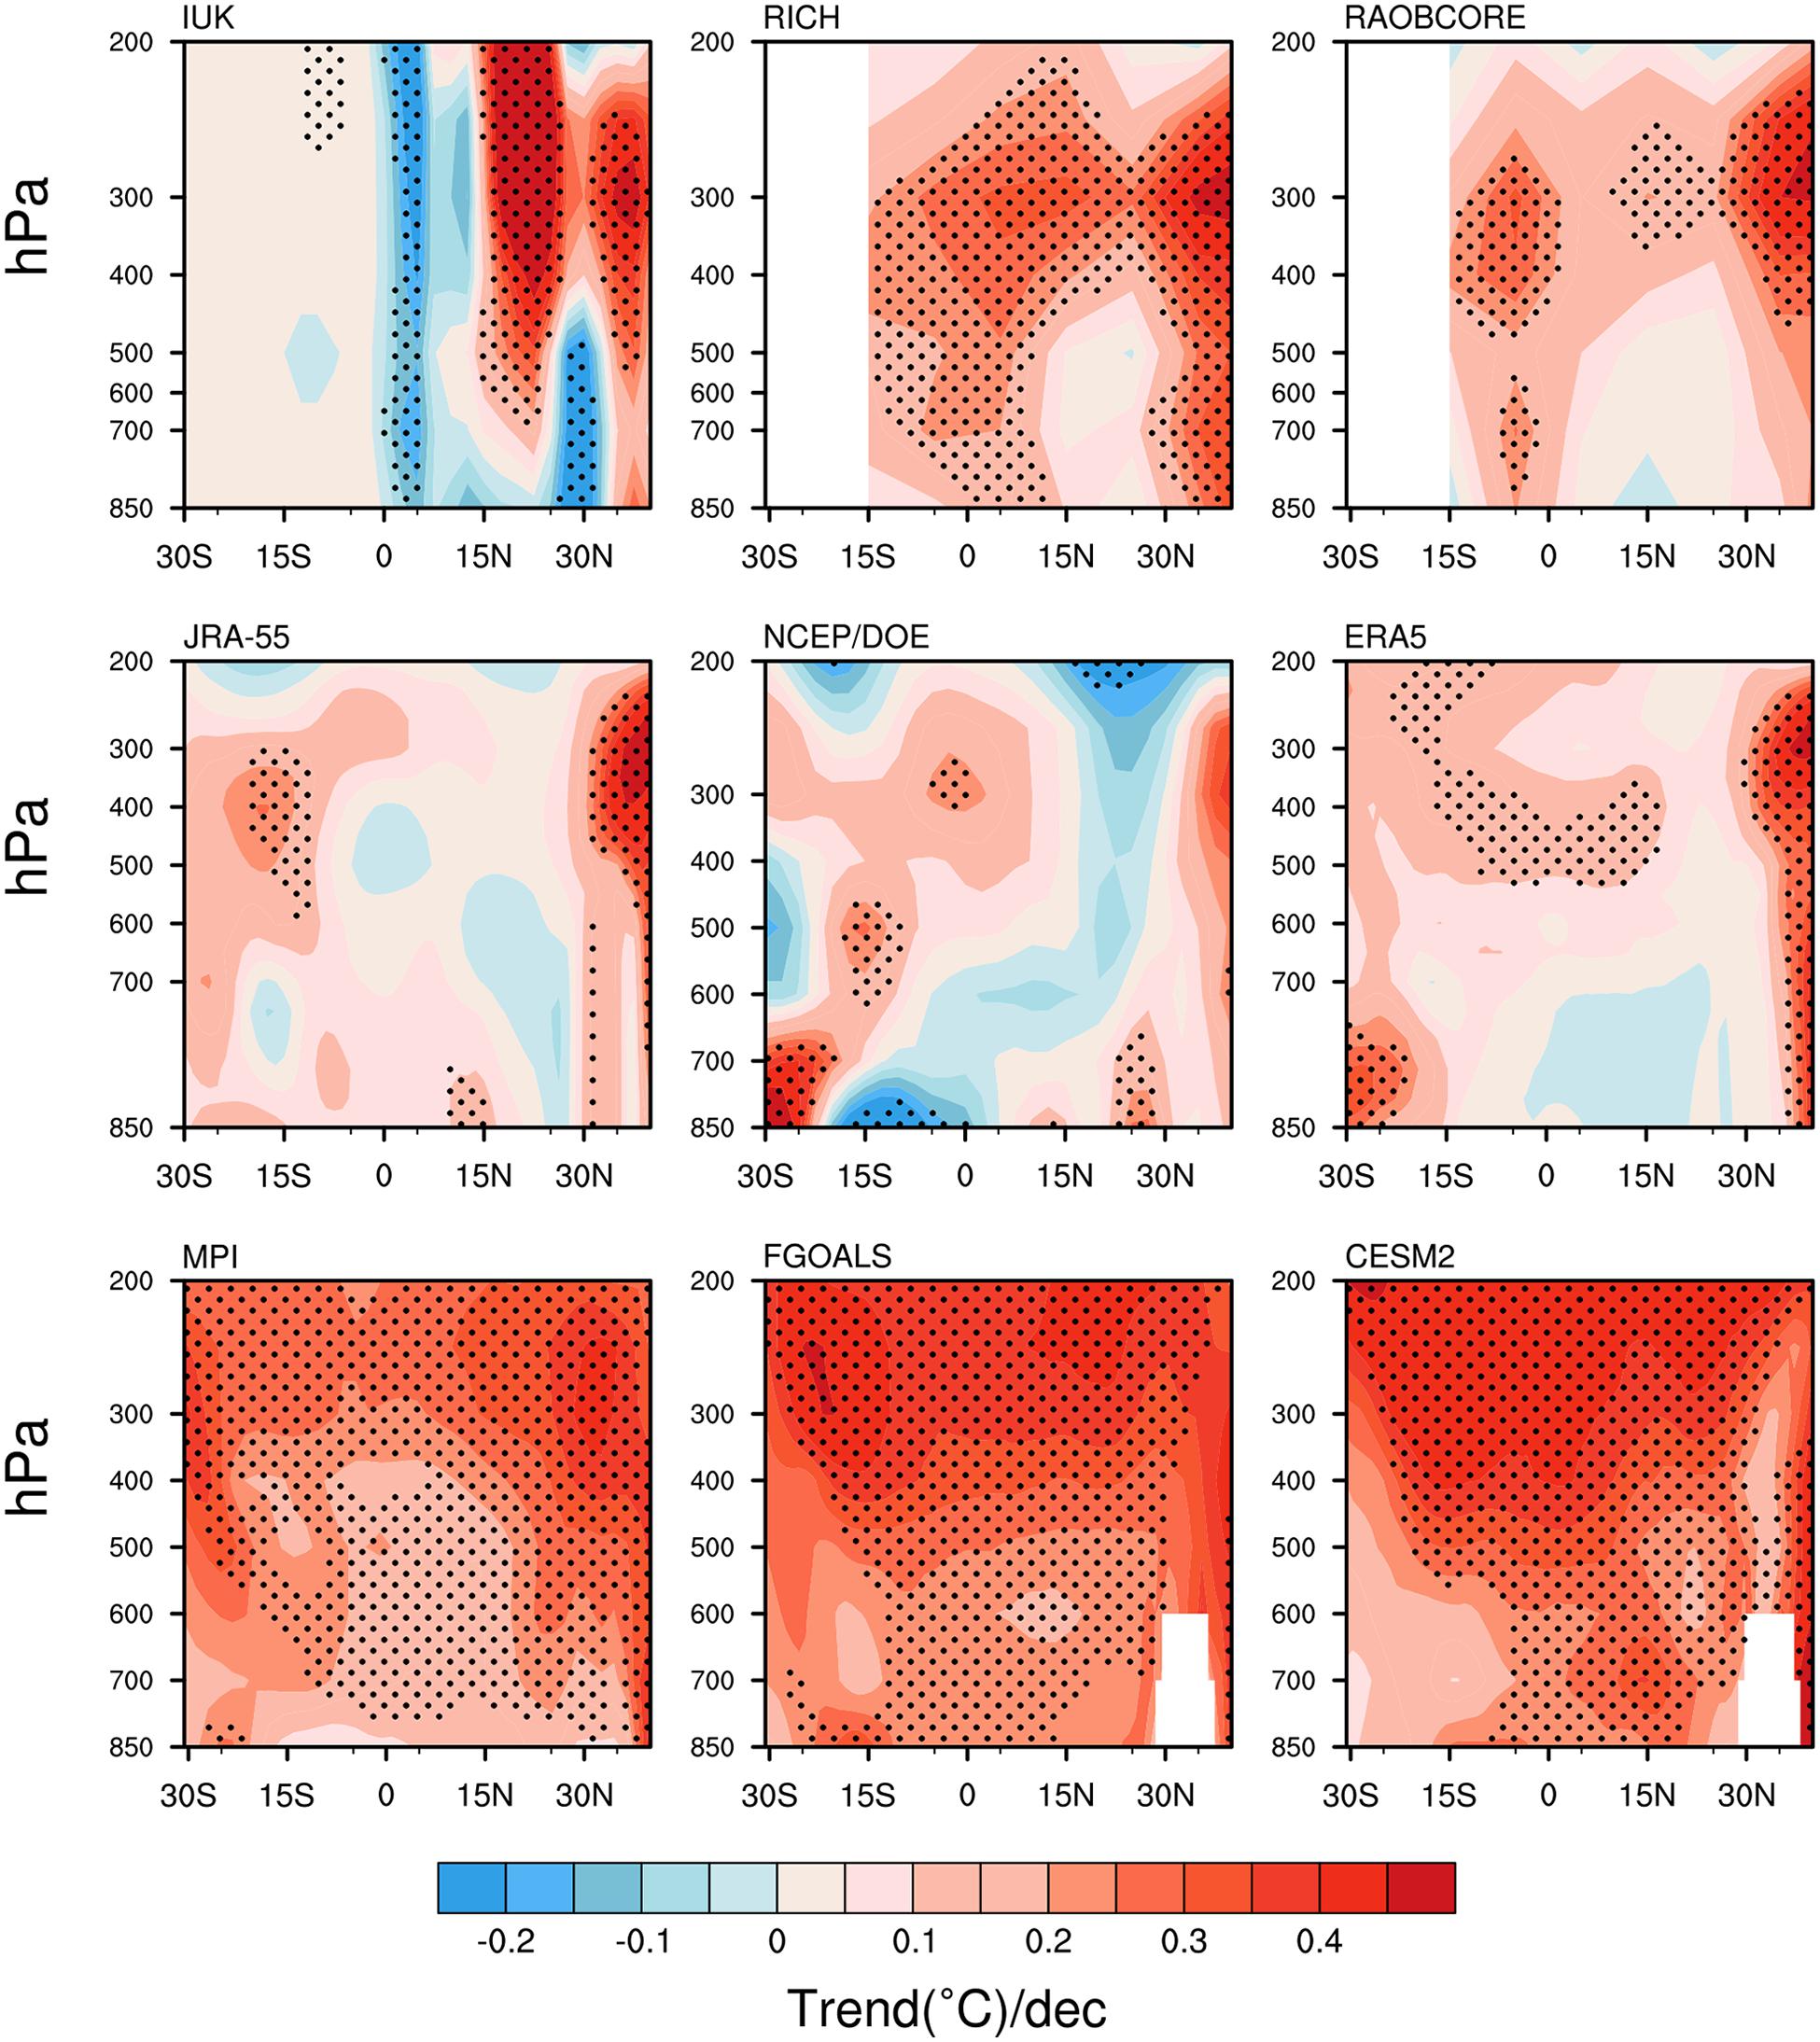
Figure 7. The vertical profile of the summer temperature trend at 80°E–100°E (°C/dec).
With the accelerated global warming over the past 100 years (Xu et al., 2018), research of the land–sea thermal contrast has received much more attention (Li and Yanai, 1996; Sun et al., 2010; Dai et al., 2013). The present study used a summer meridional land–sea thermal contrast index (TTI) to study the discrepancies in nine datasets in the summer thermal contrasts of the TP-TIO region for the upper troposphere. We also analyzed the relationship between the interannual variations of TTI with the two SASMIs. The results are as follows.
(1) There are great differences in the reanalysis data (JRA-55, NCEP/DOE, ERA5), radiosonde data (IUK, RICH, and RAOBCORE) and CMIP6 model results (MPI, FGOALS, CESM2) describing the basic characteristics (e.g., maximum, minimum, and standard deviation) of the thermal contrasts in the TP-TIO region. The maximum and minimum of the TTI varied from one dataset to another. The IUK data were relatively scattered, while the ERA5 were the most concentrated. The IUK results were significantly different from RAOBCORE and RICH due to the different homogenization methods applied. The reanalysis data were significantly correlated with the radiosonde data, with JRA-55 and ERA5 data the most significant.
(2) The radiosonde data showed a clear increasing trend in the summer thermal contrast, and the reanalysis data had a slight increasing trend, whereas the models showed no obvious trend. The TP-TIO region showed a warming trend in the upper troposphere in most of the data. The intensity of the thermal contrast was dominated by the TP heating in the radiosonde data, while CESM2 and FGOALS showed that the increasing temperature trend of the TIO was stronger than that of the TP, which led to the weakening of the thermal contrast.
(3) The RLTs of TTI shows a similar fluctuation, especially after 1995 for reanalysis and radiosonde data. In the 1990s and the late 2000s, the land–sea thermal contrasts increased, while they weakened in the early 2000s. This interannual variation may modulated by the decadal signals such as Pacific Decadal Oscillation (PDO). The most rapid strengthening period in the land–sea thermal contrast occurred in the 1990s.
(4) For the reanalysis and radiosonde data, the TTI was significantly positively correlated with the intensity of the SASM, as well as the RLTs. This suggests that if the meridional thermal contrast between the TP and the TIO increases rapidly, the intensity of the SASM also increases abruptly. The vertical profiles of the summer temperature trend are quite different in the TP-TIO region, and CMIP6 shows a warm bias in the upper troposphere
There is a strong correlation between the intensity of the SASM and the meridional land–sea thermal contrasts in the TP-TIO region, while the value of the TTI varies greatly between different datasets. The reanalysis and radiosonde data are inconsistent in describing the interannual variations of the TTI. The radiosonde observations have been used to create long-term global upper-air temperature datasets, which figure prominently in studies of large-scale climate variability and change (Seidel et al., 2004). However, the radiosonde stations are sparse, especially over the oceans of the southern hemisphere (Thorne et al., 2011), resulting in the deviations in the TTI calculations. Many studies have therefore used a variety of tools to detect and adjust the non-climatic artifacts in the radiosonde data (Allen and Sherwood, 2008; Zhou et al., 2020). The possible reason for the large differences in the results of the CMIP model simulation and reanalysis is that the climate models have a strong warm bias in the upper troposphere (Zhao et al., 2016). The overestimation of both the climate feedbacks and the aerosol forcing can result in a historical warming to the present day that is similar to the observations, but has a poor temporal agreement with the observations. Another key point is that the relative contribution of the TP and TIO to the land–sea thermal contrasts is not clear and, like in the present study, the contribution of the TP or the TIO to the TTI changes with the data. In future work, we plan to collect multiple data (Guo et al., 2020a) to solve this problem.
The original contributions presented in the study are included in the article/supplementary material, further inquiries can be directed to the corresponding author.
JX proposed an idea and revised the article. XL was responsible for data processing and manuscript writing. KL was responsible for manuscript writing and format checking. All authors contributed to the article and approved the submitted version.
This research was supported by the Second Tibetan Plateau Scientific Expedition and Research (STEP) program (No. 2019QZKK0105), the Strategic Priority Research Program of Chinese Academy of Sciences (No. XDA20060501), and the 2019 Non-funded Science and Technology Research Project of Zhanjiang (No. 20051817454-6338). The data providers are University of Vienna, Climate Change Research Centre, University of New South Wales Sydney, European Centre for Medium Range Weather Forecasts, Japan Meteorological Agency, National Centers for Environmental Prediction Department of Energy, National Center for Atmospheric Research, Chinese Academy of Sciences, and Max Planck Institute for Meteorology.
The authors declare that the research was conducted in the absence of any commercial or financial relationships that could be construed as a potential conflict of interest.
Webster, P. J., Magana, V. O., Palmer, T. N., Shukla, J., Tomas, R. A., Yanai, M. U., et al. (1998). Monsoons: Processes, predictability, and the prospects for prediction. Journal of Geophysical Research: Oceans 1031, 14451–14510. doi: 10.1029/97jc02719
Wu, G. X., Duan, A. M., Liu, Y. M., Yan, J., Liu, B., Ren, S., et al. (2013). Recent advances in the study on the dynamics of the Asian summer monsoon onset. Chinese Journal of Atmospheric Sciences 37, 211–228. (in Chinese),
Li, C., and Yanai, M. (1996). The onset and interannual variability of the Asian summer monsoon in relation to land–sea thermal contrast[J]. Journal of Climate 9, 358–375. doi: 10.1175/1520-0442(1996)009<0358:toaivo>2.0.co;2
Sun, Y., Ding, Y., and Dai, A. (2010). Changing links between South Asian summer monsoon circulation and tropospheric land−sea thermal contrasts under a warming scenario[J]. Geophy. Res. Lett. 37, L02704.
Zhang, Y., Fan, G., Hua, W., Zhang, Y., Wang, B., and Lai, X. (2017). Differences in atmospheric heat source between the Tibetan Plateau–South Asia region and the southern Indian Ocean and their impacts on the Indian summer monsoon outbreak[J]. Journal of Meteorological Research 31, 540–554. doi: 10.1007/s13351-017-6042-5
Luo, X. Q., Xu, J. J., Zhang, Y., and Li, K. (2021). Relationship between the Tibetan Plateau–Tropical Indian Ocean Thermal Contrast and the South Asian Summer Monsoon[J]. Frontiers of Earth Science doi: 10.1007/s11707-020-0846-9 ∗Q,
Qian, Y. F., Jiang, J., Zhang, Y., Yao, Y. H., and Xu, Z. F. (2004). The earliest onset area of the tropical Asian summer monsoon and its mechanisms[J]. Acta Meteorologica Sinica 42, 129–139. (in Chinese),
Qi, L., He, J. H., Zhang, Z. Q., and Song, J. N. (2007). Seasonal transition of zonal land-sea thermal contrast and East Asian subtropical monsoon circulation [J]. Chinese Science Bulletin 52, 2895–2899. Chinese,
Si, D., Zhao, P., and Wang, M. (2019). Inter−decadal change of the middle−upper tropospheric land–sea thermal contrast in the late 1990s and the associated Northern Hemisphere hydroclimate[J]. International Journal of Climatology 39, 3271–3281. doi: 10.1002/joc.6017
He, H., Sui, C. H., Jian, M., Wen, Z., and Lan, G. (2003). The evolution of tropospheric temperature field and its relationship with the onset of Asian summer monsoon[J]. Journal of the Meteorological Society of Japan. Ser. II 81, 1201–1223. doi: 10.2151/jmsj.81.1201
Dai, A., Li, H., Sun, Y., Hong, L. C., Chou, C., and Zhou, T. (2013). The relative roles of upper and lower tropospheric thermal contrasts and tropical influences in driving Asian summer monsoons[J]. Journal of Geophysical Research: Atmospheres 118, 7024–7045. doi: 10.1002/jgrd.50565
Wang, P. X., Wang, B., Cheng, H., Fasullo, J., Guo, Z., Kiefer, T., et al. (2017). The global monsoon across time scales: Mechanisms and outstanding issues. Earth-Science Reviews 174, 84–121. doi: 10.1016/j.earscirev.2017.07.006
Boos, W. R., and Kuang, Z. (2010). Dominant control of the South Asian monsoon by orographic insulation versus plateau heating[J]. Nature 463, 218–222. doi: 10.1038/nature08707
Holton, J. R. (2004). in An Introduction to Dynamic Meteorology: International Geophysics Series, 4th Edn, Vol. 88, eds R. Dmowska, J. R. Holton, and H. T. Rossby (Cambridge, MA: Elsevier Academic press), 535.
IPCC (2014). “Climate Change 2014: Synthesis Report,” in Contribution of Working Groups I, II and III to the Fifth Assessment Report of the Intergovernmental Panel on Climate Change, eds Core Writing Team, Pachauri, R. K., and Meyer, L. A. (Geneva: IPCC), 151.
Thorne, P. W., Lanzante, J. R., Peterson, T. C., Seidel, D. J., and Shine, K. P. (2011). Tropospheric temperature trends: History of an ongoing controversy[J]. Wiley Interdisciplinary Reviews: Climate Change 2, 66–88. doi: 10.1002/wcc.80
Guo, Y., Weng, F., Wang, G., and Xu, W. (2020a). The Long-Term Trend of Upper-Air Temperature in China Derived from Microwave Sounding Data and Its Comparison with Radiosonde Observations[J]. Journal of Climate 33, 7875–7895. doi: 10.1175/jcli-d-19-0742.1
Seidel, D. J., Angell, J. K., Christy, J., Free, M., Klein, S. A., Lanzante, J. R., et al. (2004). Uncertainty in signals of large-scale climate variations in radiosonde and satellite upper-air temperature datasets[J]. Journal of Climate 17, 2225–2240. doi: 10.1175/1520-0442(2004)017<2225:uisolc>2.0.co;2
Ming, S. H., Qin, Z. K., and Huang, Y. (2019). Satellite data reveals the trend of the upper troposphere temperature over the Tibetan Plateau[J]. Plateau Meteorology 38, 264–277.
Zhao, L., Xu, J., Powell, A. M., and Jiang, Z. (2015). Uncertainties of the global-to-regional temperature and precipitation simulations in CMIP5 models for past and future 100 years[J]. Theoretical and applied climatology 122, 259–270. doi: 10.1007/s00704-014-1293-x
Shangguan, M., Wang, W., and Jin, S. (2019). Variability of temperature and ozone in the upper troposphere and lower stratosphere from multi-satellite observations and reanalysis data[J]. Atmospheric Chemistry and Physics 19, 6659–6679. doi: 10.5194/acp-19-6659-2019
Guo, P. W., Shen, C., Dong, L. N., Zhang, P. Q., and Yin, Y. W. (2017). The observation analysis and simulation valuations of land-sea thermal contrast over Asian monsoon region[J]. Trans Atmos Sci 40, 215–223. (in Chinese),
Sherwood, S. C., Meyer, C. L., Allen, R. J., and Titchner, H. A. (2008). Robust tropospheric warming revealed by iteratively homogenized radiosonde data[J]. Journal of Climate 21, 5336–5352. doi: 10.1175/2008jcli2320.1
Haimberger, L. (2007). Homogenization of radiosonde temperature time series using innovation statistics[J]. Journal of Climate 20, 1377–1403. doi: 10.1175/jcli4050.1
Haimberger, L., Tavolato, C., and Sperka, S. (2008). Toward elimination of the warm bias in historic radiosonde temperature records—Some new results from a comprehensive intercomparison of upper-air data[J]. Journal of Climate 21, 4587–4606. doi: 10.1175/2008jcli1929.1
Haimberger, L., Tavolato, C., and Sperka, S. (2012). Homogenization of the global radiosonde temperature dataset through combined comparison with reanalysis background series and neighboring stations[J]. Journal of Climate 25, 8108–8131. doi: 10.1175/jcli-d-11-00668.1
Pattantyús-Ábrahám, M., and Steinbrecht, W. (2015). Temperature trends over Germany from homogenized radiosonde data[J]. Journal of Climate 28, 5699–5715. doi: 10.1175/jcli-d-14-00814.1
Free, M. (2011). The seasonal structure of temperature trends in the tropical lower stratosphere[J]. Journal of climate 24, 859–866. doi: 10.1175/2010jcli3841.1
Kobayashi, S., Ota, Y., Harada, Y., Ebita, A., Moriya, M., Onoda, H., et al. (2015). The JRA-55 reanalysis: General specifications and basic characteristics[J]. Journal of the Meteorological Society of Japan. Ser. II 93, 5–48. doi: 10.2151/jmsj.2015-001
Kanamitsu, M., Ebisuzaki, W., Woollen, J., Yang, S. K., Hnilo, J. J., Fiorino, M., et al. (2002). Ncep–doe amip-ii reanalysis (r-2)[J]. Bulletin of the American Meteorological Society 83, 1631–1644. doi: 10.1175/bams-83-11-1631(2002)083<1631:nar>2.3.co;2
Chen, G., Iwasaki, T., Qin, H., and Sha, W. (2014). Evaluation of the warm-season diurnal variability over East Asia in recent reanalyses JRA-55, ERA-Interim, NCEP CFSR, and NASA MERRA[J]. Journal of climate 27, 5517–5537. doi: 10.1175/jcli-d-14-00005.1
Harada, Y., Kamahori, H., Kobayashi, C., Endo, H., Kobayashi, S., Ota, Y., et al. (2016). The JRA-55 Reanalysis: Representation of atmospheric circulation and climate variability[J]. Journal of the Meteorological Society of Japan. Ser. II 94, 269–302. doi: 10.2151/jmsj.2016-015
Hersbach, H., Bell, B., Berrisford, P., Hirahara, S., Horányi, A., Muñoz-Sabater, J., et al. (2020). The ERA5 global reanalysis[J]. Quarterly Journal of the Royal Meteorological Society 146, 1999–2049.
Mauritsen, T., Bader, J., Becker, T., Behrens, J., Bittner, M., Brokopf, R., et al. (2019). Developments in the MPI−M Earth System Model version 1.2 (MPI−ESM1. 2) and its response to increasing CO2[J]. Journal of Advances in Modeling Earth Systems 11, 998–1038.
He, B., Bao, Q., Wang, X., Zhou, L., Wu, X., Liu, Y., et al. (2019). CAS FGOALS-f3-L model datasets for CMIP6 historical atmospheric model Intercomparison project simulation[J]. Advances in Atmospheric Sciences 36, 771–778. doi: 10.1007/s00376-019-9027-8
Danabasoglu, G., Lamarque, J. F., Bacmeister, J., Bailey, D. A., DuVivier, A. K., Edwards, J., et al. (2020). The Community Earth System Model version 2 (CESM2)[J]. Journal of Advances in Modeling Earth Systems 12, e2019MS001916.
Tokarska, K. B., Stolpe, M. B., Sippel, S., Fischer, E. M., Smith, C. J., Lehner, F., et al. (2020). Past warming trend constrains future warming in CMIP6 models[J]. Science advances 6, eaaz9549. doi: 10.1126/sciadv.aaz9549
Eyring, V., Bony, S., Meehl, G. A., Senior, C. A., Stevens, B., Stouffer, R. J., et al. (2016). Overview of the Coupled Model Intercomparison Project Phase 6 (CMIP6) experimental design and organization[J]. Geoscientific Model Development 9, 1937–1958. doi: 10.5194/gmd-9-1937-2016
Wang, B., and Fan, Z. (1999). Choice of South Asian summer monsoon indices[J]. Bulletin of the American Meteorological Society 80, 629–638. doi: 10.1175/1520-0477(1999)080<0629:cosasm>2.0.co;2
Li, J., and Zeng, Q. (2002). A unified monsoon index[J]. Geophysical Research Letters 29, 1151–1154.
Webster, P. J., and Yang, S. (1992). Monsoon and Enso: Selectively Interactive Systems. Quarterly Journal of the Royal Meteorological Society 118, 877–926. doi: 10.1002/qj.49711850705
Li, J. P., and Zeng, Q. C. (2003). A new monsoon index and the geographical distribution of the global monsoons[J]. Advances in Atmospheric Sciences 20, 299–302. doi: 10.1007/s00376-003-0016-5
Xu, J. J., and Chan, J. C. L. (2002). Relationship between the planetary−scale circulation over East Asia and the intensity of the South Asian Summer Monsoon. Geophysical Research Letters 29, 1866.
Zhao, L., Xu, J., and Powell, A. M. Jr. (2013). Discrepancies of surface temperature trends in the CMIP5 simulations and observations on the global and regional scales[J]. Climate of the Past Discussions 9, 6161–6178.
Simmons, A. J., Poli, P., Dee, D. P., Berrisford, P., Hersbach, H., Kobayashi, S., et al. (2014). Estimating low-frequency variability and trends in atmospheric temperature using ERA-Interim[J]. Quarterly Journal of the Royal Meteorological Society 140, 2014.
Lyu, L. (2019). Tree rings reveal hydroclimatic fingerprints of the Pacific Decadal Oscillation on the Tibetan Plateau[J]. Climate Dynamics 53, 1023–1037. doi: 10.1007/s00382-019-04629-z
Krishnan, R., and Sugi, M. (2003). Pacific decadal oscillation and variability of the Indian summer monsoon rainfall[J]. Climate Dynamics 21, 233–242. doi: 10.1007/s00382-003-0330-8
Allen, R. J., and Sherwood, S. C. (2008). Warming maximum in the tropical upper troposphere deduced from thermal winds[J]. Nature Geoscience 1, 399–403. doi: 10.1038/ngeo208
McKitrick, R., and Christy, J. (2020). Pervasive Warming Bias in CMIP6 Tropospheric Layers[J]. Earth and Space Science 7, e2020EA001281.
Mitchell, D. M., Lo, Y. T. E., Seviour, W. J. M., Haimberger, L., and Polvani, L. M. (2020). The vertical profile of recent tropical temperature trends: Persistent model biases in the context of internal variability[J]. Environmental Research Letters 15, 1040b4. doi: 10.1088/1748-9326/ab9af7
Li, J. L. F., Xu, K. M., Jiang, J. H., Lee, W. L., Wang, L. C., Yu, J. Y., et al. (2020). An Overview of CMIP5 and CMIP6 Simulated Cloud Ice, Radiation Fields, Surface Wind Stress, Sea Surface Temperatures, and Precipitation Over Tropical and Subtropical Oceans[J]. Journal of Geophysical Research: Atmospheres 125, e2020JD032848.
Guo, Y., Yu, Y., Lin, P., Liu, H., He, B., Bao, Q., et al. (2020b). Overview of the CMIP6 Historical Experiment Datasets with the Climate System Model CAS FGOALS-f3-L[J]. Advances in Atmospheric Sciences 37, 1057–1066. doi: 10.1007/s00376-020-2004-4
Srivastava, A., Grotjahn, R., and Ullrich, P. A. (2020). Evaluation of historical CMIP6 model simulations of extreme precipitation over contiguous US regions[J]. Weather and Climate Extremes 29, 100268. doi: 10.1016/j.wace.2020.100268
Mears, C. A., and Wentz, F. J. (2009). Construction of the RSS V3. 2 lower-tropospheric temperature dataset from the MSU and AMSU microwave sounders[J]. Journal of Atmospheric and Oceanic Technology 26, 1493–1509. doi: 10.1175/2009jtecha1237.1
Xu, Y., Ramanathan, V., and Victor, D. G. (2018). Global warming will happen faster than we think[J]. Nature 564, 30–32. doi: 10.1038/d41586-018-07586-5
Zhou, C., Wang, J., Dai, A., and Thorne, P. W. (2020). A new approach to homogenize global sub-daily radiosonde temperature data from 1958 to 2018[J]. Journal of Climate 34, 1–64.
Keywords: summer thermal contrast, Tibetan Plateau, tropical Indian Ocean, upper troposphere, discrepancies
Citation: Luo X, Xu J and Li K (2021) Discrepancies of Upper Troposphere Summer Thermal Contrast Between Tibetan Plateau and Tropical Indian Ocean in Multiple Data. Front. Environ. Sci. 9:655521. doi: 10.3389/fenvs.2021.655521
Received: 19 January 2021; Accepted: 04 March 2021;
Published: 09 April 2021.
Edited by:
Qingxiang Li, Sun Yat-sen University, ChinaReviewed by:
Laurent Li, UMR 8539 Laboratoire de Météorologie Dynamique (LMD), FranceCopyright © 2021 Luo, Xu and Li. This is an open-access article distributed under the terms of the Creative Commons Attribution License (CC BY). The use, distribution or reproduction in other forums is permitted, provided the original author(s) and the copyright owner(s) are credited and that the original publication in this journal is cited, in accordance with accepted academic practice. No use, distribution or reproduction is permitted which does not comply with these terms.
*Correspondence: Jianjun Xu, Z211eHVqakAxNjMuY29t
Disclaimer: All claims expressed in this article are solely those of the authors and do not necessarily represent those of their affiliated organizations, or those of the publisher, the editors and the reviewers. Any product that may be evaluated in this article or claim that may be made by its manufacturer is not guaranteed or endorsed by the publisher.
Research integrity at Frontiers
Learn more about the work of our research integrity team to safeguard the quality of each article we publish.