
94% of researchers rate our articles as excellent or good
Learn more about the work of our research integrity team to safeguard the quality of each article we publish.
Find out more
ORIGINAL RESEARCH article
Front. Environ. Sci., 08 July 2021
Sec. Atmosphere and Climate
Volume 9 - 2021 | https://doi.org/10.3389/fenvs.2021.652024
This article is part of the Research TopicObservations and Modelling of Recent Extreme Wild Fire Events and their Impact on the Environment and ClimateView all 5 articles
 Corinna Kloss1*
 Pasquale Sellitto2Marc von Hobe3
 Gwenaël Berthet1Dan Smale4Gisèle Krysztofiak1
 Chaoyang Xue1
 Chenxi Qiu3
 Fabrice Jégou1
 Inès Ouerghemmi1Bernard Legras5
The historically large and severe wildfires in Australia from September 2019 to March 2020 are known to have injected a smoke plume into the stratosphere around New Year, due to pyro-cumulonimbus (pyro-Cb) activity, that was subsequently distributed throughout the Southern Hemisphere (SH). We show with satellite, ground based remote sensing, and in situ observations that the fires before New Year, had already a substantial impact on the SH atmosphere, starting as early as September 2019, with subsequent long-range transport of trace gas plumes in the upper-troposphere. Airborne in situ measurements above Southern Argentina in November 2019 show elevated CO mixing ratios at an altitude of 11 km and can be traced back using FLEXPART trajectories to the Australian fires in mid-November 2019. Ground based solar-FTS (Fourier Transform Spectroscopy) observations of biomass burning tracers CO, HCN and C2H6 at Lauder, South Island, New Zealand show enhanced tropospheric columns already starting in September 2019. In MLS observations averaged over 30°–60°S, enhanced CO mixing ratios compared to previous years become visible in late October 2019 only at and below the 147 hPa pressure level. Peak differences are found with satellite and ground-based observations for all altitude levels in the Southern Hemisphere in January. With still increased aerosol values following the Ulawun eruption in 2019, averaged satellite observations show no clear stratospheric and upper-tropospheric aerosol enhancements from the Australian fires, before the pyro-Cb events at the end of December 2019. However, with the clear enhancement of fire tracers, we suggest the period September to December 2019 (prior to the major pyro-Cb events) should be taken into account in terms of fire pollutant emissions when studying the impact of the Australian fires on the SH atmosphere.
As a result of the anthropogenic induced global warming, the global frequency and/or severity of wildfires has been shown to increase in more than 100 studies published since 2013 (Smith et al., 2020). Especially in Australia, projections show a clear trend toward fire weather (Dowdy et al., 2019). From September 2019 to March 2020 Australia experienced the largest recorded wildfire ever recorded in Australia (Boer et al., 2020). The year 2019 was the warmest and driest spring on record in Australia (Bureau of Meteorology, Australia). Around New Year 2020, several strong Pyro-Cbs (Pyro-cumulonimbus) developed and injected gaseous and particulate combustion products into the Upper-Troposphere and Lower-Stratosphere (UTLS) (Khaykin et al., 2020; Boer et al., 2020). Khaykin et al. (2020) find that 0.4 ± 0.2 Tg of particulate matter was injected into the stratosphere and show that the stratospheric Aerosol Optical Depth (AOD) perturbation was the highest ever measured for wildfires and comparable to that of moderate stratospheric volcanic eruptions (e.g. Calbuco in 2015, Raikoke in 2019). Furthermore, Ohneiser et al. (2020) show observations of elevated aerosol over Punta Arenas (in Chile) originating from the Australian fires in January and February 2020. Through solar heating of a smoke patch, at least three self-maintaining anticyclonic vortices formed and were observed (Khaykin et al., 2020; Kablick et al., 2020). A particularly stable vortex was larger than 1,000 km in diameter, rose up to 35 km altitude and traveled 66,000 km over a 13 week period (Khaykin et al., 2020). The last major fires in Australia with a subsequent stratospheric plume were reported in 2009. This fire event, labeled “black Saturday” (Siddaway and Petelina, 2011), caused smoke particles to remain in the UTLS for around 4 months. The burned area of the Australian fires in 2019/2020, was by a factor of more than 10 larger (5.8 million compared to 450,000 hectar) than what was reported for the fires in 2009 (Khaykin et al., 2020; Siddaway and Petelina, 2011). The Australian fire season 2019/2020 has been reported to be the strongest on record in terms of aerosol injected into the stratosphere and consequential radiative forcing (Khaykin et al., 2020). The recent historically severe wildfire season in Canada in 2017 is another example for significant UTLS aerosol perturbation. A family of self-maintaining rising vortices, as described for the Australian fires 2019–2020, was also observed (Lestrelin et al., 2020). The aerosol depolarization ratios observed in Chile from the Australian fires agree well with what has been seen above Europe after the Canadian wildfires in 2017 (Ohneiser et al., 2020).
Besides the direct injection of aerosols, wildfires release trace gases into the atmosphere. For CO (carbon monoxide), C2H6 (ethane) and HCN (hydrogen cyanide) biomass burning emission is the main direct atmospheric source (Watson et al., 1990; Rinsland et al., 1998; Lobert et al., 1990) in the SH and the main factor driving their seasonal cycle in the SH sub-tropics (Rinsland et al., 1998; Zeng et al., 2012; Schaefer et al., 2018). For OCS, the main atmospheric sources are oceans and anthropogenic emissions. Nevertheless, biomass burning is estimated to contribute more than 10% to the atmospheric OCS budget (Stinecipher et al., 2019). The main sink is uptake by vegetation. The atmospheric lifetime of OCS is estimated at approximately 2 years (Campbell et al., 2008), with a stratospheric lifetime between 58 and 68 years (Krysztofiak et al., 2015). The latitude dependent CO lifetime is between
Khaykin et al. (2020) show that biomass burning trace gases (i.e. CO and CH3CN), as well as aerosols, experience a sharp increase in stratospheric burden starting in January 2020. The bulk of trace gas and aerosol injection into the UTLS occurred between December 29th and 31st. One major event on January 5th has been extensively analyzed in the aforementioned studies. However, extensive and significant bush fire activities already started in September 2019. Here, we investigate the impact of the Australian fires on the atmosphere already prior to the stratospheric injection phase in December 2019.
The data sets and methods used within this study are introduced in Section 2. Section 3.1 discusses a case study of an intercontinental transport of emitted fire air masses. In Section 3.2 we investigate the possibility and the significance of a possible stratospheric impact of fire tracers and aerosols in two time intervals, one before the major injection phase in SH spring 2019/2020 (September 01, 2019 to December 20, 2019) and one including the injection phase around New Year (December 01, 2019 to February 20, 2020). Conclusions are drawn in Section 4.
The Airborne Mid-Infrared Cavity enhanced Absorption spectrometer (AMICA) employs Off-Axis Integrated Cavity Output Spectroscopy (OA-ICOS) to measure trace gases including CO, OCS, CO2 and H2O [for a detailed instrument description, see Kloss et al. (2021b), and von Hobe et al. (2020)]. From September to November 2019, AMICA was deployed on the German research aircraft HALO (High Altitude and LOng Range Research Aircraft) during the SouthTRAC campaign based in Rio Grande in southern Argentina. In this study we use CO measurements from a flight on November 12, 2019, specifically focusing on the data obtained at altitudes between 8 and 12 km at approximately 55°S and 68°W. Data are averaged over 30 s and have a precision of around
The ground-based solar Mid-Infrared Fourier Transform Spectrometer (MIR FTS) obtains spectra over the wavenumber region 700–4,000 cm−1 at a spectral resolution of 0.0035 cm−1. The MIR FTS instrument is located at NIWA’s (National Institute of Water and Atmospheric Research) atmospheric research laboratory located at Lauder, New Zealand (45°S, 170°E, 370 AMSL) (see also Supplementary material). Measurements are taken year-round in direct Sun cloud free conditions. Observations are taken under the auspices of the Network for the Detection of Atmospheric Composition Change (NDACC) (De Mazière et al., 2018). Trends and variations of HCN, CO and C2H6 at NIWA have been analyzed in Zeng et al. (2012); Rinsland et al. (2002). The OCS retrieval strategy is an updated version to that used in Kremser et al. (2015). Here, we use the Lauder CO, HCN, C2H6 and OCS data sets from 2002 to mid-2020. The optimal estimation retrieval strategies for the trace gases CO, OCS and HCN contain enough information (degrees of freedom) to allow partitioning of the retrieved profiles into stratospheric (
The Microwave Limb Sounder (MLS) performs vertical profile measurements of water vapor and multiple trace gases in the UTLS on the National Aronautics and Space Administration’s Aura satellite since 2004 (Waters et al., 2006). Here, we use the CO and HCN observations (version 5) between July 2019 and June 2020 for the area 160-175°E, 32-58°S. Data are filtered according to the data screening guidelines (Livesey et al., 2020). MLS has a dense sampling, obtaining one vertical profile each 165 km (3,500 profiles per day), with a vertical resolution of
The Stratospheric Aerosol and Gas Experiment on the International Space Station (SAGE III/ISS) is a solar (and lunar) occultation spectrometer operating since 2017 (Cisewski et al., 2014). Here, we use the aerosol extinction observations (version 5.1) at 521 nm for a limited area (160°–175°E, 32–58°S) for the Australian wildfire season 2019–2020. Data are provided between 0.5 and 40 km altitude with a vertical resolution of
The Ozone Mapping and Profiler Suite (OMPS) Limb Profiler (LP) is a limb-instrument on the Suomi National Polar-orbiting Partnership satellite since 2012 (Loughman et al., 2018; Bhartia and Torres, 2019). With the new data version 2.0, OMPS provides aerosol extinction measurements at six different wavelengths (510, 600, 675, 745, 869 and 997 nm). The dense sampling results in a global coverage within 3–4 days. The vertical resolution is estimated to be
The Lagrangian transport and diffusion model FLEXPART version 9.0.3 is used to simulate long-range transport of atmospheric tracers (Stohl et al., 2005) with a similar set up as in Brocchi et al. (2018). Model calculations are based on ERA5 (Hersbach et al., 2020) meteorological data from the European Center for Medium-Range Weather Forecasts (ECMWF) extracted at hourly intervals with a horizontal resolution of 0.5
CO mixing ratios up to 400 ppb at approximately
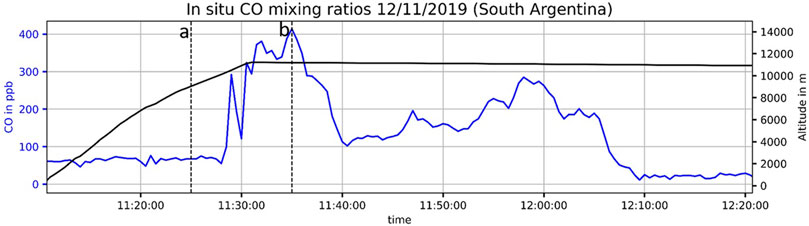
FIGURE 1. Airborne CO (blue) in situ observations and respective altitude information (black) on November 12th 2019 at around 57°S and 67°W. The two vertical lines (a, b) indicate initialization times for back trajectory calculations (Figure 2).
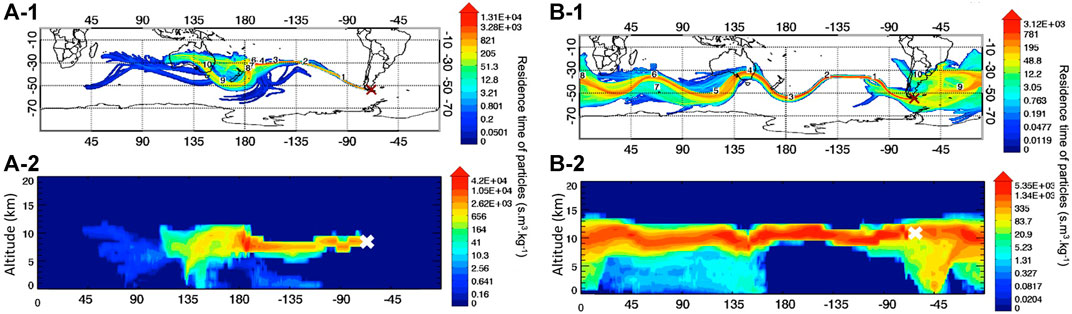
FIGURE 2. FLEXPART 10-day back trajectories (total column), originating from the respective points (as shown in Figure 1). (A1) and (B-1) correspond to an integration of the trajectory positions over the whole altitude range (surface to 45 km altitude). (A-1) Trajectories initialized at point a: 12/11, 11 h 25 (UTC), 53.68°S, 68.60°W, 9 km, (B-1) point b: 12/11, 11 h 35 (UTC), 54.86°S, 68.18°W, 11.18 km. The red cross (South Argentina) represents the initialization point of the back-trajectories. Numbers indicate the number of days along the trajectories. (A-2) The vertical view of the back trajectories respective to (A-1) and (B-2) respective to (B-1).
The contribution of emissions from South Australia is particularly evident for point b. However, due to the limitations of such simulations (as discussed in Section 2.6), we see the presented trajectories as a rough guideline rather than trusting each single coordinate in location and time. According to the position and time of the back-trajectory simulations initialized at point b, we investigate space-borne MLS CO observations over South-East Australia and the South Island, New Zealand (Figure 3). Between November 8th and 10th large increases of CO mixing ratios, up to 500 ppb, are observed by MLS below the tropopause (
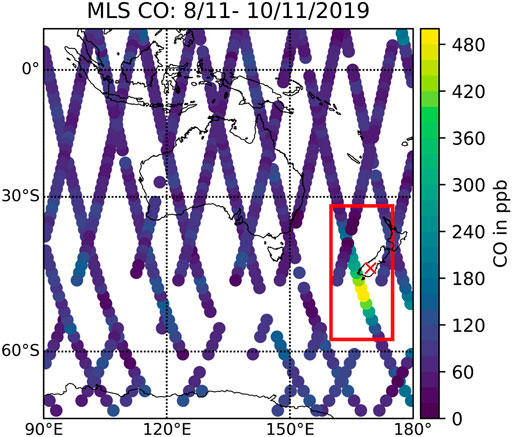
FIGURE 3. MLS mean CO mixing ratios along the orbit, between the tropopause and 100 hPa below the tropopause (
Figure 4 shows total column FTS observations at the NIWA station in Lauder for the biomass burning tracers CO, HCN, C2H6 and for OCS (Figures 4A,C,E,G respectively). With the predominant westerly winds, Lauder is at a good location to likely observe “fresh” plumes coming from Australia. Significant increases in total column values and variability throughout the whole fire season are observed for CO, HCN and C2H6 (September 2019–March 2020). Sharp (almost visible as a line) increases observed at the end of December/beginning of January (left column in Figure 4), indicate the major events which led to the stratospheric perturbation with consequent stratospheric smoke vortices, discussed in Khaykin et al. (2020); Kablick et al. (2020). To account for seasonal variations in column abundances and to have a quantitative comparison to the fire seasons of previous years, the second column in Figure 4 shows 14-day mean total column of CO, HCN, C2H6, and OCS averaged for the measurement record from 2002 to 2018 with respective mean 14-day standard deviations. The standard deviation is an indicator for the variability of the plume composition and density. Because composition and properties of fire and volcano plumes are more variable at distances closer to the source, and become increasingly diluted with increasing distances (Sellitto et al., 2020), the observed larger standard deviations starting from end of December 2019, in Figure 4, point to a series of denser and dispersing/evolving fire plumes in this period. The climatological mean includes the fire season from 2009. However, comparisons (not shown) have revealed that the 2009 fire season has not had a significant impact on the observations made at Lauder. This is in accordance to Siddaway and Petelina (2011), who state that most of the smoke plumes remained between the latitudes range 5–25°S.
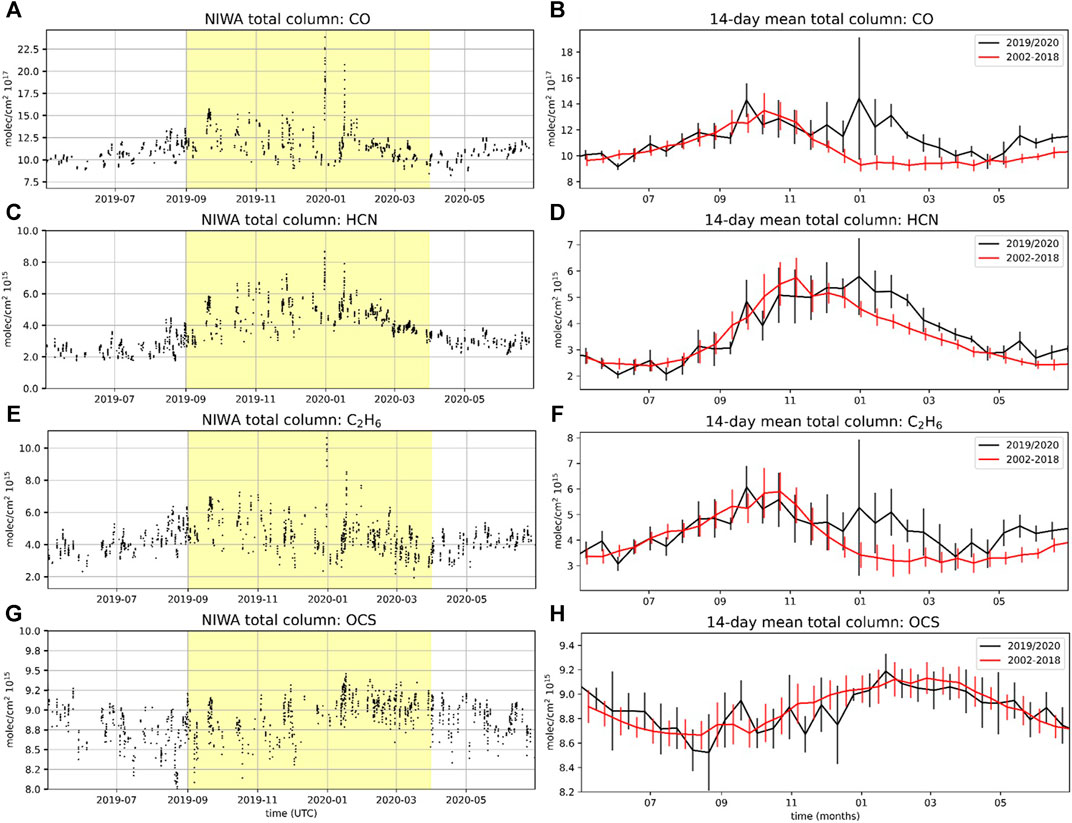
FIGURE 4. (A), (C), (E) and (G) CO, HCN, C2H6 and OCS total column NDACC MIR FTS observations at Lauder, New Zealand, May 2019 to June 2020 respectively. The yellow background indicates the fire season from September 2019 to March 2020. (B), (D), (F) and (H) are 14-day mean total columns (with 1-sigma standard deviation) averaged over the period 2002 to 2018 (red) and for the 2019/2020 period (black).
In Figure 4B, the seasonal cycle of CO is evident with increasing values during July-October and decreasing CO values during November-January. Through the impact of the extreme fire event in 2019/2020, CO total column values decrease later (in February-March) than usual (black line compared to red line in Figure 4B). As a biomass burning tracer, the seasonal cycle of HCN at Lauder depends largely on the extent of the seasonally occurring wild fires (Jones et al., 2001; Zeng et al., 2012). Abundances of HCN in the SH peak during October through November as seen for the 2002–2018 average. Because of the fire event in 2019/2020, maximum total column HCN values are shifted by around two months (to January). The underlying variation of the C2H6 column values displayed in Figure 4 follows the climatological seasonal cycle with maximum values in September/October (transport from the NH to the SH is highest in NH winter combined with the SH summer biomass burning source) (Xiao et al., 2008).
For the three biomass burning tracers CO, HCN and C2H6, total column values are elevated from November to april during the Australian fire season 2019/2020 compared to the climatological average. Variability of all three trace gases is elevated throughout the whole fire season starting from September, pointing to overpasses of fresh fire plumes. This indicates that the fires already had a notable influence on the SH atmosphere, well before the pyro-Cb injection events around New Year (2019/2020). However, we cannot dismiss contributions from other biomass burning events [e.g. the Amazonian fires from 2019, Lizundia-Loiola et al. (2020)].
Respective to Figures 4B,D, Supplementary Figure S3 shows the stratospheric (12–120 km) column values for CO and HCN measured at Lauder. For CO, stratospheric column values (Supplementary Figure S3a) only show a significant increase (compared to the months prior to the fire: May to August 2019) for the December to February time frame, while the total column (Figure 4B) was already visibly impacted by the fires in September 2019 for all three gases. Within biomass burning plumes, increased OH values might lead to a faster depletion of CO and C2H6, while HCN has a longer photochemical lifetime. The biomass burning tracer HCN shows a significant increase in the stratosphere already in October. However, because an increase in stratospheric column values is common in October (e.g. Supplementary Figure S3b, red line), it cannot be clearly attributed to the Australian fires. Hence, the troposphere was clearly impacted throughout the whole fire season (September to March). The stratosphere was only clearly impacted following the pyro-Cb events in December 2019/January 2020.
Because of its long lifetime in the free troposphere, sharp increases as seen for CO, HCN and C2H6 column values are not expected for OCS. The observed OCS column values (Figure 4H) follow the typical OCS seasonality in the SH. Lowest concentrations are detected during winter (July) because of high oceanic fluxes of OCS (and CS2, DMS as OCS precursors) in summer (Kettle et al., 2002). Even in January 2020, when other biomass burning tracers (CO, HCN and C2H6) show a very large increase, total column values do not significantly deviate from the climatological pattern. In order to detect a biomass burning induced increase of OCS, it would likely be necessary to study a fresh, concentrated plume, which is outside of the scope of the present study.
In Figure 5, we show the evolution of CO mixing ratios observed by MLS zonally averaged over the 30–60°S latitude range compared to the climatological average (2005–2018) on different pressure levels within the UTLS (68, 100, 147 and 215 hPa). For the two higher levels (at 68 and 100 hPa) CO mixing ratios in 2019 closely follow the climatological average until the pyro-Cb events in January, confirming that there is no significant impact of the earlier fires at these levels. On the lower levels (at 215 and 147 hPa) a slight CO enhancement above the climatological average becomes visible in late October that might be attributed to the earlier part of the fire season. The enhancement becomes very pronounced with the pyro-Cb events around New Year.
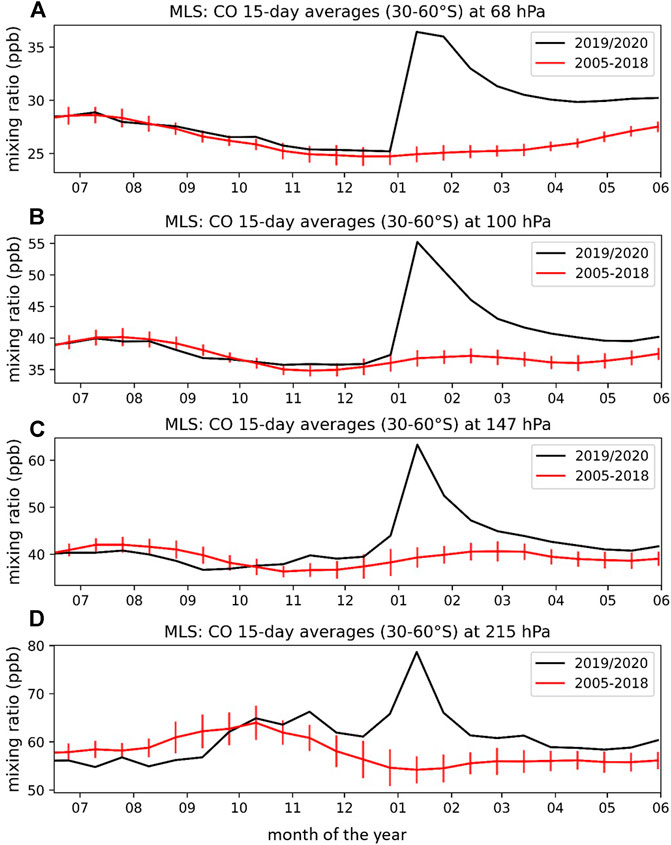
FIGURE 5. MLS 15-day mixing ratio zonal averages for 2019/2020 (black) and 2005–2018 (red, with the respective inter-annual standard deviations) for CO at 68 (A), 100 (B), 147 (C) and 215 hPa (D) pressure levels.
To investigate aerosol increases within the plumes passing over the defined region in Figure 3, we look at SAGE III/ISS and OMPS aerosol extinction observations averaged over the defined red box from 2018–2020. Tropospheric aerosols are rapidly dispersed and because of wet deposition, they have a significantly shorter lifetime than aerosols in the stratosphere. It is therefore expected that the impact on the stratosphere of the Australian fires before the pyro-Cb events was significantly smaller. Both SAGE III/ISS and OMPS (Figures 6A,B respectively) reveal limited aerosol extinction enhancements in the lower stratosphere September-November 2019 (around the red vertical line in Figure 6), before the January 2020 pyro-Cb events in the red box. For the SAGE III/ISS data set, clouds have been filtered according to Thomason and Vernier (2013). Smoke aerosols in clouds may therefore not be visible in Figure 6A. Aerosol enhancements in the lower stratosphere around November 2019 coincide with zonally averaged peak stratospheric Aerosol Optical Depth (AOD) values in the SH (30–50°S) following the Ulawun eruption in 2019 [see Figure 8 in Kloss et al. (2021a)]. Thus aerosol extinction attribution to stratospheric injections during the Australian fires before New Year (pyro-Cb events) are hard to segregate out (Figure 6). Enhanced aerosol extinction values in the lower stratosphere at the end of 2018 can be attributed to the Ambae eruption in 2018, with peak stratospheric AOD values in the SH in October 2018 (Kloss et al., 2020; 2021a).
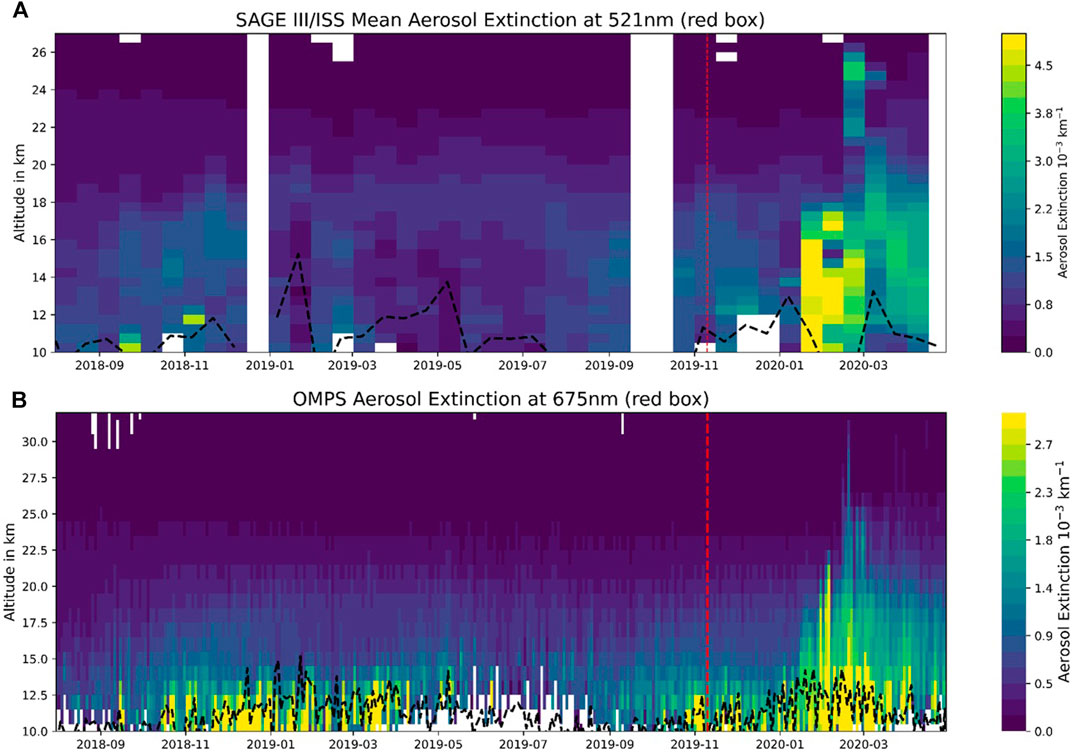
FIGURE 6. (A) SAGE III/ISS 15-day mean Aerosol extinction values at 521 nm over the region 160–175°E, 32–58°S (red box, as indicated in Figure 3). The red vertical, dashed line represents the time of the observed enhanced CO values from Figure 3. The black dashed line represents the average tropopause altitude. (B) OMPS 2-day mean Aerosol extinction values at 675 nm for the red box.
A substantial increase of aerosol extinction values is observed starting from January 2020 [as also shown in Khaykin et al. (2020)]. Enhanced aerosol observations up to
A record-breaking fire season in terms of intensity, duration and atmospheric impacts took place in Eastern Australia from late 2019 to early 2020. This event caused exceptionally strong pyro-Cb events (starting at the end of December 2019) that injected trace gases and aerosols into the stratosphere.
A substantial increase in aerosol extinction above 10 km altitude is only observed starting from January 2020, while aerosol enhancements before the pyro-Cb injection events (December 2019/January 2020) might have been masked by clouds and still elevated background conditions from the Ulawun eruption (August 2019). Biomass burning tracer mixing ratios peak in January 2020 (in the troposphere and stratosphere). However, we find that total column measurements of CO, HCN and C2H6 above Lauder, New Zealand significantly increased from November 2019 and lasting until April 2020. Furthermore, we find that the frequency of fresh bypassing trace gas plumes is higher than the climatological average throughout the whole fire season.
When studying the atmospheric impact of the historically severe wildfires in Australia 2019/2020 especially in terms of emitted trace gases, we recommend considering the whole Australian fire season (September 2019 to March 2020) rather than only focusing on the stratospheric impact after the pyro-Cb events around New Year.
The AMICA CO data will be made available in the HALO data base under https://doi.org/10.17616/R39Q0T. The Lauder MIR FTS data sets are available on the NDACC public database ftp.cpc.ncep.noaa.gov/ndacc/station/lauder/hdf/ftir. The Lauder in situ CO data set can be obtained by directly contacting Dan Smale, until it is made publicly available on the World Data Centre for Greenhouse Gases (https://gaw.kishou.go.jp). MLS data are available at http://disc.sci.gsfc.nasa.gov/Aura/data-holdings/MLS. The SAGE III/ISS aerosol extinction data set (v5.1) is available at https://eosweb.larc.nasa.gov and OMPS v2.0 data at https://daac.gsfc.nasa.gov/.
CK designed and managed the research. PS, GB, BL, MV, and DS contributed to the analysis of results. MV, CQ, and DS contributed in situ and remotely sensed data, and respective data interpretation. GK, FJ, and CX conducted the trajectory simulations. All authors contributed to the final version of the paper.
CK was funded by Deutsche Forschungsgemeinschaft (DFG, German Research Foundation)—409585735. CQ is supported by the graduate school HITEC (Helmholtz Interdisciplinary Doctoral Training in Energy and Climate Research). Measurements made at Lauder are core funded by NIWA through New Zealand’s Ministry of Business, Innovation and Employment Strategic Science Investment Fund. This work has been supported by the Programme National de Télédétection Spatiale (PNTS, http://www.insu.cnrs.fr/pnts), grant n°. PNTS-2019-9 and by the CNES (Centre National d’Études Spatiales), TOSCA/IASI grant.
The authors declare that the research was conducted in the absence of any commercial or financial relationships that could be construed as a potential conflict of interest.
The authors are grateful for the support of Agence Nationale de La Recherche under grant ANR-17-CE01-0015 (TTL-Xing). Support from the VOLTAIRE project (ANR-10-LABX-100-01) funded by ANR through the PIA (Program d’Investissement d’Avenir) is gratefully acknowledged. The authors acknowledge NASA, SAGE III/ISS and OMPS teams. The SouthTRAC campaign is a joint atmospheric research project by German research centers and universities within the DFG HALO-SPP 1294 framework; the authors would also like to thank the SouthTRAC coordinators as well as the flight and ground teams for their support during the campaign.
The Supplementary Material for this article can be found online at: https://www.frontiersin.org/articles/10.3389/fenvs.2021.652024/full#supplementary-material
Bhartia, P. K., and Torres, O. O. (2019). OMPS-NPP L2 LP Aerosol Extinction Vertical Profile Swath Daily 3slit V1.5. Greenbelt, MD: Goddard Earth Sciences Data and Information Services Center (GES DISC). doi:10.5067/GZJJYA7L0YW2
Boer, M. M., Resco de Dios, V., and Bradstock, R. A. (2020). Unprecedented Burn Area of Australian Mega forest Fires. Nat. Clim. Chang. 10, 171–172. doi:10.1038/s41558-020-0716-1
Brocchi, V., Krysztofiak, G., Catoire, V., Guth, J., Marécal, V., Zbinden, R., et al. (2018). Intercontinental Transport of Biomass Burning Pollutants over the Mediterranean basin during the Summer 2014 Charmex-Glam Airborne Campaign. Atmos. Chem. Phys. 18, 6887–6906. doi:10.5194/acp-18-6887-2018
Campbell, J. E., Carmichael, G. R., Chai, T., Mena-Carrasco, M., Tang, Y., Blake, D. R., et al. (2008). Photosynthetic Control of Atmospheric Carbonyl Sulfide during the Growing Season. Science 322, 1085–1088. doi:10.1126/science.1164015
Cisewski, M., Zawodny, J., Gasbarre, J., Eckman, R., Topiwala, N., Rodriguez-Alvarez, O., et al. (2014). “The Stratospheric Aerosol and Gas Experiment (SAGE III) on the International Space Station (ISS) Mission),” in Sensors, Systems, and Next-Generation Satellites XVIII. Editors R. Meynart, S. P. Neeck, and H. Shimoda (SPIE), 59–65. doi:10.1117/12.2073131
De Mazière, M., Thompson, A. M., Kurylo, M. J., Wild, J. D., Bernhard, G., Blumenstock, T., et al. (2018). The Network for the Detection of Atmospheric Composition Change (NDACC): History, Status and Perspectives. Atmos. Chem. Phys. 18, 4935–4964. doi:10.5194/acp-18-4935-2018
Dowdy, A. J., Ye, H., Pepler, A., Thatcher, M., Osbrough, S. L., Evans, J. P., et al. (2019). Future Changes in Extreme Weather and Pyroconvection Risk Factors for Australian Wildfires. Sci. Rep. 9, 10073. doi:10.1038/s41598-019-46362-x
Gelaro, R., McCarty, W., Suárez, M. J., Todling, R., Molod, A., Takacs, L., et al. (2017). The Modern-Era Retrospective Analysis for Research and Applications, Version 2 (MERRA-2). J. Clim. 30, 5419–5454. doi:10.1175/JCLI-D-16-0758.1
Hersbach, H., Bell, B., Berrisford, P., Hirahara, S., Horányi, A., Muñoz‐Sabater, J., et al. (2020). The ERA5 Global Reanalysis. Q.J.R. Meteorol. Soc. 146, 1999–2049. doi:10.1002/qj.3803
Jones, N. B., Rinsland, C. P., Liley, J. B., and Rosen, J. (2001). Correlation of Aerosol and Carbon Monoxide at 45°S: Evidence of Biomass Burning Emissions. Geophys. Res. Lett. 28, 709–712. doi:10.1029/2000GL012203
Kablick, G. P., Allen, D. R., Fromm, M. D., and Nedoluha, G. E. (2020). Australian Pyrocb Smoke Generates Synoptic-Scale Stratospheric Anticyclones. Geophys. Res. Lett. 47, e2020GL088101. doi:10.1029/2020GL088101
Kettle, A. J., Kuhn, U., von Hobe, M., Kesselmeier, J., and Andreae, M. O. (2002). Global Budget of Atmospheric Carbonyl Sulfide: Temporal and Spatial Variations of the Dominant Sources and Sinks. J. Geophys. Res. 107, 25–16. ACH 25–1–ACH. doi:10.1029/2002JD002187
Khaykin, S., Legras, B., Bucci, S., Sellitto, P., Isaksen, L., Tencé, F., et al. (2020). The 2019/20 Australian Wildfires Generated a Persistent Smoke-Charged Vortex Rising up to 35 km Altitude. Commun. Earth Environ. 1, 22. doi:10.1038/s43247-020-00022-5
Kleinböhl, A., Toon, G. C., Sen, B., Blavier, J. F. L., Weisenstein, D. K., Strekowski, R. S., et al. (2006). On the Stratospheric Chemistry of Hydrogen Cyanide. Geophys. Res. Lett. 33, L11806. doi:10.1029/2006GL026015
Kloss, C., Berthet, G., Sellitto, P., Ploeger, F., Taha, G., Tidiga, M., et al. (2021a). Stratospheric Aerosol Layer Perturbation Caused by the 2019 Raikoke and Ulawun Eruptions and Their Radiative Forcing. Atmos. Chem. Phys. 21, 535–560. doi:10.5194/acp-21-535-2021
Kloss, C., Sellitto, P., Legras, B., Vernier, J.-P., Jégou, F., Venkat Ratnam, M., et al. (2020). Impact of the 2018 Ambae Eruption on the Global Stratospheric Aerosol Layer and Climate. J. Geophys. Res. Atmospheres 125, e2020JD032410. doi:10.1029/2020JD032410
Kloss, C., Tan, V., Leen, J. B., Madsen, G. L., Gardner, A., Du, X., et al. (2021b). Airborne Mid-infrared Cavity Enhanced Absorption Spectrometer (AMICA). (Accepted for AMT) Atmos. Meas. Tech. Discuss. 2021, 1–41. doi:10.5194/amt-2021-28
Kremser, S., Jones, N. B., Palm, M., Lejeune, B., Wang, Y., Smale, D., et al. (2015). Positive Trends in Southern Hemisphere Carbonyl Sulfide. Geophys. Res. Lett. 42, 9473–9480. doi:10.1002/2015GL065879
Krysztofiak, G., Té, Y. V., Catoire, V., Berthet, G., Toon, G. C., Jégou, F., et al. (2015). Carbonyl Sulphide (OCS) Variability with Latitude in the Atmosphere. Atmosphere-Ocean 53, 89–101. doi:10.1080/07055900.2013.876609
Lestrelin, H., Legras, B., Podglajen, A., and Salihoglu, M. (2020). Smoke-charged Vortices in the Stratosphere Generated by Wildfires and Their Behaviour in Both Hemispheres: Comparing Australia 2020 to Canada 2017. Atmos. Chem. Phys. Discuss. 29, 1–25. doi:10.5194/acp-2020-1201
Li, Q., Palmer, P. I., Pumphrey, H. C., Bernath, P., and Mahieu, E. (2009). What Drives the Observed Variability of HCN in the Troposphere and Lower Stratosphere? Atmos. Chem. Phys. 9, 8531–8543. doi:10.5194/acp-9-8531-2009
Livesey, N., Read, W., Wagner, P., Froidevaux, L., Santee, M., Schwartz, M., et al. (2020). Earth Observing System (EOS): Aura Microwave Limb Sounder (MLS): Version 5.0x Level 2 and 3 Data Quality and Description Document. Jet Propulsion Lab. JPL. D-105336 Rev. A.
Lizundia-Loiola, J., Pettinari, M. L., and Chuvieco, E. (2020). Temporal Anomalies in Burned Area Trends: Satellite Estimations of the Amazonian 2019 Fire Crisis. Remote Sensing 12, 151. doi:10.3390/rs12010151
Lobert, J. M., Scharffe, D. H., Hao, W. M., and Crutzen, P. J. (1990). Importance of Biomass Burning in the Atmospheric Budgets of Nitrogen-Containing Gases. Nature 346, 552–554. doi:10.1038/346552a0
Loughman, R., Bhartia, P. K., Chen, Z., Xu, P., Nyaku, E., and Taha, G. (2018). The Ozone Mapping and Profiler Suite (OMPS) Limb Profiler (LP) Version 1 Aerosol Extinction Retrieval Algorithm: Theoretical Basis. Atmos. Meas. Tech. 11, 2633–2651. doi:10.5194/amt-11-2633-2018
Ohneiser, K., Ansmann, A., Baars, H., Seifert, P., Barja, B., Jimenez, C., et al. (2020). Smoke of Extreme Australian Bushfires Observed in the Stratosphere over Punta Arenas, Chile, in January 2020: Optical Thickness, Lidar Ratios, and Depolarization Ratios at 355 and 532 nm. Atmos. Chem. Phys. 20, 8003–8015. doi:10.5194/acp-20-8003-2020
Podglajen, A., Hertzog, A., Plougonven, R., and Žagar, N. (2014). Assessment of the Accuracy of (Re)analyses in the Equatorial Lower Stratosphere. J. Geophys. Res. Atmos. 119, 11166–11188. doi:10.1002/2014JD021849
Real, E., Pisso, I., Law, K. S., Legras, B., Bousserez, N., Schlager, H., et al. (2010). Toward a Novel High-Resolution Modeling Approach for the Study of Chemical Evolution of Pollutant Plumes during Long-Range Transport. J. Geophys. Res. 115, D12302. doi:10.1029/2009JD011707
Rinsland, C. P., Jones, N. B., Connor, B. J., Logan, J. A., Pougatchev, N. S., Goldman, A., et al. (1998). Northern and Southern Hemisphere Ground-Based Infrared Spectroscopic Measurements of Tropospheric Carbon Monoxide and Ethane. J. Geophys. Res. 103, 28197–28217. doi:10.1029/98JD02515
Rinsland, C. P., Jones, N. B., Connor, B. J., Wood, S. W., Goldman, A., Stephen, T. M., et al. (2002). Multiyear Infrared Solar Spectroscopic Measurements of HCN, CO, C2H6, and C2H2 tropospheric Columns above Lauder, New Zealand (45°S Latitude)s Latitude). J. Geophys. Res. 107, 1–12. ACH 1–1–ACH. doi:10.1029/2001JD001150
Schaefer, H., Smale, D., Nichol, S. E., Bromley, T. M., Brailsford, G. W., Martin, R. J., et al. (2018). Limited Impact of El Niño-Southern Oscillation on Variability and Growth Rate of Atmospheric Methane. Biogeosciences 15, 6371–6386. doi:10.5194/bg-15-6371-2018
Sellitto, P., Salerno, G., La Spina, A., Caltabiano, T., Scollo, S., Boselli, A., et al. (2020). Small-scale Volcanic Aerosols Variability, Processes and Direct Radiative Impact at Mount Etna during the EPL-RADIO Campaigns. Sci. Rep. 10, 15224. doi:10.1038/s41598-020-71635-1
Siddaway, J. M., and Petelina, S. V. (2011). Transport and Evolution of the 2009 Australian Black Saturday Bushfire Smoke in the Lower Stratosphere Observed by Osiris on odin. J. Geophys. Res. 116, D06203. doi:10.1029/2010JD015162
Smale, D., Sherlock, V., Griffith, D. W. T., Moss, R., Brailsford, G., Nichol, S., et al. (2019). A Decade of CH4, CO and N2O In Situ Measurements at Lauder, New Zealand: Assessing the Long-Term Performance of a Fourier Transform Infrared Trace Gas and Isotope Analyser. Atmos. Meas. Tech. 12, 637–673. doi:10.5194/amt-12-637-2019
Smith, A., Jones, M., Abatzoglou, J., Canadell, J., and Betts, R. (2020). Climate Change Increases the Risk of Wildfires. ScienceBrief.
Staudt, A. C., Jacob, D. J., Logan, J. A., Bachiochi, D., Krishnamurti, T. N., and Sachse, G. W. (2001). Continental Sources, Transoceanic Transport, and Interhemispheric Exchange of Carbon Monoxide over the Pacific. J. Geophys. Res. 106, 32571–32589. doi:10.1029/2001JD900078
Stinecipher, J. R., Cameron‐Smith, P. J., Blake, N. J., Kuai, L., Lejeune, B., Mahieu, E., et al. (2019). Biomass Burning Unlikely to Account for Missing Source of Carbonyl Sulfide. Geophys. Res. Lett. 46, 14912–14920. doi:10.1029/2019GL085567
Stohl, A., Forster, C., Frank, A., Seibert, P., and Wotawa, G. (2005). Technical Note: The Lagrangian Particle Dispersion Model FLEXPART Version 6.2. Atmos. Chem. Phys. 5, 2461–2474. doi:10.5194/acp-5-2461-2005
Thomason, L. W., and Vernier, J.-P. (2013). Improved Sage II Cloud/aerosol Categorization and Observations of the Asian Tropopause Aerosol Layer: 1989-2005. Atmos. Chem. Phys. 13, 4605–4616. doi:10.5194/acp-13-4605-2013
von Hobe, M., Ploeger, F., Konopka, P., Kloss, C., Ulanowski, A., Yushkov, V., et al. (2020). Upward Transport into and within the Asian Monsoon Anticyclone as Inferred from Stratoclim Trace Gas Observations. Atmos. Chem. Phys. Discuss. 21, 1–31. doi:10.5194/acp-2020-891
Waters, J. W., Froidevaux, L., Harwood, R. S., Jarnot, R. F., Pickett, H. M., Read, W. G., et al. (2006). The Earth Observing System Microwave Limb Sounder (EOS MLS) on the Aura Satellite. IEEE Trans. Geosci. Remote Sensing 44, 1075–1092. doi:10.1109/TGRS.2006.873771
Watson, C. E., Fishman, J., and Reichle, H. G. (1990). The Significance of Biomass Burning as a Source of Carbon Monoxide and Ozone in the Southern Hemisphere Tropics: A Satellite Analysis. J. Geophys. Res. 95, 16443–16450. doi:10.1029/JD095iD10p16443
Xiao, Y., Logan, J. A., Jacob, D. J., Hudman, R. C., Yantosca, R., and Blake, D. R. (2008). Global Budget of Ethane and Regional Constraints on u.S. Sources. J. Geophys. Res. 113, D21306. doi:10.1029/2007JD009415
Keywords: australian wildfires, biomass burning tracers, upper troposphere/lower stratosphere, fire plume, long range transport
Citation: Kloss C, Sellitto P, von Hobe M, Berthet G, Smale D, Krysztofiak G, Xue C, Qiu C, Jégou F, Ouerghemmi I and Legras B (2021) Australian Fires 2019–2020: Tropospheric and Stratospheric Pollution Throughout the Whole Fire Season. Front. Environ. Sci. 9:652024. doi: 10.3389/fenvs.2021.652024
Received: 11 January 2021; Accepted: 03 June 2021;
Published: 08 July 2021.
Edited by:
Bin Yuan, Jinan University, ChinaCopyright © 2021 Kloss, Sellitto, von Hobe, Berthet, Smale, Krysztofiak, Xue, Qiu, Jégou, Ouerghemmi and Legras. This is an open-access article distributed under the terms of the Creative Commons Attribution License (CC BY). The use, distribution or reproduction in other forums is permitted, provided the original author(s) and the copyright owner(s) are credited and that the original publication in this journal is cited, in accordance with accepted academic practice. No use, distribution or reproduction is permitted which does not comply with these terms.
*Correspondence: Corinna Kloss, Y29yaW5uYS5rbG9zc0BjbnJzLW9ybGVhbnMuZnI=
Disclaimer: All claims expressed in this article are solely those of the authors and do not necessarily represent those of their affiliated organizations, or those of the publisher, the editors and the reviewers. Any product that may be evaluated in this article or claim that may be made by its manufacturer is not guaranteed or endorsed by the publisher.
Research integrity at Frontiers
Learn more about the work of our research integrity team to safeguard the quality of each article we publish.