 Cécile Monard1,2*
 Jean-Pierre Caudal2
 Daniel Cluzeau2Jean-Luc Le Garrec3Eve Hellequin2†Kevin Hoeffner2†
 Guillaume Humbert2†Vincent Jung2Cécile Le Lann2
 Annegret Nicolai2
- 1University of Rennes, CNRS, ECOBIO (Ecosystèmes, Biodiversité, Evolution)—UMR 6553, Rennes, France
- 2University of Rennes, Station Biologique de Paimpont, CNRS, ECOBIO (Ecosystèmes, Biodiversité, Evolution)—UMR 6553, Paimpont, France
- 3University of Rennes, CNRS, IPR (Institut de Physique de Rennes)—UMR 6251, Rennes, France
Volatile organic compounds (VOCs) are emitted by plants and microorganisms and have significant impacts on atmospheric chemistry. Soil systems are sources of VOCs driven by abiotic and biotic factors. We investigated the emissions of VOCs by soils and their plant cover from three contrasted biotopes: meadow, heathland and oak forest, during 24-h in summer. We hypothesized that the spatial and temporal dynamics of VOC fluxes are reflected in soil properties, soil microbial communities, vegetation covers, and litter composition that differed in the three biotopes VOC fluxes were measured after direct on-field sampling at four sampling times (two at night and two at day) using a proton transfer reaction mass spectrometer, and results were linked to some climatic, edaphic and biotic parameters simultaneously monitored in each biotope. While differences in the composition of the soil bacterial communities, in the richness of the plant cover and in some soil physicochemical properties between the three biotopes were observed, the total VOC fluxes from the soil to the atmosphere did not present spatial patterns. However, differences in the mass composition of the VOC spectra were detected; for example, the soil from the forest that was covered with oak leaf litter had specific bacterial communities and emitted distinct VOC spectra than the two other biotopes. The total VOC fluxes responded to rainfall and were significantly driven by soil temperature. While we observed changes in the structure of soil bacterial communities between day and night in all biotopes using fingerprinting analysis, a diurnal dynamic of VOC fluxes was only observed in the forest biotope where the soil was protected from rainfall due to the canopy. This soil presented higher fluxes in day time up to 10.8 µg VOCs h−1 m−2 and lower fluxes in night time down to 3.8 µg VOCs h−1 m−2. Overall, the present study supplies data regarding VOC emissions by soils which are scare compared to plant sources. The results highlighted the complex interconnections existing between abiotic and biotic parameters that could directly or indirectly drive VOC emissions by soil systems.
Introduction
Soil systems including soil, their inhabiting fauna and microbiota and their below- and aboveground vegetation encompass complex interaction networks integrating biotic, chemical and physical processes. Due to their biotic components, soil systems are important sources of biogenic volatile organic compounds (VOCs) emitted in the atmosphere (see Insam and Seewald, 2010; Peñuelas et al., 2014 for reviews) where they have significant impacts on atmospheric chemistry. VOCs contribute to the formation of secondary organic aerosols and are precursors of tropospheric ozone affecting climate, air quality and ecosystems functioning (Atkinson, 2000; Atkinson and Arey, 2003; Avnery et al., 2011).
At the soil surface and belowground, in the rhizosphere, plants release a wide diversity of VOCs in response to various stresses and as a way to communicate (Dam et al., 2016). VOCs emitted by plants are dominated by isoprenoids (e.g., isoprene, monoterpenes, sesquiterpenes; Guenther et al., 2006), but it has recently been shown that also oxygenated VOCs (alcohols, aldehydes, ketones) may significantly contribute to their VOC fluxes (e.g., Gonzaga Gomez et al., 2019). In soils, besides roots, VOCs can be produced by microorganisms through both anabolic and catabolic activities. The composition and activity of soil microbial communities have been shown to drive the amount and diversity of the VOCs emitted by soils (Leff and Fierer, 2008; McNeal and Herbert, 2009; Potard et al., 2017; Svendsen et al., 2018). These molecules constitute signaling pathways within microorganisms as well as between microorganisms and soil fauna or plants (Wheatley et al., 1997; Schöller et al., 2002; Kai et al., 2007). They can also be produced as intermediate metabolites during decomposition of litter and soil organic matter (Isidorov and Jdanova, 2002; Leff and Fierer, 2008). Therefore, the plant cover, that controls the properties of the litter available to soil microorganisms for degradation, should impact the diversity and amount of VOCs produced by these decomposers (Leff and Fierer, 2008). In soil systems, the production of VOCs thus relies directly on biotic parameters such as microbial and plants communities (roots and aerial parts) that are known to emit a wide variety of these molecules (Peñuelas et al., 2014; Gonzaga Gomez et al., 2019).
Besides these biotic properties, abiotic factors are also involved in the regulation of the emissions of VOCs by soils. These factors can act indirectly through the control of soil microbial activity or directly by regulating the gas fluxes at the soil-atmosphere interface. Once released in the pore space by roots and soil microorganisms, VOC emissions to the atmosphere are thus controlled by physical processes such as adsorption, diffusion and advection that are specific to the VOC considered (Schade and Custer, 2004) and linked to both soil physicochemical properties (organic matter content, texture) and climatic factors (temperature, humidity, surface wind) (Scanlon et al., 2002; Asensio et al., 2008; Rolston and Moldrup, 2012; Redeker et al., 2015). For example, methanol emission from a cropland soil was related to dry conditions corresponding to higher air temperature and global radiation (Gray et al., 2014; Bachy et al., 2018). Moreover, as previously observed for carbon dioxide, methane and nitrous oxide emissions by soil (e.g., Scott et al., 2006; Morin et al., 2014), a diurnal dynamic might also be observed for VOC fluxes from the soil to the atmosphere (Aaltonen et al., 2013). Thus, multiple interactions and feedbacks between soil microbiota, plant communities and soil chemical and physical properties should affect the VOCs emitted by the soil systems.
While VOC emissions by plant vegetation and their variation over time have been widely studied and used as input for air quality modelling (e.g., Steinbrecher et al., 2009), measurements of VOC fluxes from soil systems and their spatial and temporal dynamic are still scarce. Depending on the biotope and the associated biotic and pedological properties of the soil in interaction with small scale climatic changes, different VOCs are expected to be emitted from soil systems to the atmosphere. Therefore, the objectives of this study were 1) to analyze the VOC fluxes from soil systems of biotopes with different biotic (plant cover and soil bacteria) and abiotic (texture, soil carbon and nitrogen contents) properties, and 2) to relate temporal variations in VOC fluxes to changes in the structure of soil bacterial communities and climatic factors in order to document their spatio-temporal dynamics.
This study was performed during the BioBlitz at the Biological Field Station of Paimpont in France in July 2017 (Nicolai et al., 2020) when we took advantage of the 24 h mobilization for a spatio-temporal sampling of VOC emitted by soils. Three contrasted biotopes (a meadow, a heathland and a forest) were selected and we hypothesized that due to their differences in soil properties, soil microbial communities, vegetation covers, and thus litter composition, the soil systems from these three biotopes would differ in VOC emission i) in amount and mass composition and ii) in their temporal dynamics. To test these hypotheses, VOC fluxes were measured after dynamic on-field sampling at four sampling times within 24 h using a proton transfer reaction mass spectrometer (PTR-MS). The results were linked to some climatic, edaphic and biotic parameters simultaneously monitored.
Material and Methods
Biotopes and Sampling Description
The study was performed on the 18 and 19th July 2017 at the Biological Field Station of Paimpont (SBP), France. Three biotopes were selected for their proximity among each other and their contrasted vegetation cover (Supplementary Figure 1, 2; Supplementary Table 1). The meadow (MW) was a grazed field covered with Arrhenatherum elatius, the heathland (HL) was characterized by Ulex europaeus and the oak forest (OF) was dominated by oak trees (Quercus petraea and Quercus robur, Supplementary Table 1). Ten days before the gas samplings, a stainless steel collar (40 cm in diameter, 10 cm in depth) was placed in the soil of each biotope for further gas sampling. The main vegetation within each collar was Arrhenatherum elatius for MW, Agrostis curtisii for HL and oak leaf litter for OF (Supplementary Figure 3).
Four gas samplings (numbered from 1 to 4) were performed for 24 h from 3:30 pm on the 18th July 2017 to 12:20 pm on the 19th July 2017 (Figure 1). Topsoil (0–10 cm) was collected from three spatially replicated plots for each biotope at the start of the study using a soil auger (3 cm diameter) and sieved (2 mm) for bio-physicochemical property analyses. At the first and third gas sampling times, soil was concurrently sampled (n = 3) at 10 cm outside the stainless collar to avoid soil perturbation inside the collar for further gas measurements and stored at −20°C for fingerprint analyses of bacterial communities. Plant species data were extracted from the SBP-BioBlitz2017 dataset (Nicolai et al., 2019) for species richness calculations (for sampling protocols see Nicolai et al., 2020). Hourly atmospheric temperature and rainfall were calculated as the mean of those parameters measured concurrently by the two closest “Météo France” stations (Mauron and Ploermel) from one day prior to the sampling to the end of sampling (Figure 1). According to previous results (Rossabi et al., 2018), for each sampling, the total rainfall from the previous 5 h was taken into account for the analysis of the regulation factors of VOC emission. A noteworthy thunderstorm associated with an intense rainfall happened four hours before the first sampling (5.2 mm rainfall in total from 11:00 am to 2:59 pm; Figure 1). During each gas sampling, soil temperature and the relative humidity in the air inside the accumulation chamber were monitored using sensors (WiFi-TH+, Corintech, United Kingdom, Supplementary Table 2).
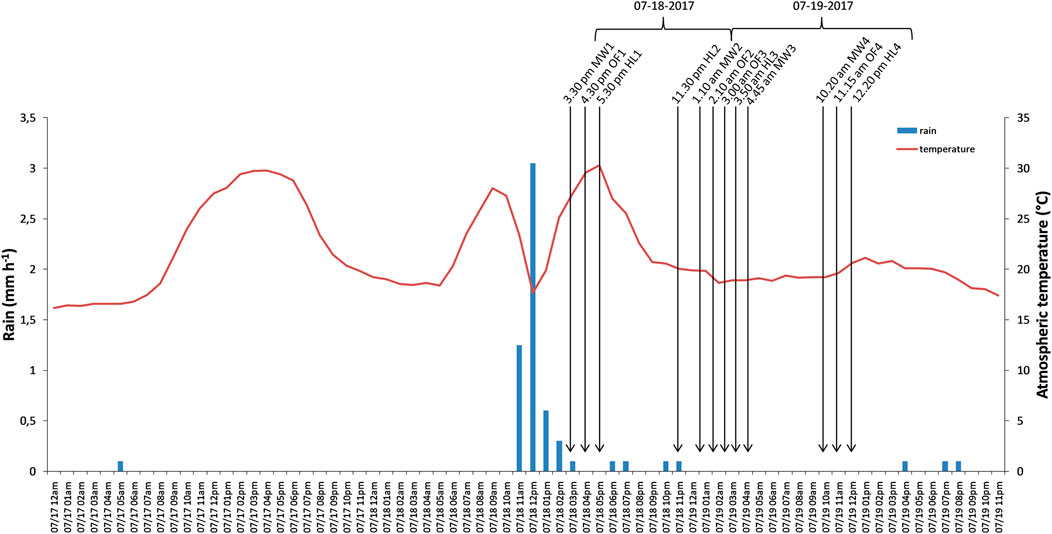
FIGURE 1. Hourly mean temperature and precipitation. The time schedule of the four samplings performed on the three biotopes (MW: Meadow, HL: Heathland, OF: Oak Forest) are indicated by arrows.
Dynamic Volatile Organic Compounds Sampling, Analysis and Calculations
VOCs were sampled and analyzed according to Potard et al. (2017). A 20-L, stainless-steel, cylindrical top-chamber was placed on the collars during the sampling time. The chamber’s top was transparent to allow photosynthesis during the samplings and the inside was equipped with a fan running at 150 rpm to mix the indoor air during the sampling time. The chamber was first flushed for 10 min with ultra-pure air (Air zero alphagaz 2, Air liquide) at a flow rate of 5.5 L min−1, a six-liter vacuum canister, dedicated to dynamic VOCs sampling (SilcoCan canister®, Restek, Lisses, France) was then connected to the chamber with a polytetrafluoroethylene (PTFE) tube and filled at a flow rate equal to 0.210 L per minute. At the same time, to avoid underpressure inside the chamber and to allow dynamic sampling, ultra-pure air was injected at the opposite side of the chamber outlet at the same flow rate than the sampling flow. The rigid vacuum canisters used to collect the air sample were passivated with a thin layer of molten silica bound to their inside stainless-steel surface to keep VOCs stable until their analysis (Król et al., 2010) which was performed in the laboratory the day after the sampling ended.
VOC concentrations were measured by using a Proton Transfer Reaction-Mass Spectrometer (Ionicon PTR-MS Compaq QMS 300) (Lindinger et al., 1998), over a mass range from 33 to 126 atomic mass unit (amu) leading to a total of 33 different masses detected. The mixing ratio of the molecule, [M], was calculated from the H3O+ and protonated molecule signals, [H3O+]0 and [MH+], respectively, according to the equation (Lindinger et al., 1998):
where t is the average time the ions spend in the reaction region of the spectrometer and k is the reaction rate constant for the proton transfer reaction equals to 2 10–9 cm3 molecule−1 s−1 for most of the VOCs we expected to detect. H3O+ concentration was previously corrected according to a transmission curve obtained using standard gas calibration mixture (TO-15 subset 25 component mix, Restek corporation, Bellefonte, United States; 1ppm in nitrogen). Also, in order to minimize fragmentation of the molecule during the proton transfer reaction and formation of (H2O)n-H3O+ clusters, the PTR-MS was operated at 135 Townsends. The air enclosed in each canister was scanned nine times and the mixing ratio associated with each mass was averaged on four scans. The ultra-pure air used during the sampling was also analyzed directly from its high-pressure cylinder and its measurement was then subtracted from the VOCs spectrum of each sample to obtain the net concentration. This PTR-MS had a limit of detection of 300 pptv in optimized settings, and only masses with a mixing ratio higher than 500 pptv were taken into account in our analyses. Each VOC flux (FVOC, g m−2 s−1) from soil was calculated using the following equation:
where Q is the flow rate (m3 s−1), CVOC is the concentration of VOC measured (ppb) obtained from [M] in the equation (1), M is the molecular weight of the VOC (g mol−1), VM is the molecular gas volume at the sampling temperature (23.233 L mol−1 at 15°C and atmospheric pressure) and A is the soil area in the microcosms (0.128 m2). Some protonated masses were assigned to known molecules if they have previously been detected using a PTR-MS under the same configuration conditions (Ellis and Mayhew, 2014) and if they are known to be emitted by soil systems (Supplementary Table 3).
Soil Characterization
The soils collected were hand sieved at 2 mm and homogenized prior to physicochemical characterization and soil bacterial analyses. A soil sample was sent to the Labocea laboratory (Combourg, France) for texture, organic matter, total nitrogen, cation exchange capacity (CEC) and pH measurements (Table 1).
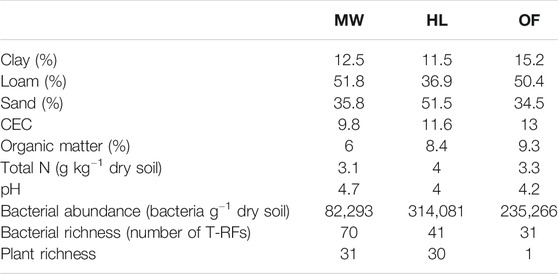
TABLE 1. Biophysicochemical properties of the soils from the three biotopes (MW: Meadow, HL: Heathland, OF: Oak Forest).
Soil bacterial abundances were determined after bacterial cell extraction using Nycodenz density gradient and a protocol adapted from Courtois et al. (2001). Sieved soil samples (5 g) were suspended in 35 ml of 0.2% Hexametaphosphate (HMP) and homogenized by mechanical mixing with glass beads for 2 h. After a first centrifugation at 18 G for 1 min at 10°C, the supernatant was centrifugated at 3,220 G for 20 min at 10°C and the pellet was resuspended in 10 ml 0.8% NaCl. Cells and soil particles were separated using Nycodenz density gradient (Proteogenix, France). A 10 ml Nycodenz cushion with a 1.3 g ml−1 density (8 g of Nycodenz to 10 ml of ultrapure water) was placed below the 10 ml of soil suspension in a centrifuge tube, followed by centrifugation at 3,220 G for 40 min at 4°C. The bacterial cell fraction, floating at the top of the density gradient, was carefully recovered with a pipette. The Nycodenz solution was removed from the bacteria by three consecutive washes using sterile 0.8% NaCl. The final cell pellet was resuspended in 90 µL of TE buffer (10 mM Tris, 1 mM EDTA, pH 8.0) and 10 µL of 25% glutaraldehyde solution were added (Sigma-Aldrich, Saint-Louis, MO, United States). The number of bacteria recovered was estimated by counting cells stained with 1X SYBR Green by flow cytometry on a BD Accuri C6 flow cytometer (Accuri Cytometers, Ann Arbor, MI, United States) after ten-fold dilution of the samples and filtration at 3 µm. The BD Accuri C6 flow cytometer threshold was set at 500 nm in fluorescence channel 1 (FL1). Green fluorescence was collected in the FL1 channel (533 ± 30 nm) on a logarithmic scale. Data analysis was carried out using the BD CFlow® software. Total bacterial counts were obtained by subtracting the counts in blank from the counts in the sample.
To analyze bacterial community structures, fingerprint terminal restriction fragment polymorphism (T-RFLP) analyses were performed for each soil sample as described by Hoeffner et al. (2018). Briefly, DNA was extracted from 0.5 g of soil according to the Griffiths protocol (Griffiths et al., 2000) modified by Monard et al. (2013). Bacterial 16S rRNA gene was amplified by polymerase chain reaction (PCR) using the fluorescently labeled forward primer 63F (5′-[6FAM] CAGGCCTAACACATGCAAGTC-3′) (Marchesi et al., 1998) and the reverse primer 1389R (5′-ACGGGCGG TGTGTACAAG-3′) (Osborn et al., 2000). Reaction mixtures (25 µL) contained 2 µL of ten-fold diluted soil DNA, 1X PCR buffer, 0.2 mM dNTPs, 0.4 µM of each primer and 2.5 units of AmpliTaq polymerase (Applied Biosystems). The PCR amplifications were performed with an initial denaturing step of 4 min at 95°C, followed by 25 cycles of 95°C for 30 s, 58°C for 1 min and 72°C for 1 min and a final extension step of 72°C for 10 min. For each sample, two PCRs were run separately and the replicated amplicons were pooled together and 20 µL were digested with 10 units of MspI (Promega) for 3 h at 37°C. The digested DNA were precipitated overnight and resuspended in 10 μL of sterile water. The T-RFs were separated and accurately sized on an ABI system analyzer (3,730; Applied Biosystems) at the Biogenouest platform. T-RFLP profiles were analyzed using Peakscanner version 1.0 (Software, Applied Biosystems, Foster City, CA, United States), and peaks from 50 to 500 bp were retained. Data compilation, determination of true peaks and T-RFLP alignment were undertaken using the T-REX platform (Culman et al., 2009), each T-RF was coded as a discrete variable (0 for its absence or 1 for its presence) and the bacterial richness (S) was expressed as the number of T-RFs.
Data and Statistical Analyses
All analyses were run using the R statistical software (http://www.r-project.org). As a time-series study, all the statistical analyses were implemented using individual sampling points as usually done for field measurements (Dumanoglu et al., 2014; Jaars et al., 2016; Osburn et al., 2019). To test for an effect of the biotope and sampling time on total VOC fluxes, one-factor ANOVAs were first implemented using the “lm” function. We then analyzed the effect of rainfall, soil temperature and Rh (relative humidity) on total VOC fluxes using generalized linear model (GLM) and the “glm” function (MASS package) with Gaussian error distribution and identity function. Rh and rainfall being correlated (R2 > 0.7), only rainfall was taken into account in the models. The performance of the models was estimated using the AIC (Sakamoto et al., 1986) and the “stepAIC” function from the MASS package. Redundancy Analysis (RDA) followed by hierarchical clustering (Ward method) was used to assess the influence of biotic and abiotic parameters on VOC emissions using the ADE4 package (Dray and Dufour, 2007). Highly correlated variables, R2 > 0.9 for environmental variables and R2 > 0.98 for VOCs, were reduced to one variable (i.e. rainfall and atmospheric temperature; soil nitrogen and sand contents; soil organic matter content, cation exchange capacity, soil water content, and bacterial abundance). Statistical significance was assessed by a Monte Carlo Test with 1,000 permutations. Non-metric multidimensional scaling (NMDS) of bacterial community structures were performed using the “vegan” library (Oksanen et al., 2015) followed by hierarchical classification with the “pvclust” package (Suzuki and Shimodaira, 2006). Jaccard distances were calculated on the presence-absence data, and a non-parametric similarity test (function “anosim”) was implemented to compare the bacterial composition between biotopes and between day and night samples. The hierarchical classification used the ward method on binary distances. Spearman correlations between T-RF and VOC matrixes were calculated with the “cor” function and visualized using the “gplots” library.
Results
Characterization of the Soils From the Three Biotopes
The soils from the forest and the meadow were qualified as loamy and the one from the heathland as sandy loam; all three soils were acid with pH varying from 4.0 to 4.7 (Table 1). The soil from the meadow presented the lowest content in organic matter (6.0%) and in bacteria (8.2 104 bacterial cells per gram of dry soil), but the highest bacterial richness (Table 1). It was covered with Arrhenatherum elatius. The soil from the heathland had the highest total nitrogen (4.0 g of N per kg of dry soil) and bacterial contents (3.1 105 bacterial cells per gram of dry soil) and its plant cover was dominated by Agrostis curtisii. The soil from the oak forest was the richest in organic matter (9.3%); it was entirely covered with oak leaf litter without any plant cover (Supplementary Figure 3).
Spatial and Temporal Dynamics of Volatile Organic Compounds Fluxes and Their Composition
The mean VOC fluxes observed from soils in the heathland and the meadow were similar (12.3 ± 6.6 and 11.4 ± 3.8 µg VOCs h−1 m−2, respectively) and higher than those in the oak forest biotope (6.9 ± 2.6 µg VOCs h−1 m−2). However, due to high variations among total VOC fluxes measured in each biotope with time, no significant effect of the biotope on the total VOC fluxes was observed (ANOVA, F = 1.17, p = 0.35). Some changes in the composition of masses were detected between the three biotopes. The highest total richness of masses (sum of all the different masses detected) was observed in VOC fluxes emitted by the soil in the meadow, with 32 different masses detected, m60, m91, m107, and m121 being specific to this biotope (Figure 2). They were only detected at the first sampling time (day, right after rainfall, Figure 1). No single VOC mass was specific to the soil in the heathland that presented an intermediate VOC richness of 28 masses. In the oak forest, the total VOC richness was the lowest (S = 20), and m95, known as phenol (Supplementary Table 3; Feilberg et al., 2015), was specific to this biotope (Figure 2). Interestingly, m 33 and m69, identified as methanol and isoprene, respectively (Supplementary Table 3; Warneke et al., 1999; Aaltonen et al., 2013; Veres et al., 2014), were not detected in the gas samples from the forest soil.
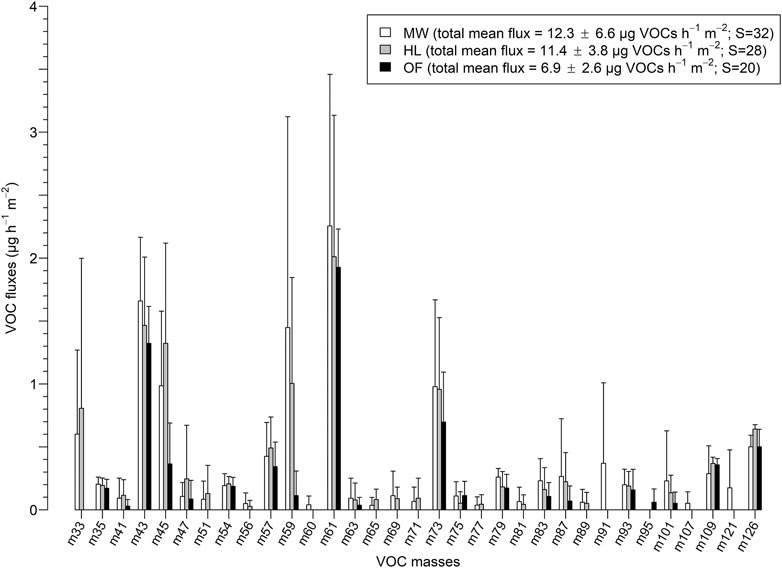
FIGURE 2. Mean fluxes of each mass that composed the VOC spectra emitted by the meadow (MW, white), the heathland (HL, grey), and the forest (OF, black) soils for the four sampling times. Error bars represent standard deviations.
In each biotope, the VOC fluxes varied over time (ANOVA, F = 4.41, p = 0.04; Figure 3). Whatever the biotope, VOC fluxes were the highest at the first sampling time (day, right after rainfall, Figure 1), ranging from 10.8 to 23.2 µg VOCs h−1 m−2 in the forest and meadow biotopes, respectively. In the meadow and in the heathland, fluxes decreased gradually over time, down to 6.8 µg VOCs h−1 m−2 while VOC flux from the oak forest soil at the last sampling time (7.4 µg VOCs h−1 m−2) was higher than the ones observed at the second (5.4 µg VOCs h−1 m−2) and third sampling times (3.8 µg VOC h−1 m−2), which happened at night (Figure 3).
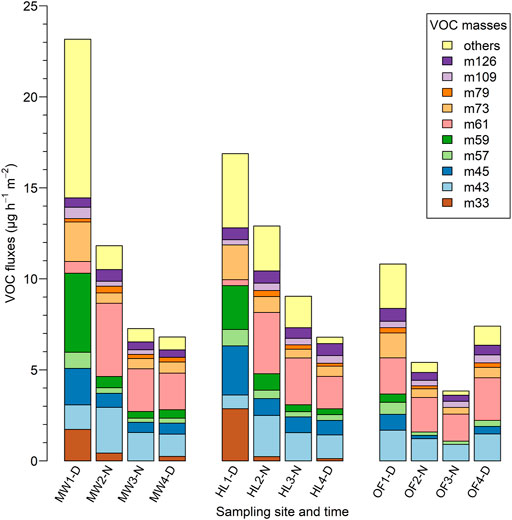
FIGURE 3. Fluxes of the masses that composed the VOC spectra emitted by the meadow (MW), the heathland (HL) and the oak forest (OF) soils at the four sampling times (D—Day time and N—Night time). The ten main masses are detailed, the other ones are summed and presented as others.
Regarding the fluxes of individual masses, twelve (m35, m41, m45, m54, m57, m59, m63, m73, m83, m87, m93, and m101) out of the 33 different masses detected during the entire sampling, were emitted in higher amount at the first sampling time (day, right after rainfall, Figure 1) whatever the biotope. Among these masses, some had similar emission patterns to the total VOC fluxes observed in each biotope (m45, m57, and m73; Figure 3). Others were only detected at the first sampling time (m51, m56, m63, m71, m77, and m81) and, among them, m51, m56, m71, m77, and m81 were solely emitted by the meadow and heathland soils (details not shown). The fluxes of m33 (methanol) from the meadow and heathland soils were at least 4 and 12 times greater at the first sampling time than at the three other ones, respectively. These methanol emissions corresponded to 7.5 and 17% of the total VOC fluxes from the meadow and heathland soils at this first sampling time, respectively. Contrarily to the general trend, m43 and m61 presented a reduced flux at the first sampling time in the meadow and heathland compared to the latter samplings (Figure 3). Apart from this first sampling, these two masses had similar emission patterns, the mean m43/m61 ratio from the three last samplings being of 0.64 ± 0.04. The mass m126 seemed to be continuously emitted, its fluxes not varying much in space and time (Figure 3).
Regulation Factors of Volatile Organic Compound Emissions From Soils
The VOC fluxes from soils were significantly shaped by environmental biotic and abiotic data associated to each biotope (Monte Carlo test, obs = 0.548, p = 0.029, Figure 4), and the total VOC flux significantly increased with soil temperature (GLM, p = 0.002). The RDA results (Figures 4A,B) showed that some VOCs emitted by soils (m35, m41, m45 (acetaldehyde)/m33 (methanol), m54, m63, m73/m57, m77, and m83 with correlation coefficients >0.8 to the first axis, Supplementary Table 4) were strongly shaped by climatic factors (rainfall and atmospheric temperature with the highest correlation coefficient, 0.94, to the first axis, Supplementary Table 5). The VOC spectra observed at the first sampling time (day, right after rainfall, see also Figure 1) were similar in the three studied biotopes, but separated from the other sampling times on the first axis that accounted for 73.48% of variation (Figure 4C). For the other sampling times, VOC spectra from the heathland and meadow biotopes were slightly different, while the VOC spectra from the oak forest were clearly separated from the two other biotopes. At these sampling times without significant rainfall (sampling time 2–4, see Figure 1), VOC fluxes were negatively shaped by the relative humidity of air inside the accumulation chamber (correlation coefficients to first axis of −0.81, Supplementary Table 5) that increased with time whatever the biotope (Supplementary Table 2).
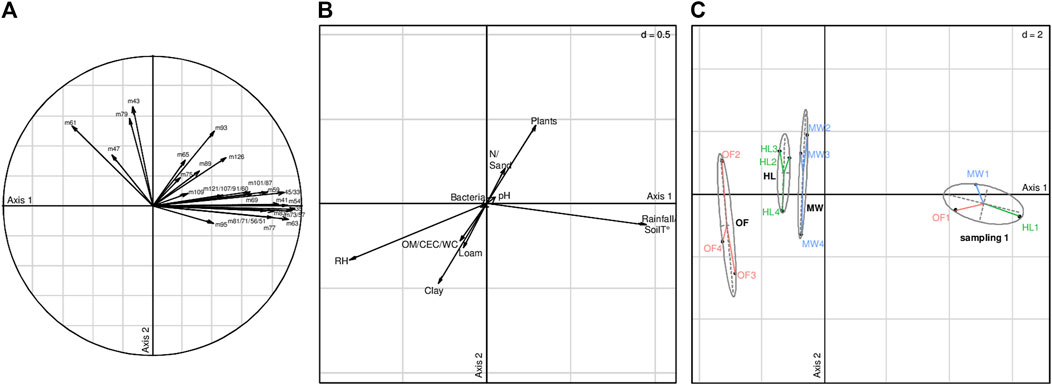
FIGURE 4. Results of RDA analysis on VOC fluxes from soil (A) and environmental data (B) associated to different biotopes at various sampling moments (C). (a) The contribution of each VOC to each axis, (b) the correlation coefficients of each parameter to each axis, and c) the projection of the composition of VOC fluxes recorded in different biotopes (MW-meadow, HL-heathland, OF-oak forest) at different sampling times (1–4, see Figure 1) and clustered into three groups following a hierarchical cluster analysis. Observations were done on July 18 and 19, 2017. Monte-Carlo test (1,000 permutations): p = 0.029. Eigenvalues of constrained and unconstrained axes were 66.69 and 33.31%, respectively. RDA was constructed on the first two constrained axes with eigenvalues of 73.48 and 13.37%, respectively. CEC—cation exchange capacity, OM—organic matter, WC—water content, RH—relative humidity of air, Atm. T—atmospheric temperature, Bacteria—abundance of soil bacteria, Plants—Plant richness.
The bacterial communities from the three biotopes were significantly different (anosim, R2 = 0.36, p = 0.001, Figure 5A). While the day and night samplings were similar when all three biotopes were pooled (anosim, R2 = 0.05, p = 0.19), the bacterial communities were clustered in distinct day and night samples (first and third samplings, respectively) within each biotope (pvclust, approximately unbiased p > 82%, Figure 5B). Spearman correlations were calculated between VOC fluxes and the T-RF matrix obtained from fingerprint analyses of bacterial communities in the three biotopes performed at day (first sampling) and night (third sampling) using T-RFLP (Supplementary Figure 4). While no significant correlation was observed between the VOC spectra emitted and the total bacterial richness (Figure 4, Supplementary Table 5), specific strong relationships were observed between individual VOCs and the presence of some T-RFs (Supplementary Figure 4), either positive (e.g., T-RFs 111, 222, 398 and 414 with m60, m89, m91, m107, and m121, or T-RFs 61, 72, 213, 252, 368, 397, 406, 409, 415, and 459 with m95) or negative relationships (e.g., T-RFs 94, 107, 112, 118.5, 267, and 269 with m65, or the T-RF 135 and 420 with the m43; Supplementary Figure 4). However, no generalizable links could be concluded neither for a mass nor a T-RFs. (Supplementary Figure 4).
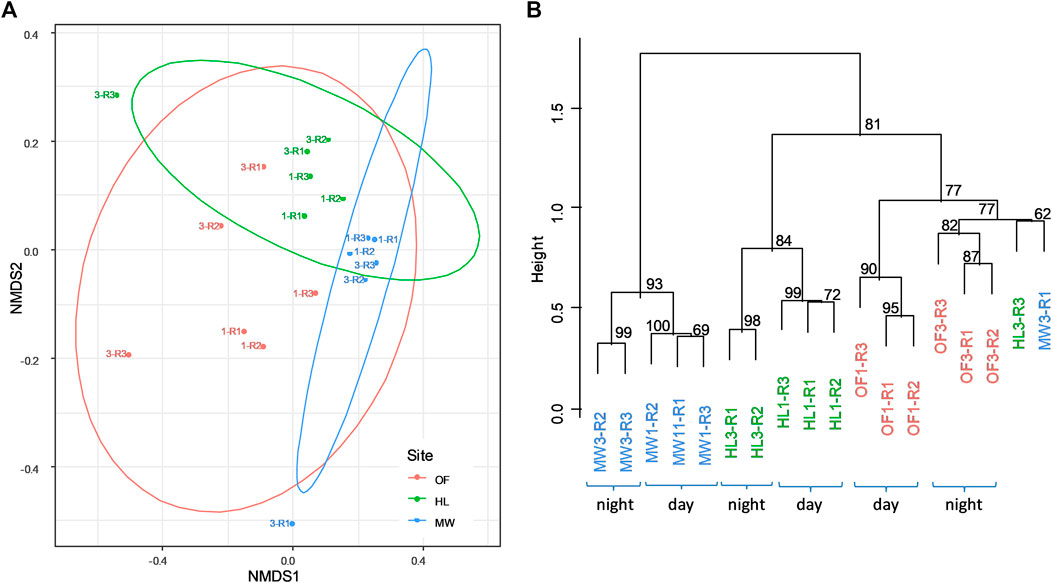
FIGURE 5. A) NMDS performed on the bacterial composition in soils of the three sites, OF—Oak Forest (red), HL—Heathland (green), MW—Meadow (blue), measured as presence-absence (Jaccard distribution, k = 2, Stress = 0.12). Samples are indicated with 1-day and 3-night as well as R1 to R3 for replicates (see also B). The ellipsoids indicate the significant difference in bacteria composition between sites (anosim, R2 = 0.355, p = 0.001). (B). The hierarchical classification (ward method on binary distances) confirms the clear distinction of the bacteria composition between sites (bootsrap n = 100, approximately unbiased p ranges between 77 and 93%) and between day and night (bootsrap n = 1,000, approximately unbiased p ranges between 82 and 100%).
Discussion
The present study aimed to determine spatial and temporal dynamics of VOC emissions by soil systems. This short time-series study in three distinct biotopes included individual sampling points allowing to observe interesting trends in the dynamics of VOC fluxes despite the lack of repeated concurrent measurements. Surprisingly, the biotope did not significantly impact the quantitative fluxes of VOCs due to high variation between the four measurements. However, in line with previous studies (Veres et al., 2014; Mancuso et al., 2015; Rossabi et al., 2018), differences in the composition of VOC fluxes were observed among the three studied sites (i.e., biotopes) thanks to the multivariate analysis distinguishing each corresponding time series. A generalization of this site-specific result to biotope level would need a study that involves spatial replication for each biotope. The VOCs sampling device used in the present study did not allow us to differentiate the VOCs emitted by soils to those emitted by the plant cover present inside the collar (Supplementary Figure 2, 3). We thus measured VOC emissions by soil systems, including soil by itself but also the vegetation it supports and the associated roots and litters. The spatial dynamic of the mass composition of VOC fluxes might thus be attributed to the contrasted soil physicochemical properties of the three biotopes (Petersen et al., 1995; Scanlon et al., 2002; Rolston and Moldrup, 2012), the differences in the composition of their soil microbial communities (McNeal and Herbert, 2009; Svendsen et al., 2018), but also to their distinct plant cover (Kesselmeier and Staudt, 1999) and/or type of litter deposited at the soil surface (Isidorov and Jdanova, 2002; Leff and Fierer, 2008; Yuan et al., 2009; Gray et al., 2010). The present study focused on soil bacteria because of their high abundance in soils and their well-studied involvement in VOC emissions. However, fungi have also been shown to produce VOCs, such as isoprene, acetone or acetaldehyde (Bäck et al., 2010.; Müller et al., 2013), which should also have an impact on our measured VOC fluxes.
It is noteworthy that no isoprene and methanol emission was detected in gas samples from the oak forest biotope. In this biotope, the soil was covered with oak leaf litter without any growing plant inside the collar contrarily to the other biotopes. This could explain the absence of isoprene which is mainly emitted by the photosynthetic parts of plants (Sharkey and Yeh, 2001; Sharkey et al., 2008). The forest soil had a more specific bacterial community than the two other ones, which might have led to the more specific VOC emission patterns observed in this biotope. For instance the absence of methanol emissions in the oak forest was striking. Methanol is indeed produced by both plants and soil microorganisms (Peñuelas et al., 2014; Gonzaga Gomez et al., 2019). As we measured the net fluxes, we were thus unable to determine if this compound was not detected in the soil from the forest due to high uptakes or due to an absence of production by soil microorganisms. Microorganisms can indeed consume VOCs, making soil systems either source or sink of these molecules (Cleveland and Yavitt, 1998; Owen et al., 2007; Leff and Fierer, 2008). Methanol is known to be produced by forest floors (Aaltonen et al., 2013; Gray et al., 2014; Mäki et al., 2019) during plant litter decomposition (Gray et al., 2010) and was described as being produced by oak roots due to pectin demethylation during their growth (Folkers et al., 2008). It is most likely that the forest biotope constituted a sink for methanol. Methanol uptake by soil has previously been described in wet conditions (Asensio et al., 2007; Schade et al., 2011; Bachy et al., 2018). Trace gas uptake in soils is generally mediated by microorganisms and the rates are affected by physical parameters such as soil texture and water filled pore space, which control the diffusion rates to hot spots of active microorganisms in soil (e.g., Smith et al., 2003). Moreover, some physical adsorption and desorption mechanisms (Laffineur et al., 2012) also regulate the bi-directional exchange dynamics depending on soil surface temperature and humidity (Bachy et al., 2018). Consumption of methanol is performed by methylotroph bacteria (Kolb, 2009) and has already been observed in soils (Stacheter et al., 2013; Morawe et al., 2017). It has been shown that the methanol oxidation activity was more important under the presence of roots (Stacheter et al., 2013) leading to higher methanol uptakes from root-containing soils as observed by Asensio et al. (2007), who concluded that rhizospheric microorganisms should consume methanol. Thus, the absence of methanol in the VOC spectra emitted by the soil from the oak forest might be due to an uptake by the soil due to both its physicochemical properties and the activity of specific rhizospheric microbial communities. However, the underpinned processes still remain unclear and our study did not allow us to disentangle the mechanisms specific to the observed methanol exchanges and the way the forest biotope acted as a sink of methanol.
The GLM indicated that the soil temperature was the main climatic factor measured controlling total VOC flux and its emission patterns. Bachy et al. (2018) already observed that methanol fluxes from a cropland soil were positively correlated with soil surface temperature as did Asensio et al. (2008) on a calcic loamy soil, Schade and Custer (2004) on an agricultural field, and Gray et al. (2014) and Greenberg et al. (2012) on a soil from a pine forest. Besides methanol, Aaltonen et al. (2013) and Gray et al. (2014) observed similar results for acetaldehyde. Temperature has such a strong effect on VOC emissions that we were able to identify it as a main regulating factor in the present short-term study, corroborating previous results obtained with continuous long-term field measurements (e.g., Aaltonen et al., 2013). Temperature controls both the volatility and the biological production process of VOCs in soils but it seems that its biological effect overtakes the physicochemical one, as Li et al. (2019) did not observe any effect of the temperature on VOC emissions from a sterile soil. Temperature has a direct effect on microbial activity and soil respiration (Paul and Clark, 1996; Pietikäinen et al., 2005). This could lead to an increase in soil organic matter decomposition that constitutes a source of VOCs produced by this microbial process (Isidorov and Jdanova, 2002; Leff and Fierer, 2008). Moreover, temperature also controls VOC emissions by plants; VOC fluxes from plant leaves being correlated with temperature (Mozaffar et al., 2017; Gonzaga Gomez et al., 2019). The effect of temperature on VOC fluxes observed in the present study might thus have resulted from both changes in soil microbial activity and in emission patterns by the plants present inside the collar.
Whatever the biotope, VOC fluxes were the highest at the first and warmest sampling time performed directly after the intense rain event that occurred during the three hours before the first sampling. These higher fluxes of VOCs were due to both higher emissions of a “core” spectrum of VOCs but also to the emission of molecules that were only detected right after the rainfall. Such a pulse in total VOC emission from soil systems following wetting events has been previously observed in laboratory conditions and described to last approximately 5 h (Rossabi et al., 2018). As previously observed (Greenberg et al., 2012), emissions of methanol (mass 33) from the meadow and heathland soils, and acetaldehyde (mass 45) and acetone (mass 59) from all soils were higher just after the rain event. This pulse of VOC emissions might be linked to a stimulation of soil microbial activity (Landesman and Dighton, 2011) due to a combined effect of higher soil moisture content and temperature, this latter being the highest at this sampling time.
The RDA pointed out that some VOC fluxes were affected by an increase in the relative humidity of air in the sampling chamber headspace. It has previously been reported that PTR-MS measurements might be biased by changes in relative humidity due to the formation of water clusters that differently react with compounds than H3O+ in the drift tube (Pang, 2015; Trefz et al., 2018). However, this bias in VOC quantification due to water clusters leads to higher amounts of VOCs detected with increased relative humidity (Trefz et al., 2018).Our results showed the opposite trend. Such reversed relation between VOC fluxes and relative humidity has previously been reported (Asensio et al., 2007) and was assigned to physical adsorption of oxygenated VOCs to water (Pignatello and Xing, 1996; Aaltonen et al., 2013). The relative humidity of air affects the amount of surface-adsorbed water inside the chamber and acts on gas uptake rates and deposit on soil (Crowley et al., 2010). As noticed by Aaltonen et al. (2013), with increasing relative humidity, a water film thickened at the inner surface of their sampling chamber and may have an effect on the most water-soluble compounds by catching or dissolving them. Such a phenomenon might have taken place in our stainless-steel chamber while sampling at high level of relative humidity, the relative humidity of air increasing from the first to the fourth samplings independently of the biotope.
As proposed by Gray et al. (2010), the masses 43 and 61 can be associated to acetic acid (Supplementary Table 3) since they presented similar emission patterns except for the first sampling. Acetic acid emissions from the meadow and heathland soils responded differently than the total VOC emissions and were lower at the first sampling time than at the three latter times. It has previously been observed that bare soils could significantly uptake acetic acid (Bachy et al., 2016) probably due to microbial consumption. Moreover, it has recently been shown that plants can also act as an acetic acid sink, and that deposition increased during daytime (Gonzaga Gomez et al., 2019). As we measured net fluxes, we did not have access to gross rates, acetic acid could thus have been i) less produced or more consumed by soil microorganisms and/or ii) more deposited on plants at the soil surface in both the meadow and heathland biotopes after the rain event. Moreover, some abiotic processes, such as adsorption on the soil matrix (Breus and Mishchenko, 2006), might also be involved since changes in the m43/m61 ratios were observed at this first sampling time and might be explained by changes of the equilibrium between biotic and abiotic emissions of VOCs (Gray et al., 2010).
Diurnal dynamics of VOC fluxes from soils have previously been observed (Schade and Custer, 2004; Aaltonen et al., 2013; Bachy et al., 2018; Mäki et al., 2019) but were not detected in the present study. It seemed that the rain event had such a strong effect on total VOC fluxes from the meadow and heathland soils that it surpassed the diurnal dynamic that could have been observed. Longer and repeated monitoring would have been necessary to prevent this effect. In the forest soil, probably due to the canopy of oak trees, the rain drops on soil might have been limited and we observed more total VOC fluxes in day time (first and fourth samplings) than at night (second and third samplings). These variations might be attributed to diurnal changes of atmospheric and soil temperatures or radiation (Schade and Custer, 2004; Aaltonen et al., 2013; Bachy et al., 2018; Mäki et al., 2019) and they were detected for several masses in this biotope (m35, m43, m45, m57, m61, m73, m75, m79, m83, and m126) but not for acetone (m59) as already described before (Schade and Custer, 2004). For all biotopes we observed changes in the structure of bacterial community between day (first sampling—three replicates) and night (third sampling—three replicates) time. While these differences in bacterial communities could be linked to changes in relative humidity (84 and 93.5% at the first and third samplings, respectively) and soil temperature (19.7 and 18.7°C at the first and third samplings, respectively), it has been previously observed that soil microorganisms can be regulated by the plant circadian clock inducing changes in their community between day and night time points (Staley et al., 2017; Hubbard et al., 2018). This temporal dynamic of microbial communities within each biotope might thus have impacted the flux of VOCs emitted in quantity and composition since VOCs could be considered as indicators of shifts in the composition of soil microbial communities (Bunge et al., 2008; McNeal and Herbert, 2009; Svendsen et al., 2018). Moreover, these changes in soil microbial communities can induce differences in individual VOC emissions (Potard et al., 2017) through switches in the equilibrium between consuming and producing microbial populations. We indeed observed both negative and positive correlations between some bacterial T-RFs and some specific VOCs that could respectively indicate consumption and production of these molecules.
Conclusion
This study aimed to characterize VOC emissions by soil systems from three different biotopes during a 24 h monitoring in summer. Although it would have benefit from longer monitoring, it supplies data regarding VOC emissions by soils which are scare compared to plant sources. We observed that total VOC fluxes from soil systems to the atmosphere seemed to primarily rely on climatic parameters (soil temperature). Moreover, the intense rainfall event combined to high atmospheric temperatures were behind pulses of total VOC emissions from soil systems. The mass composition of the VOC spectra was probably driven by several interacting biotic and abiotic soil properties leading to differences between the three biotopes, the soil from the oak forest emitting specific VOC spectra. Bacterial communities tended to be structured depending on the biotope they originated from, but their specific involvement in the emission of VOCs from soils could not be highlighted in the present study. This may be due to their role in both production and consumption of these molecules and to their interdependence with abiotic parameters that control their diversity and activity just like they physically regulate VOC fluxes. Moreover, our sampling device allowed us to sample VOCs emitted by soil systems, which comprise the soil with its vegetation and associated roots and litters that were specific to each biotope. Overall, these results highlighted the complex interconnections between abiotic and biotic parameters that could directly or indirectly drive VOC emissions in a short-term (flux and diversity of masses) and pointed out the concurrent need for experiments in controlled conditions that would allow to disentangle the regulating parameters of VOC emissions from the soil to the atmosphere.
Data Availability Statement
The raw data supporting the conclusions of this article will be made available by the authors, without undue reservation.
Author Contributions
CM designed the experiment and AN supervised the entire Bioblitz study. CM and AN wrote the manuscript. All the authors performed the field work and reviewed the manuscript. J-LLG and J-PC developed the monitoring of VOC emissions from soil. VJ provided the data regarding the Fauna diversity. CM and EH performed the bacterial analyses. AN, CLL, and CM conducted the data and statistical analyses.
Conflict of Interest
The authors declare that the research was conducted in the absence of any commercial or financial relationships that could be construed as a potential conflict of interest.
Acknowledgments
This research was partly supported by the CNRS-INSU “Ecosphère Continentale et Côtière” program and CNRS-MITI “Génomique Environnementale” program. The authors kindly thank Françoise Le Moal for supplying the data of “Meteo France”. We thank all expert participants and curious non-expert participants of the BioBlitz that took place at the Biological Field Station of Paimpont, France in 2017. We are grateful to the “Plateforme d’Ecologie Moléculaire” (PEM) from the ECOBIO lab where the molecular works were performed.
Supplementary Material
The Supplementary Material for this article can be found online at: https://www.frontiersin.org/articles/10.3389/fenvs.2021.650701/full#supplementary-material
References
Aaltonen, H., Aalto, J., Kolari, P., Pihlatie, M., Pumpanen, J., Kulmala, M., et al. (2013). Continuous VOC Flux Measurements on Boreal forest Floor. Plant Soil 369, 241–256. doi:10.1007/s11104-012-1553-4
Asensio, D., Peñuelas, J., Filella, I., and Llusià, J. (2007). On-line Screening of Soil VOCs Exchange Responses to Moisture, Temperature and Root Presence. Plant Soil 291, 249–261. doi:10.1007/s11104-006-9190-4
Asensio, D., Peñuelas, J., Prieto, P., Estiarte, M., Filella, I., and Llusià, J. (2008). Interannual and Seasonal Changes in the Soil Exchange Rates of Monoterpenes and Other VOCs in a Mediterranean Shrubland. Eur. J. Soil Sci. 59, 878–891. doi:10.1111/j.1365-2389.2008.01057.x
Atkinson, R., and Arey, J. (2003). Gas-phase Tropospheric Chemistry of Biogenic Volatile Organic Compounds: a Review. Atmos. Environ. 37, 197–219. doi:10.1016/S1352-2310(03)00391-1
Atkinson, R. (2000). Atmospheric Chemistry of VOCs and NOx. Atmos. Environ. 34, 2063–2101. doi:10.1016/S1352-2310(99)00460-4
Avnery, S., Mauzerall, D. L., Liu, J., and Horowitz, L. W. (2011). Global Crop Yield Reductions Due to Surface Ozone Exposure: 1. Year 2000 Crop Production Losses and Economic Damage. Atmos. Environ. 45, 2284–2296. doi:10.1016/j.atmosenv.2010.11.045
Bachy, A., Aubinet, M., Amelynck, C., Schoon, N., Bodson, B., Moureaux, C., et al. (2018). Methanol Exchange Dynamics between a Temperate Cropland Soil and the Atmosphere. Atmos. Environ. 176, 229–239. doi:10.1016/J.ATMOSENV.2017.12.016
Bachy, A., Aubinet, M., Schoon, N., Amelynck, C., Bodson, B., Moureaux, C., et al. (2016). Are BVOC Exchanges in Agricultural Ecosystems Overestimated? Insights from Fluxes Measured in a maize Field over a Whole Growing Season. Atmos. Chem. Phys. 16, 5343–5356. doi:10.5194/acp-16-5343-2016
Bäck, J., Aaltonen, H., Hellén, H., Kajos, M. K., Patokoski, J., Taipale, R., et al. (2010). Variable Emissions of Microbial Volatile Organic Compounds (MVOCs) from Root-Associated Fungi Isolated from Scots pine. Atmos. Environ. 44, 3651–3659. doi:10.1016/j.atmosenv.2010.06.042
Breus, I. P., and Mishchenko, A. A. (2006). Sorption of Volatile Organic Contaminants by Soils (A Review). Eurasian Soil Sci. 39, 1271–1283. doi:10.1134/S1064229306120015
Bunge, M., Araghipour, N., Mikoviny, T., Dunkl, J., Schnitzhofer, R., Hansel, A., et al. (2008). On-line Monitoring of Microbial Volatile Metabolites by Proton Transfer Reaction-Mass Spectrometry. Appl. Environ. Microbiol. 74, 2179–2186. doi:10.1128/AEM.02069-07
Cleveland, C. C., and Yavitt, J. B. (1998). Microbial Consumption of Atmospheric Isoprene in a Temperate forest Soil. Appl. Environ. Microbiol. 64, 172–177. doi:10.1128/aem.64.1.172-177.1998
Courtois, S., Frostegard, A., Goransson, P., Depret, G., Jeannin, P., and Simonet, P. (2001). Quantification of Bacterial Subgroups in Soil: Comparison of DNA Extracted Directly from Soil or from Cells Previously Released by Density Gradient Centrifugation. Environ. Microbiol. 3, 431–439. doi:10.1046/j.1462-2920.2001.00208.x
Crowley, J. N., Ammann, M., Cox, R. A., Hynes, R. G., Jenkin, M. E., Mellouki, A., et al. (2010). Evaluated Kinetic and Photochemical Data for Atmospheric Chemistry: Volume V - Heterogeneous Reactions on Solid Substrates. Atmos. Chem. Phys. 10, 9059–9223. doi:10.5194/acp-10-9059-2010
Culman, S. W., Bukowski, R., Gauch, H. G., Cadillo-Quiroz, H., and Buckley, D. H. (2009). T-REX: Software for the Processing and Analysis of T-RFLP Data. BMC Bioinformatics 10, 171. doi:10.1186/1471-2105-10-171
Dam, N. M. Van., Weinhold, A., and Garbeva, P. (2016). “Calling in the Dark: the Role of Volatiles for Communication in the Rhizosphere,” in Deciphering Chemical Language of Plant Communication. Editors J. D. Blande, and R. Glinwood (Cham: Springer International Publishing), 175–210. doi:10.1007/978-3-319-33498-1
Dray, S., and Dufour, A.-B. (2007). The Ade4 Package: Implementing the Duality Diagram for Ecologists. J. Stat. Softw. 22, 1–20. doi:10.18637/jss.v022.i04Available at: https://www.jstatsoft.org/article/view/v022i04
Dumanoglu, Y., Kara, M., Altiok, H., Odabasi, M., Elbir, T., and Bayram, A. (2014). Spatial and Seasonal Variation and Source Apportionment of Volatile Organic Compounds (VOCs) in a Heavily Industrialized Region. Atmos. Environ. 98, 168–178. doi:10.1016/j.atmosenv.2014.08.048
Ellis, A. M., and Mayhew, C. A. (2014). Proton Transfer Reaction Mass Spectrometry: Principles and Applications. Chichester, West Sussex: John Wiley & Sons. doi:10.1002/9781118682883
Feilberg, A., Bildsoe, P., and Nyord, T. (2015). Application of PTR-MS for Measuring Odorant Emissions from Soil Application of Manure Slurry. Sensors 15, 1148–1167. doi:10.3390/s150101148
Folkers, A., Hüve, K., Ammann, C., Dindorf, T., Kesselmeier, J., Kleist, E., et al. (2008). Methanol Emissions from Deciduous Tree Species: Dependence on Temperature and Light Intensity. Plant Biol. 10, 65–75. doi:10.1111/j.1438-8677.2007.00012.x
Gonzaga Gomez, L., Loubet, B., Lafouge, F., Ciuraru, R., Buysse, P., Durand, B., et al. (2019). Comparative Study of Biogenic Volatile Organic Compounds Fluxes by Wheat, maize and Rapeseed with Dynamic chambers over a Short Period in Northern France. Atmos. Environ. 214, 116855. doi:10.1016/j.atmosenv.2019.116855
Gray, C. M., Monson, R. K., and Fierer, N. (2014). Biotic and Abiotic Controls on Biogenic Volatile Organic Compound Fluxes from a Subalpine forest Floor. J. Geophys. Res. Biogeosci. 119, 547–556. doi:10.1002/2013JG002442.Received10.1002/2013jg002575
Gray, C. M., Monson, R. K., and Fierer, N. (2010). Emissions of Volatile Organic Compounds during the Decomposition of Plant Litter. J. Geophys. Res. 115, G03015. doi:10.1029/2010JG001291
Greenberg, J. P., Asensio, D., Turnipseed, A., Guenther, A. B., Karl, T., and Gochis, D. (2012). Contribution of Leaf and Needle Litter to Whole Ecosystem BVOC Fluxes. Atmos. Environ. 59, 302–311. doi:10.1016/j.atmosenv.2012.04.038
Griffiths, R. I., Whiteley, A. S., O'Donnell, A. G., and Bailey, M. J. (2000). Rapid Method for Coextraction of DNA and RNA from Natural Environments for Analysis of Ribosomal DNA- and rRNA-Based Microbial Community Composition. Appl. Environ. Microbiol. 66, 5488–5491. doi:10.1128/aem.66.12.5488-5491.2000
Guenther, A., Karl, T., Harley, P., Wiedinmyer, C., Palmer, P. I., and Geron, C. (2006). Estimates of Global Terrestrial Isoprene Emissions Using MEGAN (Model of Emissions of Gases and Aerosols from Nature). Atmos. Chem. Phys. Discuss. 6, 107–173. doi:10.5194/acpd-6-107-2006
Hoeffner, K., Monard, C., Santonja, M., and Cluzeau, D. (2018). Feeding Behaviour of Epi-Anecic Earthworm Species and Their Impacts on Soil Microbial Communities. Soil Biol. Biochem. 125, 1–9. doi:10.1016/j.soilbio.2018.06.017
Hubbard, C. J., Brock, M. T., van Diepen, L. T., Maignien, L., Ewers, B. E., and Weinig, C. (2018). The Plant Circadian Clock Influences Rhizosphere Community Structure and Function. ISME J. 12, 400–410. doi:10.1038/ismej.2017.172
Insam, H., and Seewald, M. S. A. (2010). Volatile Organic Compounds (VOCs) in Soils. Biol. Fertil. Soils 46, 199–213. doi:10.1007/s00374-010-0442-3
Isidorov, V., and Jdanova, M. (2002). Volatile Organic Compounds from Leaves Litter. Chemosphere 48, 975–979. doi:10.1016/S0045-6535(02)00074-7
Jaars, K., van Zyl, P. G., Beukes, J. P., Hellén, H., Vakkari, V., Josipovic, M., et al. (2016). Measurements of Biogenic Volatile Organic Compounds at a Grazed savannah Grassland Agricultural Landscape in South Africa. Atmos. Chem. Phys. 16, 15665–15688. doi:10.5194/acp-16-15665-2016
Kai, M., Effmert, U., Berg, G., and Piechulla, B. (2007). Volatiles of Bacterial Antagonists Inhibit Mycelial Growth of the Plant Pathogen Rhizoctonia solani. Arch. Microbiol. 187, 351–360. doi:10.1007/s00203-006-0199-0
Kesselmeier, J., and Staudt, M. (1999). Biogenic Volatile Organic Compounds (VOC): an Overview on Emission, Physiology and Ecology. J. Atmos. Chem. 33, 23–88. doi:10.1023/A:1006127516791
Kolb, S. (2009). Aerobic Methanol-oxidizingBacteria in Soil. FEMS Microbiol. Lett. 300, 1–10. doi:10.1111/j.1574-6968.2009.01681.x
Król, S., Zabiegała, B., and Namieśnik, J. (2010). Monitoring VOCs in Atmospheric Air II. Sample Collection and Preparation. Trac Trends Anal. Chem. 29, 1101–1112. doi:10.1016/j.trac.2010.05.010
Laffineur, Q., Aubinet, M., Schoon, N., Amelynck, C., Müller, J.-F., Dewulf, J., et al. (2012). Abiotic and Biotic Control of Methanol Exchanges in a Temperate Mixed forest. Atmos. Chem. Phys. 12, 577–590. doi:10.5194/acp-12-577-2012
Landesman, W. J., and Dighton, J. (2011). Shifts in Microbial Biomass and the Bacteria: Fungi Ratio Occur under Field Conditions within 3 H after Rainfall. Microb. Ecol. 62, 228–236. doi:10.1007/s00248-011-9811-1
Leff, J. W., and Fierer, N. (2008). Volatile Organic Compound (VOC) Emissions from Soil and Litter Samples. Soil Biol. Biochem. 40, 1629–1636. doi:10.1016/j.soilbio.2008.01.018
Li, G., Cheng, Y., Kuhn, U., Xu, R., Yang, Y., Meusel, H., et al. (2019). Physicochemical Uptake and Release of Volatile Organic Compounds by Soil in Coated-wall Flow Tube Experiments with Ambient Air. Atmos. Chem. Phys. 19, 2209–2232. doi:10.5194/acp-19-2209-2019
Lindinger, W., Hansel, A., and Jordan, A. (1998). On-line Monitoring of Volatile Organic Compounds at Pptv Levels by Means of Proton-Transfer-Reaction Mass Spectrometry (PTR-MS) Medical Applications, Food Control and Environmental Research. Int. J. Mass Spectrom. Ion Process. 173, 191–241. doi:10.1016/S0168-1176(97)00281-4
Mäki, M., Aalto, J., Hellén, H., Pihlatie, M., and Bäck, J. (2019). Interannual and Seasonal Dynamics of Volatile Organic Compound Fluxes from the Boreal forest Floor. Front. Plant Sci. 10, 1–14. doi:10.3389/fpls.2019.00191
Mancuso, S., Taiti, C., Bazihizina, N., Costa, C., Menesatti, P., Giagnoni, L., et al. (2015). Soil Volatile Analysis by Proton Transfer Reaction-Time of Flight Mass Spectrometry (PTR-TOF-MS). Appl. Soil Ecol. 86, 182–191. doi:10.1016/j.apsoil.2014.10.018
Marchesi, J. R., Sato, T., Weightman, A. J., Martin, T. A., Fry, J. C., Hiom, S. J., et al. (1998). Design and Evaluation of Useful Bacterium-specific PCR Primers that Amplify Genes Coding for Bacterial 16S rRNA. Appl. Environ. Microbiol. 64, 795–799. doi:10.1128/AEM.64.2.795-799.1998
McNeal, K. S., and Herbert, B. E. (2009). Volatile Organic Metabolites as Indicators of Soil Microbial Activity and Community Composition Shifts. Soil Sci. Soc. Am. J. 73, 579–588. doi:10.2136/sssaj2007.0245
Monard, C., Gantner, S., and Stenlid, J. (2013). Utilizing ITS1 and ITS2 to Study Environmental Fungal Diversity Using Pyrosequencing. FEMS Microbiol. Ecol. 84, 165–175. doi:10.1111/1574-6941.12046
Morawe, M., Hoeke, H., Wissenbach, D. K., Lentendu, G., Wubet, T., Kröber, E., et al. (2017). Acidotolerant Bacteria and Fungi as a Sink of Methanol-Derived Carbon in a Deciduous forest Soil. Front. Microbiol. 8, 1–18. doi:10.3389/fmicb.2017.01361
Morin, T. H., Bohrer, G., Naor-Azrieli, L., Mesi, S., Kenny, W. T., Mitsch, W. J., et al. (2014). The Seasonal and Diurnal Dynamics of Methane Flux at a Created Urban Wetland. Ecol. Eng. 72, 74–83. doi:10.1016/j.ecoleng.2014.02.002
Mozaffar, A., Schoon, N., Digrado, A., Bachy, A., Delaplace, P., du Jardin, P., et al. (2017). Methanol Emissions from maize: Ontogenetic Dependence to Varying Light Conditions and Guttation as an Additional Factor Constraining the Flux. Atmos. Environ. 152, 405–417. doi:10.1016/j.atmosenv.2016.12.041
Müller, A., Faubert, P., Hagen, M., zu Castell, W., Polle, A., Schnitzler, J.-P., et al. (2013). Volatile Profiles of Fungi - Chemotyping of Species and Ecological Functions. Fungal Genet. Biol. 54, 25–33. doi:10.1016/j.fgb.2013.02.005
Nicolai, A., Guernion, M., Guillocheau, S., Hoeffner, K., Le Gouar, P., Ménard, N., et al. (2020). Transdisciplinary Bioblitz: Rapid Biotic and Abiotic Inventory Allows Studying Environmental Changes over 60 Years at the Biological Field Station of Paimpont (Brittany, France) and Opens New Interdisciplinary Research Opportunities. Biodivers. Data J. 8, e50451. doi:10.3897/BDJ.8.e50451
Nicolai, A., Norvez, O., and Supper, R. (2019). Occurrence Dataset: Biological Field Station of Paimpont, University Rennes 1. 60 Years - Biodiversity Data. Version 1.10. https//doi.org/10.15468/jgnjsa accessed via GBIF.org 2019-11-01. doi:10.24053/9783739804392
Oksanen, J., Blanchet, F. G., Kindt, R., Legendre, P., Minchin, P. R., O’Hara, R. B., et al. (2015). Vegan: Community Ecology Package. R Package Version 2.3–2. https://CRAN.R-project.org/package=vegan.
Osborn, A. M., Moore, E. R. B., and Timmis, K. N. (2000). An Evaluation of Terminal-Restriction Fragment Length Polymorphism (T-RFLP) Analysis for the Study of Microbial Community Structure and Dynamics. Environ. Microbiol. 2, 39–50. doi:10.1046/j.1462-2920.2000.00081.x
Osburn, E. D., McBride, S. G., Aylward, F. O., Badgley, B. D., Strahm, B. D., Knoepp, J. D., et al. (2019). Soil Bacterial and Fungal Communities Exhibit Distinct Long-Term Responses to Disturbance in Temperate Forests. Front. Microbiol. 10, 2872. doi:10.3389/fmicb.2019.02872
Owen, S. M., Clark, S., Pompe, M., and Semple, K. T. (2007). Biogenic Volatile Organic Compounds as Potential Carbon Sources for Microbial Communities in Soil from the Rhizosphere ofPopulus Tremula. FEMS Microbiol. Lett. 268, 34–39. doi:10.1111/j.1574-6968.2006.00602.x
Pang, X. (2015). Biogenic Volatile Organic Compound Analyses by PTR-TOF-MS: Calibration, Humidity Effect and Reduced Electric Field Dependency. J. Environ. Sci. 32, 196–206. doi:10.1016/j.jes.2015.01.013
Peñuelas, J., Asensio, D., Tholl, D., Wenke, K., Rosenkranz, M., Piechulla, B., et al. (2014). Biogenic Volatile Emissions from the Soil. Plant Cel Environ 37, 1866–1891. doi:10.1111/pce.12340
Petersen, L. W., Moldrup, P., El‐Farhan, Y. H., Jacobsen, O. H., Yamaguchi, T., and Rolston, D. E. (1995). The Effect of Moisture and Soil Texture on the Adsorption of Organic Vapors. J. Environ. Qual. 24, 752–759. doi:10.2134/jeq1995.00472425002400040028x
Pietikäinen, J., Pettersson, M., and Baath, E. (2005). Comparison of Temperature Effects on Soil Respiration and Bacterial and Fungal Growth Rates. FEMS Microbiol. Ecol. 52, 49–58. doi:10.1016/j.femsec.2004.10.002
Pignatello, J. J., and Xing, B. (1996). Mechanisms of Slow Sorption of Organic Chemicals to Natural Particles. Environ. Sci. Technol. 30, 1–11. doi:10.1021/es940683g
Potard, K., Monard, C., Le Garrec, J.-L., Caudal, J.-P., Le Bris, N., and Binet, F. (2017). Organic Amendment Practices as Possible Drivers of Biogenic Volatile Organic Compounds Emitted by Soils in Agrosystems. Agric. Ecosyst. Environ. 250, 25–36. doi:10.1016/j.agee.2017.09.007
Redeker, K. R., Baird, A. J., and Teh, Y. A. (2015). Quantifying Wind and Pressure Effects on Trace Gas Fluxes across the Soil-Atmosphere Interface. Biogeosciences Discuss. 12, 4801–4832. doi:10.5194/bgd-12-4801-2015
Rolston, D. E., and Moldrup, P. (2012). “Gas Transport in Soils,” in Handbook of Soil Sciences, Properties and Process. Editors P. M. Huang, Y. Li, and L. E. Sumner Boca Raton, FL
Rossabi, S., Choudoir, M., Helmig, D., Hueber, J., and Fierer, N. (2018). Volatile Organic Compound Emissions from Soil Following Wetting Events. J. Geophys. Res. Biogeosci. 123, 1988–2001. doi:10.1029/2018JG004514
Sakamoto, Y., Ishiguro, M., and Kitagawa, G. (1986). Akaike Information Criterion Statistics. Netherlands: Springer.
Scanlon, B. R., Nicot, J. P., and Massmann, J. W. (2002). “Soil Gas Movement in Unsaturated Systems,” in Soil Physics Companion. Editor A. W. Warrick Boca Raton, FL.
Schade, G. W., and Custer, T. G. (2004). OVOC Emissions from Agricultural Soil in Northern Germany during the 2003 European Heat Wave. Atmos. Environ. 38, 6105–6114. doi:10.1016/j.atmosenv.2004.08.017
Schade, G. W., Solomon, S. J., Dellwik, E., Pilegaard, K., and Ladstätter-Weissenmayer, A. (2011). Methanol and Other VOC Fluxes from a Danish Beech forest during Late Springtime. Biogeochemistry 106, 337–355. doi:10.1007/s10533-010-9515-5
Schöller, C. E. G., Gürtler, H., Pedersen, R., Molin, S., and Wilkins, K. (2002). Volatile Metabolites from Actinomycetes. J. Agric. Food Chem. 50, 2615–2621. doi:10.1021/jf0116754
Scott, A., Ball, B. C., Crichton, I. J., and Aitken, M. N. (2006). Nitrous Oxide and Carbon Dioxide Emissions from Grassland Amended with Sewage Sludge. Soil Use Manag. 16, 36–41. doi:10.1111/j.1475-2743.2000.tb00170.x
Sharkey, T. D., Wiberley, A. E., and Donohue, A. R. (2008). Isoprene Emission from Plants: Why and How. Ann. Bot. 101, 5–18. doi:10.1093/aob/mcm240
Sharkey, T. D., and Yeh, S. (2001). Isopreneemission Fromplants. Annu. Rev. Plant Physiol. Plant Mol. Biol. 52, 407–436. doi:10.1146/annurev.arplant.52.1.407
Smith, K. A., Ball, T., Conen, F., Dobbie, K. E., Massheder, J., and Rey, A. (2003). Exchange of Greenhouse Gases between Soil and Atmosphere: Interactions of Soil Physical Factors and Biological Processes. Eur. J. Soil Sci. 54, 779–791. doi:10.1046/j.1365-2389.2003.00567.x
Stacheter, A., Noll, M., Lee, C. K., Selzer, M., Glowik, B., Ebertsch, L., et al. (2013). Methanol Oxidation by Temperate Soils and Environmental Determinants of Associated Methylotrophs. ISME J. 7, 1051–1064. doi:10.1038/ismej.2012.167
Staley, C., Ferrieri, A. P., Tfaily, M. M., Cui, Y., Chu, R. K., Wang, P., et al. (2017). Diurnal Cycling of Rhizosphere Bacterial Communities Is Associated with Shifts in Carbon Metabolism. Microbiome 5, 65. doi:10.1186/s40168-017-0287-1
Steinbrecher, R., Smiatek, G., Köble, R., Seufert, G., Theloke, J., Hauff, K., et al. (2009). Intra- and Inter-annual Variability of VOC Emissions from Natural and Semi-natural Vegetation in Europe and Neighbouring Countries. Atmos. Environ. 43, 1380–1391. doi:10.1016/j.atmosenv.2008.09.072
Suzuki, R., and Shimodaira, H. (2006). Pvclust: an R Package for Assessing the Uncertainty in Hierarchical Clustering. Bioinformatics 22, 1540–1542. doi:10.1093/bioinformatics/btl117
Svendsen, S. H., Priemé, A., Voriskova, J., Kramshøj, M., Schostag, M., Jacobsen, C. S., et al. (2018). Emissions of Biogenic Volatile Organic Compounds from Arctic Shrub Litter Are Coupled with Changes in the Bacterial Community Composition. Soil Biol. Biochem. 120, 80–90. doi:10.1016/J.SOILBIO.2018.02.001
Trefz, P., Schubert, J. K., and Miekisch, W. (2018). Effects of Humidity, CO 2 and O 2 on Real-Time Quantitation of Breath Biomarkers by Means of PTR-ToF-MS. J. Breath Res. 12, 026016. doi:10.1088/1752-7163/AA9EEA
Veres, P. R., Behrendt, T., Klapthor, A., Meixner, F. X., and Williams, J. (2014). Volatile Organic Compound Emissions from Soil: Using Proton-Transfer-Reaction Time-Of-Flight Mass Spectrometry (PTR-TOF-MS) for the Real Time Observation of Microbial Processes. Biogeosciences Discuss. 11, 12009–12038. doi:10.5194/bgd-11-12009-2014
Warneke, C., Karl, T., Judmaier, H., Hansel, A., Jordan, A., Lindinger, W., et al. (1999). Acetone, Methanol, and Other Partially Oxidized Volatile Organic Emissions from Dead Plant Matter by Abiological Processes: Significance for Atmospheric HOxchemistry. Glob. Biogeochem. Cycles 13, 9–17. doi:10.1029/98GB02428
Wheatley, R., Hackett, C., Bruce, A., and Kundzewicz, A. (1997). Effect of Substrate Composition on Production of Volatile Organic Compounds from Trichoderma Spp. Inhibitory to wood Decay Fungi. Int. Biodeterioration Biodegradation 39, 199–205. doi:10.1016/S0964-8305(97)00015-2
Keywords: VOC fluxes, bacterial communities, climatic parameters, rainfall, T-RFLP, plant cover
Citation: Monard C, Caudal J-P, Cluzeau D, Le Garrec J-L, Hellequin E, Hoeffner K, Humbert G, Jung V, Le Lann C and Nicolai A (2021) Short-Term Temporal Dynamics of VOC Emissions by Soil Systems in Different Biotopes. Front. Environ. Sci. 9:650701. doi: 10.3389/fenvs.2021.650701
Received: 07 January 2021; Accepted: 23 June 2021;
Published: 13 July 2021.
Edited by:
Lu-Jun Li, Northeast Institute of Geography and Agroecology (CAS), ChinaReviewed by:
Hermanni Aaltonen, Finnish Meteorological Institute, FinlandWei Wei, Beijing University of Technology, China
Copyright © 2021 Monard, Caudal, Cluzeau, Le Garrec, Hellequin, Hoeffner, Humbert, Jung, Le Lann and Nicolai. This is an open-access article distributed under the terms of the Creative Commons Attribution License (CC BY). The use, distribution or reproduction in other forums is permitted, provided the original author(s) and the copyright owner(s) are credited and that the original publication in this journal is cited, in accordance with accepted academic practice. No use, distribution or reproduction is permitted which does not comply with these terms.
*Correspondence: Cécile Monard, Y2VjaWxlLm1vbmFyZEB1bml2LXJlbm5lczEuZnI=
†Present address: Eve Hellequin, University of Sorbonne, CNRS, EPHE, PSL, UMR METIS, Paris, France; Guillaume Humbert, Sorbonne Université, CNRS, INRAE, IRD, UPD, UPEC, Institute of Ecology and Environmental Sciences – Paris, iEES, Paris, France; Kevin Hoeffner, UMR SAS, INRAE, Agrocampus Ouest, Rennes, France