 Daiqiang Liao
 Qiang Zhang2*
 Ying Wang
- 1Chongqing Climate Center, Chongqing, China
- 2National Climate Center, Beijing, China
Based on minute-by-minute precipitation data from 1961 to 2016 obtained from the National Basic Weather Station of Shapingba, Chongqing, China, the Chicago rainstorm method, the Pilgrim & Cordery (P&C) method, the Common-frequency method and the natural rainstorm moving regularity (NRMR) method were used to design short-duration (1–3 h) and long-duration (24 h) rainstorm hyetographs. Then, a standardization method for test samples was designed to ensure that each test sample was standardized and underwent an actual precipitation process. The designed rainstorm hyetographs and test samples were compared and analyzed, and the results show that the hyetographs for the 1, 3, and 24-h durations obtained with the NRMR method best represented the actual corresponding precipitation processes. The hyetograph for the 2-h duration obtained with the Chicago rainstorm method was best for the actual 2-h precipitation process. The design results of the Common-frequency method were generally good, but not outstanding. Finally, the P&C method showed a relatively poor performance for each duration.
Introduction
Chongqing, an important city in central China, is an economic center in the upper reaches of the Yangtze River, an important junction between “the Belt and Road” and an inland opening highland. In particular, since the area came under the jurisdiction of the People’s Government in 1997 and due to its continuous urbanization, the impervious surface area in Chongqing has increased significantly. This increase has led to waterlogging disasters (especially on July 17, 2007 and July 16 and 17, 2020), which have caused considerable loss of life for urban residents and negative socioeconomic impacts. At present, the low design standard for urban underground water distribution networks in China is one of the important causes of urban flood and waterlogging disasters. Rainstorm hyetograph design is an important factor for drainage design standards and is the basis for scientifically and reasonably planning and designing urban drainage systems (Pochwat et al., 2017). Therefore, a reasonably designed rainstorm hyetograph is particularly important.
The intensity-duration-frequency (IDF) relationship of rainfall extremes is usually summarized in the evaluation process and widely used as a convenient tool for understanding the characteristics of extreme rainfall events at given locations (Ben-Zvi, 2009). Wang presented an effective approach for assessing the impacts of climate change on both the intensity and frequency of extreme rainfall events by integrating regional climate modeling and IDF curves into a general framework (Wang et al., 2014). The classic methods that are currently used are described as follows: Keifer and Chu (1957) proposed a method that is based on an intensity-duration-frequency (IDF) curve and a rainstorm intensity formula. This method is known as the Chicago rainstorm method. Pilgrim and Cordery (1975) developed an order-average hyetograph based on the principle of statistics (referred to as the P&C method). Yen and Chow (1980) proposed a triangular-shaped hyetograph. In addition to the abovementioned classic methods, other methods for deriving hyetographs have been developed more recently; please refer to Lin and Wu (2007), Lee and Ho (2008), Powell et al. (2008), Yin et al. (2014), Kottegoda et al. (2014), NRMR (Liao et al., 2019b) for detailed descriptions (Wang et al., 2018). Furthermore, there are advantages and disadvantages among the different rainstorm hyetograph design methods. Cen (1993), Cen et al. (1998), Cen (1999) compared four methods for designing rainstorm hyetographs, including the methods of Keifer and Chu (1957), Huff (1967), Pilgrim and Cordery (1975), Yen and Chow (1980), and the results showed that the flood peak discharges obtained by the different rainstorm hyetograph design methods were significantly different, and the sensitivities of the different methods to the duration of precipitation events and to precipitation data varied.
The purpose of designing a rainstorm hyetograph is to allow the designed results to represent the natural precipitation process in an actual local rainstorm. However, scholars in China and abroad have rarely conducted comparative studies to determine if rainstorm hyetograph designs represent local conditions. To address this situation, minute-by-minute precipitation data from 1961 to 2016 were obtained from the National Basic Weather Station of Shapingba, Chongqing, China, and the Chicago rainstorm method, the P&C method, the Common-frequency method and the natural rainstorm moving regularity (NRMR) method were used to design short-duration (1–3 h) and long-duration (24 h) rainstorm hyetographs. Then, the rainstorm hyetograph designs were compared with samples from actual precipitation processes that led to waterlogging from 1961 to 2016 (these samples were not used for the rainstorm hyetograph designs). These methods were compared to determine the method that had the optimal design results.
Data and Sampling Methods
The data used in this study are minute-by-minute precipitation data from 1961 to 2016 from the National Basic Weather Station of Shapingba in Chongqing, China, and these data were provided by the Chongqing Municipal Center of Weather Information and Technology Support. The precipitation data from 1961 to 2008 are the self-recording minute-by-minute paper records, and the data from 2009 to 2016 are the observation data of automatic stations. Using the color scanning digitizing processing system of the precipitation autographic record paper (Wang et al., 2004) provided by the China Meteorological Administration (CMA), the precipitation autographic record papers were subjected to scanning, inspection, and extraction of minute-by-minute precipitation data. However, the 6-year (1968, 1971, 1975, 2000, 2001, 2005) record papers cannot be digitized since they are not well preserved; thus, these data were excluded. The remaining 50 years of data were used. The sampling method used in this paper was the natural rainfall moving sampling method for heavy precipitation (Liao et al., 2019a). The two largest samples of each year were selected, in which the largest sample was used for the rainstorm hyetograph design, and the second largest sample was used as the test sample (a total of 47 samples were used in this paper). When the samples were selected by the natural rainfall moving sampling method for heavy precipitation, the 3-year (2008, 1980, 1987) samples with less than 50 mm of rainfall were excluded).
Results of Different Rainstorm Hyetograph Design Methods
Four methods commonly used in China were used for the rainstorm hyetograph design, including the Chicago rainstorm method, P&C method, Common-frequency method and NRMR method.
Chicago Rainstorm Method
The Chicago rainstorm method is based on the storm intensity formula, and the rainstorm peak position is determined by rainstorm statistics (Dai et al., 2017). By introducing the position coefficient r of the rainstorm peak to describe the time when the rainstorm peak occurs, the time series of rainfall duration is divided into two parts of prepeak and postpeak.
The duration of a rainstorm process is t0, the instantaneous rainfall intensity before the peak is Ia, the corresponding duration is ta, the cumulative rainfall is Ha, the instantaneous rainfall intensity after the peak is Ib, the corresponding duration is tb, the cumulative rainfall is Hb and the total rainfall is HT = Ha + Hb. Let t0 = 1 and the intensity peak position r be between 0 and 1, then
When 0 ≤ t ≤ ta,
When 0 ≤ t ≤ tb,
Therefore, the instantaneous rainfall intensity before and after the peak (Ia and Ib) is obtained as follows:
When 0 ≤ t ≤ ta,
When 0 ≤ t ≤ tb,
Based on the two equations above, the cumulative rainfall hyetograph is calculated as follows:
When 0 ≤ t ≤ rT,
When rT ≤ t ≤ T,
Figure 1 shows the short-duration design rainstorm hyetographs according to the above steps. Since the maximum sampling time of this method is only 180 min, it was not used for the design rainstorm hyetograph for the 24-h duration.
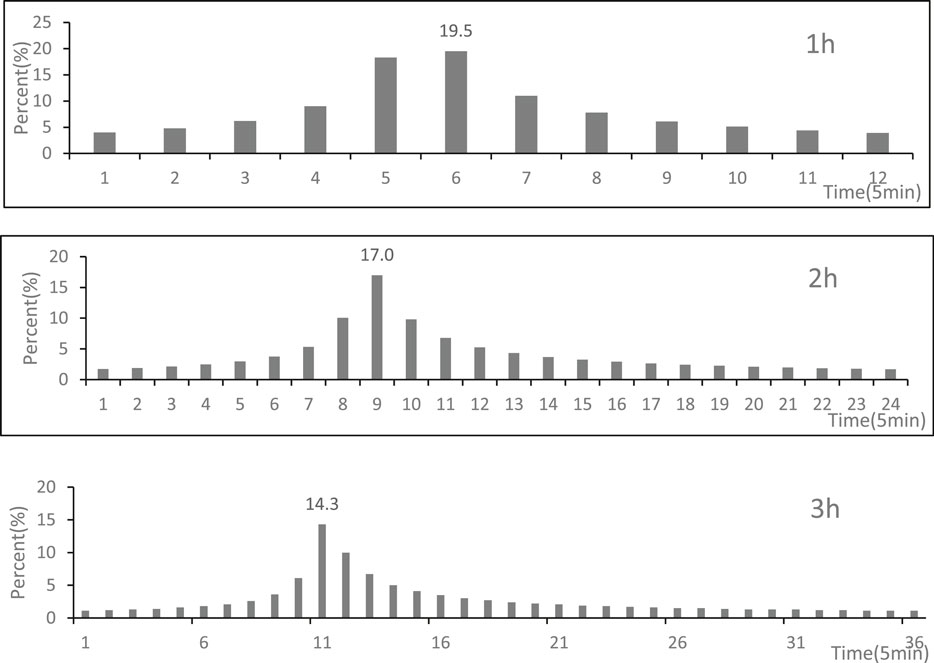
FIGURE 1. The designed rainstorm hyetographs for 1, 2, and 3-h durations obtained with the Chicago rainstorm method.
P&C Method
The P&C method places the rainstorm peak period at the position with the highest possibility of occurrence, the percentage of precipitation in the peak period in each rainstorm is taken to calculate the average percentage of precipitation and the positions and percentages of other periods are calculated in the same way (Jiang, 2015). The specific steps are described as follows:
(1) The rainstorm samples with a certain duration are selected. Multiple rainfall events with the largest amounts of precipitation are selected, and the more rainfall events there are, the greater the statistical significance.
(2) The duration is divided into several periods. The length of the period is determined by the desired time unit for the time distribution, and generally, the smaller this value is, the better. For example, if a 5-min unit is used for a 180-min rainstorm hyetograph design, the 180-min duration selected in step 1 is divided into 36 periods.
(3) For every rainfall event selected, according to the rainfall of each period, the time series number of each period is determined from largest to smallest, and the period with large rainfall corresponds to the small time series number. The time series number of each corresponding period is averaged, and the average time series number from smallest to largest corresponds to rainfall intensities from largest to smallest.
(4) The percentage of rainfall in each period compared with the total rainfall is calculated, and the average percentage of each period is taken.
(5) A rainfall hyetograph is formed by arranging periods according to the time series with the maximum possibility determined in step 3 and the distribution percentage determined in step 4.
Figure 2 shows the designed rainstorm hyetographs of all durations according to the above steps.
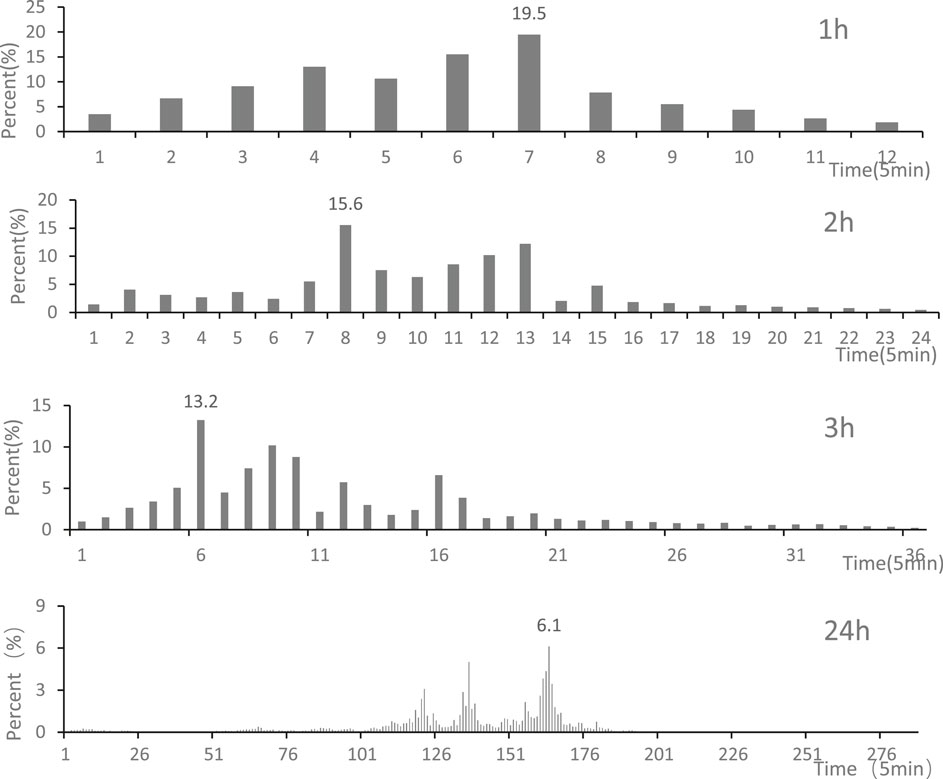
FIGURE 2. The rainstorm hyetograph design of four durations obtained with the P&C method.
Common-Frequency Method
The Common-frequency method, also known as the “long-duration including short-duration,” provides a long-duration hyetograph that includes a short-duration hyetograph. This method determines the time series using the situation with the most occurrences (namely, the mode value) and uses the average situation (namely, the mean value) to define the rainfall in each period (Li et al., 2018). The 1,440-min rainstorm hyetograph design with a 5-min unit is used as an example. The specific steps are described as follows:
(1) Based on the rainfall standard, multiple rainstorms with a duration of 1,440 min are selected, the starting position of H720, which is the maximum rainfall in a 720-min window in each rainstorm, is determined by using time-based sliding windows, and the starting time of H720 in the rainstorm hyetograph design is determined by the position of the mode value.
(2) The main peaks of the selected typical rainstorm samples with a duration of 1,440 min are superimposed, and the percentage of precipitation in each period (H720–H1440) compared with the total rainfall in each rainstorm sample is calculated. Then, the average precipitation percentage of each period (H720–H1440) in multiple rainstorm samples is calculated, i.e., the precipitation distribution percentage of each period (H720–H1440).
(3) In the same way, according to steps (1) and (2), multiple rainstorms with a duration of 720 min are selected based on the rainfall standard. Using the method in step 1 for H720, the starting position of H360, which is the maximum rainfall in a 360-min window in each rainstorm, is determined using time-based sliding windows, and the starting time of H360 in the rainstorm hyetograph design is determined by the position of the mode value. The main peaks are aligned and superimposed to calculate the percentage of precipitation in each period (H360–H720) compared with the total rainfall in each rainstorm sample, and the average precipitation percentage of each period (H360–H720) in multiple rainstorm samples is calculated, i.e., the precipitation distribution percentage of each period (H360–H720).
(4) The precipitation distribution percentages of H240–H360, H180–H240, H150–H180, H120–H150, H90–H120, H60–H90, H45–H60, H30–H45, H15–H30, and H5–H15 corresponding to 360, 240, 180, 150, 120, 90, 60, 45, 30, and 15 min, respectively, are calculated. Finally, the percentage of the maximum 5-min precipitation is 100%.
(5) In summary, the distribution results of the rainstorm hyetograph design with a duration of 1,440 min and a 5-min unit are obtained.
In this paper, according to the idea of the Common-frequency method, the peak position is determined using the average position, the peak intensity is the average maximum 5-min intensity, and the distribution percentages of remaining periods are determined based on the averages. Figure 3 shows the designed rainstorm hyetographs of all durations according to the above steps.
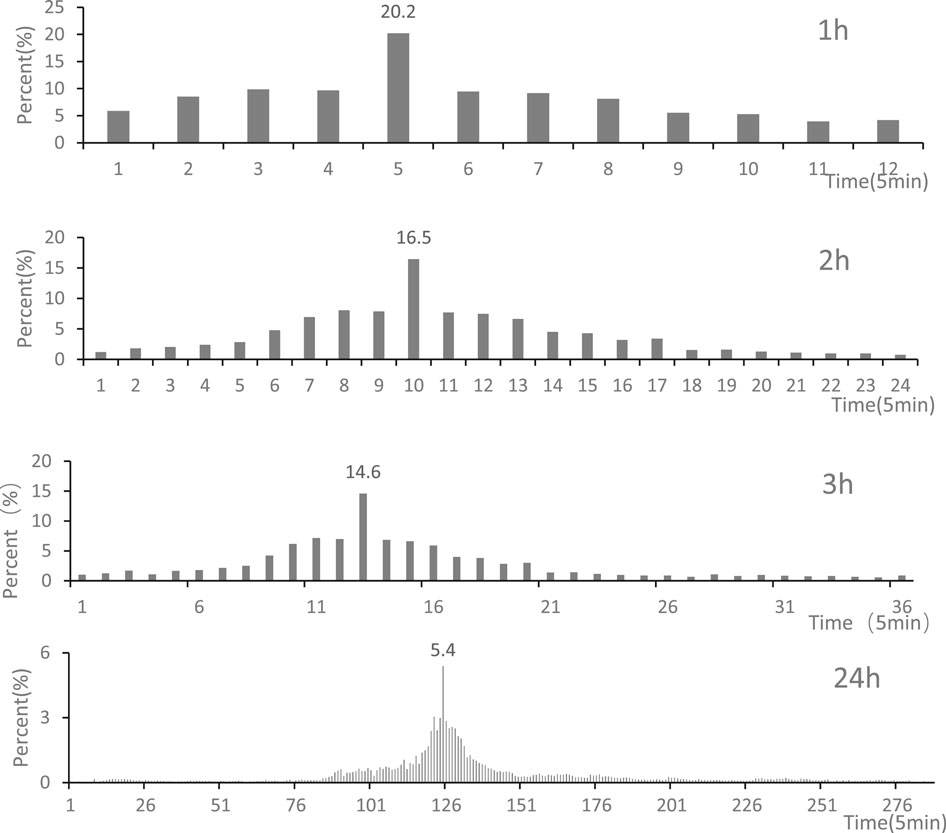
FIGURE 3. The rainstorm hyetograph designs for four durations obtained with the Common-frequency method.
NRMR Method
After sampling with the natural rainfall moving sampling method for heavy precipitation, the rain hyetograph is calculated using Eq. 1, which is the NRMR method (Liao et al., 2019a).
X represents a minute-based precipitation series for a given duration (there are multiple durations), n is the total number of minutes for a given duration, k represents the index of a 5-min period in the series, P represents the percentage of the precipitation during a 5-min period and Pk is the percentage of the precipitation during the kth 5-min period in the current precipitation series.
Figure 4 shows the rainstorm hyetograph designs with different durations according to the above steps.
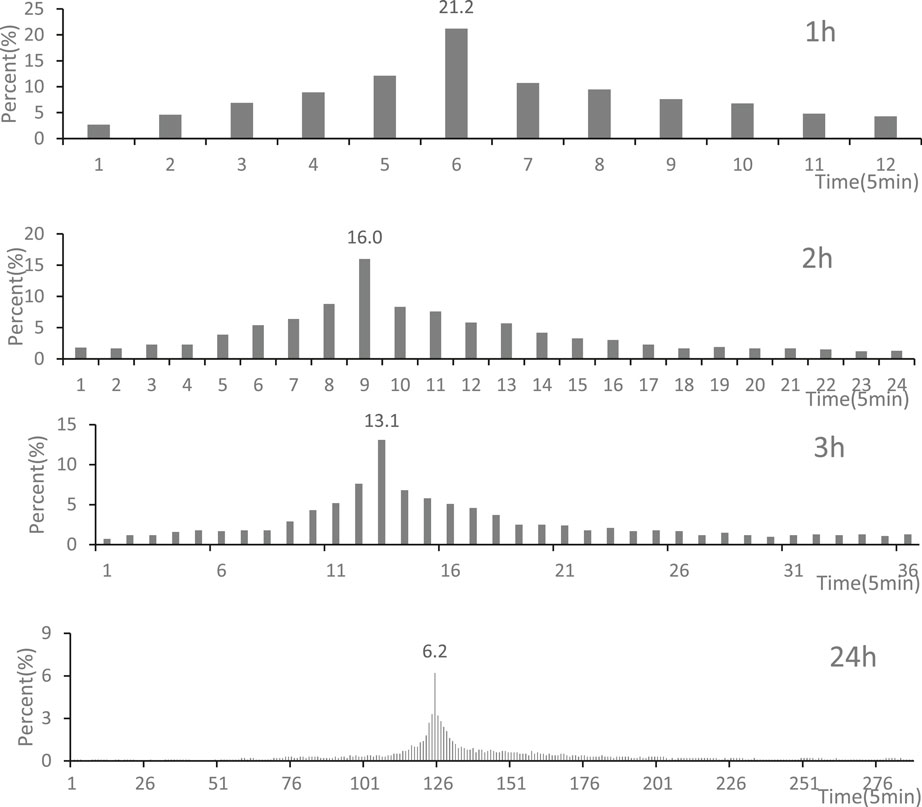
FIGURE 4. Four durations of rainstorm hyetograph designs obtained with the NRMR method.
Determination of Test Samples
Standardization of Test Samples
The second largest sample of each year from 1961 to 2016 selected by the natural rainfall moving sampling method for heavy precipitation was taken, and all of them were used as the test samples. Because the peak positions of selected test samples were different, it was difficult to use them for verification. To this end, standardization was conducted for the selected test samples. First, the peak position of each sample was determined. This position was determined using the designed rainstorm hyetograph method, and different methods provided different peak positions. The purpose of moving the peak position in the second time is for the convenience of inspection. Then, the peak position of each sample was moved to the determined peak position. To ensure that the test sample was still a true natural precipitation process, the vacant precipitations caused by the left-right movement in the test sample were supplemented with the original precipitations. The specific process is shown in Figure 5. Figure 5A shows the standardization process of a 3 h-duration test sample from 2003 by the NRMR method, in which the gray parts are the sample time intervals before moving, and the oblique line marks the peak position of the sample the moving, i.e., the 28th 5-min interval of the sample. The gray parts in Figure 5B are the sample time intervals after moving, i.e., the 28th 5-min interval is moved forward by 15 intervals and aligned with the 13th interval (the determined peak position of the test sample). The front 15 intervals are removed due to moving, therefore, 15 intervals from the original sample are used, which ensures that the sample is still a natural precipitation process. The test samples of the other durations and other rainstorm hyetograph design methods were standardized in the same way.

FIGURE 5. The gray parts in (A) are the samples selected before moving, and the gray parts in (B) are the selected samples after moving. Abscissa: time (5 min), ordinate: precipitation (mm).
Determination of Peak Positions in Test Samples
The peak positions of the test samples were determined based on the results of the designed rainstorm hyetographs. The peak positions of the test samples varied with different methods. Table 1 shows the peak positions for different durations by the four methods.
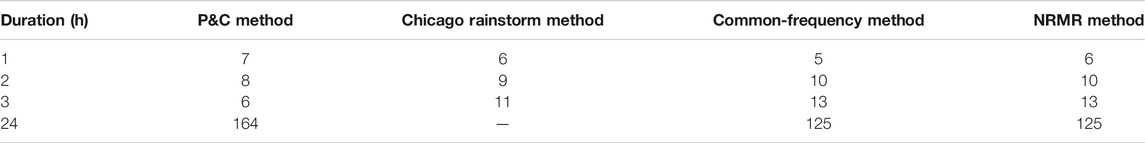
TABLE 1. Peak positions for different durations determined by the four rainstorm hyetograph design methods.
Table 1 shows that for the 1 and 2-h durations, the differences in the peak positions obtained by the different rainstorm hyetograph design methods are relatively small; however, the differences between the peak positions at the 3 and 24-h durations are considerable. Especially for the 3-h duration, the peak position by the P&C method was five to seven units (intervals) away from the results of other methods. For the peak position of 3-h duration, the P&C method moved the peak position in all test samples to the sixth interval, the Chicago rainstorm method moved it to the 11th interval, and the Common-frequency method and the NRMR method moved it to the 13th interval, as did the other durations.
Representativeness of Standardized Samples
The standardization of the test samples may result in changes in the precipitation of the test samples. Therefore, it is necessary to test and analyze the standardized test samples. Table 2 shows the variations in precipitation in each test sample before and after standardization (the 1,579.6 mm in the table is the sum of the 47 1 h precipitation samples before standardization, which is the same for other methods). Table 2 shows that the difference in the total rainfall between the periods before and after standardization is not large, and the variation is basically within 9% (only the variation in the total rainfall for the 3-h duration by the P&C method is 12.7%). Therefore, the standardized test samples can basically represent the original samples. Meanwhile, this finding indicates that the standardization is reasonable.
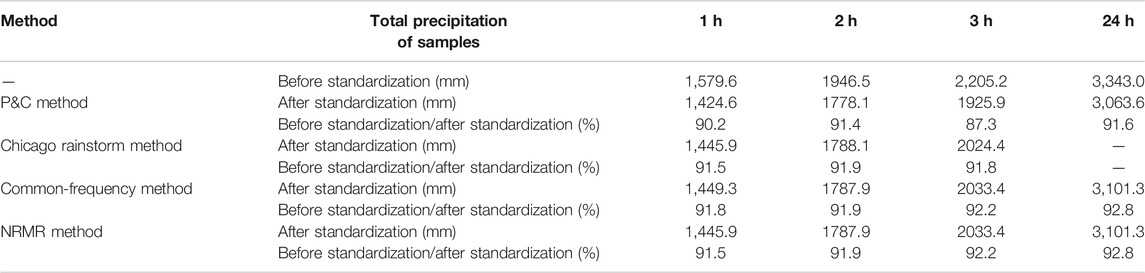
TABLE 2. Comparison of total rainfall in test samples with different durations before and after the natural moving process.
Validation and Analysis of the Results of the Rainstorm Hyetograph Designs
The results of the rainstorm hyetograph designs are represented by the distribution diagram of rainfall with time. The continuous percentage data can be obtained by dividing the precipitation of each period by the total precipitation (hereinafter referred to as fixed samples). The standardized test samples can be transformed into continuous multiple percentage data so that all test samples can be used for correlation analysis with fixed samples. The greater the correlation coefficient between the fixed samples (the rainstorm hyetographs designed by the different design methods) and the test samples (the second heaviest rainstorm of every year) is, the closer the fixed samples are to the real precipitation process, and vice versa. A correlation analysis (Spearman’s Rank correlation, 5% significance level) was performed on the test samples for the different methods with different durations and the corresponding fixed samples, and a significance test was also conducted on the correlations. Table 3 lists the detailed results.
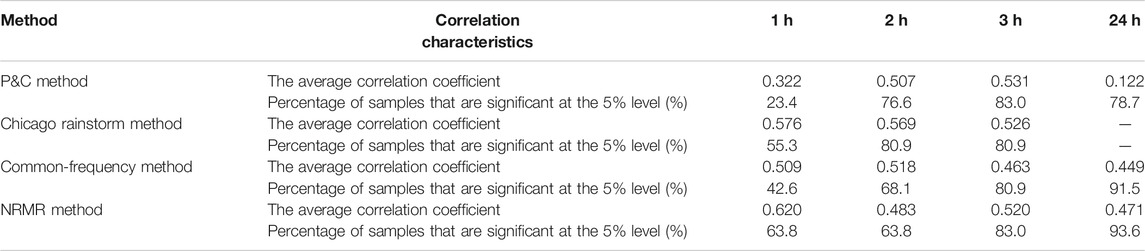
TABLE 3. Correlations between the results of the different rainstorm hyetograph designs and the test samples.
Table 3 shows that the P&C method had the smallest average correlation coefficient for each duration, indicating that the rainstorm hyetograph designs obtained with the P&C method were the least representative of the actual precipitation processes. For the P&C method, the percentages of samples that were significant at the 1 and 3-h durations were the smallest. For the P&C method, although the correlation coefficient between the designed rainstorm hyetograph and the test sample for the 24-h duration was significant, the average correlation coefficient was significantly lower than that of both the Common-frequency method and the NRMR method. Therefore, using the P&C method to design rainstorm hyetographs in Chongqing was the least effective. For the rainstorm hyetograph design obtained with the Chicago rainstorm method, both the average correlation coefficient and the percentage of samples that were significant were the highest among all the methods for the 2-h duration, indicating that the rainstorm hyetograph design for the 2-h duration obtained with the Chicago rainstorm method can best represent the actual 2 h precipitation process, but for other durations, the performance of the Chicago rainstorm method was relatively poor. The performance of the design rainstorm hyetographs for the four durations obtained with the Common-frequency method was moderate and stable but not outstanding. For the rainstorm hyetograph designs obtained with the NRMR method, in addition to the one for the 2-h duration, the average correlation coefficient and the percentage of samples that were significant for the other durations were the highest among all the methods, indicating that the rainstorm hyetograph designs obtained with the NRMR method for these three durations can best represent the actual precipitation processes in Chongqing.
Summary and Discussion
Based on minute-by-minute precipitation data from 1961 to 2016 obtained from the National Basic Weather Station of Shapingba, Chongqing, China, the Chicago rainstorm method, the P&C method, the Common-frequency method and the NRMR method were used to design short-duration (1–3 h) and long-duration (24 h) rainstorm hyetographs. The second largest sample in each year during 1961–2016 was taken as a test sample, and all them were used to verify the design results of different methods. The following conclusions were obtained:
(1) The results of the rainstorm hyetograph designs obtained with the Chicago rainstorm method, the P&C method, the Common-frequency method and the NRMR method show that the differences in the peak intensity (the percentage of the maximum 5 min precipitation compared with the total precipitation) were small, the differences between the peak positions at the 1 and 2-h durations were not large, and the peak positions at the 3 and 24-h durations were far apart.
(2) The test sample standardization method designed in this study can make the peak position of the test sample the same as the peak position determined by the rainstorm hyetograph design method; in addition, there were no significant changes in the precipitation before and after standardization for all the test samples, and the variations were all within 9%. This finding indicates that the standardization was reasonable, and it ensured that the test sample was still a true natural precipitation process.
(3) The analysis and verification of the results of the four methods showed that the designed rainstorm hyetographs for the 1, 3, and 24-h durations obtained with the NRMR method were the most representative of the actual precipitation processes; the rainstorm hyetograph for the 2-h duration obtained with the Chicago rainstorm method was the most prominent; and the results of the Common-frequency method were generally good but not outstanding; additionally, the performance of the P&C method was relatively poor. Therefore, this paper recommends the NRMR method for rainstorm hyetographs with durations of 1, 3, and 24 h and the Chicago rainstorm method for rainstorm hyetographs with a duration of 2 h. The test method for rainstorm hyetograph design and the recommendations proposed in this paper need to be verified in more areas. We hope that this test method can be used to provide a better basis for urban drainage network design and to achieve the goal of reducing urban waterlogging disasters and flood disasters.
Data Availability Statement
The original contributions presented in the study are included in the article/Supplementary Material, further inquiries can be directed to the corresponding author.
Author Contributions
DL put forward the idea. QZ is the instructor of the manuscript. YW, HZ, and JS analyzed the data. All authors revised the manuscript.
Funding
Financial support for this research was provided by the National Key Research and Development Plan of China (No. 2017YFC1502701).
Conflict of Interest
The authors declare that the research was conducted in the absence of any commercial or financial relationships that could be construed as a potential conflict of interest.
Acknowledgments
We thank Xiaochun Liu for translating some of the documents. We are particularly grateful to the Chongqing Meteorological Information and Technology Support Center for providing the minute-by-minute precipitation data from the National Basic Weather Station of Shapingba from 1961 to 2016.
References
Ben-Zvi, A. (2009). Rainfall intensity-duration-frequency relationships derived from large partial duration series. J. Hydrol. 367, 104–114. doi:10.1016/j.jhydrol.2009.01.007
Cen, G. P. (1993). A comparison of design storm patterns for calculating the volume of detention ponding. Water Res. Water Eng. 4 (2), 30–35.
Cen, G. P. (1999). Sample selection and statistical method of rainstorm data. Water Wastewater Eng. 25 (4), 1–4.
Cen, G. P., Jin, S., and Fan, R. S. (1998). Research on rainfall pattern of urban design storm. Adv. Water Sci. 9 (1), 42–46.
Huff, F. A. (1967). Time distribution of rainfall in heavy storms. Water Resour. Res. 3 (4), 1007–1019. doi:10.1029/wr003i004p01007
Dai, Y. X., Wang, Z. H., Dai, L. D., Wang, Q. L., and Cao, T. (2017). Application of Chicago hyetograph method in design duration rainstorm pattern. J. Arid Meteorl. 35 (6), 1061–1069. doi:10.11755/j.issn.1006-7639(2017)-06-1061
Jiang, M. (2015). Study of Shanghai design rainstorm profile under the new rainstorm situation. J. Hunan Inst. Sci. Technol. Nat. Sci. 28 (2), 69–80. doi:10.3969/j.issn.1672-5298.2015.02.015
Kottegoda, N. T., Natale, L., and Raiteri, E. (2014). Monte Carlo simulation of rainfall hyetographs for analysis and design. J. Hydrol. 519, 1–11. doi:10.1016/j.jhydrol.2014.06.041
Keifer, C. J., and Chu, H. H. (1957). Synthetic storm pattern for drainage design. J. Hydraul. Div. 83 (4), 1–25. doi:10.1061/jyceaj.0000104
Lee, K. T., and Ho, J.-Y. (2008). Design hyetograph for typhoon rainstorms in Taiwan. J. Hydrol. Eng. 13, 647–651. doi:10.1061/(asce)1084-0699(2008)13:7(647)
Liao, D. Q., Zhu, H. N., Zhou, J., Sun, J., and Wang, Y. (2019a). Research on storm intensity formula and design rain pattern sampling method. Meteor. Mon. 45 (10), 1375–1181.
Liao, D. Q., Zhu, H. N., Zhou, J., Wang, Y., and Sun, J. (2019b). Study of the natural rainstorm moving regularity method for hyetograph design. Theor. Appl. Climatol. 138 (4), 1311–1321. doi:10.1007/s00704-019-02890-0
Li, Z. Y., Huang, X. J., and He, Y. Y. (2018). Research on derivation method of design rainstorm pattern. Water Supply Drain. Eng. 36 (1), 141–144.
Lin, G.-F., and Wu, M.-C. (2007). A SOM-based approach to estimating design hyetographs of ungauged sites. Journal of Hydrology 339, 216–226. doi:10.1016/j.jhydrol.2007.03.016
Pilgrim, D. H., and Cordery, I. (1975). Rainfall temporal patterns for design floods. J. Hydr. Div. 101 (1), 81–95. doi:10.1061/jyceaj.0004197
Powell, D. N., Khan, A. A., and Aziz, N. M. (2008). Impact of new rainfall patterns on detention pond design. J. Irrig. Drain Eng. 134, 197–201. doi:10.1061/(asce)0733-9437(2008)134:2(197)
Pochwat, K., Słyś, D., and Kordana, S. (2017). The temporal variability of a rainfall synthetic hyetograph for the dimensioning of stormwater retention tanks in small urban catchments. J. Hydrol. 549, 501–511. doi:10.1016/j.jhydrol.2017.04.026
Wang, A., Qu, N., Chen, Y., Li, Q., and Gu, S. (2018). A 60-minute design rainstorm for the urban area of Yangpu district, Shanghai, China. Water 10, 312. doi:10.3390/w10030312
Wang, S.-s., Liu, D.-y., and Zhang, Q. (2004). Spatial query preprocessing in distributed GIS. J. Appl. Meteorol. Sci. 15 (6), 737–744. doi:10.1007/978-3-540-30208-7_98
Wang, X. Q., Huang, G. H., and Liu, J. L. (2014). Projected increases in intensity and frequency of rainfall extremes through a regional climate modeling approach. J. Geophys. Res.: Atmos. 119 (23), 13–271. doi:10.1002/2014jd022564
Yen, B. C., and Chow, V. T. (1980). Design hyetographs for small drainage structures. J. Hydr. Div. 106 (6), 1055–1076. doi:10.1061/jyceaj.0005442
Keywords: standardization of test samples, Pilgrim & Cordery method, Chicago rainstorm method, common-frequency method, NRMR method
Citation: Liao D, Zhang Q, Wang Y, Zhu H and Sun J (2021) Study of Four Rainstorm Design Methods in Chongqing. Front. Environ. Sci. 9:639931. doi: 10.3389/fenvs.2021.639931
Received: 10 December 2020; Accepted: 08 February 2021;
Published: 22 March 2021.
Edited by:
Qingxiang Li, Sun Yat-Sen University, ChinaReviewed by:
Xander Wang, University of Prince Edward Island, CanadaZhihong Jiang, Nanjing University of Information Science and Technology, Nanjing, China
Copyright © 2021 Liao, Zhang, Wang, Zhu and Sun. This is an open-access article distributed under the terms of the Creative Commons Attribution License (CC BY). The use, distribution or reproduction in other forums is permitted, provided the original author(s) and the copyright owner(s) are credited and that the original publication in this journal is cited, in accordance with accepted academic practice. No use, distribution or reproduction is permitted which does not comply with these terms.
*Correspondence: Qiang Zhang, emhxNjJAY21hLmdvdi5jbg==