 Panning Liang
 Mingyang Yu1
95% of researchers rate our articles as excellent or good
Learn more about the work of our research integrity team to safeguard the quality of each article we publish.
Find out more
ORIGINAL RESEARCH article
Front. Environ. Sci. , 25 March 2021
Sec. Environmental Economics and Management
Volume 9 - 2021 | https://doi.org/10.3389/fenvs.2021.627323
This article is part of the Research Topic Engineering Applications of Neurocomputing View all 15 articles
China’s “Belt & Road Initiative” has been proposed for several years, which has stimulated the economic and financial development of the countries alongside the “Belt & Road”. For a world’s leading energy consuming country, China tries to secure the energy supply from the resource-rich countries via oversea energy investment. In this paper, we propose a sequence to sequence (seq2seq) model to evaluate the energy investment risk of 50 countries alongside the “Belt & Road Initiative”. Specifically, we first build an indicator system mainly containing six factors. Then we adopt Bi-long-short term memory (Bi-LSTM) as encoder to process the historical statistics. Afterward, we use self-attention mechanism to assign the weights on the six factors of the indicator system. Finally we use a hierarchical convolution neural network decoder to generate the assessment results. Our findings indicate that resource potential and Chinese factor are the most important indicators. And through our thorough investigation, we find that Russia, Kazakhstan, Pakistan, United Arab Emirates, Saudi Arabia, Malaysia and Indonesia are the most recommended target countries for China’s oversea energy investment.
“Belt & Road initiative” was proposed successfully in 2013 by China, which aims to secure its global economic and energy system. China plans to invest the nations alongside the “Belt & Road”, so as to explore a developmental path of interregional cooperation, so as to boost an open economic system development. Such huge project has attracted at least 65 nations to discuss with China about further investment (Duan et al., 2018; Hafeez et al., 2018; Zhai, 2018; Wu et al., 2020). In this paper, we focus on the energy investment as China has the largest amount of imported energy resources like oil and gas, with the number keeping increasing. Overall, the countries joining “Belt & Road initiative” include 16 countries in the Middle Eastern Europe, 18 countries in West Asia and Northern Africa, 10 countries in the Association of Southeast Asian Nations (ASEAN), 8 countries in South Asia, 5 countries in Central Asia, 7 countries in the Commonwealth of Independent States (CIS), and Mongolia in East Asia. Those countries above contain a large part of the energy resources of the whole world according to the Energy Information Administration (EIA1) statistics, with natural gas, coal and oil making up, 79.9 and 54.0 and 58.8% of the world, respectively.
In order to ensure a stable external energy supply, oversea energy investment is the main way conducted by those countries laking in resources like Japan. According to statistics provided by Information Energy Agency (IEA2), there will be about 23 trillion dollars investments regarding the fossil energy industries including mining, transportation and refinement. Most of those investments focus on the countries alongside the “Belt & Road”, which offers China a good opportunity to expand its own oversea energy investment.
However, oversea energy investments always face high risk due to various factors such as politics, business environment, economic situation. The period of such investment is long and the corresponding investment uncertainty is rather low as well (Zhang et al., 2017, 2018; Wu et al., 2020). For example, Middle East countries have abundant fossil resources, however, their economic structure is singular with unstable politic environment and undeveloped energy industry. Therefore, to conduct the “Belt & Road initiative” smoothly, a thorough and comprehensive assessment of the energy investment is strongly needed. Given the evaluation, we could provide investment strategy recommendations for China policy makers.
There are many existing efforts aiming to handle the investment risk evaluation in many aspects. For example, Dockner et al. (2013) take the risk of energy grids into consideration, evaluating firm risks and firm value. Pringles et al. (2015) evaluate the energy transmission risk through considering substantial uncertainty and irreversibility. Chorn and Shokhor (2006) adopt a real-options based model to evaluate China’s oversea fossil industry investments. However, the previous research mainly focuses on micro-level on energy investment risk evaluation. In our paper, we intend to investigate energy investment risk on both micro-level and macro-level factors.
Existing macro-level risk assessment models always focus on the quantitative analysis, referencing global organizations like Moody’s, Fitch Group and Standard & Poor’s Feder and Uy (1985); Brewer and Rivoli (1990) for rating results. The International Country Risk Guide (ICRG) publishes the national risk ratings monthly from three aspects: political, financial and economic. Some researchers argue that China oversea investments should be mainly concerned with natural resources. For example, Li et al. (2012) evaluate the national risk of crude oil exporting countries using decomposition hybrid approach.
Motivation. China is the world-leading energy-consuming country while the “Belt & Road initiative” brings lots of opportunities for China’s companies’ oversea energy investment. So it is urgent to call for more systematic researches for assessment of China’s oversea energy investment risks under this circumstance. However, the aforementioned literature only investigates the general investment risk, few studies focus on the China oversea energy investment. Therefore, in this work, we aim to fill this gap by building an assessment system for China’s foreign investment alongside the “Belt & Road initiative”. We believe that aside from the above national risks, according to EIA, more energy-related factors should be taken into consideration. Additionally, the bilateral relationship between China and the target country also plays a vital role in assessing the oversea energy investment Duan et al. (2018). So Chinese factor should also be considered. Overall, we put forward an indicator system specially designed for energy investment, which contains six indicators, that is, investment environment, political risk, economic foundation, environment constraint, resource potential and Chinese factor. To evaluate the above risk factors, inspired by the recent advance of deep learning, we propose to use a seq2seq framework to generate the assessment results. To the best of our knowledge, we are the first to apply deep neural networks on risk assessment tasks. Additionally, previous assessment models only take the latest statistics of a nation into consideration, however, our model could make the full use of the history statistics via the Bi-LSTM encoder. Afterward, we adopt the self-attention layer to assign different weights on different impact factors. Finally, we choose CNN as the decoder to generate the final assessment results.
Objective. In this work, we aim to first build an indicator system so that we could conduct a comprehensive analysis on the factors affecting the China’s oversea energy investment. Secondly, we adopt the seq2seq framework to evaluate the historical statistics to generate the assessment results, while previous research always focus on the latest data. Finally, based on the assessment results, we aim to provide policy recommendations to those policy makers of China.
• The contributions could be summarized as three components:
• We first build an indicator system to assess the national energy investment risk along the “Belt & Road initiative”.
• We adopt a seq2seq framework to generate the assessment results, in which Bi-LSTM encoder deals with historical statistics, self-attention mechanism calculates the indicator weights and CNN decoder computes the final assessment scores.
• We evaluate the energy investment risk based on the indicator and framework mentioned above among 50 countries which lie in the “Belt & Road initiative”. Then we provide policy recommendations for overseas energy investment of China.
The rest of paper is organized as follows. We first introduce the related work in “Related Work” section, and then justify the indicator and seq2seq framework in detail in “Proposed Model” section. Then we conduct energy investment evaluation on 50 countries in “Experiments” section. In the end, we present the conclusion of our findings in “Conclusion” section.
Investment risk assessment has drawn lots of research attention, and in this paper, we focus on energy investment so as to evaluate China’s “Belt & Road” initiative on natural resources.
Regarding the energy, some research focuses on grid systems or power plants. Dockner et al. (2013) take the firm value and firm risk into consideration, in which firm risk is determined by short investment option positions and become non-linear with no investment. Pringles et al. (2015) analyze the real investment option of power transmission with uncertainty and irreversibility. Zhang et al. (2016) assess the renewable resource investment via a real options model. Tietjen et al. (2016) compare the renewable and fossil energy in power markets regarding the investment risks, and they find that the energy price is the most important factor for a power plant. Hach and Spinler (2016) consider the capacity payment on investment as a risk factor, focus on how different partials of renewable energy would affect the gas-fired plants. Gal et al. (2017) research on the uncertainty factors of the fossil fuel cost, and how they affect the energy price and capacity investment. Mayer et al. (2017) study on the cost calculation and power generation based on the early-stage uncertainties and risks. Farfan and Breyer (2017) compute the risks of national power system and its investment based on a sustainable indicator.
There are also various works focusing on the fossil energy industry investment. Chorn and Shokhor (2006) use a combination of a real options model with the Bellman equation to evaluate the Central Asia gas energy investment. Fan and Zhu (2010) evaluate the China oversea oil investment based on a real options model, as well. Chen et al. (2016) also adopt the real options model to assess the China’s coal power plants in the aspect of the subsidy uncertainty for investment of CCS retrofitting. There are also multiple efforts dedicating to carbon emission and clean-development mechanism on resource investment (Strand et al., 2014; Hieronymi and Schüller, 2015; Jones, 2015; Mo et al., 2015; Cadarso et al., 2016; Cucchiella et al., 2017; Xu et al., 2017) compare different factors and investment in China using 5-sector panel data, illustrating that the investment is mostly depended on GDP. Azam (2020) empirically examine the impact of energy on economic growth within the production function framework of a panel of 10 developing Asian economies from 1990 Q1 to 2014 Q4.
The aforementioned approaches only consider the micro-level factors, while country-level risks are overlooked. National risk ratings were described via quantitative analysis in debt default in the early stage Feder and Just (1977); Kharas (1984). Then some global organizations occurred like Moody’s, Fitch group and Standard & Poor’s, which published the national ratings for each country (Feder and Uy, 1985; Brewer and Rivoli, 1990). Among these organizations, International Country Risk Guide (ICRG) is oldest one which studies three aspects of a nation, i.e., economic, political and financial. Miller (1992) take the industrial environment, macro-economic environment and micro-economic environment into consideration. Hammer et al. (2006) conduct a survey on 69 nations analyzing three political factors and nine economic factors. Agliardi et al. (2012) evaluate the sovereignty risk of the developing countries via three aspects of indicators, i.e., financial, economic and political. Sanchez and Meltzer (2012) adopt nine economic factors to assess the sovereignty risk of the Europe union countries. Brown et al. (2015) consider four aspects for national evaluations, i.e., political, operational, social and economic. Azam (2016) studies the impact of environmental degradation on the economic growth of 11 Asian countries between 1990 and 2011. Azam et al. (2019) study the impact of several indicators like energy, human capital, environment and economics on China. Azam (2019) also study the impact of the above indicators, but he extends the study on BRICS-4 countries, i.e., Brazil, India, China, and South Africa.
As for the China’s oversea energy investment, many researchers believe that natural resources play a vital role for China’s policy making. Li et al. (2012) evaluate the risk of those oil exporting countries via a decomposition hybrid model. Tan (2013) focuses on the energy realm of China’s oversea investment and offers related recommendations. Sun et al. (2014) conduct a survey on China’s foreign investment situation particularly in natural resource field. Conrad and Kostka (2017) and Liedtke (2017) analyze the European energy sector w.r.t China’s investment trend, discussing the economic and competition risks. Duan et al. (2018) analyze the energy investment of China using a fuzzy integrated model. Wu et al. (2020) use an analytic network process and build an ANP-cloud framework to assess the investment risk but they only focus on renewable energy. Zhang et al. (2017) use a multi-fuzzy comprehensive evaluation model to evaluate the investment risk, but they only study the China-Pakistan economic corridor. Zhang et al. (2018) also study the China-Pakistan economic corridor, using an analytic hierarchy process (AHP) to assess the social impact on investment.]
Seq2seq framework is also known as encoder-decoder architecture, which is originally designed to adopt RNN Sutskever et al. (2014) as encoder and decoder. In specific, given the input sequence
The input of the decoder can be directly applied as the final encoder hidden state zn without considering the attention mechanism, meanwhile setting the conditional input ci to be equal to zn for each iCho et al. (2014). However, many works apply the attention mechanism to further improve the model performance, which computes the ci as the sum of
There are many variants of RNN to be chosen as encoder and decoder such as LSTM Hochreiter and Schmidhuber (1997) and GRU Cho et al. (2014). Both RNN models applies a gating mechanism to facilitate the model to handle the long-term dependencies. In recent, bi-directional models are widely used like Bi-LSTM since they could make the full use of the sequence context Bahdanau et al. (2015). Additionally, there are also many models stacking multiple layers of RNN to boost the performance, where residual connection is needed He et al. (2016). Aside from RNN, CNN is also applied as the encoder or decoder, which could improve the efficiency compared with RNN models Gehring et al. (2017).
In this section, we first present our investment risk assessment model in detail. We first build an indicator system which combines both micro-level and macro-level risk ratings. Then we harness the Bi-LSTM model as the encoder to handle the history statistics based on the above indicator system. Afterward, we use the self-attention layer to assign the weight on different indicators. Finally, we adopt the hierarchical CNN model to generate the results of the investment assessment.
Here we introduce overall six indicators to be considered to evaluate the investment risk, that is, investment environment, political, economic, environment constraint, resource and Chinese factor. [According to International Country Risk Guide (ICRG), it evaluates the national risk via three dimensions, i.e., investment environment, political risk and economic foundation, so we choose them as indicators. Additionally, according to Energy Information Administration (EIA), environment constraint and resource potential are two main indicators reflecting the status of the energy resource of a certain country, so we take them as indicators in our work as well. As illustrated in Wu et al. (2020); Duan et al. (2018); Zhang et al. (2017, 2018), Chinese factor also plays a significant role in evaluating the investment risk, so this work also includes it as indicator.]
As for the investment environment, it is mainly about the operational environment of the companies in a nation. Having a stable investment environment can guarantee the operations of the foreign companies. Here we introduce six indicators regarding investment environment which are obtained from World Bank, as shown in Figure 1.
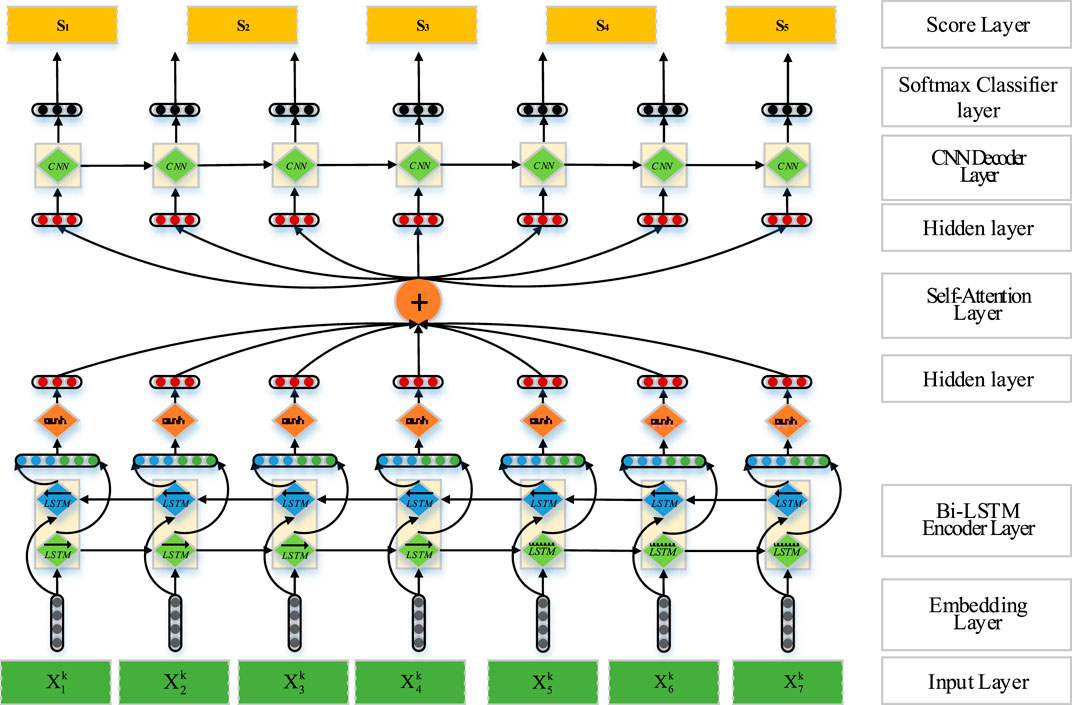
FIGURE 1. Investment risk assessment model framework.
As for the political risk, it reflects the stability of the country’s politics and government environment. Having a political environment being stable can secure the investment and management of the foreign companies, while a poor environment may cause a negative influence on the investment interests of foreign companies. Here we have six factors of the political risk which are obtained from ICRG, as shown in Figure 1.
As for economic foundation, this indicator shows whether the economic system of a country works efficiently. A country with solid economic foundation could provide the fundamental guarantee of a company’s investment profit. We include six factors of the economic foundation of to be considered as illustrated in Figure 1, which are also obtained from ICRG.
As for environment constraint, it is every country’s duty to handle the global warming challenge. To secure the sustainability of the foreign investments, a nation’s environment constraint should also be taken into consideration. Such constraint will influence the macro-level policy of the nation, thereby affecting the operation and management of the foreign countries. Here six factors are included w.r.t this indicator, which are obtained from EIA and World Bank, as presented in Figure 1.
As for resource potential, it is intuitive that for oversea energy investment, the total production or the reserve of the natural resource is an important indicator. A country with abundant supply or production of the fossil resource could easily attract the oversea energy investments. In this paper, we take six factors into consideration as shown in Figure 1, with the statistics fetched from EIA.
As for Chinese factor, the bilateral relation between China and the resource country also plays a vital role for stability and sustainability of the China’s oversea investment. Such relation is concerned with the diplomatic and political friendliness, the stability and the closeness of trade cooperation between China and the countries alongside the “Belt & Road Initiative”. In specific, we include six factors to evaluate this indicator, of which the origins are complex as presented in Figure 1.
In this subsection, we introduce the seq2seq framework in detail, which is composed of several functional layers.
In the bottom of the model, we have the input layer and embedding layer. The input layer is directly obtained from the original statistics of each indicator. We directly represent the input sequence as
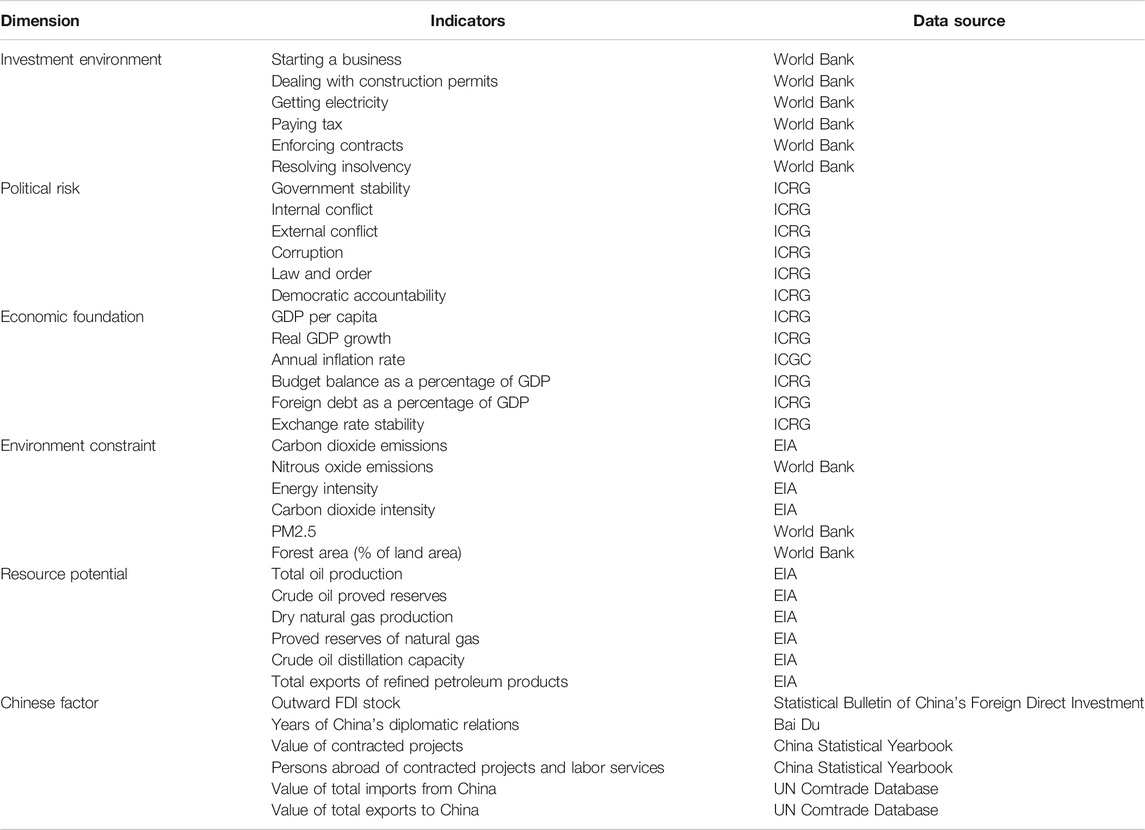
TABLE 1. Investment risk assessment indicators.
Such input sequence cannot be directly applied on encoder layer. Therefore, we add an embedding layer which transfers the input sequence into low-dimensional vectors.
In our model, the encoder is the Bi-LSTM model which processes the input sequence. A Bi-LSTM model can fully mine the history information behind a sequence, and it consists of two parallel LSTM layers, i.e., forward LSTM layer and backward LSTM layer.
LSTM contains input gate, forget gate and output gate to control the information flow. Take the forward LSTM as example, in the t time step, given the input vector
in which
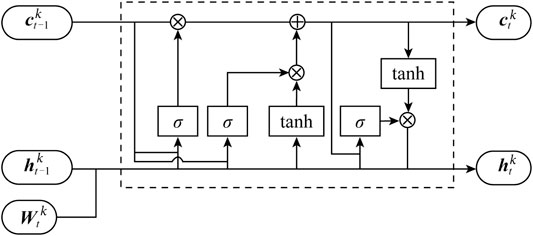
FIGURE 2. Framework of forward LSTM layer.
The input sequence is processed from the element
Then the whole output of the encoder layer could be represented as
Here we introduce the self-attention layer to assign the weights on different indicators. Here we compute the weight of each specific indicator based on the hidden state vector
in which
In this section, we adopt a hierarchical CNN architecture as the decoder layer. Actually, for each layer of the architecture, it is composed of a one-dimensional convolution and a non-linearity. Setting the kernel width of convolutional layer as l, l elements of the input sequence could be covered. To extend the coverage of the sequence, we stack several layers of the convolution on top of each other. For instance, setting
The output of the whole layers with the non-linearity being the gated linear units (GLU) Dauphin et al. (2017) is calculated as
where
To facilitate our model on deep CNN, we use the residual connections He et al. (2016) to connect the input and the output together of each convolution layer. Mathematically, the final output could be represented as follows:
Finally we introduce the classifier layer we adopt in this framework. Here we adopt a softmax classifier which could be represented as
in which θ denotes all the parameters, T represents all the labels.
After all the operations above, the distribution on all T possible results
where
In this section, we first introduce the experiment data statistics and then analyze the national energy investment risk evaluation and provide some investment suggestions for policy makers of China.
We investigate 50 countries alongside the China’s “Belt and Road Initiative” from 2013 to 2019. Here we provide the summary statistics of those nations in 2013 as example, as shown in Table 2.
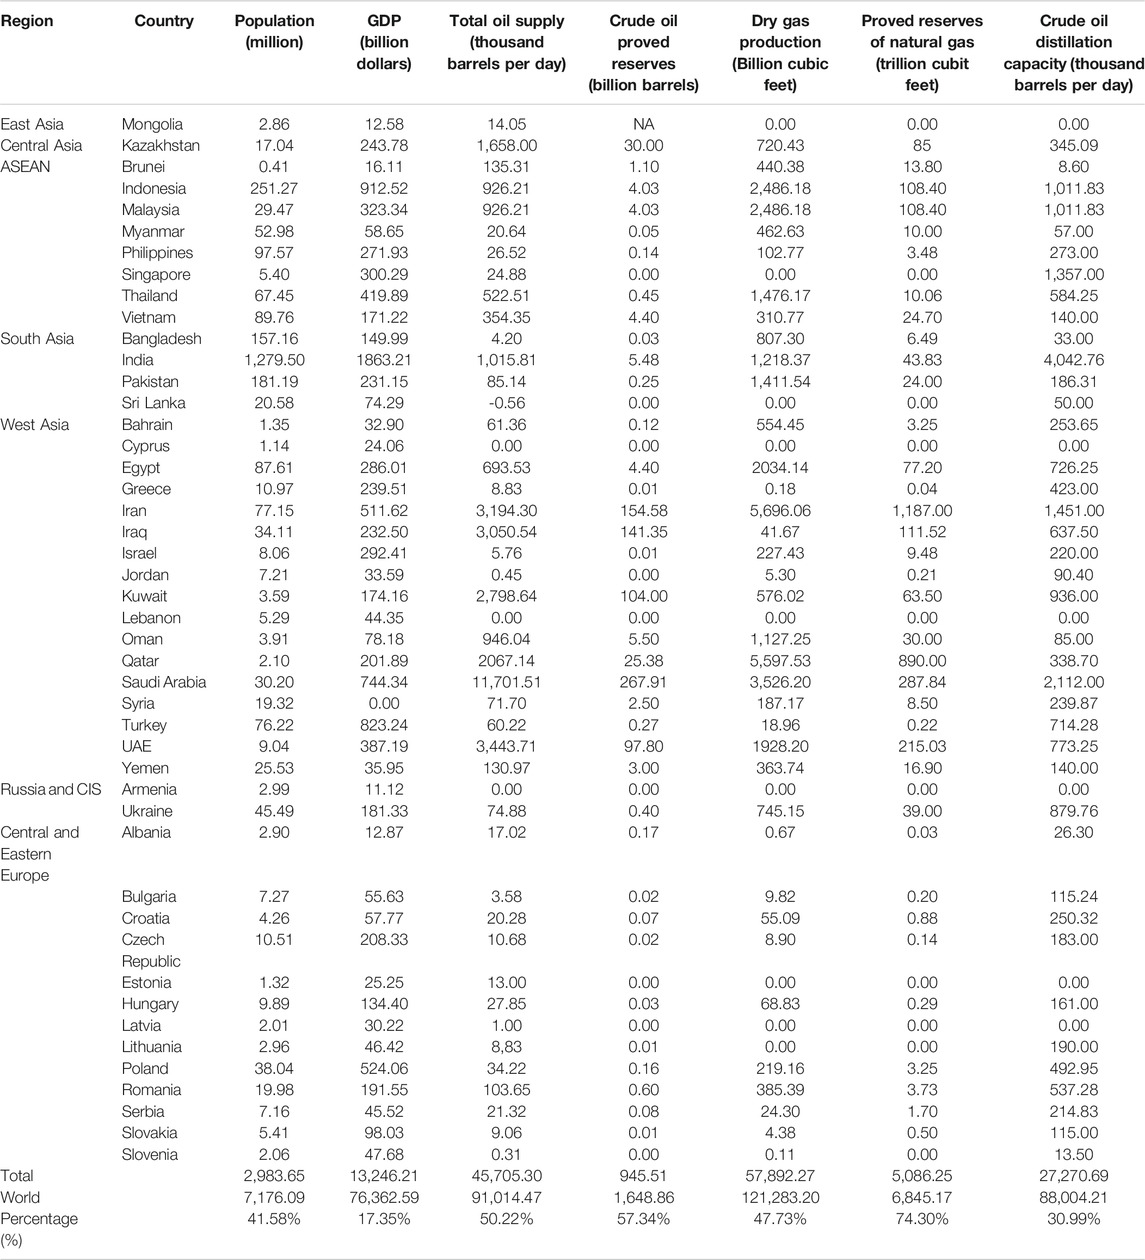
TABLE 2. Main statistics of 50 Nations alongside the China’s “Belt & Road Initiative”.
In Table 2, we include seven main statistics, namely, population, GDP, total oil supply, crude oil proved reserves, dry gas production, proved reserves of natural gas and crude oil distillation capacity. More specifically, those 50 nations alongside the “Belt and Road Initiative” make up about 41.58% population of the whole world, with only 17.15% GDP of the world, which further proves that those nations are developing countries while foreign investments are needed to boost their economy. These countries contain lots of natural resources, with the total oil supply, crude oil proved reserves, dry gas production and proved reserves of the natural gas makes up 50.22, 57.34, 47.73, and 74.30% respectively of the whole world. However, the energy refinement capacity only makes up 30.99% of the world, which means that the potential energy investment in those countries are quite promising.
In this section, we discuss the energy investment evaluation results of our model. First we present the weights of each indicator which is generated by the self-attention layer as illustrated in Table 3. From which we can observe that the weights of indicators Investment environment, political risk, economic foundation, environment constraint, resource potential and Chinese factor are 0.089, 0.159, 0.144, 0,150, 0.259, and 0.199, respectively. The resource potential of a country plays the most important role for energy investment, which is expected and intuitive. Chinese factor is also an important indicator as a stable relationship between China and the country being invested may also provide a friendly investment environment and secure the investments of China’s companies. The third most important risk is the political risk, with the higher risk of a nation’s politics, the higher the Chinese companies will face when choosing the investment target. Notice that the economic foundation and environment constraint almost share the same impact on the investment. It could be attributed to the fact that it becomes a common view that every country should help to deal with the climate changing challenge, so that environment constraint should also be a really important factor to be considered.
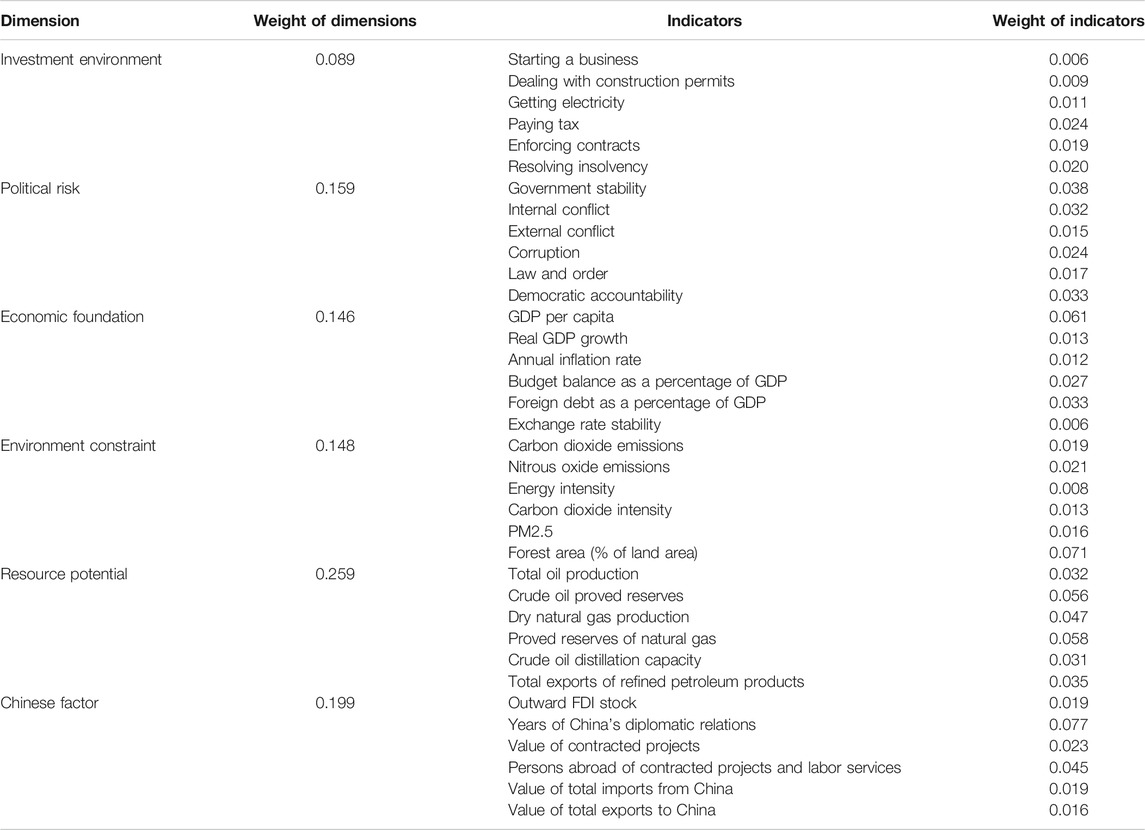
TABLE 3. Estimated weights of risk evaluation indicators for six dimensions.
Aside from the above main six indicators, we also look into the sub-indicators in Table 3. Among all the sub-indicators, we find that the indicator years of China’s diplomatic relations plays the most important role, which illustrates that having a long-term relationship with China could help Chinese companies build a stable and reliable investment relations with the target nations alongside the “Belt & Road Initiative”. The forest area is the second most important indicator which is unexpected, but it further proves that every country pays more attention on protecting their natural environment with the forest having strong ability to adjust the climate changing situation. GDP per capita is also a significant factor since it reflects the foundation of the economy of the target nations to be invested. Notice that the proved reserves of crude oil and natural gas are also really important indicators which reflect the potential investment return for Chinese energy companies. And it may also explain the reason that the Middle East countries attract most of the energy investments from those international companies, regardless of their unstable political environment. Nevertheless, the government stability is still a relatively important factor with the weight being 0.038, so Chinese companies must evaluate the state of the government before investment.
Table 4 presents the evaluation results in detail. From it we could observe that overall we have 10 countries with highest risk, 11 countries with higher risk, 17 countries with medium risk, 10 countries with lower risk and 2 countries with lowest risk. There are 42% of the countries alongside the “Belt & Road Initiative” has the relatively high-risk investment environment, which further reminds China’s companies to pay attention to the risk control on those countries. Notice that those countries with rich natural resource tend to have lower energy investment risks, and this is due to the fact that they have rich gas and oil reserves which can guarantee the potential investment return. Chinese companies do not have to worry about the availability of fossil resources in these countries.
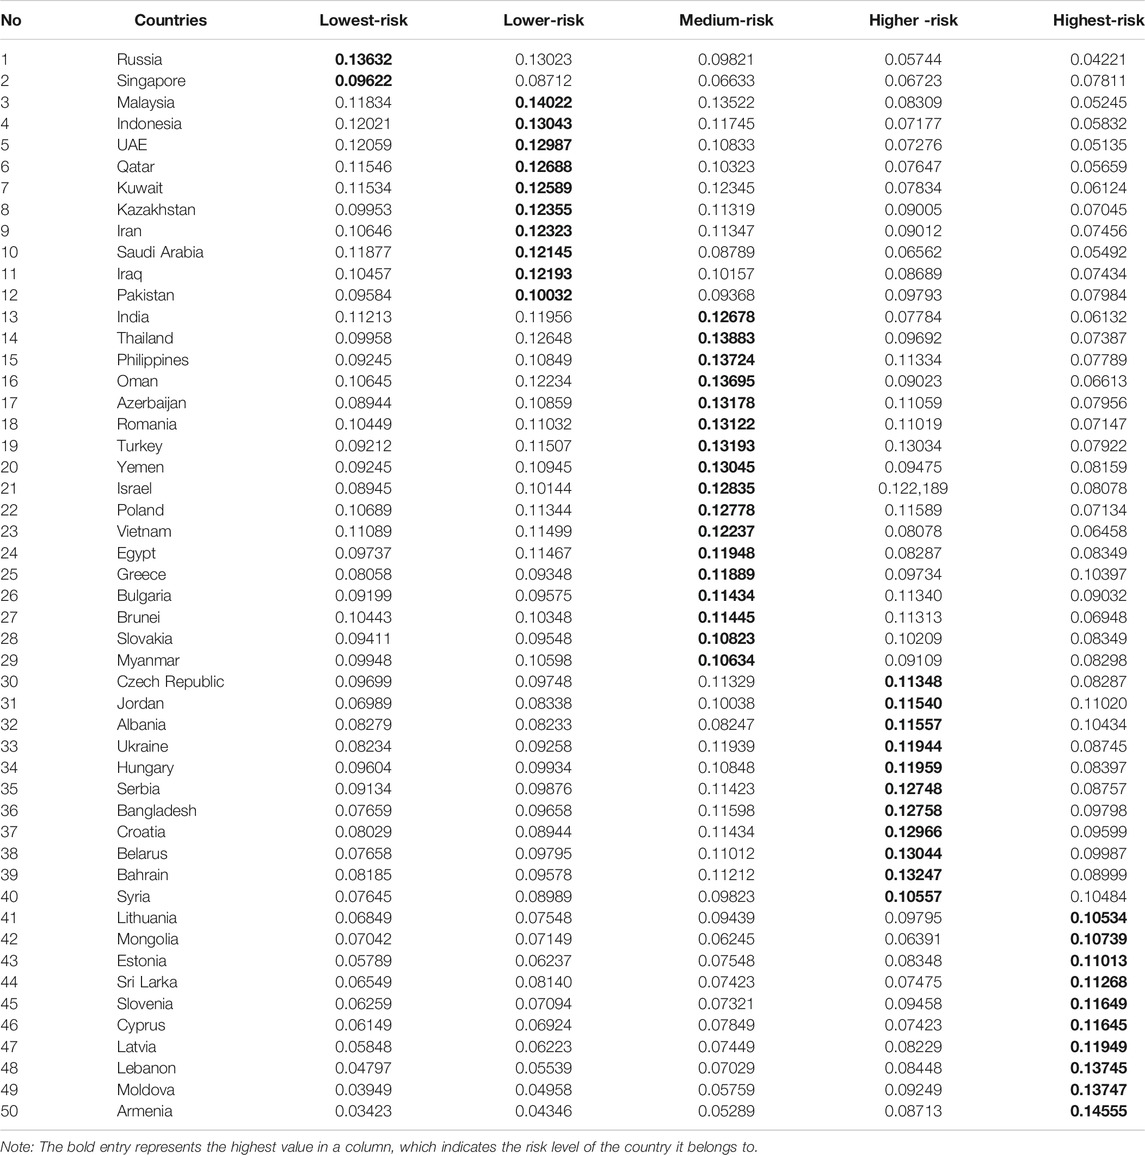
TABLE 4. Evaluation results.
It is noticeable that though some countries share the same risk grade, they have quite different characteristics in terms of the risk factors. Take Singapore and Russia having lowest risk for investment as an example, Singapore stands out because of its excellent investment environment, political stability and economic foundations, but it is lacking in the natural resources in terms of gas and oil. Russia is a country possesses abundant fossil resources but has relatively poorer economic foundations and investment environment. However, it still has the lowest risk for China’s energy investment, which could be attributed to several factors like it has a stable and friendly political relations with China. Additionally, with the geographical advantage of bordering China, it has already built several gas pipelines connecting the countries between these two countries. Therefore, it helps to build a solid foundations of the energy cooperation with these infrastructures. In conclusion, China can choose Russia as a good target nation for energy investment.
We could also observe that though some countries have the neighboring geographic locations, their factors influencing investment risk still vary a lot. In the Middle East, it has the most unstable geopolitical risks in terms of government stability, religious conflict and even war threat. Those countries possesses the majority of the fossil resources of the world, so such unstable situations in there always make the price and supply of the energy become unsettled as well. Despite of the above negative factors, these countries still attract lots of global energy investment mainly because of their potential of resources. Our analysis shows that UAE, Qatar, Kuwait and Saudi Arabia have the relatively stable government and less political threat, resulting in their evaluations being lower-risk grade. Iran and Iraq have the unstable political environment but still be rated as lower risk because of their sufficient reserves of fossil resources. Both countries also have a stable political and friendly diplomatic relation with China especially for Iran, and such relation become more intense because of the COVID-19 situation. Therefore, these two countries are worthwhile for China’s energy investment. Additionally, we could also observe that Malaysia and Indonesia in Southeast Asia and Kazakhstan and Pakistan in Central Asia are rated as lower risk balancing the resource potential, investment environment and environment constraints. Malaysia and Indonesia all have a stable political government and the foreign investment are well welcomed by their governments. Additionally, in recent years, both countries have been dedicated to improve their investment environment and stimulate the foreign investment, along with lots of infrastructures being constructed. So these two countries are also good targets. Kazakhstan and Pakistan are two countries have balanced possession of oil, coal and natural gas with decent economic and financial system. Both countries also have a good diplomatic relationship with China, however, their geopolitical situation is not very stable in Central Asia, which is a significant factor to be considered for China’s investment.
In conclusion, with the further implementation of China’s “Belt & Road Initiative” policies, we believe that the investment environment for those countries alongside “Belt & Road Initiative” will be better and be more open to foreign companies. We hope that the energy investment can be used as catalyst to stimulate the cooperations on more and more economic areas such as technology communication, infrastructure construction and labor contacts. We believe such cooperations can further decrease the investment risk of countries alongside the “Belt & Road Initiative”, so that a positive feedback circle could be formed. China’s efforts and investments could help the world build a more stable and sustainable energy supply system.
From the analysis above, countries like Iran and Iraq having unstable political environment still attract lots of energy investment because of their abundant energy resource, which implies that China should regard the oversea risk aversion as a whole, instead of focusing on the risk of a single project. China should bravely seek for the future opportunities and sustainable development for the energy investment. Additionally, most of the countries with lower risks are developing countries, so their legal construction maybe incomplete. Therefore, legislation and policy support should be provided by Chinese government for oversea energy investment. These countries also have different investment markets, so that China should build a platform providing information consulting service for the investor.
Although we have included six indicators containing 36 sub-indicators, there still exist may other factors worth to be considered. For example, Wu et al. (2020) consider the technical risks such as technology maturity, progressivenes and research and development (R&D) capacity. Azam et al. (2019) and Azam (2019) take the human capital and human health into consideration, respectively. Azam (2016) also considers the impact of environmental degradation on the economic growth. In the future, we intend to build a more comprehensive indicator system to consider as more related factors as possible.
Here we propose our policy recommendations for China’s policy makers. First of all, for energy investment, we must consider every aspect of the risk factors and choose the optimal strategies. We should try to find the future potentials and consider the sustainability of the energy and economic development. Additionally, the majority of the countries alongside the “Belt & Road Initiative” have the relatively higher investment risk because of various reasons, which reminds China’s companies to make careful and thorough investigations before making investments. On top of that, based on our investigation, we have several target countries to recommend. For example, Russia among the CIS nations, Saudi Arabia, UAE and Iran in Middle East, Malaysia and Indonesia in Southeast Asia, Kazakhstan and Pakistan in Middle Asia are all stable and reliable choices to be invested for China. Moreover, China should help to build the information consulting services for Chinese investors, offering professional suggestions for risk warning. The policy and legislation support should also be built for China’s national risk management.
As the world-leading energy-consuming country, it is urgent for China to secure the energy safety via oversea energy investment. The “Belt & Road initiative” brings such opportunities to China while the related research for recognition and prevention of oversea energy investment risks is limited.
Therefore, in this paper we put forward a seaq2seq model for assessing the energy investment risk on 50 countries alongside China’s “Belt & Road Initiative”. We first build an indicator system to evaluate the energy investment in six factors, i.e., investment environment, political risk, economic foundation, environment constraint, resource potential and Chinese factor. The six indicators could be separated into 36 sub-indicators. Then we propose the Bi-LSTM model as encoder to handle the historical statistics of these countries. The self-attention layer is adopted to calculate the weights of each indicator. We observe that the resource potential is the most important indicator, while “years of China’s diplomatic relations” is the most important sub-indicator. Finally we use a hierarchical CNN layer as decoder to produce the results of the assessment of energy risk investments. We have the ideal target countries for China’s oversea investment, namely, Russia, UAE, Saudi Arabia, Kazakhstan, Pakistan, Malaysia and Indonesia. Some countries like Iran and Iraq are also worth to be invested, as despite of their unstable political environment, they are in possession of abundant natural resources. It reminds China to bravely seek for the future opportunities and sustainable markets, instead of focusing on one project.
In future work, we intend to build a more comprehensive indicator system so that other important factors could also be included like human capital and human health. In addition, we could also further apply the up-to-date deep learning techniques to better process the statistics, e.g., reinforcement learning or generative adversarial network.
Publicly available datasets were analyzed in this study. This data can be found here: https://epub.prsgroup.com/products/international-country-risk-guide-icrghttps://databank.worldbank.org/home.aspx, https://www.eia.gov
PL realized the conceptualization, formal analysis and put forward a methodology, she also conducted the experiments and wrote the paper; MY helped data curation, coding and he also helped results validation; LJ reviewed and edited the paper.
The authors declare that the research was conducted in the absence of any commercial or financial relationships that could be construed as a potential conflict of interest.
Agliardi, E., Agliardi, R., Pinar, M., Stengos, T., and Topaloglou, N. (2012). A new country risk index for emerging markets: a stochastic dominance approach. J. Empir. Fin. 19, 741–761. doi:10.1016/j.jempfin.2012.08.003
Azam, M. (2016). Does environmental degradation shackle economic growth? A panel data investigation on 11 Asian countries. Renew. Sustain. Energ. Rev. 65, 175–182. doi:10.1016/j.rser.2016.06.087
Azam, M. (2020). Energy and economic growth in developing asian economies. J. Asia Pac. Econ. 25, 447–471. doi:10.1080/13547860.2019.1665328
Azam, M., Khan, A. Q., and Ozturk, I. (2019). The effects of energy on investment, human health, environment and economic growth: empirical evidence from China. Environ. Sci. Pollut. Res. 26, 10816–10825. doi:10.1007/s11356-019-04497-4
Azam, M. (2019). Relationship between energy, investment, human capital, environment, and economic growth in four brics countries. Environ. Sci. Pollut. Res. 26, 34388–34400. doi:10.1007/s11356-019-06533-9
Bahdanau, D., Cho, K., and Bengio, Y. (2015). Neural machine translation by jointly learning to align and translate. Mach. Translat. 31, 3–18. doi:10.1007/s10590-017-9194-2
Brewer, T. L., and Rivoli, P. (1990). Politics and perceived country creditworthiness in international banking. J. Money Credit Bank 22, 357–369.
Brown, C. L., Cavusgil, S. T., and Lord, A. W. (2015). Country-risk measurement and analysis: a new conceptualization and managerial tool. Int. Business Rev. 24, 246–265. doi:10.1016/j.ibusrev.2014.07.012
Cadarso, M. A., Gomez, N., Lopez, L. A., and Tobarra, M. A. (2016). Sustainable tourism: Progress, Challenges and Opportunities, Calculating tourism’s carbon footprint: measuring the impact of investments. J. Clean. Prod. 111, 529–537. doi:10.1016/j.jclepro.2014.09.019
Chen, H., Wang, C., and Ye, M. (2016). An uncertainty analysis of subsidy for carbon capture and storage (ccs) retrofitting investment in China’s coal power plants using a real-options approach. J. Clean. Prod. 137, 200–212. doi:10.1016/j.jclepro.2016.07.074
Cho, K., van Merrienboer, B., Gülçehre, Ç., Bahdanau, D., Bougares, F., Schwenk, H., et al. (2014). Learning phrase representations using RNN encoder-decoder for statistical machine translation. EMNLP 33, 1724–1734. doi:10.3115/v1/d14-1179
Chorn, L., and Shokhor, S. (2006). Real options for risk management in petroleum development investments. Energ. Econ. 28, 489–505. doi:10.1016/j.eneco.2006.03.002
Conrad, B., and Kostka, G. (2017). Chinese investments in europe’s energy sector: risks and opportunities? Energy Policy 101, 644–648. doi:10.1016/j.enpol.2016.12.016
Cucchiella, F., Gastaldi, M., and Trosini, M. (2017). Investments and cleaner energy production: a portfolio analysis in the Italian electricity market. J. Clean. Prod. 142, 121–132. doi:10.1016/j.jclepro.2016.07.190
Dauphin, Y. N., Fan, A., Auli, M., and Grangier, D. (2017). Language modeling with gated convolutional networks. ICML 15, 933–941. doi:10.21437/interspeech.2020-1493
Dockner, E. J., Kucsera, D., and Rammerstorfer, M. (2013). Investment, firm value, and risk for a system operator balancing energy grids. Energ. Econ. 37, 182–(192.) doi:10.1016/j.eneco.2013.01.007
Duan, F., Ji, Q., Liu, B.-Y., and Fan, Y. (2018). Energy investment risk assessment for nations along China’s belt & road initiative. J. Clean. Prod. 170, 535–547. doi:10.1016/j.jclepro.2017.09.152
Fan, Y., and Zhu, L. (2010). A real options based model and its application to China’s overseas oil investment decisions. Energ. Econ. 32, 627–637. doi:10.1016/j.eneco.2009.08.021
Farfan, J., and Breyer, C. (2017). Structural changes of global power generation capacity towards sustainability and the risk of stranded investments supported by a sustainability indicator. J. Clean. Prod. 141, 370–384. doi:10.1016/j.jclepro.2016.09.068
Feder, G., and Just, R. E. (1977). A study of debt servicing capacity applying logit analysis. J. Dev. Econ. 4, 25–38. doi:10.1016/0304-3878(77)90004-9
Feder, G., and Uy, L. V. (1985). The determinants of international creditworthiness and their policy implications. J. Pol. Model. 7, 133–156. doi:10.1016/0161-8938(85)90032-8
Gal, N., Milstein, I., Tishler, A., and Woo, C. (2017). Fuel cost uncertainty, capacity investment and price in a competitive electricity market. Energ. Econ. 61, 233–240. doi:10.1016/j.eneco.2016.11.014
Gehring, J., Auli, M., Grangier, D., Yarats, D., and Dauphin, Y. N. (2017). “Convolutional sequence to sequence learning,” in Proceedings of the 34th International Conference on Machine Learning. Sydney, NSW, Australia: ICML 2017, 6–11.
Hach, D., and Spinler, S. (2016). Capacity payment impact on gas-fired generation investments under rising renewable feed-in—a real options analysis. Energ. Econ. 53, 270–280. doi:10.1016/j.eneco.2014.04.022
Hafeez, M., Chunhui, Y., Strohmaier, D., Ahmed, M., and Jie, L. (2018). Does finance affect environmental degradation: evidence from one belt and one road initiative region? Environ. Pollut. Res. 14, 21. doi:10.1007/s11356-018-1317-7
Hammer, P., Kogan, A., and Lejeune, M. (2006). Modeling country risk ratings using partial orders. Eur. J. Oper. Res. 175, 836–859. doi:10.1016/j.ejor.2005.06.040
He, K., Zhang, X., Ren, S., and Sun, J. (2016). “Deep residual learning for image recognition,” in IEEE Conference on Computer Vision and Pattern Recognition, CVPR 2016. NV, USA: Las Vegas, 770–778. doi:10.1109/CVPR.2016.90
Hieronymi, P., and Schüller, D. (2015). The clean-development mechanism, stochastic permit prices and energy investments. Energ. Econ. 47, 25–36. doi:10.1016/j.eneco.2014.10.008
Hochreiter, S., and Schmidhuber, J. (1997). Long short-term memory. Neural Comput. 9, 1735–1780. doi:10.1162/neco.1997.9.8.1735
Jones, A. W. (2015). Perceived barriers and policy solutions in clean energy infrastructure investment. J. Clean. Prod. 104, 297–304. doi:10.1016/j.jclepro.2015.05.072
Kharas, H. (1984). The long-run creditworthiness of developing countries: Theory and practice. Q. J. Econ. 99, 415–439. doi:10.2307/1885958
Li, J. P., Tang, L., Sun, X. L., Yu, L. A., He, W., and Yang, Y. Y. (2012). Country risk forecasting for major oil exporting countries: a decomposition hybrid approach. Comput. Ind. Eng. 63, 641–651. doi:10.1016/j.cie.2011.12.003
Liedtke, S. (2017). Chinese energy investments in europe: an analysis of policy drivers and approaches. Energy Policy 101, 659–669. doi:10.1016/j.enpol.2016.09.037
Luong, T., Pham, H., and Manning, C. D. (2015). “Effective approaches to attention-based neural machine translation,” in Proceedings of the 2015 conference on empirical methods in natural language processing, 17–21. Lisbon, Portugal: EMNLP 2015, 1412–1421.
Mayer, C., Breun, P., and Schultmann, F. (2017). Considering risks in early stage investment planning for emission abatement technologies in large combustion plants. J. Clean. Prod. 142, 133–144. doi:10.1016/j.jclepro.2016.05.089
Miller, K. D. (1992). A framework for integrated risk management in international business. J. Int. Business Stud. 23, 311–331. doi:10.1057/palgrave.jibs.8490270
Mo, J.-L., Schleich, J., Zhu, L., and Fan, Y. (2015). Delaying the introduction of emissions trading systems—implications for power plant investment and operation from a multi-stage decision model. Energ. Econ. 52, 255–264. doi:10.1016/j.eneco.2015.11.009
Pringles, R., Olsina, F., and Garcés, F. (2015). Real option valuation of power transmission investments by stochastic simulation. Energ. Econ. 47, 215–226. doi:10.1016/j.eneco.2014.11.011
Sanchez, G. M., and Meltzer, E. S. (2012). The Edwin Smith Papyrus: updated translation of the trauma treatise and modern medical commentaries. New York, NY: Lockwood Press.
Strand, J., Miller, S., and Siddiqui, S. (2014). Long-run carbon emission implications of energy-intensive infrastructure investments with a retrofit option. Energ. Econ. 46, 308–317. doi:10.1016/j.eneco.2014.10.002
Sun, X., Li, J., Wang, Y., and Clark, W. W. (2014). China’s sovereign wealth fund investments in overseas energy: the energy security perspective. Energy Policy 65, 654–661. doi:10.1016/j.enpol.2013.09.056
Sutskever, I., Vinyals, O., and Le, Q. V. (2014). Sequence to sequence learning with neural networks. NIPS 14, 33. doi:10.21437/interspeech.2018-1381
Tan, X. (2013). China’s overseas investment in the energy/resources sector: its scale, drivers, challenges and implications. Energ. Econ. 36, 750–758. doi:10.1016/j.eneco.2012.11.019
Tietjen, O., Pahle, M., and Fuss, S. (2016). Investment risks in power generation: a comparison of fossil fuel and renewable energy dominated markets. Energ. Econ. 58, 174–185. doi:10.1016/j.eneco.2016.07.005
Wu, Y., Wang, J., Ji, S., and Song, Z. (2020). Renewable energy investment risk assessment for nations along China’s belt & road initiative: an anp-cloud model method. Energy 190, 116381. doi:10.1016/j.energy.2019.116381
Xu, Q., Lei, Y., Ge, J., and Ma, X. (2017). Did investment become green in China? evidence from a sectoral panel analysis from 2003 to 2012. J. Clean. Prod. 156, 500–506. doi:10.1016/j.jclepro.2017.04.075
Zhai, F. (2018). China’s belt and road initiative: a preliminary quantitative assessment. J. Asian Econ. 55, 233. doi:10.1016/j.asieco.2017.12.006
Zhang, M., Zhou, P., and Zhou, D. (2016). A real options model for renewable energy investment with application to solar photovoltaic power generation in China. Energ. Econ. 59, 213–226. doi:10.1016/j.eneco.2016.07.028
Zhang, R., Andam, F., and Shi, G. (2017). Environmental and social risk evaluation of overseas investment under the China–Pakistan economic corridor. Environ. Monit. Assess. 189, 253. doi:10.1007/s10661-017-5967-6
Keywords: seq2seq framework, belt & road initiative, energy investment risk assessment, Bi-LSTM, hierarchical CNN
Citation: Liang P, Yu M and Jiang L (2021) Energy Investment Risk Assessment for Nations Via Seq2seq Model. Front. Environ. Sci. 9:627323. doi: 10.3389/fenvs.2021.627323
Received: 09 November 2020; Accepted: 09 February 2021;
Published: 25 March 2021.
Edited by:
Long Wang, University of Science and Technology Beijing, ChinaReviewed by:
Ruilian Zhang, The University of Queensland, AustraliaCopyright © 2021 Liang, Yu and Jiang. This is an open-access article distributed under the terms of the Creative Commons Attribution License (CC BY). The use, distribution or reproduction in other forums is permitted, provided the original author(s) and the copyright owner(s) are credited and that the original publication in this journal is cited, in accordance with accepted academic practice. No use, distribution or reproduction is permitted which does not comply with these terms.
*Correspondence: Lincheng Jiang, bGluY2hlbmdqaWFuZ0BudWR0LmVkdS5jbg==
Disclaimer: All claims expressed in this article are solely those of the authors and do not necessarily represent those of their affiliated organizations, or those of the publisher, the editors and the reviewers. Any product that may be evaluated in this article or claim that may be made by its manufacturer is not guaranteed or endorsed by the publisher.
Research integrity at Frontiers
Learn more about the work of our research integrity team to safeguard the quality of each article we publish.