 Zhuangai Li
 Xia Cao
- School of Law, Shanxi University of Finance and Economics, Taiyuan, China
Household electricity consumption has increased significantly over the last two decades, leading to a series of policy interventions targeting to reduce electricity consumption in the residential sector. Information feedback regarding household electricity consumption is considered a cost-effective approach to promoting energy conservation. Various studies have so far covered the effects of information feedback on electricity consumption, yet the variations in both the types of feedback provided and the research methodologies have made it difficult to draw plausible conclusions. In China’s case, less due regard has been given to the effectiveness of various types of information feedback. This study has compared the effectiveness of information feedback between emailing electricity bills to households and installing smart meters in terms of promoting electricity conservation by employing empirical survey data from the Chinese General Social Survey with the help of the propensity score matching method. The results show that information provision via information bills curtails electricity consumption by around 20%, whereas information feedback via smart meters installation has no positive effects on household electricity conservation due to lack of access and knowledge to understand the displays of advanced meters. In light of the above results, the study suggests that policy-makers stress the importance of information feedback-based initiatives and improve the information feedback capacity of smart meters through training and education.
Introduction
Residential energy consumption (REC), the second largest energy consumer in China, is responsible for about 12.8% of total energy demand with an average annual increase of 7.24% from 2000 to 2017 (Fan et al., 2020). With both direct and indirect CO2 emissions taken into consideration, the residential sector, the major contributor to global warming, has contributed more emissions than the industrial sector (Qi and Li, 2020). Thus, it is of great significance for China to conduct energy conservation and carbon abatement in the residential sector (Zhang H et al., 2020). More recently, China’s structure of energy consumption has largely shifted toward electricity and away from direct burning of coal (Xie et al., 2020). The electricity consumption in the dwellings has seen even faster growth, with an average growth rate of 11.49% from 1990 to 2017 (NBS, 2019), so there is enormous untapped potential for energy saving in the residential electricity consumption (Zhang M et al., 2020). In this context, residential electricity saving in China is becoming a priority. Understanding the policy measures to reduce residential electricity consumption is an essential part of mitigating global warming, making it a prime target for intervention (Davis and Metcalf, 2016). One such intervention is the information feedback, which provides households with the amount of their electricity consumption and monetary costs over a specified time period to promote energy conservation (Ito, 2014). Information feedback addresses problems of incomplete information in markets, which is at the crux of the energy efficiency gap, thus helping the residents overcome cognitive or behavioral biases and make better decisions of electricity consumption (Ratner et al., 2008). This method has been implemented and proven to be successful for promoting behavior change from individual to group levels in various fields, such as public health and education (Aydin et al., 2018).
In the field of electricity, bounded rationality constrains effective planning for electricity consumption, because households have limited information on electricity consumption due to separation of consumption and payment (Gilbert and Zivin, 2014), along with complicated electricity tariff structures (Bushnell and Mansur, 2005), making it difficult for households to understand actual electricity use. Studies have found that only 56% of the households understand their monthly energy consumption (Brounen et al., 2013) and only about 27% of the residents have knowledge about the average price of electricity (Blasch et al., 2017). Therefore, provision of more information feedback will increase awareness and transparency of electricity use. Among feedback-based intervention, electricity bills are considered a low-cost strategy for motivating household electricity conservation and has received considerable research attention (Henryson et al., 2000). A second resource for electricity feedback is from smart metering technology, which helps to remove informational constraints on residential consumption due to advances in energy infrastructure (Carroll et al., 2014). All that feedback information could motivate people to increase awareness of and knowledge about energy consumption levels, and to develop new energy-efficient habits and adapt to real-time pricing more effectively.
Policymakers are increasingly looking to information feedback for guidance. EU Directive (2006/32/EC) on Energy End-Use Efficiency and Energy Services (Energy Services Directive), dating from April 2006, requires the Member States to provide information feedback, including metering, frequent informative billing, historic and normative comparisons, contact information and advice for improving energy end-use efficiency (EUR, 2006). Denmark sets forth a legal obligation to offer informative electricity bills presenting historic and normative comparisons along with environmental impact. Sweden is the first country in Europe to have started a large-scale deployment of smart meters and enacted statutes to encourage provision of monthly billings by smart meters for all customers from July 2009 (Fischer, 2008). Likewise, the United States government allocated over $4 billion to install smart meters in 2009, encouraging utilities to supply residents with access to their energy information (Chopra, 2011). Aware of the significance of information feedback for residential electricity conservation, China has implemented a multitude of policies and programs to increase information feedback capacity, such as deployment of in-house display and smart meters. However, these initiatives are often designed without accurate resident’s requirement in mind (Du et al., 2017).
In this paper, we have employed the data of majority of Chinese provinces from the large-scale fieldwork through the Chinese General Social Survey (CGSS) launched jointly by Renmin University and the Hong Kong University of Science and Technology in 2018 to analyze how the information feedback can influence electricity consumption in the residential sector. The CGSS is the first national representative survey project run by academic institution in China mainland for researchers and scientists to study the behavior of Chinese households (Li et al., 2019). In this survey, the information feedback is made available by sending emails to households about their electricity bills or made the consumption shown on the dashboard by using the smart meters. The findings have indicated that providing feedback by sending emails contributes to a substantial reduction in residential electricity consumption, but the deployment of smart meters has failed to achieve the similar result as electricity bills. These results have indicated that information feedback via electricity bills can be used as a strategy to address behavioral barriers and ultimately conserve electricity. Advanced meters alone are not sufficient to change household energy consumption practices in China. The real-time display of electricity expenditure can lead to energy-conservative behavior in households through the learning channel (Lynham et al., 2016). As such, further training about those infrastructures are needed to make consumers gain adequate information in an instantaneous and easily accessible way. Understanding the underlying mechanism of electricity information feedback thus helps to identify challenges and opportunities and offer concrete suggestions for China's future energy policy.
As the effectiveness of information feedback is receiving increasingly more attention, the research has shifted from the laboratory to field experiments (Levitt and List, 2009). However, we still have insufficient knowledge of the effectiveness of information feedback on residential energy consumption (Bernedo et al., 2014), especially in the context of China. In this paper, we evaluate the effects of information feedback via both electricity bills and smart meters using a large-scale fieldwork and a large sample in China. The study uses the propensity score matching to focus on the effectiveness of feedback intervention by collecting the data of households from the Chinese General Social Survey (CGSS).
Literature Review and Hypotheses
Much literature has discussed over the effectiveness of information feedback on electricity consumption, but with a variety of conclusions by applying the different feedback mechanisms. A set of meta-analysis results indicate that information feedback is effective, and can encourage favorable changes in energy consumption behavior (Delmas et al., 2013; Karlin et al., 2015; Nemati and Penn, 2020). According to some information feedback studies, feedback initiatives could lower residential electricity consumption ranging from 1.1% to 20% (Fischer, 2008; Vine et al., 2013).
Accurate and frequent billing, as interactive feedback service, will give the households a much better sense of the electricity expenditure at different times of a year. Pon (2017) found that billing reports contributed to reducing residential electricity use. Carroll et al. (2014) demonstrated that households could curtail the electricity consumption by 8.7% and 5.4% when receiving monthly billing and bi-monthly billing respectively. The Electric Power Research Institute (2009) concluded that monthly feedback and daily/weekly feedback could promote energy saving by 9% and 8% respectively (Neenan et al., 2009). Gleerup et al. (2010) showed that providing information via messages and emails led to averagely 3% of reduction in total annual electricity consumption. Other studies, however, have found smaller effects or no effects. Andor et al. (2020) found that the electricity feedback based on home energy report could cut down electricity consumption only by 0.7%. Restrepo and Morales-Pinzón (2020) and Khanna et al. (2016) demonstrated that electricity consumption seems unaffected by the delivery of feedback information due to the fact that consumers do not know which activity generates the waste of electricity.
Smart meters could help residents to monitor and better understand their electricity consumption. Gans et al. (2013) and Schleich et al. (2017) indicated that the installation of a smart metering could help reduce electricity consumption by 11–17% and 5% per household respectively. Aydin et al. (2018) showed that feedback initiatives through the use of in-home displays could save electricity by around 20% on average. In China, Zhang et al. (2016) tested the effectiveness of real-time in-home displays on residential electricity consumption, and showed that the in-home displays reduced monthly electricity consumption by around 9.1% in Shanghai City (one of the big and highly developed cities in China). However, Matsukawa (2018) found that feedback from in-home displays only reduced electricity on the part of energy-using households rather than energy-saving households. Hargreaves et al. (2013) found that smart meters did not necessarily bring electricity conservation in the United Kingdom, which is close to the estimates documented in the study by Nilsson et al. (2014) and Khanna et al. (2016) who also found that provision of information feedback via smart meters had little significant impact on electricity consumption on the side of residents. The researchers have ascribed this result to residents’ lack of ability to comprehend and utilize the information from advanced intelligent devices.
The effectiveness of information feedback via electricity bills and smart meters in cutting down energy consumption varies widely across studies. Given the variety in reported results, it is essential to identify what types of information feedback can have a positive impact on electricity conservation and to understand the mechanisms behind households’ behavior in China. In particular, so far, few studies have identified the causal effects between information-based initiatives and residential electricity consumption at a national level covering both urban and rural residents in China, which is critical to policy intervention. This study tries to fill in this gap.
In light of the previous literature, this paper studies the effects of information feedback via emails and smart meters on households’ electricity consumption. Therefore, following hypotheses are put forward based on the arguments presented above.
Hypothesis 1: Feedback information could reduce electricity consumption through sending emails of electricity bills.
Information feedback promotes public awareness and knowledge, which makes residents change their consumption behavior and promoting energy efficiency (Oltra et al., 2013). These changes in household behavior contribute to a reduction in electricity expenditure. Numerous studies have concluded that the provision of electricity bills affects residential electricity consumption (Darby, 2006; Gleerup et al., 2010; Carroll et al., 2014; Pon, 2017). Thus we hypothesize that households that receive electricity bills tend to change their electricity-use behavior, resulting in lower electricity consumption.
Hypothesis 2: The installation of smart meters is conducive to the reduction of electricity consumption.
Smart meters could help households to better monitor their electricity consumption. Studies have examined whether and how smart meters influence electricity usage, but with different conclusions (Gans et al., 2013; Hargreaves et al., 2013; Nilsson et al., 2014; Schleich et al., 2017; Aydin et al., 2018; Matsukawa 2018). We assume that the Chinese households with smart meters are likely to consume less electricity.
Research Design
Sample
We adopt the propensity score matching (PSM) method with the data from the Chinese General Social Survey (CGSS) conducted by the National Survey Research Center of China, which is a continuous large-scale nationwide survey covering 28 provinces in both urban and rural China in 2015. This CGSS survey consists of Core module, Work and Economy module, East Asian Social Survey (EASS) module, International Social Survey Program (ISSP) model, Energy module and Law module with different sample size in each module to systematically investigate the changing relationship between social structure and quality of life. By the end of 2018, about 2,470 journal papers and 645 master’s dissertations were published based on CGSS data. In this study, we employed the Core module (sample size 10,968) and the Energy module (sample size 3,557) to discuss the relationship between information feedback via electricity bills or smart meters and electricity consumption in the residential sector. The final sample size is 2,584 after removing the observations with missing values.
To verify that our statistics in the sample are able to provide a sound representation of China’s case, the distribution of the demographic factors in our sample survey is compared against the 2015 statistics from the National Bureau of Statistics (NBS, 2015). The education levels of the respondents are presented in Figure 1A and the overall trend is similar to that of NBS. Figure 1B displays the age distributions of the modeling samples and NBS. Since the head of the household typically responds to the sample, there are some differences about age level 1 and 5. The remaining categories are similar to those of NBS. Figures 1C,D show that the distributions of registered residence and gender in the survey sample closely match those of NBS. Besides, the average household size of this survey (2.9 persons per household) is similar to that in the statistical yearbook (3.1 persons per household). Overall, the survey sample has covered major demographic factors.
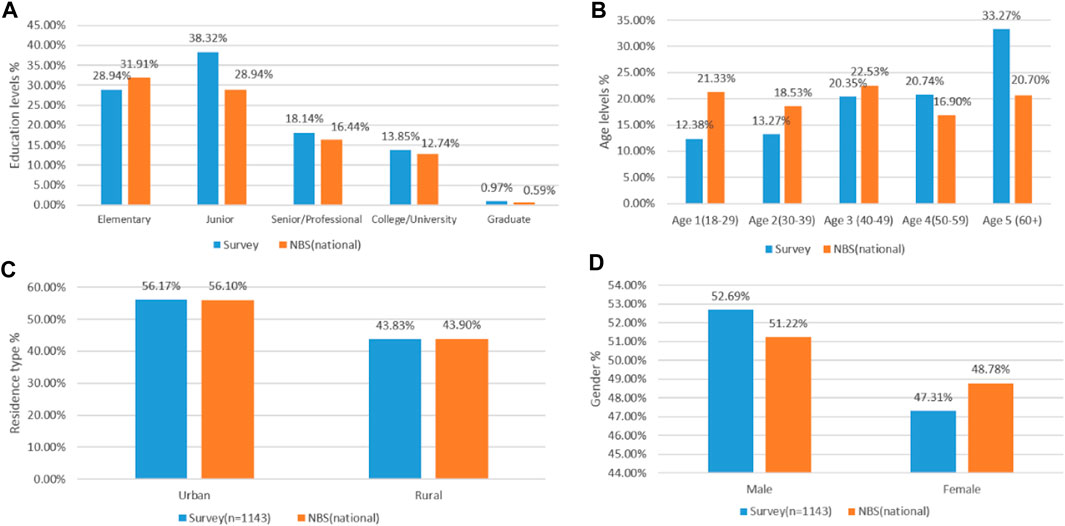
FIGURE 1. Major socioeconomic attributes: survey samples and national distribution. (A) education level; (B) age level; (C) residence type; (D) gender.
Variables
Electricity Consumption
Electricity consumption is the dependent variable in our study. Sample data of the households’ average monthly electricity usage are selected from the dataset of the Chinese General Social Survey (CGSS), in which the respondents are requested to provide the average monthly consumption data in kilowatt hour (kWh) spent on electricity.
Information Feedback
The independent variable of this study is information feedback by sending the emails about electricity bills and making the information available on the dashboard via smart meters. Information feedback is a dichotomy variable (as receiving information feedback = 1, without receiving information feedback = 0). In the analysis of propensity score matching, the group with information feedback is the treatment group, while the group without information feedback is the control group.
Control Variables
Further, in order to control the interference of other factors of households, a group of control variables are employed in this study. Previous studies have suggested that the physical attributes of residential dwelling impact household electricity consumption. For example, house size is confirmed as an important indicator of the residential electricity consumption (Santamouris et al., 2007). As the house size increases, the electricity consumption of household is expected to increase. Other dwelling characteristics identified as significant parameters affecting the amount of electricity are the number of electrical appliances (Huebner et al., 2016), house heating (Romero-Jordan et al., 2014), house ownership (Hamilton et al., 2013). As the households own more electrical appliances and house heating, more electricity is consumed. In this study, the total number of residential electrical appliances is calculated, including cooking equipment, refrigerator/freezer, washer/dryer, TV, computer, water heater, television, computers and laptop, air conditioners and washing machine. Previous studies have proved that electricity consumption is strongly correlated with household characteristics such as household income (Huang, 2015), number of individuals in a household (Ndiaye and Gabriel, 2011), length of residency (Xu et al., 2020) and residence type. According to China’s Residential Energy Consumption Report, urban residents in China consume approximately 1.25 times as much electricity as rural residents (Yang et al., 2019). Household size, or the number of individuals in a household, is positively associated with residential electricity consumption, as a direct effect (Karatasou and Santamouris, 2019). The residents with larger household size tend to consume more electricity. Besides, there is a positive relationship between the amount of electricity used in a building and income (Bao and Li, 2020). Furthermore, electricity price is also confirmed as an important parameter affecting electricity consumption (Blázquez et al., 2013). Therefore, the control variables include household characteristics with the quantity of occupants, total yearly income in 2014, length of residency and residence type, dwelling characteristics with floor area, number of electrical appliances, house heating and house ownership and electricity price which have been identified as the factors influencing the electricity consumption. Variables are shown in Table 1. In order to verify the relationship between electricity consumption and control variables, the Ordinary (OLS) methods are employed to estimate the variables’ effect on electricity consumption by using the logarithmic forms of electricity consumption and the continuous control variables. Table 2 illustrates the regression results of electricity consumption, which helps to prove that those control variables indeed influence the electricity consumption. In order to ensure the trustworthy regression results, the White test is used to check for the presence of heteroscedasticity on these variables (White, 1980). The test statistics is 0.29, which fails to reject the null hypothesis of homoscedasticity.
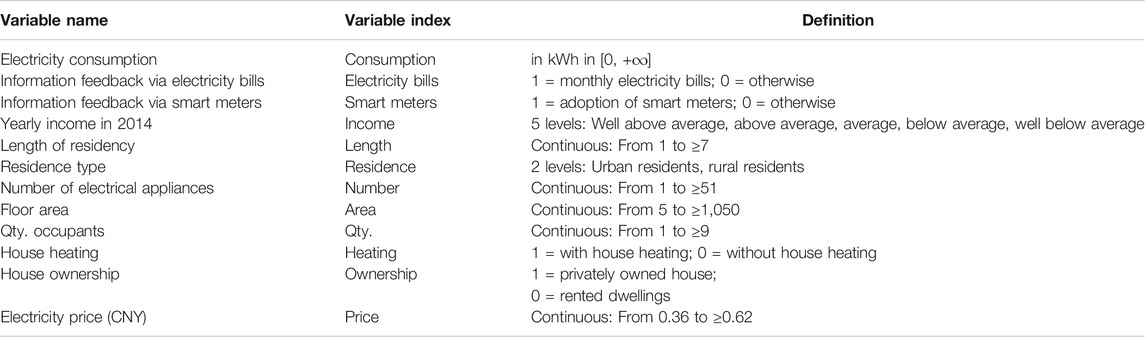
TABLE 1. Variable definition.
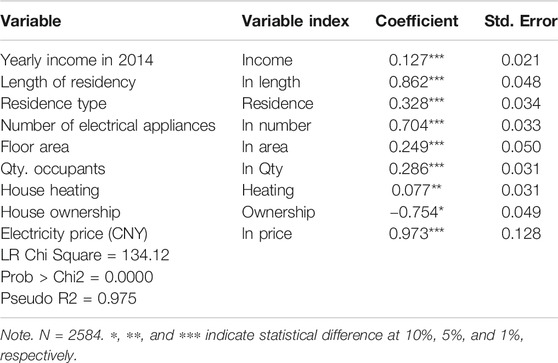
TABLE 2. Effect factors of electricity consumption.
Model
The issue studied in this paper is the influence of the implementation of information feedback of electricity bills and smart meters on the consumption of electricity. We analyze the effects of information feedback on the residential energy consumption using PSM which applies quasi-experimental option for interventional effects analysis (Rosenbaum and Rubin, 1983). Therefore, taking electricity consumption as the independent variable; taking the information feedback via electricity bills and smart meters as dependent variables; controlling the factors household characteristics with the household size, total yearly income in 2014, length of residency and residence type, dwelling characteristics with including floor area, number of electrical appliances, house heating and house ownership, and electricity price, a flexible Logit model to estimate propensity score is performed in Eq. 1.
Naturally, the counterfactual mean for those receiving the information feedback via electricity bills and smart meters i.e.,
Empirical Analysis
Descriptive Statistics
Table 3 gives information about the descriptive statistics. There are 2,584 observations after removing the observations with missing values in the final sample. Through mean, standard deviation, minimum, maximum, and observations, some information could be delivered. The maximum value of household electricity consumption is 3,000 while the minimum value is 3, which means that there is a great difference in household electricity consumption. The mean values of household receiving information feedback via electricity bills and smart meters are 0.5014 and 0.3594 respectively, indicating 50.14% of households receive electricity bills and only 35.94% of households install the smart meters. Then, we compare electricity consumption of households receiving information feedback and those without by PSM analysis, which reduces confounding factors. Specifically, three different matching algorithms: single nearest neighbor methods and four nearest neighbor methods with caliper (0.01) along with the kernel density matching are used to balance the probability of receiving the information feedback. Nearest neighbor matching matches a household from the control unit to a household in the treated unit, based on the closest propensity score. Four nearest neighbor method matches four control cases for each treated household, which could decrease variance. In kernel density matching, household in the treated unit is matched to weighted averages of the households who have similar controls, with greater weight being given to the households with closer scores.
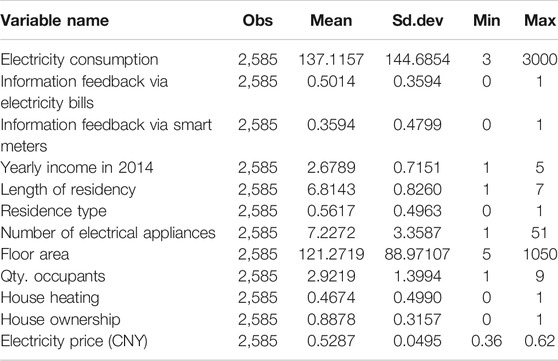
TABLE 3. The descriptive statistics.
Determinants of Information Feedback
Table 4 reports the empirical estimate of the logistic regression of PSM by using the logarithmic forms of electricity consumption and the continuous control variables, which shows the factors influencing the adoption of information feedback. Residence type has a positive effect on the information feedback, which is statistically significant at the 1% level. Urban residents have higher potential to receive information feedback, including both electricity bills and smart meters. In China, households in most third-tiered cities and rural areas fail to install smart meters (Mi et al., 2020), so residents in those areas have limited access to their electricity information from electricity supplies. Thus the government should formulate regulations in infrastructure development to informing the residents of their electricity consumption. Electricity price is also found to be a significant determinant of information feedback adoption via both electricity bills and smart meters. Households paying relatively expensive electricity prices are more likely to receive the electricity bills and install smart meters. This is due to the fact that the households with higher electricity expenditure are willing to monitor their electricity information. Those residents who stay in the dwellings shorter have a higher probability of receiving electricity bills. The households with more electrical appliances have a significantly higher possibility to use smart meters. People in privately owned houses are more interested in the installation of smart meters than those living in rented dwellings. House heating has a negative effect on the adoption of smart meters. This may be ascribable to electric heating's significant share of a household’s total electricity consumption. Because of this high share, households are unlikely able to deploy smart meters.
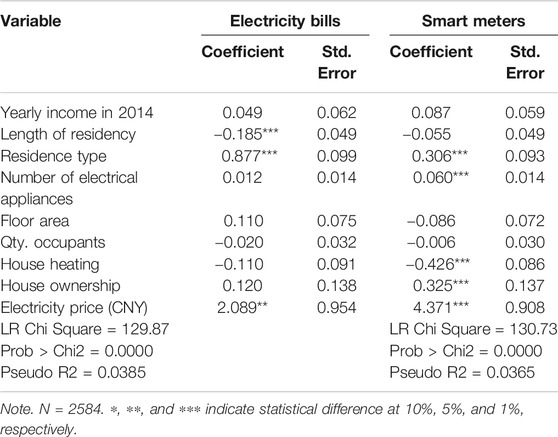
TABLE 4. Determinants of information feedback.
Checking Overlap Assumption
The effects of adoption of information feedback are estimated using electricity consumption. To meet this end, the research first produces the distribution of density propensity score of electricity bills and smart meters between the treatment and control groups shown in Figure 2A and Figure 3A, respectively. This is to testify the quality of the matching process after predicting the propensity scores. From Figure 2A and Figure 3A, a significant portion of observations of electricity bills and smart meters are among the common ranges. Figure 2B and Figure 3B present biases of the control variables of electricity bills and smart meters prior to and post the propensity score matching, which demonstrates the balance of the control variables before and after matching. The biases of all control variables have been dramatically reduced for the post matching as shown by the black cross. The distribution of propensity scores of the treated group and the control group of electricity bills and smart meters from the matched sample shows that they greatly overlap after matching, effectively reducing the data deviation. Figures 4, 5 illustrate distribution of tendency score of electricity billings and smart meters before matching and after matching respectively, in which the treated group and the control group have relatively good common support after matching. This means that, after matching, treatment and control are very similar to each other with respect to all variables.
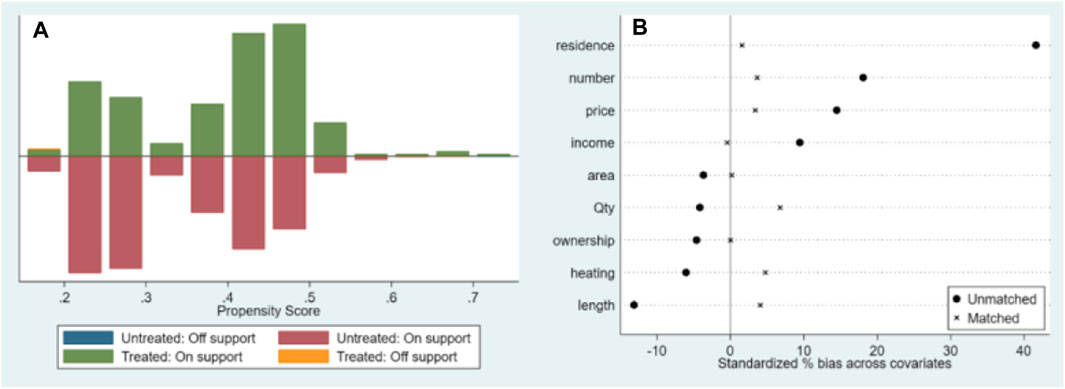
FIGURE 2. Matching quality and balancing tests of electricity bills. (A) Distribution of propensity score; (B) Standard bias across covariates after matching.
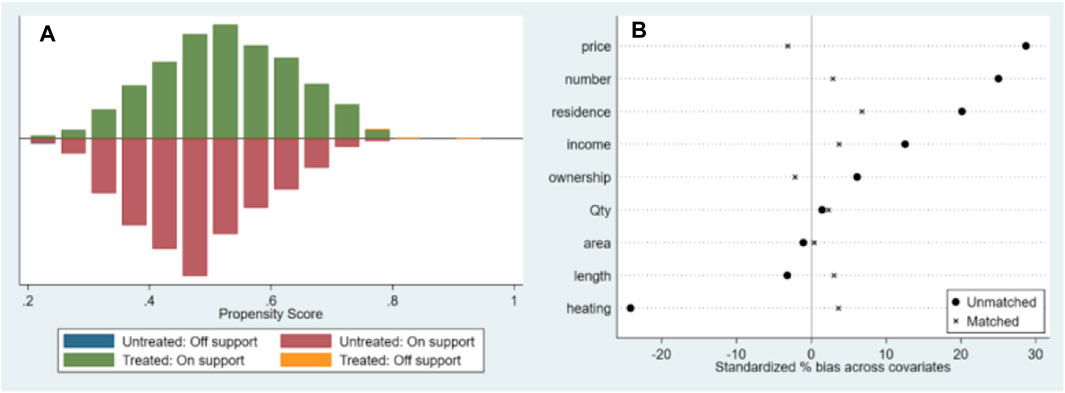
FIGURE 3. Matching quality and balancing tests of smart meters. (A) Distribution of propensity score; (B) Standard bias across covariates after matching.
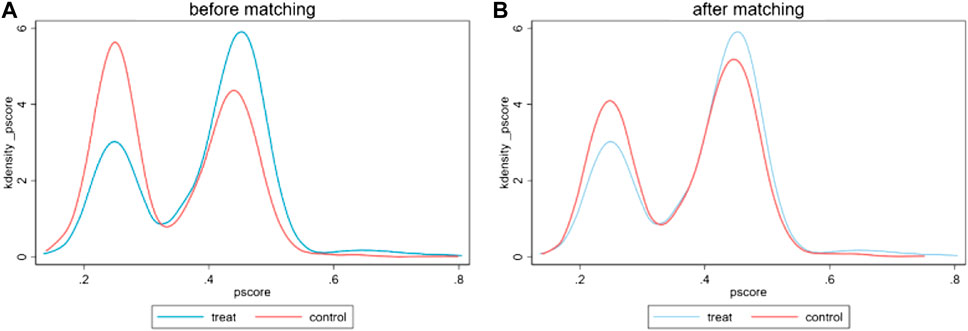
FIGURE 4. Kernel density estimate of electricity billing. (A) Before matching; (B) After matching.
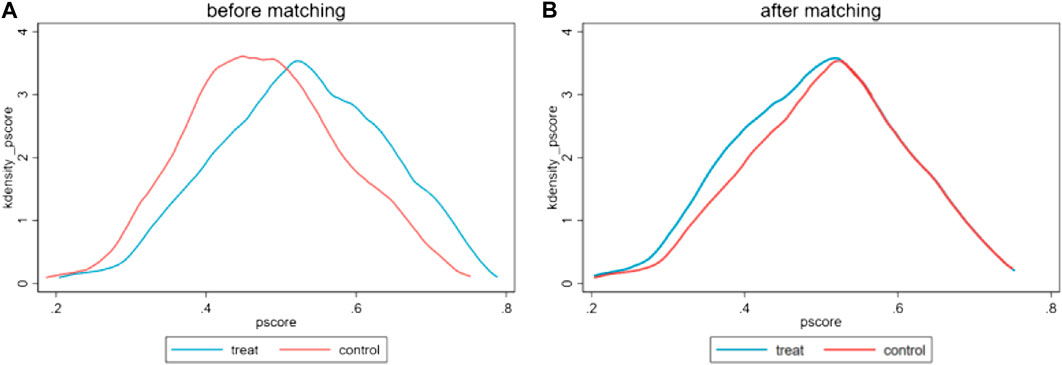
FIGURE 5. Kernel density estimate of smart meters. (A) Before matching; (B) After matching.
Tables 5, 6 illustrate the balancing test on the control variables of electricity billing and smart meters. From the Tables, the households with information feedback and those without present similar characteristics because the propensity score test presents a significant reduction in bias after matching, which is all below strict criterion of 10. Besides, there is no statistically significant difference between their mean control variables after the matching for both electricity bills and smart meters. Hence, as for both electricity bills and smart meters, apart from quantity of the occupants, the treated and the control groups are comparable conditioned on observable attributes regarding the household size, total yearly income in 2014, length of residency, residence type, floor area, number of electrical appliances, house heating, house ownership and electricity price. Further, Table 7 shows the statistical tests to evaluate the matching of electricity bills and smart meters. The pseudo R2 of the estimated logit model for both electricity bills and smart meters is high before matching and low after matching, which demonstrates the control variables could well explain the probability of receiving information feedback. Similarly, the p-values of the likelihood ratio test for both electricity bills and smart meters are all insignificant after matching, indicating that no systematic differences remain in the distribution of control variables between the household receiving information feedback via electricity bills and smart meters and those without after matching. The joint significant effect of the control variables on households receiving both electricity bills and smart meters, as represented by the significant χ2, could not be rejected prior to matching but is rejected after matching in all the three matching methods. Finally, the mean and median bias are all below 20% as required after matching (Rosenbaum and Rubin, 1983), and are all even below stricter criterion of 10, indicating a very good match.
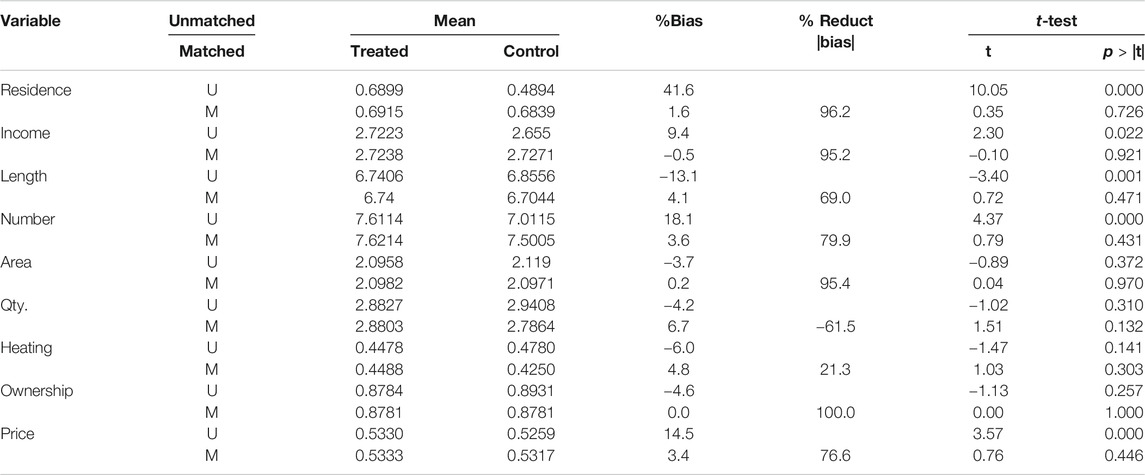
TABLE 5. Test of equality of means of each variable before and after matching for electricity bills.
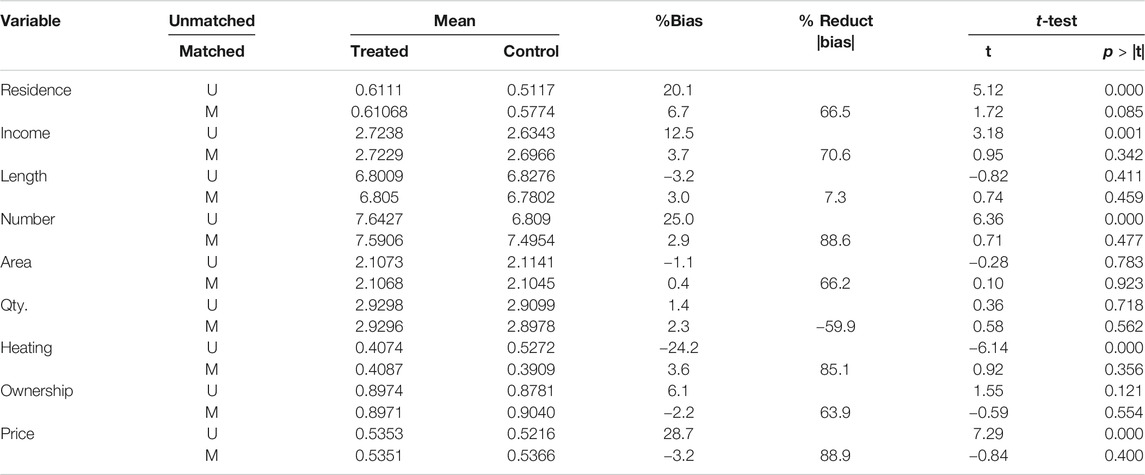
TABLE 6. Test of equality of means of each variable before and after matching for smart meters.
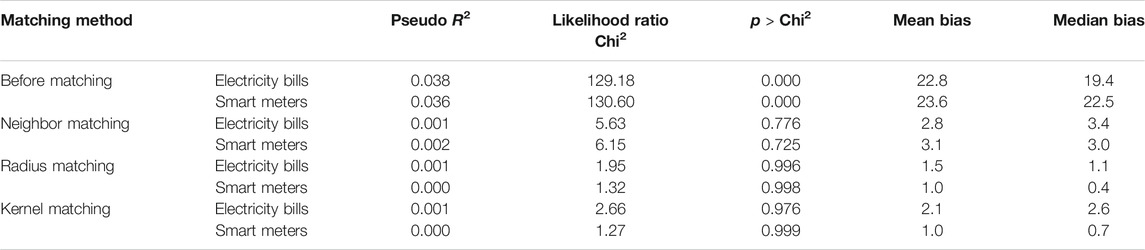
TABLE 7. Statistical tests to evaluate the matching.
Estimation Results of PSM
Several matching algorithms are offered to further estimate the effects of information feedback on electricity consumption for robustness check of the regression results, as shown in Table 8. This is the estimated results of the average treatment effects on treated (ATT) by the single and four nearest neighbor methods with caliper (0.01) along with the kernel estimator and bootstrapped standard errors based on 500 replications of the data. All those matching estimators have provided similar results.
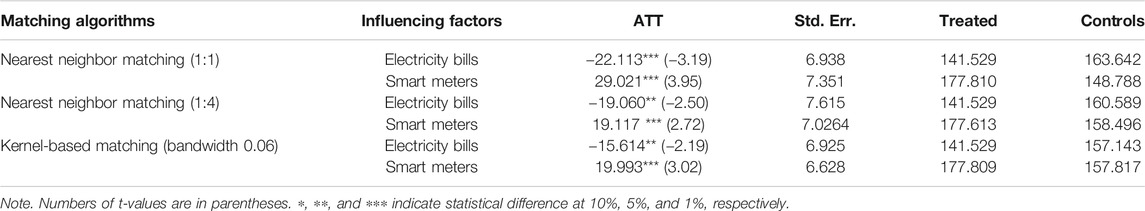
TABLE 8. Average treatment effects of different matching algorithms.
The study results of ATT show that electricity bills have significant influence on the reduction of electricity consumption for all matching algorithms. Households that receive electricity bills have their electricity consumption decreased between 15% and 23%. The significant effect of electricity bills on electricity consumption is in accordance with Vine et al. (2013) and Fischer (2008), who argued that information feedback could cut down consumption by up to 20%. The electricity bills provide the residents with receipts of printed bills, including electricity consumption quantity and expenditure. This kind of information feedback may inform households of their monthly consumption, so that they can compare it with historical records. However, the installation of smart meters increases electricity consumption. This is also in conformity with Nilsson et al. (2014) and Hargreaves et al. (2013) whose studies proved that the installation of smart meters did not necessarily reduce electricity consumption. A possible explanation is that the residents have limited access to electricity consumption information in spite of the installation of smart meters. In this survey, only 2% of the households’ smart meters are located inside the house and 16% of those households who have deployed smart meters do not know their electricity bills. Most smart meter screens in China only show the accumulated electricity consumption in kWh, so some households may not fully understand the meaning of the display. In addition, households have limited access to historical electricity consumption records via smart meters. By comparison, Zhang et al. (2016) showed that the in-home displays reduced monthly electricity consumption by around 9.1% in Shanghai City due to the fact that the study focused on real-time in-home displays, which could make households check bills online and compare history electricity usage and seek advices about potential energy saving. In this case, the residents are presented the electricity consumption data visually. Another reason why installation of smart meters increases electricity consumption smart is that the installation of smart meters is usually associated with high-income urban residents. Table 4 shows that the urban residents have higher potential to install smart meters. Those residents may have little motivation to conserve electricity because electricity expenditure only takes up a small proportion of their household income. Besides, a boomerang effect of smart meters will occur among the households whose electricity expenditure is relatively modest before the experiment (Matsukawa, 2018). Providing the households with smart meters would increase their electricity consumption by informing them of excessive electricity saving. Fischer (2008) also illustrated that the households with extremely low usage may increase their usage overall when provided with more information. Therefore, further studies are needed to investigate how smart meters could be wisely used to conserve electricity consumption.
Conclusions and Recommendations
The current paper has looked into the effects of information feedback on electricity consumption in the residential sector with the micro-level data from the Chinese General Social Survey (CGSS) by using a propensity score matching (PSM) method. The study shows that the feedback in the form of electricity bills proves effective in encouraging the residents to make efficient use of electricity, which is consistent with our hypothesis. This is because in the absence of feedback, the households lack information on their electricity consumption and are unaware of the potential for further electricity conservation (Tiefenbeck et al., 2018).
Providing feedback via electricity bills can inform the residents of actual electricity consumption and costs frequently enough to motivate them to control their own electricity consumption, thus resulting in adjustments and changes of households’ behavior and improving energy efficiency in the residential sector (Gans et al., 2013). Besides, historical information feedback serves as a self-comparison that can drive the residents by establishing personal norms (Promann and Brunswicker, 2017), which could lead to 10% reduction in electricity consumption (Wood and Newborough, 2007). Therefore, the households should be provided with the amount of electricity compared to a previous period or some pre-set standards. In addition, evidence has shown that peers’ or neighbors’ behavior significantly influences the residents’ behavior change and proves the effectiveness of social norms in response to information feedback (Allcott, 2011). Information feedback via social comparison can cut down energy consumption of private households, ranging from 1.2% to 30% (Andor and Fels, 2018). Those households, who receive both individual and comparative information feedback, are successful in curtailing energy consumption in both the short run and long run, especially when targeting high consumers of energy due to a higher energy-saving potential (McCalley and Midden, 2002).
Concerning frequency of electricity bills, Abrahamse et al. (2005) concludes that energy saving potential of feedback relies heavily on its frequency through the systematic analysis. Frequent information feedback has proven to be a successful policy intervention for promoting energy conservation. Therefore, the persistence of feedback should be taken into consideration when planning this type of intervention because the effects of feedback often disappear when it is removed (Ehrhardt-Martinezet al., 2010). Hence, from a policy perspective, the information provided to the households via electricity bills should include knowledge and tips regarding energy conservation, a comparison of usage history and energy consumption of neighbors, pro-environmental behaviors and their potential impact on the environment and climate change. Besides, the information feedback should be offered more frequently to remain the effects of feedback.
As for smart meters, our studies show that the installation of smart meters fails to exert positive effects on electricity conservation, which contradicts the hypothesis. The differences of the studies’ duration, sample size, country, methodologies applied among researches may make studies come to different conclusions. This finding is consistent with the results drawn by Hargreaves et al. (2013) and Khanna et al. (2016). The previous studies prove that the feedback via smart meters is closely associated with positive environmental attitudes and understanding of information that smart meters provide (Darby, 2006). However, a majority of the residents in China lack information about smart meters and thus cannot convert the information into action to conserve electricity. Therefore, the government and public utility should provide trustworthy advice and technical training to increase consumers’ understanding of smart meters to make the conservation possible.
Although the smart meters boast a relatively high penetration in China, making up more than 50% of the market, most resident users of those smart meters have limited access to the information as meters are installed outside the house. Smart meters for the households only perform functions of measuring usage data and fail to deliver adequate information to the residents (Du et al., 2017). Thus, smart meters limit the capability to inform the residents as it relies on the residents’ self-initiation with low residents’ engagement in energy conservation. Therefore, from a policy perspective, smart meters should bring all this information onto residents’ computers and mobile phones inside home in a form that is accessible, clear and easy to understand, facilitating the residents to curb their electricity consumption. Besides, as learning plays a prominent role in enhancing energy conservation in the residential sector (Lynham et al., 2016), the policy-makers should provide training and educational outreach programs about the usage of smart meters. With the help of additional training and education, smart meters help the households to access to the information about usage in real time and keep informed of the use of specific appliances where they can conserve electricity most effectively. Provision of appliance-specific feedback by using smart meters keeps the households better informed of the potential ways through which they could reduce electricity consumption, in particular, from high energy-use electrical devices. Overall, instantaneous direct feedback via smart meters and frequent, accurate electricity billing are needed as a basis for sustained electricity demand conservation, which provides the guidance for future policy formation.
Data Availability Statement
The raw data supporting the conclusions of this article will be made available by the authors, without undue reservation.
Author Contributions
All authors have made a substantial, direct and intellectual contribution to this article and approved it for publication.
Conflict of Interest
The authors declare that the research was conducted in the absence of any commercial or financial relationships that could be construed as a potential conflict of interest.
References
Abrahamse, W., Steg, L., Vlek, C., and Rothengatter, T. (2005). A review of intervention studies aimed at household energy conservation. J. Environ. Psychol. 25 (3), 273–291. doi:10.1016/j.jenvp.2005.08.002
Allcott, H. (2011). Social norms and energy conservation. J. Publ. Econ. 95 (9–10), 1082–1095. doi:10.1016/j.jpubeco.2011.03.003
Andor, M. A., and Fels, K. M. (2018). Behavioral economics and energy conservation–a systematic review of non-price interventions and their causal effects. Ecol. Econ. 148, 178–210. doi:10.1016/j.ecolecon.2018.01.018
Andor, M. A., Gerster, A., Peters, J., and Schmidt, C. M. (2020). Social norms and energy conservation beyond the United States. J. Environ. Econ. Manag. 103, 102351. doi:10.1016/j.jeem.2020.102351
Aydin, E., Brounen, D., and Kok, N. (2018). Information provision and energy consumption: evidence from a field experiment. Energy Econ. 71, 403–410. doi:10.1016/j.eneco.2018.03.008
Bao, H. X., and Li, S. H. (2020). Housing wealth and residential energy consumption. Energy Pol. 143, 111581. doi:10.1016/j.enpol.2020.111581
Bernedo, M., Ferraro, P. J., and Price, M. (2014). The persistent impacts of norm-based messaging and their implications for water conservation. J. Consum. Pol. 37 (3), 437–452. doi:10.1007/s10603-014-9266-0
Blasch, J. E., Filippini, M., Boogen, N., and Kumar, N. (2017). Explaining electricity demand and the role of energy and investment literacy on end-use efficiency of Swiss households. Energy Econ. 68, 89–102. doi:10.1016/j.eneco.2017.12.004
Blázquez, L., Boogen, N., and Filippini, M. (2013). Residential electricity demand in Spain: new empirical evidence using aggregate data. Energy Econ. 36, 648–657. doi:10.1016/j.eneco.2012.11.010
Brounen, D., Kok, N., and Quigley, J. M. (2013). Energy literacy, awareness, and conservation behavior of residential households. Energy Econ. 38, 42–50. doi:10.1016/j.eneco.2013.02.008
Bushnell, J. B., and Mansur, E. T. (2005). Consumption under noisy price signals: a study of electricity retail rate deregulation in San Diego. J. Ind. Econ. 53 (4), 493–513. doi:10.1111/j.1467-6451.2005.00267.x
Carroll, J., Lyons, S., and Denny, E. (2014). Reducing household electricity demand through smart metering: the role of improved information about energy saving. Energy Econ. 45, 234–243. doi:10.1016/j.eneco.2014.07.007
Chopra, A. (2011). Modeling a green energy challenge after a blue button. White House Office of Science and Technology Policy. Available at: http://www.whitehouse.gov/blog/2011/09/15/modeling-green-energychallenge-after-blue-button (Accessed September 27, 2020).
Darby, S. (2006). The effectiveness of feedback on energy consumption: a Review for DEFRA of the literature on metering, billing and direct displays (Oxford, UK: Environmental Change Institute). Available at: http://www.eci.ox.ac.uk/research/energy/downloads/smart meteringreport.pdf (Accessed September 30, 2020).
Davis, L. W., and Metcalf, G. E. (2016). Does better information lead to better choices? Evidence from energy-efficiency labels. J. Assoc. Environ Reso. 3 (3), 589–625. doi:10.1086/686252
Delmas, M. A., Fischlein, M., and Asensio, O. I. (2013). Information strategies and energy conservation behavior: a meta-analysis of experimental studies from 1975 to 2012. Energy Pol. 61, 729–739. doi:10.1016/j.enpol.2013.05.109
Du, L., Guo, J., and Wei, C. (2017). Impact of information feedback on residential electricity demand in China. Resour. Conserv. Recycl. 125, 324–334. doi:10.1016/j.resconrec.2017.07.004
Ehrhardt-Martinez, K., Donnelly, K. A., and Laitner, S. (2010). Advanced metering initiatives and residential feedback programs: a meta-review for household electricity-saving opportunities (Washington, DC: American Council for an Energy-Efficient EconomyAvailable at: http://aceee.org/research-report/e105 (Accessed October 11, 2020).
EUR (2006). Directive 2006/32/EC of the European Parliament and of the Council of 5 April 2006 on energy end-use efficiency and energy services and repealing Council Directive 93/76/EEC. Available at: http://eurlex.europa.eu/LexUriServ/site/en/oj/2006/l_114/l_11420060427en00640085.pdf(Accessed September 20, 2020).
Fan, J. L., Chen, K. Y., and Zhang, X. (2020). Inequality of household energy and water consumption in China: an input-output analysis. J. Environ. Manag. 269, 110716. doi:10.1016/j.jenvman.2020.110716
Fischer, C. (2008). Feedback on household electricity consumption: a tool for saving energy?. Energy Effic. 1 (1), 79–104. doi:10.1007/s12053-008-9009-7
Gans, W., Alberini, A., and Longo, A. (2013). Smart meter devices and the effect of feedback on residential electricity consumption: evidence from a natural experiment in Northern Ireland. Energy Econ. 36 (3), 729–743. doi:10.1016/j.eneco.2012.11.022
Gilbert, B., and Zivin, J. G. (2014). Dynamic salience with intermittent billing: evidence from smart electricity meters. J. Econ. Behav. Organ. 107, 176–190. doi:10.1016/j.jebo.2014.03.011
Gleerup, M., Larsen, A., Leth-Petersen, S., and Togeby, M. (2010). The effect of feedback by text message (SMS) and email on household electricity consumption: experimental evidence. Energy J. 31 (3), 113–132. doi:10.5547/ISSN0195-6574-EJ-Vol31-No3-6
Hamilton, I. G., Steadman, P. J., Bruhns, H., Summerfield, A. J., and Lowe, R. (2013). Energy efficiency in the British housing stock: energy demand and the Homes Energy Efficiency Database. Energy Pol. 60, 462–480. doi:10.1016/j.enpol.2013.04.004
Hargreaves, T., Nye, M., and Burgess, J. (2013). Keeping energy visible? Exploring how householders interact with feedback from smart energy monitors in the longer term. Energy Pol. 52, 126–134. doi:10.1016/j.enpol.2012.03.027
Henryson, J., Håkansson, T., and Pyrko, J. (2000). Energy efficiency in buildings through information–Swedish perspective. Energy Pol. 28 (3), 169–180. doi:10.1016/S0301-4215(00)00004-5
Huang, W. H. (2015). The determinants of household electricity consumption in Taiwan: evidence from quantile regression. Energy 87, 120–133. doi:10.1016/j.energy.2015.04.101
Huebner, G., Shipworth, D., Hamilton, I., Chalabi, Z., and Oreszczyn, T. (2016). Understanding electricity consumption: a comparative contribution of building factors, socio-demographics, appliances, behaviours and attitudes. Appl. Energy 177, 692–702. doi:10.1016/j.apenergy.2016.04.075
Ito, K. (2014). Do consumers respond to marginal or average price? Evidence from nonlinear electricity pricing. Am. Econ. Rev. 104 (2), 537–563. doi:10.1257/aer.104.2.537
Karatasou, S., and Santamouris, M. (2019). Socio-economic status and residential energy consumption: a latent variable approach. Energy Build. 198, 100–105. doi:10.1016/j.enbuild.2019.06.013
Karlin, B., Zinger, J. F., and Ford, R. (2015). The effects of feedback on energy conservation: a meta-analysis. Psychol. Bull. 141 (6), 1205–1227. doi:10.1037/a0039650
Khanna, N. Z., Guo, J., and Zheng, X. (2016). Effects of demand side management on Chinese household electricity consumption: empirical findings from Chinese household survey. Energy Pol. 95, 113–125. doi:10.1016/j.enpol.2016.04.049
Levitt, S. D., and List, J. A. (2009). Field experiments in economics: the past, the present, and the future. Eur. Econ. Rev. 53 (3), 1–18. doi:10.1016/j.euroecorev.2008.12.001
Li, J., Zhang, J., Zhang, D., and Ji, Q. (2019). Does gender inequality affect household green consumption behaviour in China?. Energy Pol. 135, 111071. doi:10.1016/j.enpol.2019.111071
Lynham, J., Nitta, K., Saijo, T., and Tarui, N. (2016). Why does real-time information reduce energy consumption?. Energy Econ. 54, 173–181. doi:10.1016/j.eneco.2015.11.007
Matsukawa, I. (2018). Information acquisition and residential electricity consumption: evidence from a field experiment. Resour. Energy Econ. 53, 1–19. doi:10.1016/j.reseneeco.2018.02.001
McCalley, L. T., and Midden, C. J. (2002). Energy conservation through product-integrated feedback: the roles of goal-setting and social orientation. J. Econ. Psychol. 23 (5), 589–603. doi:10.1016/S0167-4870(02)00119-8
Mi, L., Qiao, L., Du, S., Xu, T., Gan, X., Wang, W., et al. (2020). Evaluating the effect of eight customized information strategies on urban households’ electricity saving: a field experiment in China. Sust. Cities Soc. 62, 102344. doi:10.1016/j.scs.2020.102344
National Bureau of Statistics of China (2015). China statistical yearbook 2019. Available at http://www.stats.gov.cn/tjsj/ndsj/2015/indexch.htm (Accessed October 10, 2020).
National Bureau of Statistics of China (2019). China statistical yearbook 2019. Available at http://www.stats.gov.cn/tjsj/ndsj/2019/indexch.htm (Accessed September 10, 2020).
Ndiaye, D., and Gabriel, K. (2011). Principal component analysis of the electricity consumption in residential dwellings. Energy Build. 43 (2–3), 446–453. doi:10.1016/j.enbuild.2010.10.008
Neenan, B., Robinson, J., and Boisvert, R. N. (2009). Residential electricity use feedback: a research synthesis and economic framework. Palo Alto, CA: Electric Power Research Institute.
Nemati, M., and Penn, J. (2020). The impact of information-based interventions on conservation behavior: a meta-analysis. Resour. Energy Econ. 62, 101201. doi:10.1016/j.reseneeco.2020.101201
Nilsson, A., Bergstad, C. J., Thuvander, L., Andersson, D., Andersson, K., and Meiling, P. (2014). Effects of continuous feedback on households’ electricity consumption: potentials and barriers. Appl. Energy 122, 17–23. doi:10.1016/j.apenergy.2014.01.060
Oltra, C., Boso, A., Espluga, J., and Prades, A. (2013). A qualitative study of users’ engagement with real-time feedback from in-house energy consumption displays. Energy Pol. 61, 788–792. doi:10.1016/j.enpol.2013.06.127
Pon, S. (2017). The effect of information on TOU electricity use: an Irish residential study. Energy J. 38 (6), 55–79. doi:10.5547/01956574.38.6.spon
Promann, M., and Brunswicker, S. (2017). “Affordances of eco-feedback design in home energy context,” in Proceedings of 33rd American Conference Information Systems, 2017 August, Boston, MA Vol. 23, 1–10. Available at: https://aisel.aisnet.org/amcis2017/GreenIS/Presentations/7/ (Accessed October 15, 2020)
Qi, W., and Li, G. (2020). Residential carbon emission embedded in China's inter-provincial population migration. Energy Pol. 136, 111065. doi:10.1016/j.enpol.2019.111065
Ratner, R. K., Soman, D., Zauberman, G., Ariely, D., Carmon, Z., Keller, P. A., et al. (2008). How behavioral decision research can enhance consumer welfare: from freedom of choice to paternalistic intervention. Market. Lett. 19 (3–4), 383. doi:10.1007/s11002-008-9044-3
Restrepo, J. D. C., and Morales-Pinzón, T. (2020). Effects of feedback information on the household consumption of water and electricity: a case study in Colombia. J. Environ. Manag. 262, 110315. doi:10.1016/j.jenvman.2020.110315
Romero-Jordan, D., Penasco, C., and Rio, P. D. (2014). Analysing the determinants of household electricity demand in Spain. an econometric study. Int. J. Electr. Power Energy Syst. 63, 950–961. doi:10.1016/j.ijepes.2014.06.005
Rosenbaum, P. R., and Rubin, D. B. (1983). The central role of the propensity score in observational studies for causal effects. Biometrika 70 (1), 41–55. doi:10.1093/biomet/70.1.41
Santamouris, M., Kapsis, K., Korres, D., Livada, I., Pavlou, C., and Assimakopoulos, M. N. (2007). On the relation between the energy and social characteristics of the residential sector. Energy Build. 39 (8), 893–905. doi:10.1016/j.enbuild.2006.11.001
Schleich, J., Faure, C., and Klobasa, M. (2017). Persistence of the effects of providing feedback alongside smart metering devices on household electricity demand. Energy Pol. 107, 225–233. doi:10.1016/j.enpol.2017.05.002
Tiefenbeck, V., Goette, L., Degen, K., Tasic, V., Fleisch, E., Lalive, R., et al. (2018). Overcoming salience bias: how real-time feedback fosters resource conservation. Manag. Sci. 64 (3), 1458–1476. doi:10.1287/mnsc.2016.2646
Vine, D., Buys, L., and Morris, P. (2013). The effectiveness of energy feedback for conservation and peak demand: a literature review. Open J. Energy Effic. 2 (1), 7–15. doi:10.4236/ojee.2013.21002
White, H. (1980). A heteroskedasticity-consistent covariance matrix estimator and a direct test for heteroskedasticity. Econometrica 48 (4), 817–838. doi:10.2307/1912934
Wood, G., and Newborough, M. (2007). Energy-use information transfer for intelligent homes: enabling energy conservation with central and local displays. Energy Build. 39, 495–503. doi:10.1016/j.enbuild.2006.06.009
Xie, L., Yan, H., Zhang, S., and Wei, C. (2020). Does urbanization increase residential energy use? Evidence from the Chinese residential energy consumption survey 2012. China Econ. Rev. 59, 101374. doi:10.1016/j.chieco.2019.101374
Xu, X., Xiao, B., and Li, C. Z. (2020). Critical factors of electricity consumption in residential buildings: an analysis from the point of occupant characteristics view. J. Clean. Prod. 256, 120423. doi:10.1016/j.jclepro.2020.120423
Yang, Y., Liu, J., Lin, Y., and Li, Q. (2019). The impact of urbanization on China’s residential energy consumption. Struct. Change Econ. Dynam. 49, 170–182. doi:10.1016/j.strueco.2018.09.002
Zhang, H., Shi, X., Cheong, T. S., and Wang, K. (2020). Convergence of carbon emissions at the household level in China: a distribution dynamics approach. Energy Econ. 92, 104956. doi:10.1016/j.eneco.2020.104956
Zhang, M., Cheng, C. H., and Ma, H. Y. (2020). Projection of residential and commercial electricity consumption under SSPs in Jiangsu province, China. Adv. Clim. Change Res. 11 (2), 131–140. doi:10.1016/j.accre.2020.06.005
Keywords: residential sector, information feedback, energy conservation, propensity score matching, electricity bills, smart meters
Citation: Li Z and Cao X (2021) Analysis of Information Feedback on Residential Energy Conservation and the Implications: The Case of China. Front. Environ. Sci. 9:626890. doi: 10.3389/fenvs.2021.626890
Received: 07 November 2020; Accepted: 11 January 2021;
Published: 12 February 2021.
Edited by:
Xunpeng Shi, University of Technology Sydney, AustraliaReviewed by:
Keying Wang, Hubei University Of Economics, ChinaYu Hao, Beijing Institute of Technology, China
Copyright © 2021 Li and Cao.. This is an open-access article distributed under the terms of the Creative Commons Attribution License (CC BY). The use, distribution or reproduction in other forums is permitted, provided the original author(s) and the copyright owner(s) are credited and that the original publication in this journal is cited, in accordance with accepted academic practice. No use, distribution or reproduction is permitted which does not comply with these terms.
*Correspondence: Xia Cao, Y2FveGlhXzUwMkAxNjMuY29t