 Junfei Xie
 Shengwei Shi2
 Lingyun Wu
94% of researchers rate our articles as excellent or good
Learn more about the work of our research integrity team to safeguard the quality of each article we publish.
Find out more
ORIGINAL RESEARCH article
Front. Environ. Sci., 11 May 2021
Sec. Atmospheric Science
Volume 9 - 2021 | https://doi.org/10.3389/fenvs.2021.593220
In this study, we investigated the spatiotemporal changes of near-surface O3 concentration based on 33 automatic air quality monitoring stations in Beijing in 2015 and 2018. Here we show that the diurnal variations for O3 concentration at 33 monitoring stations exhibited a single-peak mode with a minimum concentration from 06:00 to 07:00 and a maximum value from 14:00 to 15:00. We find that the O3 concentration was significantly positively correlated with the air temperature, solar total radiation, and wind speed, while it was negatively correlated with the relative humidity. Among those factors, the air temperature played the most important role in influencing O3 concentration (relative contribution is greater than 88% in the boosted regression trees model). We also present that the annual variation of O3 concentration at all stations tended to be a “bell-shaped” curve distribution with a peak in summer and the lowest value in winter. The annual averaged O3 concentration at 33 stations in Beijing was 57.5 ± 9.8 μg⋅m−3 in 2015 and 60.3 ± 9.0 μg⋅m−3 in 2018. In addition, we detect that the annual averaged value of the O3 concentration was lower in the central and southern Beijing, and higher in the northern Beijing both in 2015 and 2018. The spatial difference of the O3 concentration could be explained by the traffic pollution, vegetation coverage, atmospheric regional transmission, and atmospheric particulate matter concentration.
Although the stratospheric ozone (O3) layer can absorb ultraviolet light and protect the Earth's biosphere, the O3 in the troposphere, especially near the ground, is an air pollutant. As a strong oxidizing gas, O3 can rapidly and heterogeneously react with organic matter in biological systems (Lehman et al., 2004; Wang et al., 2015). High O3 concentrations can affect human health Kong et al. (1999), Raddatz and Cummie (2001), Wang et al. (2017), cause damage to plant leaves, and trigger the synthetic release of plant volatile organic compounds (VOCs) (Velikova et al., 2005; Calfapietra et al., 2008; Loreto and Schnitzler, 2010; Yuan et al., 2017).
Ozone is a secondary pollutant, therefore, its formation is complex. The precursor of ozone formation is a key factor. Investigations show that volatile organic compounds (VOCs) and nitrogen oxides are the key precursors (Zaveri et al., 2003; Wang et al., 2019). The chemical processes of ozone generated by nitrogen oxides and VOCs can be described by following equations (Sillman and He, 2002; Khalil, 2018).
Previous studies have shown that O3 in the atmosphere is mainly produced by the photochemical processes of precursors such as nitrogen oxides (NOx), carbon monoxide (CO), and VOCs that are emitted by humans and nature, and the O3 formation process is also accompanied by the production of many oxidants such as peroxyacetyl nitrate (PAN) (Berntsen et al., 1996; An, 2017). In addition to a direct relationship with the precursor emissions, the O3 concentration in the atmosphere is closely related to meteorological conditions such as atmospheric temperature, solar radiation, wind direction and speed, and atmospheric stratification stability (Lin et al., 2008). Air temperature and solar radiation affect the photochemical reaction intensity and the wind direction and speed; atmospheric stratification stability affects transmission and diffusion (Huang et al., 2019). It should be noted that the source of the precursors is very complicated. For example, NOx mainly comes from motor vehicle exhaust and the combustion process of coal and power plant oil; the VOCs come from sources such as petrochemical production, painting, and cooking and natural emissions from vegetation (Hata and Tonokura, 2019). Therefore, it is very difficult to control O3. Although the O3 concentration is largely determined by locally emitted O3 precursors, the O3 has a few weeks of life in the troposphere once it is generated, and will be transmitted over long distances. Therefore, atmospheric O3 pollution has become a worldwide challenge.
With the rapid development of the economy and urbanization, human activities emit a large amount of NOx, CO, and nonmethane hydrocarbons into the atmosphere, consequently these pollutants produce high O3 concentrations under suitable meteorological conditions (Wang et al., 2014).
Investigations present that O3 concentration shows an increasing trend during the past decades and will continuously increase in future in eastern China (Ma et al., 2016; Sun et al., 2016; Wang et al., 2020). The China Environmental Status Bulletin has announced that the high concentrations of near-surface atmospheric O3 are the primary air pollutant in China’s “Beijing-Tianjin-Hebei”, “Yangtze River Delta”, and “Pearl River Delta” regions during the summer since 2015. Beijing is the megacity, with over ten million people, and has exhibited rapid economic development. By the end of 2018, the city’s permanent population has exceeded 20 million, and the number of motor vehicles has kept steadily increasing was with approximately 6 million. The dense population and high number of motor vehicles have contributed to very poor air quality in Beijing. As a result, the near-surface atmospheric O3 concentrations and the number of days exceeding the standard have shown a significant upward trend in the past three years (Cheng et al., 2017; Zhang and Zhang, 2019). Therefore, factors of influencing O3 formation and spatiotemporal distribution of O3 concentration need to be better understood to take measures for O3 control (Cheng et al., 2018; Yang et al., 2020; Zhao et al., 2020).
However, the spatiotemporal dynamics and influencing factors of near-surface O3 concentration in Beijing are not clear. In this study, we use hourly O3 data at 33 air quality automatic monitoring stations in Beijing in 2015 and 2018 to systematically explore the spatiotemporal characteristics of near-surface O3 concentrations, and the role of the environment factors including vegetation in influencing O3 concentration. The results will provide data support and direction for relevant environmental governance.
The near-surface hourly O3 concentration data in 2015 and 2018 were from the Beijing Environmental Protection Monitoring Center (http://www.bjmemc.com.cn/). They were observed by thermo fisher 49C ultraviolet photometers, which were installed at 33 ground air quality monitoring stations (Wang et al., 2014). According to the environmental protection standards of the People's Republic of China (HJ664–2013): Technical Regulation for Selection of Ambient Air Quality Monitoring Stations (Trial), each air quality monitoring station has a typical area radius of 500–4 km. There are no tall buildings, trees, or other obstacles around the monitoring equipment sampling port that could impede air circulation. Also, there should be no obvious fixed sources of pollution within at least 50 m (Supplementary Table S1 in Supplementary Material).
According to the different monitoring functions, the 33 stations can be divided into urban environmental assessment points (A1-A11), suburban environmental assessment points (B1-B11), background control point (C1), regional transmission monitor points (D1-D6), and traffic pollution monitor points (E1-E4).
The 33 stations are located in the urban districts (Dongcheng, Xicheng, Chaoyang, Haidian, Fengtai, and Shijingshan), northwestern districts (Changping and Yanqing), northeastern districts (Huairou, Miyun, Pinggu, and Shunyi), southeastern district (Tongzhou, Daxing, and Yizhuang), and southwestern districts (Fangshan and Mentougou), which cover all the urban and suburb districts in Beijing (Figure 1).
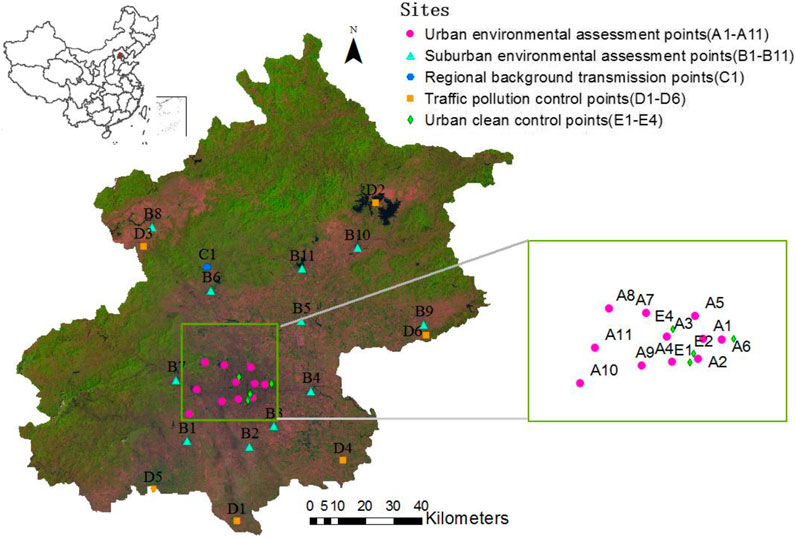
FIGURE 1. Location of the 33 monitoring stations in Beijing.
Meteorological data from the DYNAMET scientific-grade automatic weather station near the Siyuan Bridge in Beijing was selected to analyze 2015 diurnal variations in air temperature, wind speed, relative humidity, and solar total radiation. Other meteorological data used came from the automatic weather station of the Beijing Meteorological Bureau. The weather observations were carried out according to national standards of the People’s Republic of China (GB/T 35,221–2017): Specifications for surface meteorological observation–general, and the precision of air temperature, relative humidity, wind speed is 0.1°C, 1%, 0.1 m/s, respectively.
Prior to use of the data, an adjacent interpolation filling was performed for the individual missing data caused by equipment failure, when there are less than or equal to three consecutive missing measurement data, they are filled by arithmetical sequence, while other cases are filled by the averaged value of three adjacent stations at the same time.
The diurnal near-surface O3 concentration variations at 33 stations have a similar pattern, therefore, for brevity we just take C1 station as an example to describe it. Figure 2A,B show that the diurnal curve for each month has a similar pattern in 2015, that is, near-surface O3 concentration was lowest at 06:00 to 07:00, then rose rapidly to the maximum value at 14:00 to 15:00, after that it declined until the next morning. Figure 2C,D show that the diurnal variation for each season is consistent with the other researches Wang et al. (2014), Cheng et al. (2016), and its main influencing factors may be related to air temperature and solar radiation.
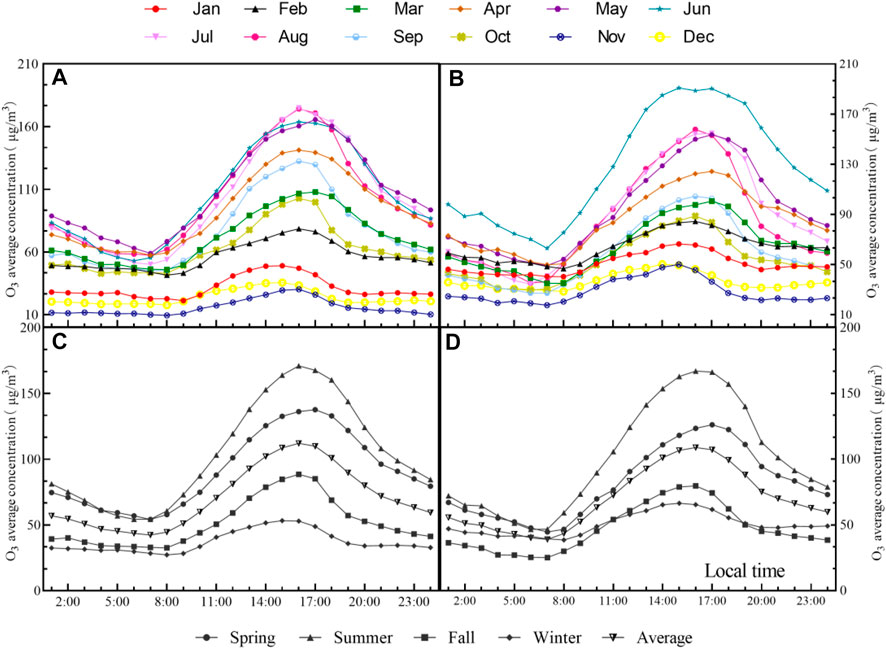
FIGURE 2. Diurnal variation of O3 concentrations at Dingling Station: diurnal variation in months (A, B); diurnal variation in seasons (C, D) in 2015.
By comparing Figure 2; Figure 3, we found that the diurnal variations of near-surface O3 concentration are similar to those of surface air temperature, wind speed, and solar total radiation. We selected July in C1 station as an example to analyze their relationships. According to Spearman correlation analysis, the correlation coefficients of the O3 concentration with temperature, solar total radiation, and wind speed were 0.925, 0.629, and 0.932, respectively, with a significant positive correlation (P < 0.01). On the other hand, the O3 concentration has a negative correlation with relative humidity with the correlation coefficient of −0.977. The results are substantially consistent with the conclusions of the other studies (Xu and Zhu, 1994; An, 2017). The negative correlation may come from the following reasons. Firstly, when the relative humidity increases, it is often accompanied by an increase in cloudiness, which is detrimental to O3 generation and results in a decrease in the O3 concentration (Zhao et al., 2019). Secondly, related studies on chemical mechanisms suggest that in heavily polluted urban areas, the increase in water vapor drives the conversion of NO2 to nitric acid because of the large amount of O3 precursors, thereby inhibiting the formation of O3 (Camalier et al., 2007; Jacob and Winner, 2009).
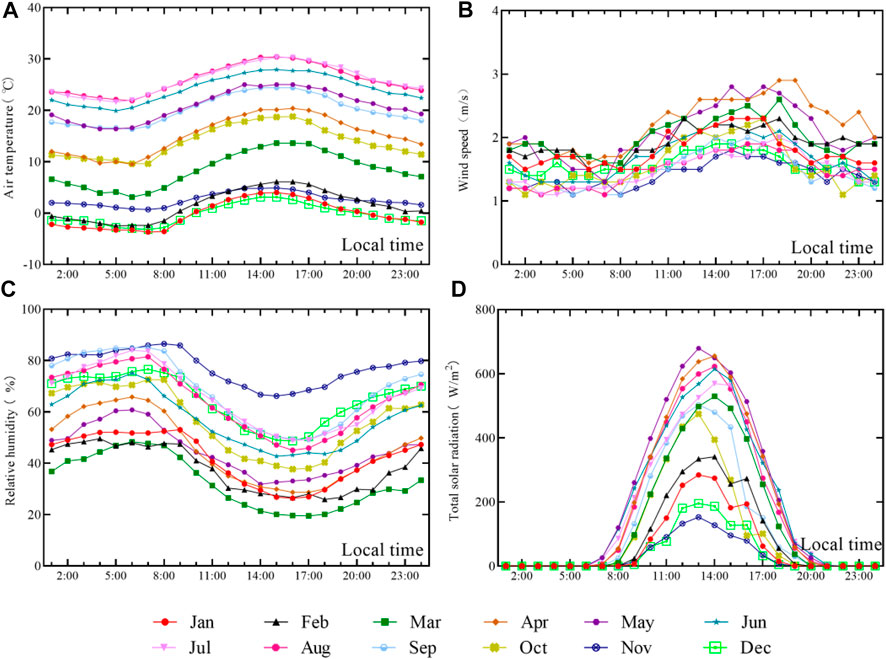
FIGURE 3. Diurnal variations in (A) air temperature, (B) wind speed, (C) relative humidity, and (D) solar total radiation near the Siyuan Bridge in Beijing in 2015.
Based wind direction frequency rose map (Figure 4) for five meteorological stations (located in the northern, southern, eastern, southwestern and central regions of Beijing, respectively), there are differences in the dominant wind directions of the five meteorological stations in 2015, about northern in Beijing, the dominating wind direction is NW, and southern is SW, atmospheric O3 from other cities transport is not easy to diffuse.
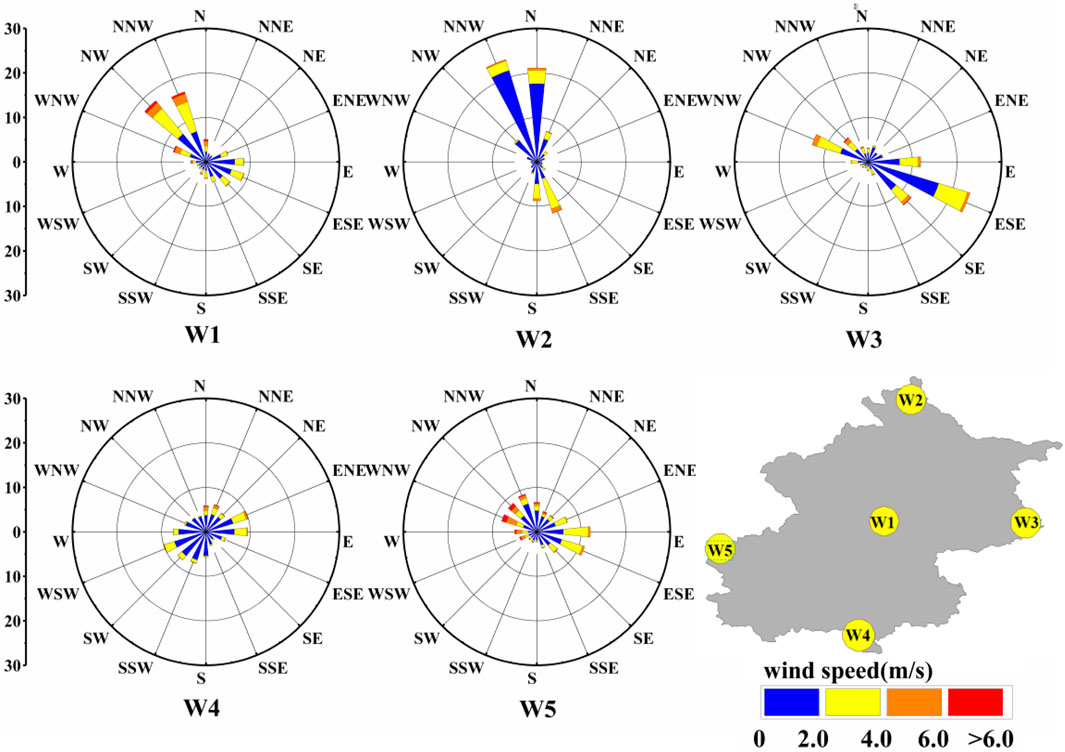
FIGURE 4. Wind rose showing direction and speed of 5 weather stations in 2015.
Furthermore, boosted regression trees (BRT) model was used to analyze the relative contribution and marginal effects of independent variables on dependent variables. In this study, the atmospheric O3 concentration in 2015 at the Olympic Center station were randomly selected as the dependent variable, and the air temperature, wind speed, solar total radiation and relative humidity obtained from neighboring weather stations were used as independent variables.
The BRT model was developed using the R software with the packages “gbm” (Ridgeway, 2015) and “brt.functions.R” (Elith et al., 2008). The BRT model was fitted with the following parameters: a learning rate of 0.005, a bag fraction of 0.5, a tree complexity of 5, and fivefold cross-validation.
The result indicated that the correlation of the training data was 0.82. Among the four meteorological factors affecting the O3 concentration, air temperature play a dominant role in influencing the O3 concentration (the relative contribution is more than 88%). On the other hand, the relative contributions of wind speed, solar total radiation and relative humidity are 8.5, 3.3, and 0.1%, respectively.
The marginal effects of the four factors (air temperature, wind speed, solar total radiation and relative humidity) on the O3 concentration were further analyzed, the marginal effect was calculated by holding all the other variables at their averaged values, as the air temperature increases, the O3 concentration shows a significant increasing trend (Figure 5).
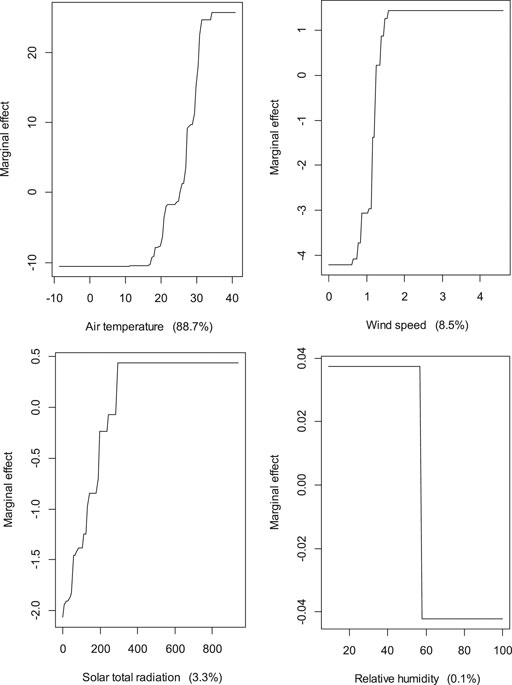
FIGURE 5. Marginal effects of the four factors on the O3 concentration.
As shown in Figure 6, the monthly averaged characteristics of O3 concentration at the 33 monitoring stations were mostly similar, showing a distinct “bell-shaped” unimodal distribution. The highest value generally appeared in the summer from June to August, and the lowest value generally occurred in January during the winter. The highest monthly averaged O3 concentration observed in Beijing in 2015 exceeded 130.0 μg·m−3; while the lowest value was less than 20.0 μg·m−3. The annual variations of O3 concentration in 2018 had very similar characteristics to those in 2015 but with larger values.
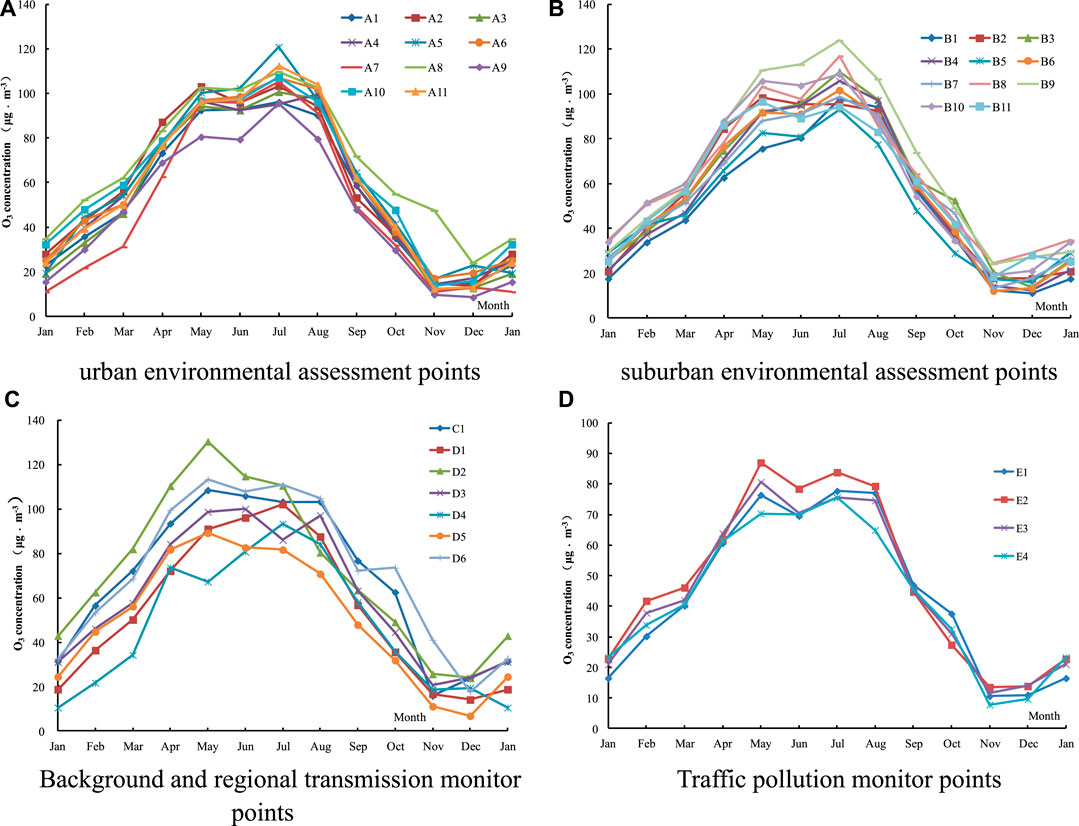
FIGURE 6. Monthly averaged O3 concentrations at (A) urban environmental assessment points, (B) suburban environmental assessment points, (C) background and regional transmission monitor points, and (D) traffic pollution monitor points in 2015.
There are three main reasons for the seasonal variation in atmospheric O3 concentration: first, the large temperature difference between the winter and summer in Beijing leads to seasonal differences in O3 concentration because of the good positive correlation between the O3 concentration and the near-surface atmosphere temperature. On the other hand, winter, the haze-prone period, has a higher concentration of particulate matter, which leads to an increase in the erosol optical thickness, weak photochemical reactions, and a decrease in the O3 concentration, and the heterogeneous chemical reaction of particulate matter in winter also causes O3 consumption (Deng et al., 2011). In addition, it may be related to vegetation. By comparing A4 station (located in urban park, which has vegetation cover area of 4.5 ha) and E1 station (located in road, which is adjacent to A4 station), due to the relatively large volatile organic compounds emissions of plants, which indirectly promotes the O3 formation, the annual averaged O3 concentration at A4 station in 2015 and 2018 was 28 and 16% higher than E1 station, respectively, (Figure 7).
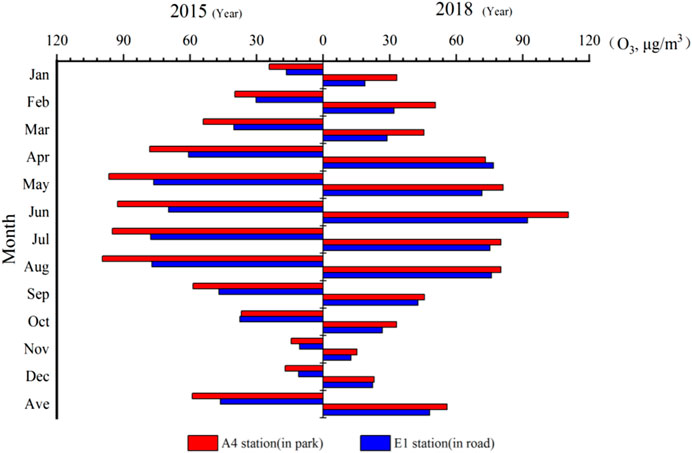
FIGURE 7. Comparison of O3 concentrations between A4 and E1 station.
As shown in Figure 8, the averaged O3 concentrations at the traffic pollution control points for all months were significantly lower than that of the other four types. we determined the 2015 averaged O3 concentration, in order from highest to lowest, of the background control point (71.2 μg m−3), regional transmission monitor point (61.9 μg m−3), suburban environmental assessment point (60.0 μg m−3), urban environmental assessment point (59.4 μg m−3), and traffic pollution monitor point (47.1 μg m−3); the same size sequence was also presented in 2018, and other studies have similar phenomena (Zhang et al., 2014). This is primarily related to the high NO concentration of vehicle exhaust emissions near the traffic pollution control points. Relevant research indicates that there is a photostable relationship among O3, NO, and NO2 (An, 2017); the NO concentration is high, which is not conducive to O3 formation in the atmosphere, and continues to “titrate” and consume atmospheric O3 through the reaction (Lin et al., 2007; Cheng et al., 2016).
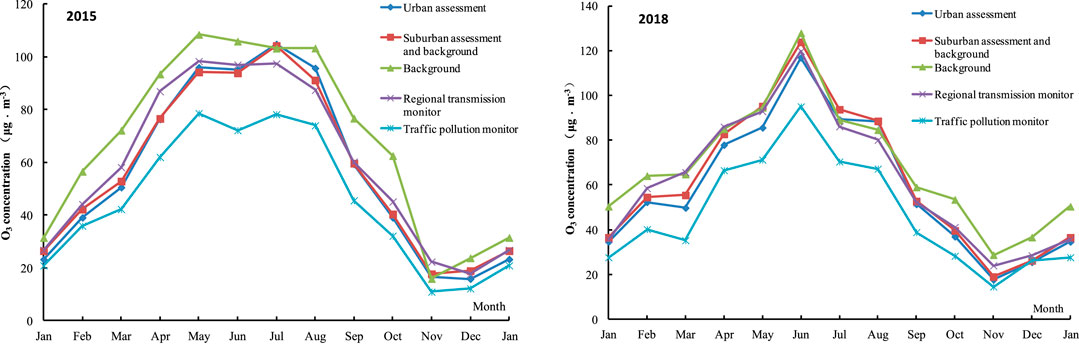
FIGURE 8. Monthly averaged O3 concentrations for the different types in 2015 and 2018.
The annual averaged O3 concentration (value ±standard deviation) in Beijing was 58.9 ± 7.9 μg·m−3 in 2015 (Supplementary Table S2 in Supplemental Materials). Tang et al. (2009) studied the O3 concentration characteristics in Beijing from 2001 to 2006, and found that the averaged O3 concentration during the six years in Beijing was 53.2 ± 11.8 μg·m−3. Among the 33 monitoring stations, the lowest annual averaged O3 concentration appeared at the E4 Station (44.7 μg·m−3, which is a traffic pollution monitor point) in the central city of Beijing. The highest annual averaged O3 concentration appeared at the D2 station (74.7 μg·m−3, which is a regional transmission monitor point) located in northeastern Beijing.
Figure 9 shows that the annual averaged O3 concentrations at most of the monitoring stations in 2018 were larger than those in 2015. Consequently, the averaged value for 33 stations was 61.2 ± 8.2 μg·m−3 in 2018, which was higher than that in 2015. The lowest averaged O3 concentration in 2018 appeared at the E3 station (42.4 μg·m−3), which is also a traffic pollution monitor point, while the highest value still appeared at the D2 (85.5 μg·m−3).
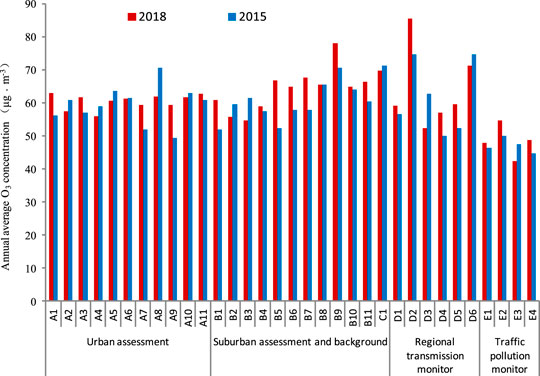
FIGURE 9. Comparisons of annual averaged O3 concentration at 33 stations between 2015 and 2018.
The reason that the lower annual averaged O3 concentration appeared at traffic pollution monitor point both in 2015 and 2018 is likely related to the high NO concentration from the vehicles emission near the traffic station.
The occurrence of the highest value at D2 station may be caused by following reasons: first, the vegetation coverage rate of the D2 is high, and the VOCs emitted by the plants are favorable for the generation of O3. Second, the atmospheric regional transmission and the unique terrain of Beijing affect the values, and the local wind is prevalent in Beijing when strong weather systems pass through the territory. The O3 precursors discharged in the urban area of Beijing are usually transmitted to the northern mountainous areas during the daytime, and photochemical reactions gradually occur during the transportation, resulting in a higher level of O3 in the downwind direction than that in urban areas (Wang et al., 2006; Ma et al., 2011; Cheng et al., 2016). Third, atmospheric particulate matter concentration can also play an important role in influencing O3 concentration. For example, Li et al. (2019) found that the PM2.5 concentration in the summer of the past five years has decreased by approximately 40%, which is an important factor leading to the increase in O3 concentration during the summer in the North China Plain, this factor increases the solar radiation intensity and reduces the heterogeneous absorption of HO2 radicals by erosols, which in turn increases the formation of O3. With a lower concentration of atmospheric particulate matter in the area where D2 station is located Cheng et al. (2015), it is beneficial to the generation of O3.
It is worth to note that although the annual averaged O3 concentration for most stations in Beijing increased in 2018 relative to 2015, the reduced O3 concentration in the near-surface atmosphere still occurred at a small number of monitoring stations. The phenomenon and possible reasons are worthy of further research.
To perform spatial interpolation, we clicked ArcToolbox and selected “Kriging” under “Spatial analyst tools” in the “Arcmap 10” software. From the spatial interpolation map (Figure 10), the annual averaged O3 concentrations were relatively low in the central areas and southern districts/counties of Beijing. By contrast, the O3 concentrations were relatively high in the northern districts/counties, especially in the northeastern part where there is excellent ecological vegetation and the annual averaged O3 concentration is the highest. This is basically consistent with the spatial distribution characteristics obtained by Wang et al. (2014).

FIGURE 10. Spatial distribution of O3 concentration in Beijing in (A) 2015 and (B) 2018.
Although the northeastern area has a higher altitude (1,000–1,500 m), lower annual averaged temperature, and higher relative humidity (Figure 11), which are not conducive to the photochemical reaction of atmospheric O3, the vegetation coverage in this area is high (Figure 1), where the amount of VOCs emitted by plants is higher, and the lower concentration of atmospheric particulate matter maybe is conducive to the generation of O3. In addition, the higher annual averaged O3 concentration over the area could be affected by the atmospheric regional transmission.
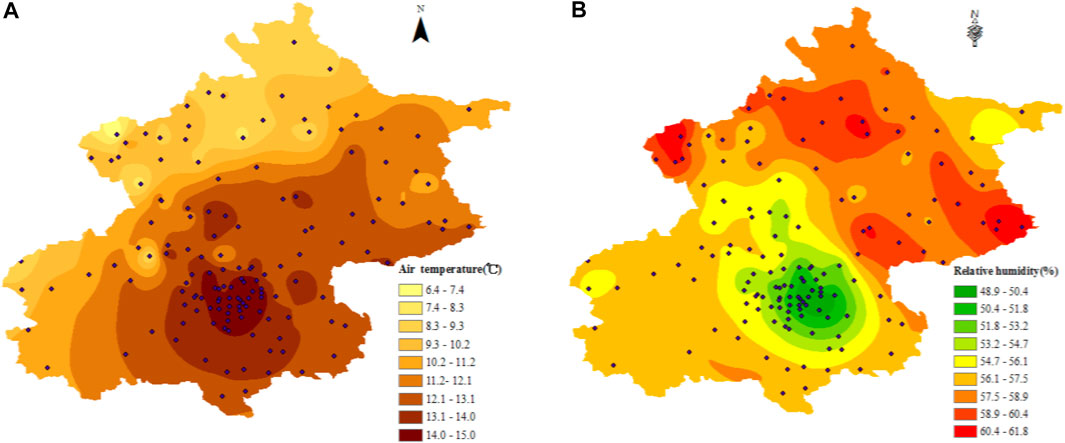
FIGURE 11. Distribution maps of annual averaged (A) air temperature and (B) relative humidity in Beijing. 143 Black dots represent the automatic weather stations.
The diurnal variation in near-surface O3 concentrations for each month, season, and year showed a unimodal variation at 33 monitoring stations in 2015 and 2018. The O3 concentration usually reached the lowest value from 06:00 to 07:00, and then rose rapidly to the maximum at 14:00 to 15:00, and then declined until the early morning of the next day. Although the daily variation curve of the O3 concentration does not conform to the normal distribution, it is similar to the daily variation curves of temperature, wind speed, and solar total radiation.
Spearman correlation analysis showed that the correlation coefficients of O3 concentration with temperature, solar total radiation, and wind speed were 0.925, 0.629, and 0.932, respectively, with a significant positive correlation (P < 0.01), while the correlation coefficient with air relative humidity was −0.977, which showed a significant negative correlation. Furthermore, the relative contributions of environmental factors to the O3 concentration were analyzed by the boosted regression trees model, it is revealed that the air temperature was the main influencing factor (relative contributions>88%). On the other hand, the relative contributions of wind speed, solar total radiation and relative humidity are 8.5, 3.3, and 0.1%, respectively.
The monthly averaged change characteristic of the O3 concentration show a distinct "bell-shaped" unimodal distribution at the 33 monitoring stations in 2015 and 2018. The highest value generally appeared from June to August during the summer, and the lowest value generally occurred in January during the winter. The highest monthly averaged O3 concentration that was observed in 2015 exceeded 130.0 μg·m−3, and the lowest value was less than 20.0 μg·m−3.
The annual averaged O3 concentration (value ±standard deviation) in Beijing was 58.9 ± 7.9 μg·m−3 in 2015, and increased to 61.2 ± 8.2 μg·m−3 in 2018. Among the 33 monitoring stations, the lowest annual averaged O3 concentration in 2018 appeared at the E3 station (42.4 μg·m−3), which belongs to the traffic pollution control point. This is likely related to the high NO concentration of vehicle exhaust emissions near the traffic station. The highest value appeared at the D2 station (85.5 μg·m−3) in northeastern Beijing, which belongs to the regional background transmission point. The occurrence of the highest value should be primarily related to vegetation coverage, atmospheric regional transmission, and atmospheric particulate matter concentration.
As shown in the spatial interpolation map, the annual averaged O3 concentrations were relatively low in the central areas and southern districts/counties of Beijing, while the values were relatively high in the northern districts/counties in both 2015 and 2018, especially in the northeastern part that contained excellent ecological vegetation with the highest annual averaged O3 concentration. Although the northeastern area has a lower annual averaged temperature and higher relative humidity, which are not conducive to the photochemical reaction of atmospheric O3, the vegetation coverage in this area is high. Moreover, the amount of VOCs emitted by plants is higher, and the lower concentration of atmospheric particulate matter is conducive to the generation of O3. The higher averaged O3 concentration in the area may be also affected by the atmospheric regional transmission.
The original contributions presented in the study are included in the article/Supplementary Material, further inquiries can be directed to the corresponding author.
JX collected all the data, performed all data analysis, and developed the entire draft manuscript. SS and XZ participated in the experimental design, developed many tables and figures, and provided many edits on the manuscript, including references and citations. LW designed the study plan, performed data preprocessing and provided many edits on the manuscript, including references and citations.
This research was supported by the project for National Natural Science Foundation of China (31770751 and 41675085).
The authors declare that the research was conducted in the absence of any commercial or financial relationships that could be construed as a potential conflict of interest.
The Supplementary Material for this article can be found online at: https://www.frontiersin.org/articles/10.3389/fenvs.2021.593220/full#supplementary-material
An, J. L. (2017). Study on the Variation Characteristics of Surface Ozone Concentrations and its Production in Beijing. Doctoral dissertation. Nanjing, China: Nanjing University of Information Science and Technology. [In Chinese]. doi:10.7666/d.y1257767
Berntsen, T., Isaksen, I. S. A., Wang, W.-C., and Liang, X.-Z. (1996). Impacts of Increased Anthropogenic Emissions in Asia on Tropospheric Ozone and Climate. Tellus B: Chem. Phys. Meteorology 48 (1), 13–32. doi:10.3402/tellusb.v48i1.15662
Calfapietra, C., Scarascia Mugnozza, G., Karnosky, D. F., Loreto, F., and Sharkey, T. D. (2008). Isoprene Emission Rates under Elevated CO2 and O3 in Two Field‐grown Aspen Clones Differing in Their Sensitivity to O3. New Phytol. 179 (1), 55–61. doi:10.1111/j.1469-8137.2008.02493.x
Camalier, L., Cox, W., and Dolwick, P. (2007). The Effects of Meteorology on Ozone in Urban Areas and Their Use in Assessing Ozone Trends. Atmos. Environ. 41 (33), 7127–7137. doi:10.1016/j.atmosenv.2007.04.061
Cheng, L. J., Wang, S., Gong, Z. Y., Yang, Q., and Wang, Y. Q. (2017). Pollution Trends of Ozone and its Characteristics of Temporal and Spatial Distribution in Beijing-Tianjin-Hebei Region. J. Environ. Monit. China 33 (1), 14–21. [In Chinese]. doi:10.19316/j.issn.1002-6002.2017.01.03
Cheng, L., Wang, S., Gong, Z., Li, H., Yang, Q., and Wang, Y. (2018). Regionalization Based on Spatial and Seasonal Variation in Ground-Level Ozone Concentrations across China. J. Environ. Sci. 67, 179–190. doi:10.1016/j.jes.2017.08.011
Cheng, N. L., Li, Y. T., Zhang, D. W., Sun, R. W., Dong, X., Cheng, B. F., et al. (2015). Analysis on the Spatial and Temporal Distribution of pm2.5 in Beijing in 2013. J. Environ. Eng. 33 (10), 43–46. [In Chinese]. doi:10.13205/j.hjgc.201510010
Cheng, N. L., Li, Y. T., Zhang, D. W., Chen, T., Wei, Q., Sun, T. H., et al. (2016). Characteristics of Ozone Background Concentration in Beijing from 2004 to 2015. Huan Jing Ke Xue 37 (8), 2847–2854. [In Chinese]. doi:10.13227/j.hjkx.2016.08.004
Deng, X., Zhou, X., Wu, D., Tie, X., Tan, H., Li, F., et al. (2011). Effect of Atmospheric Aerosol on Surface Ozone Variation over the Pearl River Delta Region. Sci. China Earth Sci. 54 (5), 744–752. doi:10.1007/s11430-011-4172-7
Elith, J., Leathwick, J. R., and Hastie, T. (2008). A Working Guide to Boosted Regression Trees. J. Anim. Ecol. 77 (4), 802–813. doi:10.1111/j.1365-2656.2008.01390.x
Hata, H., and Tonokura, K. (2019). Impact of Next-Generation Vehicles on Tropospheric Ozone Estimated by Chemical Transport Model in the Kanto Region of Japan. Sci. Rep. 9 (1), 3573. doi:10.1038/s41598-019-40012-y
Huang, X. G., Zhao, J. B., Cao, J. J., and Song, Y. Y. (2019). Spatial-temporal Variation of Ozone Concentration and its Driving Factors in China. Huan Jing Ke Xue 40 (3), 1120–1131. [In Chinese]. doi:10.13227/j.hjkx.201807038
Jacob, D. J., and Winner, D. A. (2009). Effect of Climate Change on Air Quality. Atmos. Environ. 43 (1), 51–63. doi:10.1016/j.atmosenv.2008.09.051
Khalil, M. A. K. (2018). Steady States and Transport Processes in Urban Ozone Balances. Npj Clim. Atmos. Sci. 1, 22. doi:10.1038/s41612-018-0035-7
Kong, Q. X., Liu, G. R., and Li, G. C. (1999). Surface Ozone Concentration Variation and Possible Influences on Human Health. J. Climatic Environ. Res. 4 (1), 61–66. [In Chinese]. doi:10.3878/j.issn.1006-9585.1999.01.14
Lehman, J., Swinton, K., Bortnick, S., Hamilton, C., Baldridge, E., Eder, B., et al. (2004). Spatio-temporal Characterization of Tropospheric Ozone across the Eastern United States. Atmos. Environ. 38 (26), 4357–4369. doi:10.1016/j.atmosenv.2004.03.069
Li, K., Jacob, D. J., Liao, H., Shen, L., Zhang, Q., and Bates, K. H. (2019). Anthropogenic Drivers of 2013-2017 Trends in Summer Surface Ozone in China. Proc. Natl. Acad. Sci. USA 116 (2), 422–427. doi:10.1073/pnas.1812168116
Lin, C.-Y., Wang, Z., Chou, C. C.-K., Chang, C.-C., and Liu, S. C. (2007). A Numerical Study of an Autumn High Ozone Episode over Southwestern Taiwan. Atmos. Environ. 41 (17), 3684–3701. doi:10.1016/j.atmosenv.2006.12.050
Lin, W., Xu, X., Zhang, X., and Tang, J. (2008). Contributions of Pollutants from North China Plain to Surface Ozone at the Shangdianzi GAW Station. Atmos. Chem. Phys. 8, 5889–5898. doi:10.5194/acp-8-5889-2008
Loreto, F., and Schnitzler, J.-P. (2010). Abiotic Stresses and Induced BVOCs. Trends Plant Sci. 15 (3), 154–166. doi:10.1016/j.tplants.2009.12.006
Ma, Z. Q., Wang, Y. S., Zhang, X. L., and Xu, J. (2011). Comparison of Ozone between Beijing and Downstream Area. Huan Jing Ke Xue 32 (4), 924–929. [In Chinese].
Ma, Z., Xu, J., Quan, W., Zhang, Z., Lin, W., and Xu, X. (2016). Significant Increase of Surface Ozone at a Rural Site, North of Eastern China. Atmos. Chem. Phys. 16, 3969–3977. doi:10.5194/acp-16-3969-2016
Raddatz, R. L., and Cummine, J. D. (2001). Temporal Surface Ozone Patterns in Urban Manitoba, Canada. Boundary-Layer Meteorology 99 (3), 411–428. doi:10.1023/A:101898301216810.1023/a:1018983012168
Ridgeway, G. (2015). Generalized Boosted Regression Models. R package version 2.1.1 [DB/OL]. Available at: https://github.com/harrysouthworth/gbm (Accessed April 29, 2021).
Sillman, S., and He, D. Y. (2002). Some Theoretical Results Concerning O3-NOx-VOC Chemistry and NOx-VOC Indicators. J. Geophys. Res. 107 (D22), 4659. doi:10.1029/2001JD001123
Sun, L., Xue, L., Wang, T., Gao, J., Ding, A., Cooper, O. R., et al. (2016). Significant Increase of Summertime Ozone at Mount Tai in Central Eastern China. Atmos. Chem. Phys. 16, 10637–10650. doi:10.5194/acp-16-10637-2016
Tang, G., Li, X., Wang, Y., Xin, J., and Ren, X. (2009). Surface Ozone Trend Details and Interpretations in Beijing, 2001-2006. Atmos. Chem. Phys. 9, 8813–8823. doi:10.5194/acp-9-8813-2009
Velikova, V., Pinelli, P., Pasqualini, S., Reale, L., Ferranti, F., and Loreto, F. (2005). Isoprene Decreases the Concentration of Nitric Oxide in Leaves Exposed to Elevated Ozone. New Phytol. 166 (2), 419–426. doi:10.1111/j.1469-8137.2005.01409.x
Wang, T., Ding, A., Gao, J., and Wu, W. S. (2006). Strong Ozone Production in Urban Plumes from Beijing, China. Geophys. Res. Lett. 33, 21806. doi:10.1029/2006GL027689
Wang, T., Xue, L., Brimblecombe, P., Lam, Y. F., Li, L., and Zhang, L. (2017). Ozone Pollution in China: A Review of Concentrations, Meteorological Influences, Chemical Precursors, and Effects. Sci. Total Environ. 575, 1582–1596. doi:10.1016/j.scitotenv.2016.10.081
Wang, Y., Gao, W., Wang, S., Song, T., Gong, Z., Ji, D., et al. (2020). Contrasting Trends of PM2.5 and Surface-Ozone Concentrations in China from 2013 to 2017. Natl. Sci. Rev. 7, 1331–1339. doi:10.1093/nsr/nwaa032
Wang, Z., Li, Y., Chen, T., Zhang, D., Sun, F., Wei, Q., et al. (2015). Ground-level Ozone in Urban Beijing over a 1-year Period: Temporal Variations and Relationship to Atmospheric Oxidation. Atmos. Res. 164-165, 110–117. doi:10.1016/j.atmosres.2015.05.005
Wang, Z., Lv, J., Tan, Y., Guo, M., Gu, Y., Xu, S., et al. (2019). Temporospatial Variations and Spearman Correlation Analysis of Ozone Concentrations to Nitrogen Dioxide, Sulfur Dioxide, Particulate Matters and Carbon Monoxide in Ambient Air, China. Atmos. Pollut. Res. 10 (4), 1203–1210. [In Chinese]. doi:10.1016/j.apr.2019.02.003
Wang, Z. S., Li, Y. T., Chen, T., Zhang, D. W., Sun, F., Sun, R. W., et al. (2014). Temporal and Spatial Distribution Characteristics of Ozone in Beijing. Huan Jing Ke Xue 35 (12), 4446–4453. [In Chinese]. doi:10.13227/j.hjkx.2014.12.005
Xu, J. L., and Zhu, Y. X. (1994). Effects of the Meteorological Factors on the Ozone Pollution Near the Ground. J. Chin. J. Atmos. Sci. 18 (6), 751–757.
Yang, G., Liu, Y., and Li, X. (2020). Spatiotemporal Distribution of Ground-Level Ozone in China at a City Level. Sci. Rep. 10 (1), 7229. doi:10.1038/s41598-020-64111-3
Yuan, X., Feng, Z., Liu, S., Shang, B., Li, P., Xu, Y., et al. (2017). Concentration- and Flux-Based Dose-Responses of Isoprene Emission from Poplar Leaves and Plants Exposed to an Ozone Concentration Gradient. Plant Cel Environ. 40 (9), 1960–1971. doi:10.1111/pce.13007
Zaveri, R. A., Berkowitz, C. M., Kleinman, L. I., Springston, S. R., Doskey, P. V., Lonneman, W. A., et al. (2003). Ozone Production Efficiency and NOxdepletion in an Urban Plume: Interpretation of Field Observations and Implications for Evaluating O3-NOx-VOC Sensitivity. J. Geophys. Res. 108 (D14), 4436. doi:10.1029/2002JD003144
Zhang, H. X., Sun, X., Yao, Y. H., Wan, W. X., Xiao, Y., Sun, B. F., et al. (2014). Ground-level Ozone Distribution Pattern in Summer of Beijing and its Foliar Injury Effect upon Plants. Acta Ecologica Sinica 34 (16), 4756–4765. doi:10.5846/stxb201306261781
Zhang, Q. Q., and Zhang, X. Y. (2019). Ozone Spatial-Temporal Distribution and Trend over China since 2013: Insight from Satellite and Surface Observation. Huan Jing Ke Xue 40 (3), 1132–1142. doi:10.13227/j.hjkx.201808028
Zhao, S., Yin, D., Yu, Y., Kang, S., Qin, D., and Dong, L. (2020). PM2.5 and O3 Pollution during 2015-2019 over 367 Chinese Cities: Spatiotemporal Variations, Meteorological and Topographical Impacts. Environ. Pollut. 264, 114694. doi:10.1016/j.envpol.2020.114694
Keywords: surface ozone concentration, spatiotemporal change, boosted regression trees model, urban environment, Beijing
Citation: Xie J, Shi S, Wu L and Zhang X (2021) Spatiotemporal Changes of Near-Surface Ozone Concentration From 2015 to 2018 in Beijing. Front. Environ. Sci. 9:593220. doi: 10.3389/fenvs.2021.593220
Received: 19 August 2020; Accepted: 26 April 2021;
Published: 11 May 2021.
Edited by:
Gert-Jan Steeneveld, Wageningen University and Research, NetherlandsReviewed by:
Maria De Fatima Andrade, University of São Paulo, BrazilCopyright © 2021 Xie, Shi, Wu and Zhang. This is an open-access article distributed under the terms of the Creative Commons Attribution License (CC BY). The use, distribution or reproduction in other forums is permitted, provided the original author(s) and the copyright owner(s) are credited and that the original publication in this journal is cited, in accordance with accepted academic practice. No use, distribution or reproduction is permitted which does not comply with these terms.
*Correspondence: Lingyun Wu, d3VseUBsYXNnLmlhcC5hYy5jbg==
Disclaimer: All claims expressed in this article are solely those of the authors and do not necessarily represent those of their affiliated organizations, or those of the publisher, the editors and the reviewers. Any product that may be evaluated in this article or claim that may be made by its manufacturer is not guaranteed or endorsed by the publisher.
Research integrity at Frontiers
Learn more about the work of our research integrity team to safeguard the quality of each article we publish.