- 1Centre for Functional Biodiversity, School of Life Sciences, University of KwaZulu-Natal, Pietermaritzburg, South Africa
- 2School of Biology and Environmental Sciences, University of Mpumalanga, Nelspruit, South Africa
The use of reference conditions is essential to the monitoring and management of aquatic ecosystems. We examined existing and potential reference sites through historical data, maps, and field data collected from river sites in KwaZulu-Natal (KZN), South Africa. In our study, we applied nine criteria that best reflect the characteristics of South African rivers on 24 a priori selected reference sites. These nine criteria comprised of catchment conditions (flow modification and natural landscape) and site-specific attributes (water quality, human disturbance, river channel, water abstraction, riparian vegetation, riparian zone modification, and instream habitat quality). The a priori selected reference sites were subjected to validation using multivariate methods, such as analysis of similarities (ANOSIM), similarity percentages (SIMPER), and non-parametric multidimensional scaling (MDS) based on the macroinvertebrate fauna by applying a SASS5 threshold considered to be an indicator of undisturbed sites in South African rivers. We identified differences in the macroinvertebrate assemblages of the reference conditions for each river group based on their ecoregions, geomorphology and seasonal variations. Ecoregions and river geomorphology were better in the grouping of sites with similar reference conditions than the seasons. Our findings indicated that all of the selected sites could be considered as valid reference sites; however, caution should be taken in applying this method to lowland rivers because of their noticeable seasonal variability and habitat instability which tend to alter their reference states. We recommend that a type-specific reference condition be developed for lowland rivers. Also, statistical validation of reference conditions should be a continuous process in river biomonitoring.
Introduction
The River Health Programme of South Africa, which recently metamorphosed into the River Eco-status Monitoring Program (REMP) (Department of Water and Sanitation [DWS], 2016) and the Water Framework Directive (WFD) (European Commission, 2000) recognize the importance of biological criteria in the validation of aquatic ecosystem status or quality (Chaves et al., 2006). This is because biological components of an aquatic ecosystem are good indicators of (1) water quality changes, which may be caused by organic pollution, hazardous substances or nutrient enrichment (eutrophication); (2) habitat modifications by physical disturbance, such as dam construction, canalization, dredging or other forms of construction activities; and (3) biological pressures on populations, such as the introduction of alien species (Nixon et al., 2003; Chaves et al., 2006). For example, a decrease in macroinvertebrate diversity and an increase in tolerant taxa are expected in the presence of stressors, which may be indicated using the SASS5 in South African rivers (Dickens and Graham, 2002).
Using biological methods for the assessment of river water quality and well-being is prevalent in most countries, and several of these methods have been standardized, serving as a basis for policy decisions concerning water quality management (Hering et al., 2003; De Pauw et al., 2006). Examples of such national and regional biological assessment methods include an index of biotic integrity (IBI) (Karr, 1981), riparian, channel environment inventory (RCE) (Petersen, 1992), index of stream condition (ISC) (Ladson et al., 1999), river health program (RHP) (Roux, 2001; Department of Water Affairs and Forestry [DWAF], 2008). Recently, the river eco-status monitoring program (REMP) replaced the earlier RHP of South Africa (Department of Water and Sanitation [DWS], 2016). Ecological reference conditions (RCs) or criteria are the conditions selected through physical, chemical and biological characteristics that are representative of a group of near-pristine or “least impacted” sites (Schlacher et al., 2014; Bouleau and Pont, 2015). Thus, RCs serve as the foundation for developing biological criteria and enable the determination of the degree of deviation from natural conditions for protecting aquatic ecosystems (Muxika et al., 2007; Yurtseven et al., 2016).
The first step in the Ecological Classification process is the determination of RCs for each of the biotic components (diatoms, riparian vegetation, invertebrates, and fish fauna) of the river ecosystem being surveyed (Kleynhans and Louw, 2007). Establishing a RC and specifying ecological class boundaries allows accurate ecological evaluations of each site by comparing data from similar sites with little or no anthropogenic disturbances (Wallin et al., 2003; Bailey et al., 2004; Chaves et al., 2006). The RCs provide the fundamentals of measuring anthropogenic impacts, evaluate biological community potential; and spatial and temporal natural fauna distribution (Reynoldson et al., 1997; Economou, 2002; Wallin et al., 2003; Bailey et al., 2004). All RCs do not necessarily represent entirely undisturbed or pristine conditions, they often include minor anthropogenic disturbances (Chaves et al., 2006). Although low human pressure effects may be allowed in a RC, a high ecological status must always be achieved (Economou, 2002; Wallin et al., 2003; Bailey et al., 2004). Site hydromorphological and physicochemical attributes of a RC should meet the criteria of minimal disturbance for reference biological communities to be obtained (Reynoldson et al., 1997; European Commission, 2000).
Five different approaches or combinations of the approaches are currently being used in creating RCs for biological indices (Barbour et al., 1996; European Commission, 2000; Economou, 2002; Wallin et al., 2003). These are (1) expert judgment, (2) predictive modeling, (3) historical data, (4) extensive spatial surveys, and (5) paleo-reconstruction. Obtaining survey data is a reliable method for establishing a RC, especially in relatively undisturbed or minimally disturbed sites (Barbour et al., 1996; Wallin et al., 2003; Bailey et al., 2004; Nijboer et al., 2004).
Although several studies have assessed the ability of regional classification systems to partition spatial variability, there are differing opinions on the ecological validity of geographic delineators (Dallas, 2002, 2004a). For example, water chemistry parameters have been shown to be useful predictors of ecoregions (Ravichandrana et al., 1996), while some other studies have shown that ecoregions cannot effectively explain water chemistry patterns (Harding et al., 1997). Also, some researchers showed that macroinvertebrate community structures could be used to classify ecoregions (Harding et al., 1997; Gerritsen et al., 2000), while others have contrasting opinions on the correlation between ecoregions and water chemistry (Hawkins and Vinson, 2000), macroinvertebrate community structures (Marchant et al., 2000), and vegetation (Wright et al., 1998).
Legislative amendments of the Republic of South Africa have over time modified the functions of the Department of Water and Sanitation (DWS) from merely managing the quality and quantity of water resources to integrated management of the resources to ensure that the integrity of the ecosystems is not compromised (Thirion, 2016). The REMP involves a significant change in the environmental assessment criteria used for the evaluation of the ecological status of rivers using four dominant biological indicator groups for river research: diatoms, riparian vegetation, invertebrates, and fish faunas (Kleynhans, 2007; Taylor et al., 2007; Thirion, 2007; Kleynhans et al., 2008). Also, REMP requires ecological classification to be based on deviation from the expected natural condition, which necessitated the characterization of the original status of each water body type, usually designated as the RC.
The widespread human modification of river systems often poses a difficulty in identifying potential reference sites (Chessman and Royal, 2004; Chessman, 2006; Chessman et al., 2008; Dallas, 2013). In South Africa, most possibly minimally impacted sites are those located in the upper reaches of rivers, which may not be useful reference sites for downstream river reaches (Thirion, 2016). Although historical data are often used as supplementary sources of information to characterize reference communities (Ehlert et al., 2002; Nijboer et al., 2004), it is impractical to rely on the historical data for determining RCs for South African rivers, because this information is scanty (Thirion, 2016). We examined the success of the multivariate approach in the selection and validation of reference sites based on macroinvertebrate assemblages in KwaZulu-Natal (KZN) Province, South Africa. We expected that sites within the same classification category (e.g., ecoregions) would have similar RCs in terms of macroinvertebrate assemblages.
Materials and Methods
Study Area
This study was conducted in the major rivers of KZN. The study sites were spread across KZN covering 17 rivers and five ecoregions (Kleynhans et al., 2005) rivers (Figure 1). The use of ecoregion characteristics in grouping our study sites was because of their proven efficacy in a variety of applications, which includes ecosystem management, biotic conservation, climate change studies, and sustainable food production strategies (Omernik and Griffith, 2014). The altitudes ranged from 19 to 2098 m a.s.l within a variety of geomorphological zones (Rowntree et al., 2000; Moolman, 2008), ranging from headwater to lowland rivers. Some of the major rivers in this study included the Thukela, uMvoti, uMgeni, Phongolo, uMfolozi, Mooi, Mtamvuna, and Buffalo Rivers. The Thukela River is the longest river in the province, while the uMgeni River has five large dams/impoundments along its course.
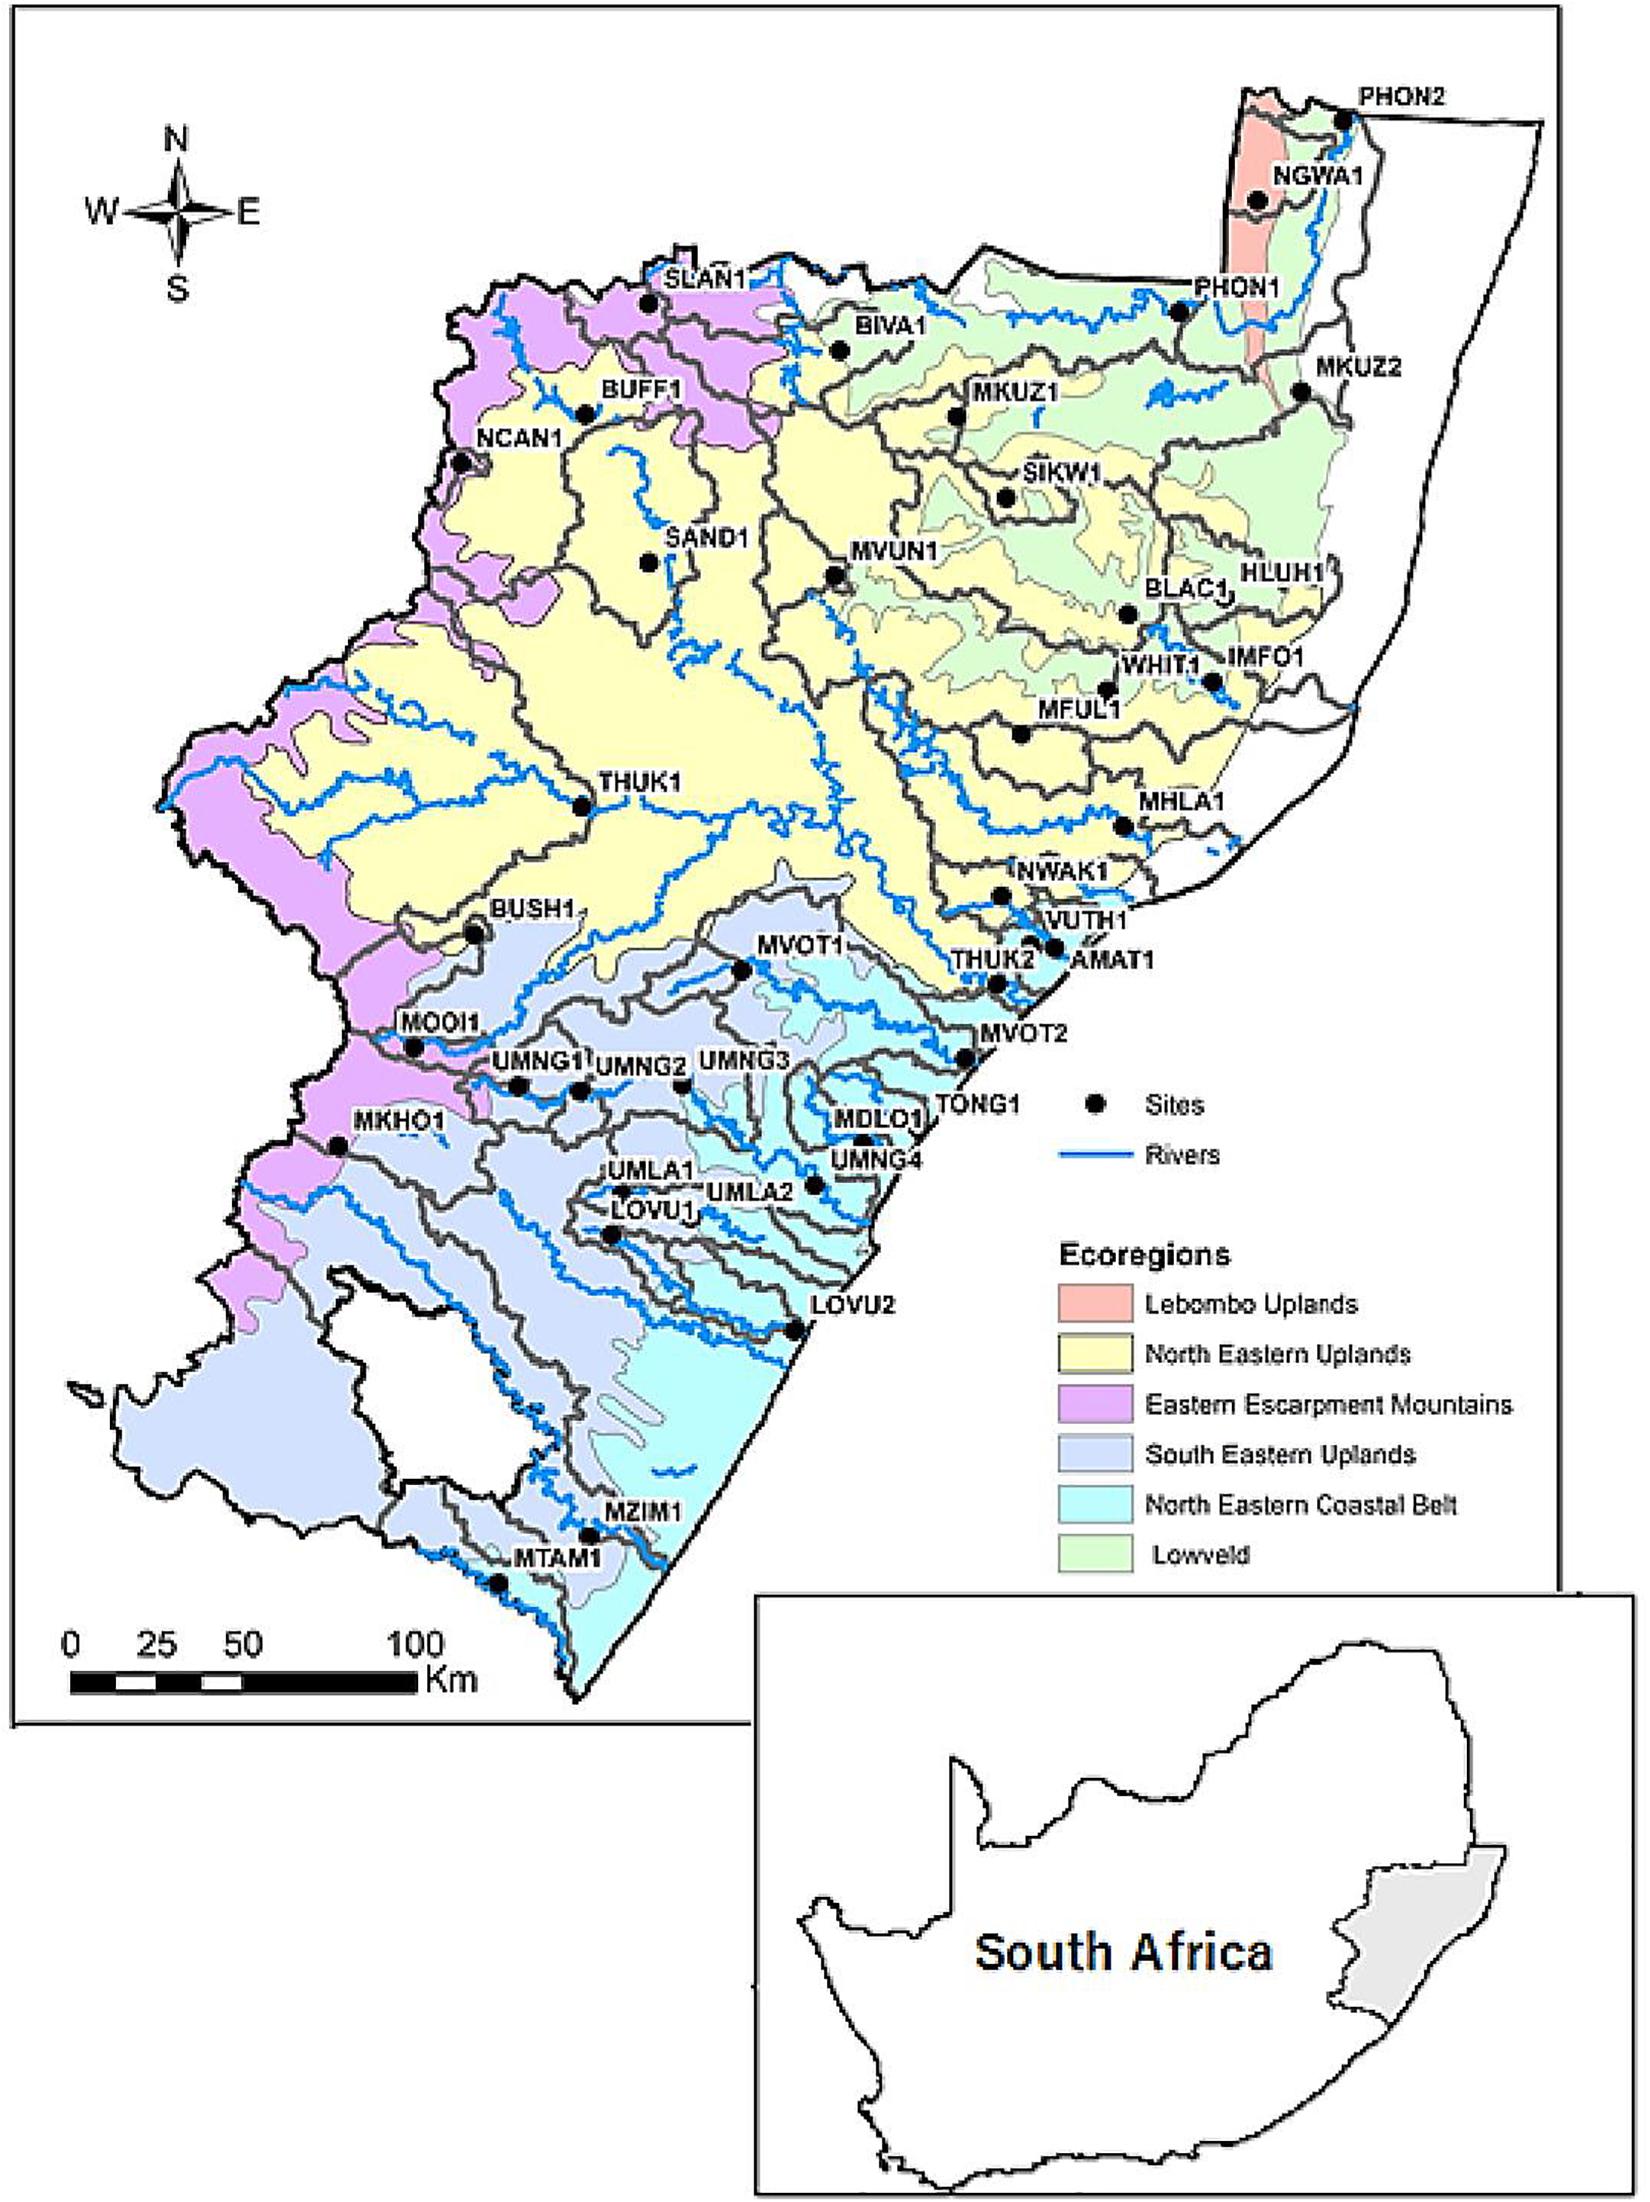
Figure 1. River study sites in KwaZulu-Natal, South Africa for the study from March 2015 to March 2016.
Site Selection and Validation
We selected a total of 24 river sites (16 upland sites; 8 lowland sites) situated above major anthropogenic disturbances for this study. We used nine pre-defined criteria, comprising of catchment conditions (flow modification and natural landscape) and site-specific attributes (water quality, human disturbance, river channel, water abstraction, riparian vegetation, riparian zone modification, and instream habitat quality).
In our study, the Vegetation Response Assessment Index (VEGRAI) level 3 was used to assess the riparian vegetation (Kleynhans et al., 2007). The VEGRAI is a semi-quantitative technique that utilizes several metrics to describe and rate the ecological status of riparian vegetation. Level 3 VEGRAI requires that the riparian habitat be divided into two defined zones: (a) marginal and (b) non-marginal zone. Each zone was assessed in terms of the intensity and extent of vegetation modification, invasive alien plant (IAP) infestation or other exotic species, including agricultural species; and changes in the vegetation functional groups and distribution through impacts from water quantity and quality. The VEGRAI index scores range from 0 (critically modified) to 100 (natural indigenous).
The South African Scoring System 5 (SASS5) (Dickens and Graham, 2002) was used to assess the macroinvertebrates well-being. The validation process involved the qualitative investigation of macroinvertebrates, habitat quality, and water quality. The minimum a priori validation criteria for SASS5 and VEGRAI were values >100 and >70, respectively. Water quality variables (temperature, pH, conductivity, and other related variables) were not considered in the validation process because natural or seasonal hydrogeological differences may cause variations or fluctuations in their measurement (Chaves et al., 2005, 2006; Meinson et al., 2015).
Macroinvertebrates Sampling
We conducted field data sampling on four occasions between March 2015 and March 2016 (March 2015, May 2015, November 2015, and March 2016). We measured basic in situ water quality parameters (temperature, dissolved oxygen, pH, and electrical conductivity) at each site on every sampling occasion using the YSI model 556 MPS handheld multi-probe water quality meter. Macroinvertebrate sampling was conducted using a kick net according to the SASS5 protocol (Dickens and Graham, 2002). At each sampling event, macroinvertebrates were sampled from three distinct biotopes: stones (stones-in and stones-out of current), vegetation (marginal and aquatic), and sediment (GSM—gravel, sand and mud). The stones-in-current (SIC) are pebbles and cobbles (2–25 cm), and boulders (25 cm). Stone-out-of-current (SOOC) included pebbles and cobbles, and boulders in pools. Marginal vegetation includes vegetation growing on fringes and edges of the rivers, while aquatic vegetation was that mostly growing (may or may not be submerged) inside river channel. Gravel was small stones usually less than 2 cm in diameter, while sand and mud were smaller than 2 and 0.06 mm, respectively. Unless otherwise stated, the described biotopes are herein referred to as stone, vegetation and GSM.
The SASS5 sampling protocol requires collecting only one sample per biotope group, but care was taken to ensure that all the available biotopes were qualitatively sampled. We sampled each biotope separately, scored them in the field according to the SASS5 protocol, and subsequently preserved these in 80% ethanol for better taxonomic resolution and taxa abundance counts in the laboratory. Three samples were collected from each site during every sampling event or season (i.e., one sample per biotope). Three samples (i.e., one sample from each of the three biotopes) were collected per site at every sampling event or season. Field identification of macroinvertebrates was made to the family level, using the identification guides produced by the Department of Water and Sanitation (Gerber and Gabriel, 2002). The estimated abundances of the identified macroinvertebrate families were recorded on the SASS5 sheets. The SASS5 data interpretation is based on the calculation of the SASS score (the sum of the sensitivity weightings for taxa present at a site) and average score per taxon (ASPT). The ASPT is the ratio of the SASS score and the number of taxa (Dickens and Graham, 2002; Dallas, 2004b).
Data Analyses
All data analyses were based on the macroinvertebrate data collected from SASS5. The mean scores of the macroinvertebrate data were transformed to their square roots before data analyses using PRIMER multivariate statistical software version 6 (Clarke and Gorley, 2006) to reduce their natural variability. Similarities between sites were examined using analysis of similarities (ANOSIM), cluster analysis and non-metric multidimensional scaling (MDS) based on macroinvertebrate assemblage composition (Clarke, 1993; Clarke and Warwick, 1994, 2001). Site classification analysis based on more than two seasons is often recommended because it allows for robustness, hence reducing the temporal variation which could be evident in a one-season site classification (Turak et al., 1999; Bailey et al., 2004; Dallas, 2004a; Chaves et al., 2005).
We used the Bray-Curtis resemblance matrix to determine the abundance contribution of each taxon to each of the sites. We also used the similarity percentage (SIMPER) to determine the distinguishing taxa that were responsible for the similarity within groups of sites and the dissimilarity between groups of sites (Clarke and Gorley, 2006). The classification groups were ecoregions [eastern escarpment mountain (EEM), northeastern upland (NEU), southeastern uplands (SEU), northeastern coastal belt (NECB), Lebombo uplands (LU), and lowveld (LOWV)], river morphology (lowland and upland) and seasons (summer 2015, autumn 2015, spring 2015, and summer 2016). None of the sites in this study was within the LU ecoregion. Differences in macroinvertebrate compositions among the various classifications were tested by One-way Analysis of Similarities (ANOSIM) using Primer v6.
Results
Macroinvertebrate Taxa Composition and SASS5
The combined results of the four sampling seasons showed that the macroinvertebrate communities clustered primarily by the river type or geomorphology, with upland streams being approximately 75.5% dissimilar from the lowland rivers of KZN while within-group similarity of the upland sites was 27.1% and the similarity within the lowland sites was 24.1% (Table 1). The SIMPER analysis showed that Baetidae had the highest similarity percentage contributions for both upland and lowland groupings at approximately 22.2 and 14.2%, respectively, while Tipulidae contributed the lowest similarity percentage (1.1%) in the upland sites and Notonectidae contributed the lowest similarity percentage (1.2%) in the lowland sites. Atyidae contributed the highest dissimilarity percentage (7.1%) between the upland and lowland sites, while the Athericidae and Tipulidae both contributed the lowest dissimilarity percentage (1.0%) (Table 1). For the ecoregions, within-group similarities were 13.8% (LOWV), 27.9% (NEU), 28.7% (SEU), 29% (EEM), and 31.3% (NECB) (Table 2). The cut off for low contributing taxa was 90% as calculated from the Bray-Curtis resemblance matrix, which meant that taxa with less than 10% contributions were excluded from the SIMPER analysis. Taxa that contributed to within-group similarity were relatively constant for both river types; the upland group had 24 taxa, while the lowland group had 23 taxa (Table 3). The SASS indices clearly distinguished between sites, with the upland sites different from the lowland sites (Figure 2). The ecoregions also clearly separated from each other. Although there were clear separations between sites and between ecoregions, there were some similarities in taxa composition. The similarities in taxa composition between the upland and lowland sites could have been the reason for their mixed clusters at 40% similarity (Figure 2).
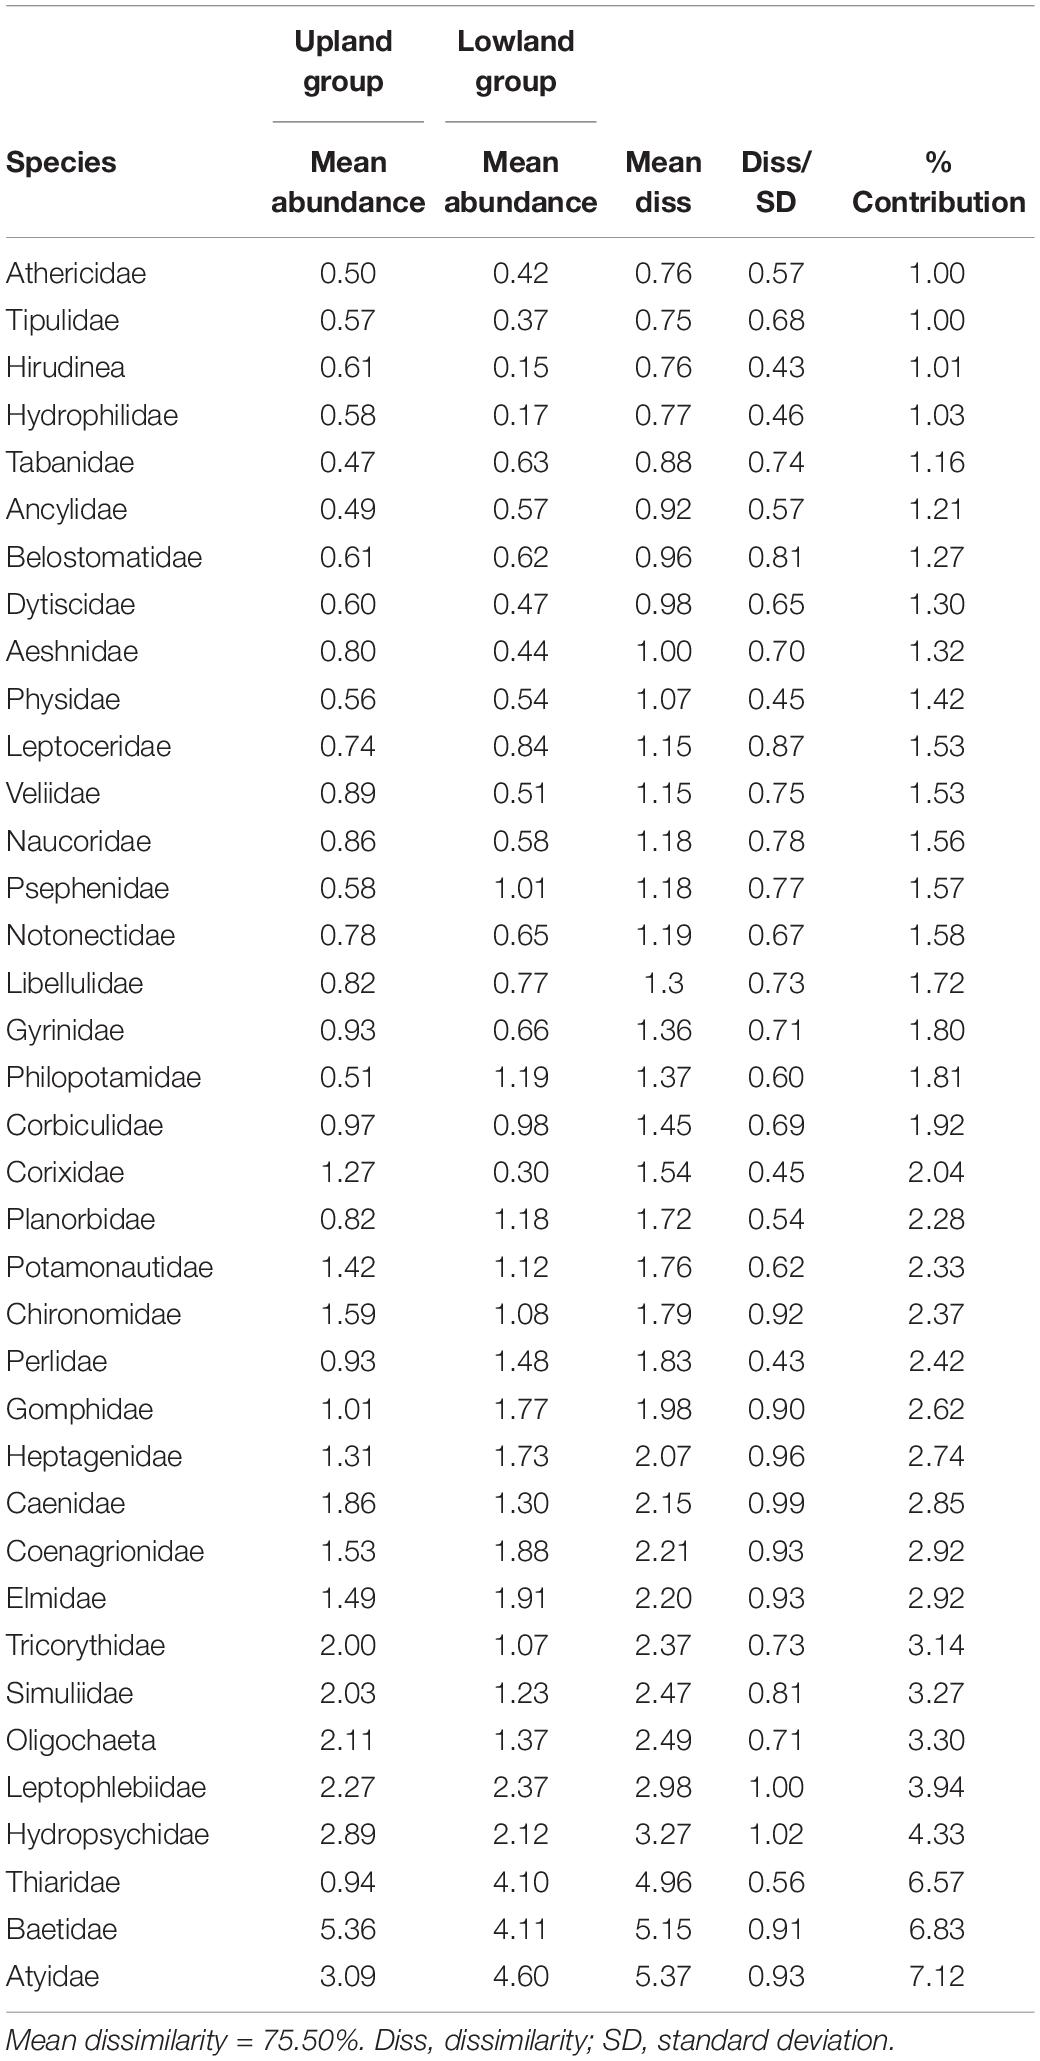
Table 1. Dissimilarities in macroinvertebrate taxa between upland and lowland rivers of KwaZulu-Natal, South Africa, from 2015 to 2016.
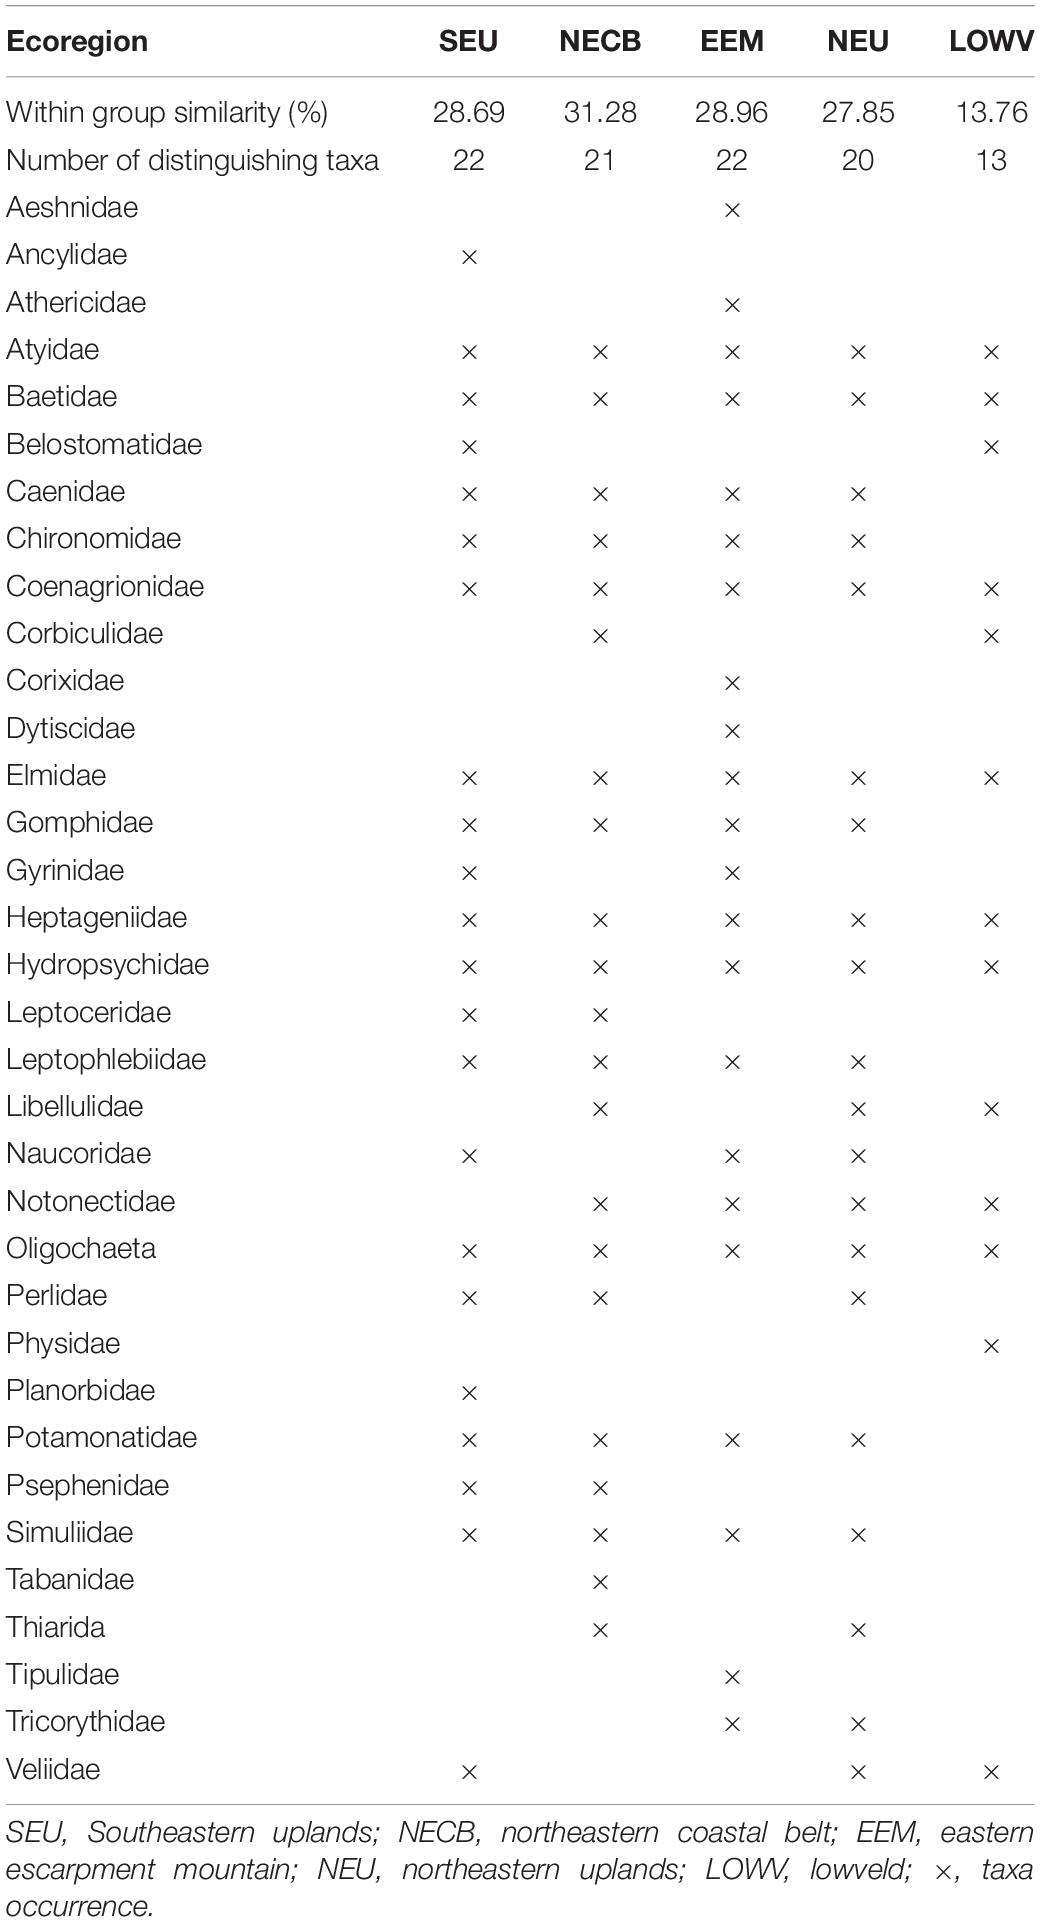
Table 2. Macroinvertebrate taxa contributing within-group similarities of different river ecoregions of KwaZulu-Natal, South Africa, between 2015 and 2016.
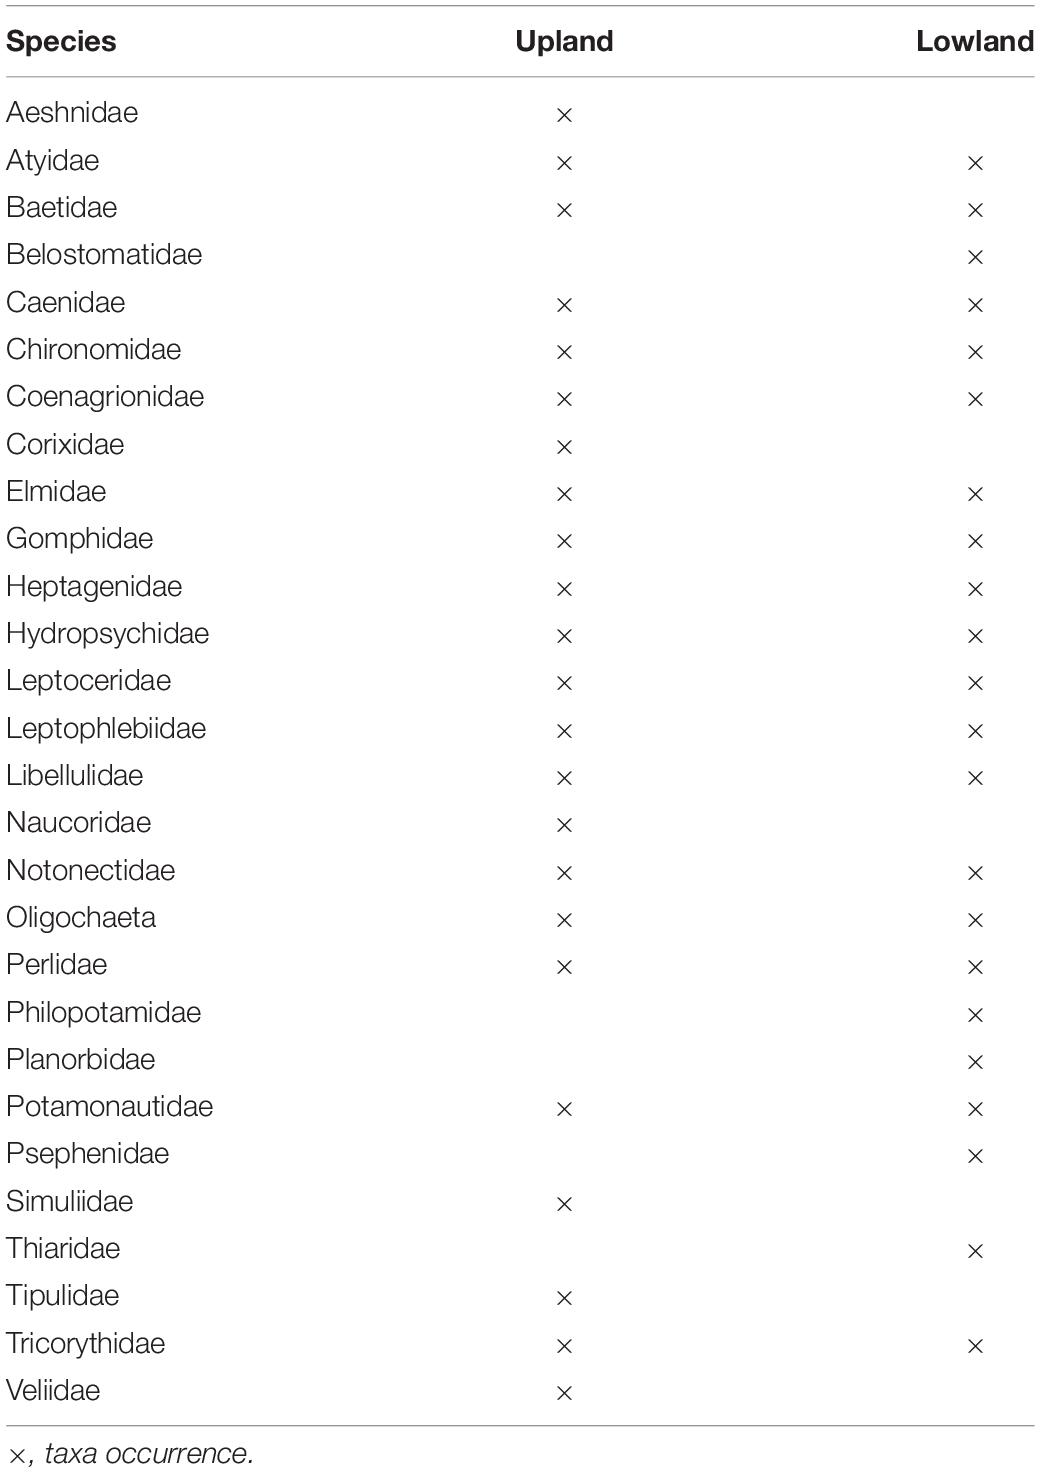
Table 3. Macroinvertebrate taxa contributing to within-group similarity in the upland (27.13%) and lowland (24.05%) rivers of KwaZulu-Natal, South Africa, between 2015 and 2016.
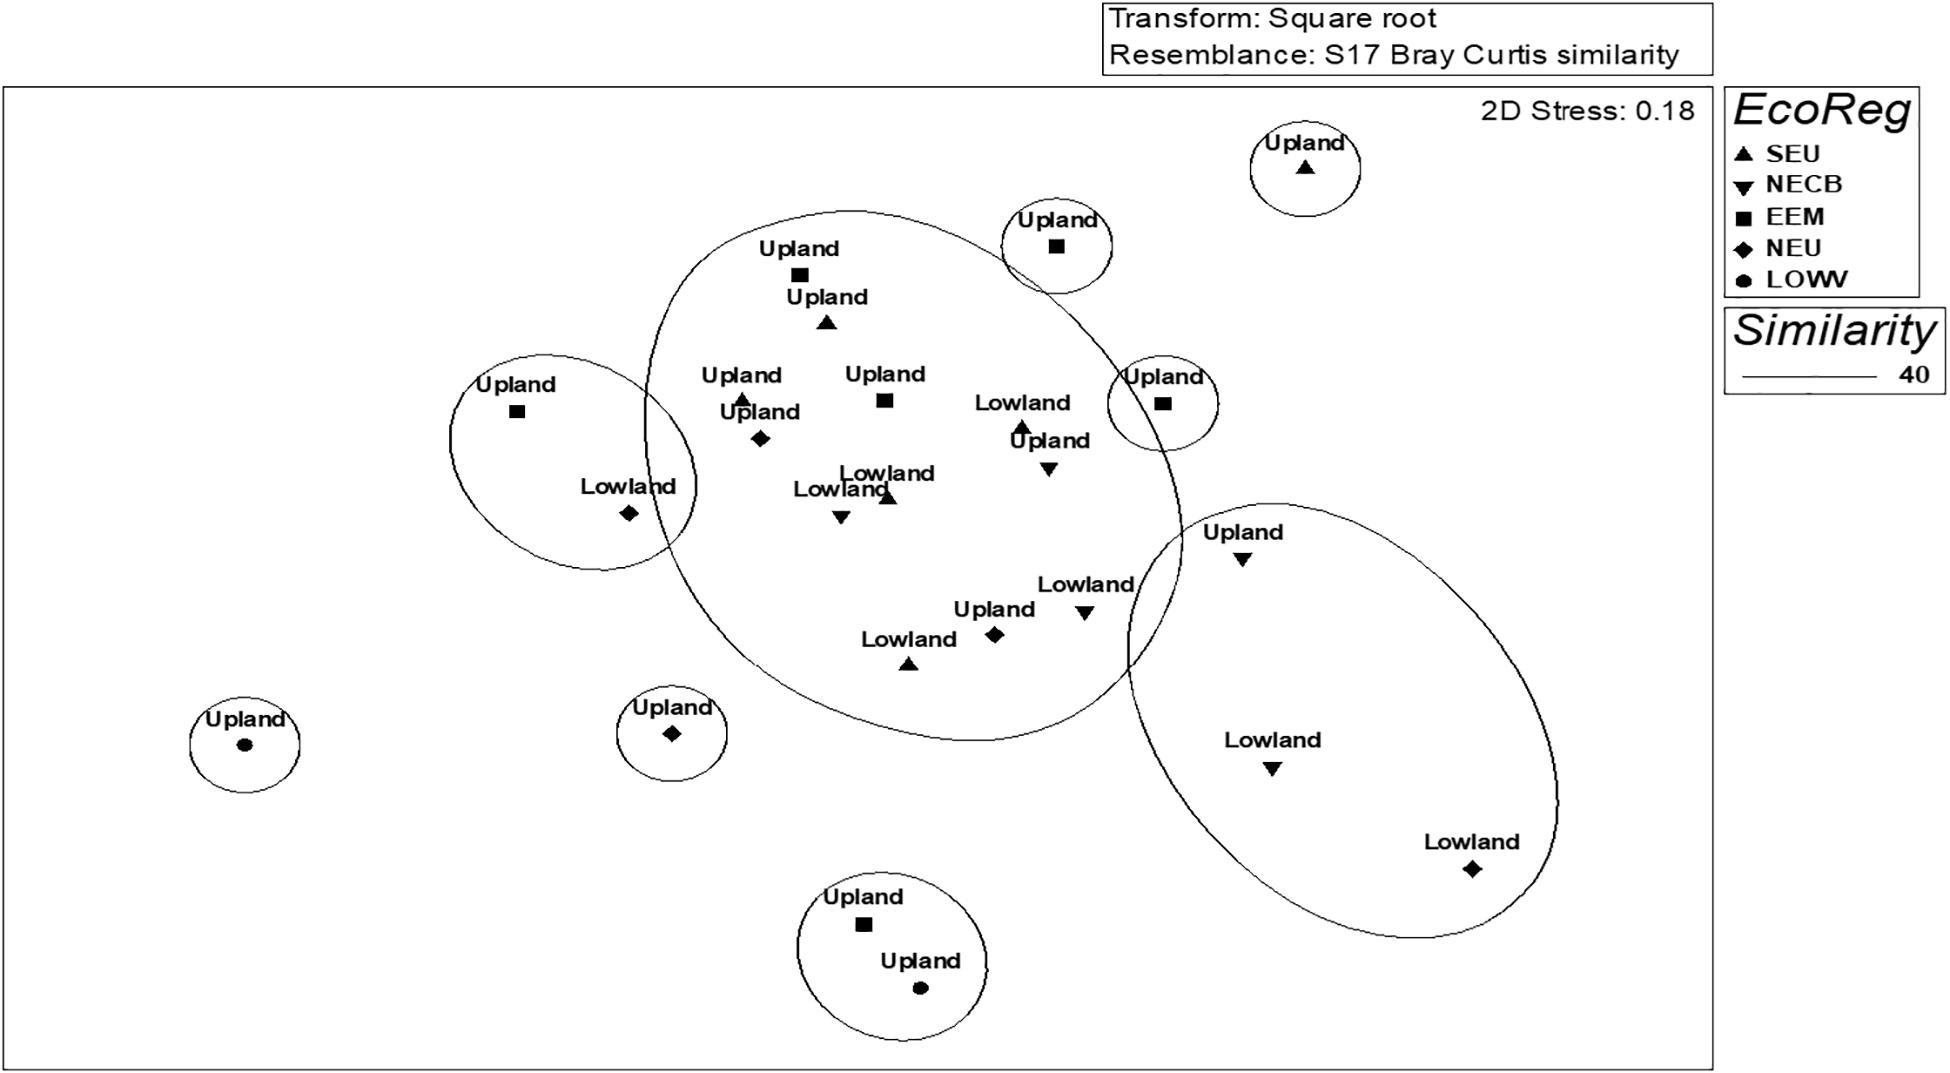
Figure 2. Non-metric multidimensional scaling (MDS) ordination showing the classification of sites based on macroinvertebrate taxa collected in summer 2016 in rivers of KwaZulu-Natal, South Africa. Sites were coded by group geomorphology (upland and lowland) and the shapes represent the ecoregions. SEU, south eastern uplands; NECB, north eastern coastal belt; EEM, eastern escarpment mountains; NEU, north eastern uplands; LOWV, lowveld.
Longitudinal Gradients
Longitudinal gradients influenced the macroinvertebrate taxa clusters, although in a mixed selection of both upland and lowland KZN river groups (Figure 2, MDS: 2D-stress = 0.18). At 40% similarity, five distinct clusters were formed (Figure 2), MDS 2-D Stress = 0.18). Upland and lowland rivers were 75.5% dissimilar, with several taxa differentiating the groups (Table 2). Several sensitive taxa that are typical of headwater streams (e.g., Baetidae, Perlidae, Heptageniidae, Psephenidae, and Athericidae) were among the distinguishing taxa. The best predictor variables were SASS score and longitude according to the results of the MDS and distance-based redundancy analysis (dbRDA) plot (Figure 3), although the influence of other factors was significant among the classification groups. The result of the dbRDA plot showed that SASS scores influenced 59.1% of fitted and 15.1% of the total variation in macroinvertebrate taxa composition, while longitudes influenced 40.9% of fitted and 10.4% of total variation (Figure 3). SASS score, number of taxa, ASPT, latitude, longitude, and altitude, were good predictors, while biotopes were not.
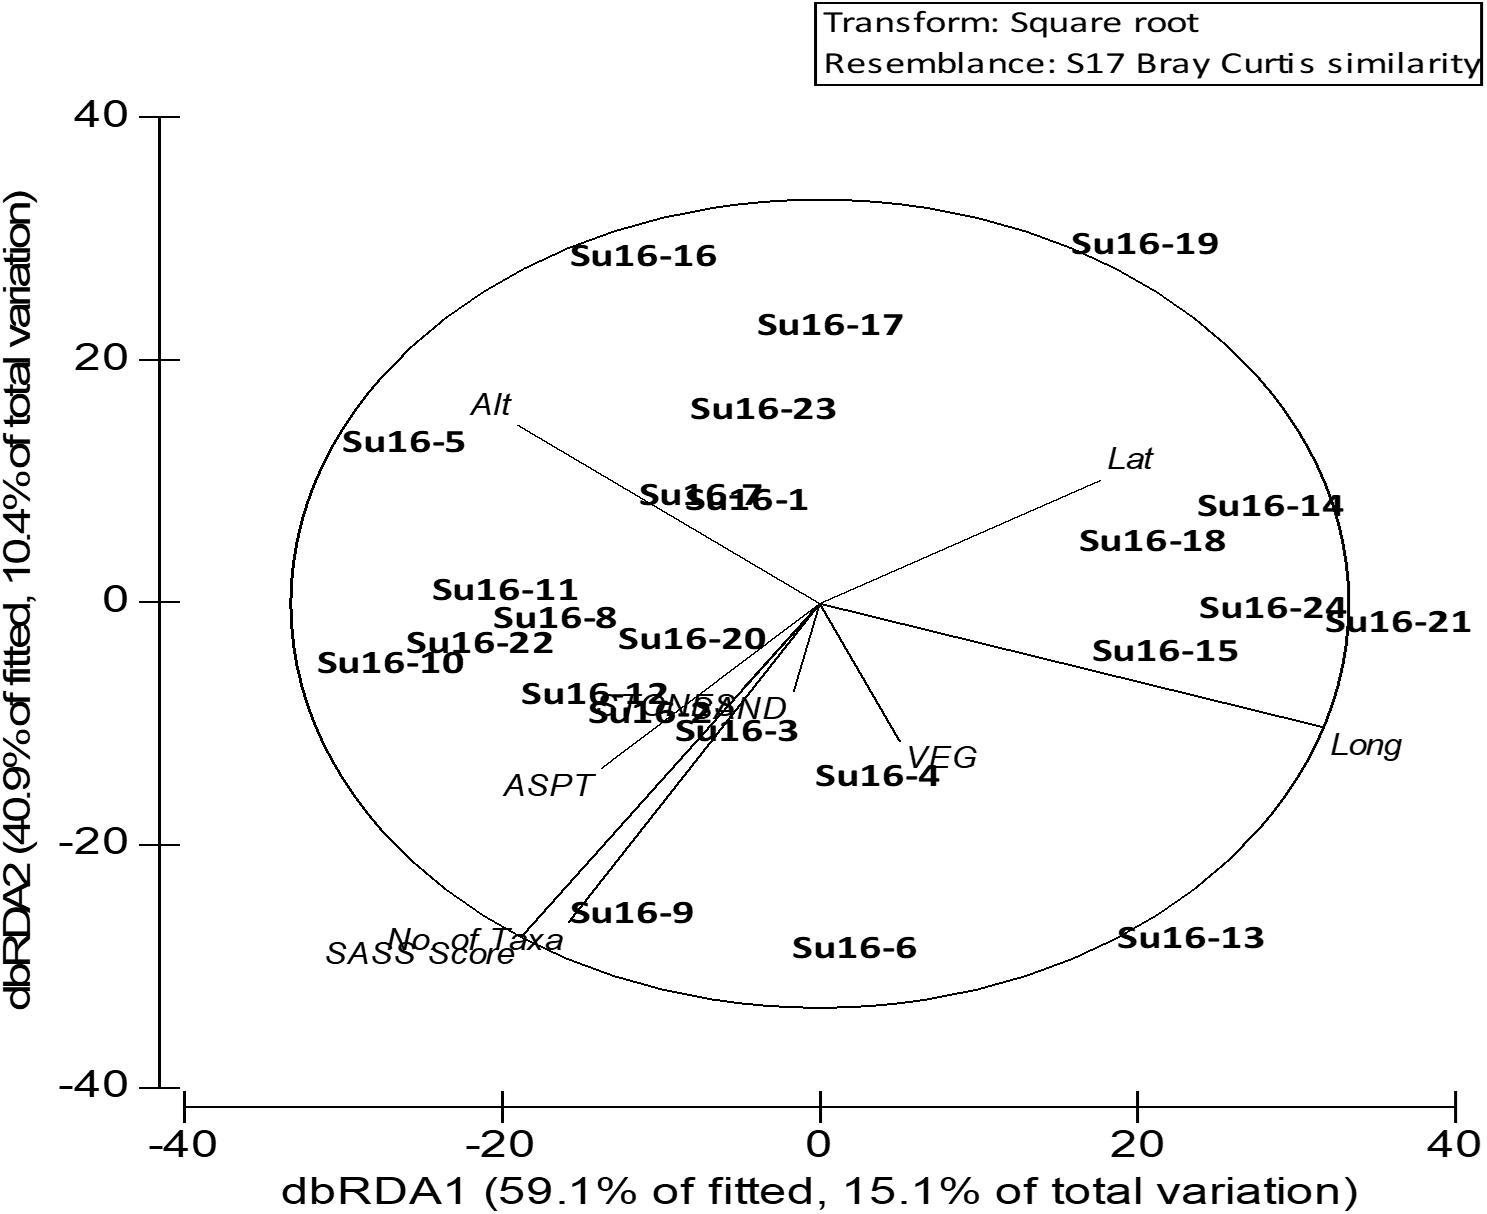
Figure 3. Redundancy Analysis (RDA) of SASS indices, biotope availability and geographic location, using macroinvertebrate abundance in KwaZulu-Natal rivers in summer 2016. Alt, altitude; Lat, latitude; Long, longitude; VEG, vegetation; ASPT, average score per taxon; SASS Score, South African Scoring System score; Su16, summer 2016.
Classification Strength
Macroinvertebrate taxa composition within all classification groups of KZN rivers were not significantly different, as indicated by the Global R-values (Table 4). Hence their reference conditions can be used interchangeably in assessing the rivers between the groups (Table 4). All the groups had significant differences (p < 0.05) and could not be used as reference sites in assessing the sites between the groups. This showed that all the classification groups had higher within-class similarity than between-class similarity. The ecoregion classification had the largest Global R-value. The pairwise results suggested that seven pairs of ecoregions were significantly similar, while the three pairs were different (Table 4). Macroinvertebrate taxa compositions were considered homogenous within classification groups, but not between groups (Figure 3). The rating, based on the Global R-values showed that ecoregions had the highest classification strength, although they were relatively too weak for between-group comparisons. The closer the Global R is to 1, the more positive the result (Clarke, 1993; Clarke and Warwick, 1994, 2001).
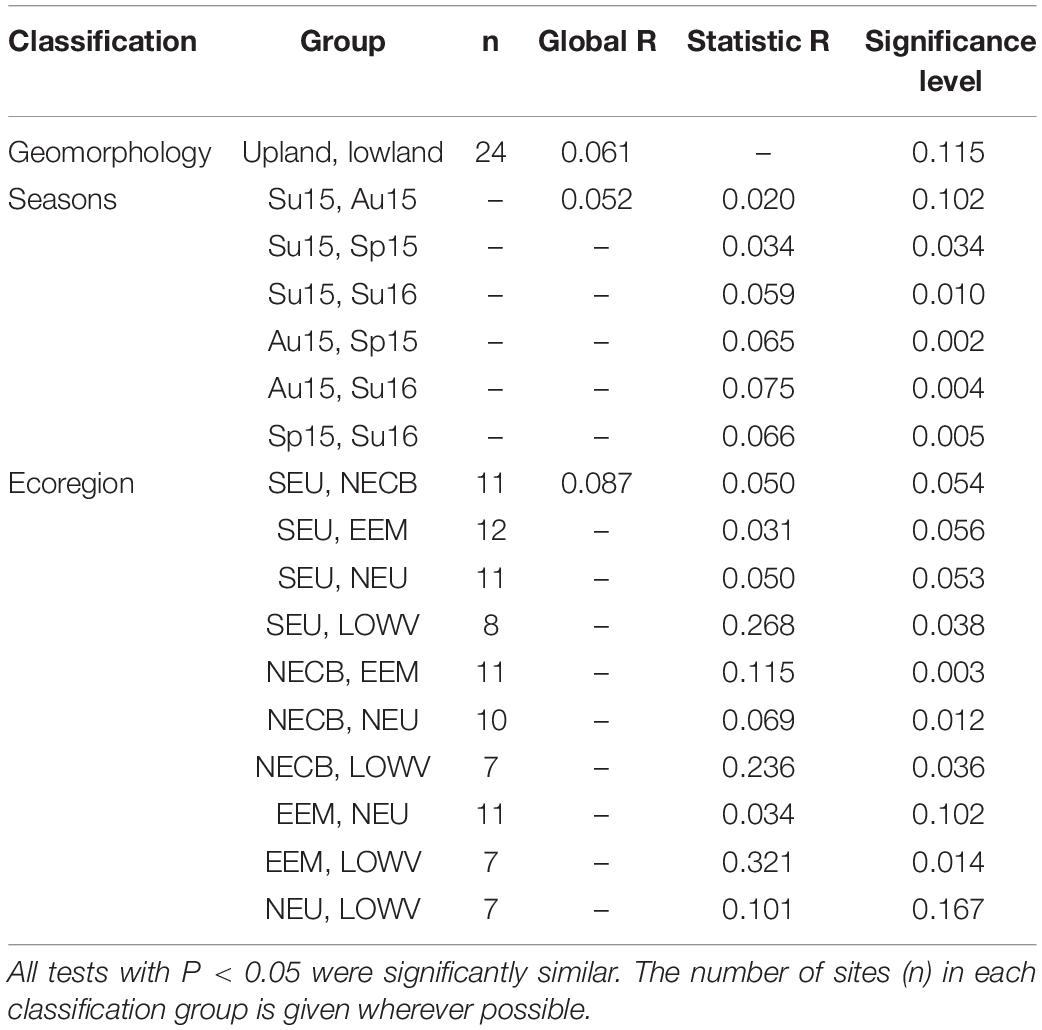
Table 4. Pairwise tests of the analysis of similarity (ANOSIM), indicating the Global R, and Statistic R-values in the present study.
Discussion
The expectation that there was no ecological class boundary between sites of different ecoregions was rejected, because of high dissimilarities obtained in the pairwise test results. There is typically close interconnectivity in the establishment of reference conditions and the establishment of ecological quality class boundaries (Wallin et al., 2003). Identification of least impacted or reference conditions is important in establishing the ecological status of a river system. However, establishing ecological status or class boundaries can only be possible with the existence of reliable RCs (Economou, 2002; Chaves et al., 2006). The inception phase of reference conditions selection is crucial to ecological evaluations (Swetnam et al., 1999). Hence, there is need for careful selection because the reference sites will form the evaluation standards for evaluating other sites (Barbour et al., 1996).
Site Selection and Validation
The identification and selection of undisturbed or minimally disturbed lowland rivers were difficult, and the few included in this study had the best applicable conditions. Sites with incomplete datasets and unstable habitat conditions were excluded from further analyses. Site validation is essential in the determination of RCs because it provides the quantitative measurements of both biotic and abiotic variables that characterize a river system and helps to confirm or refine the pre-selection criteria (Barbour et al., 1996; Chaves et al., 2006). Thus, we adapted the method of Chaves et al. (2006) for site validation, where the biological indices used for validation were the riparian vegetation and macroinvertebrate compositions (Table 5).
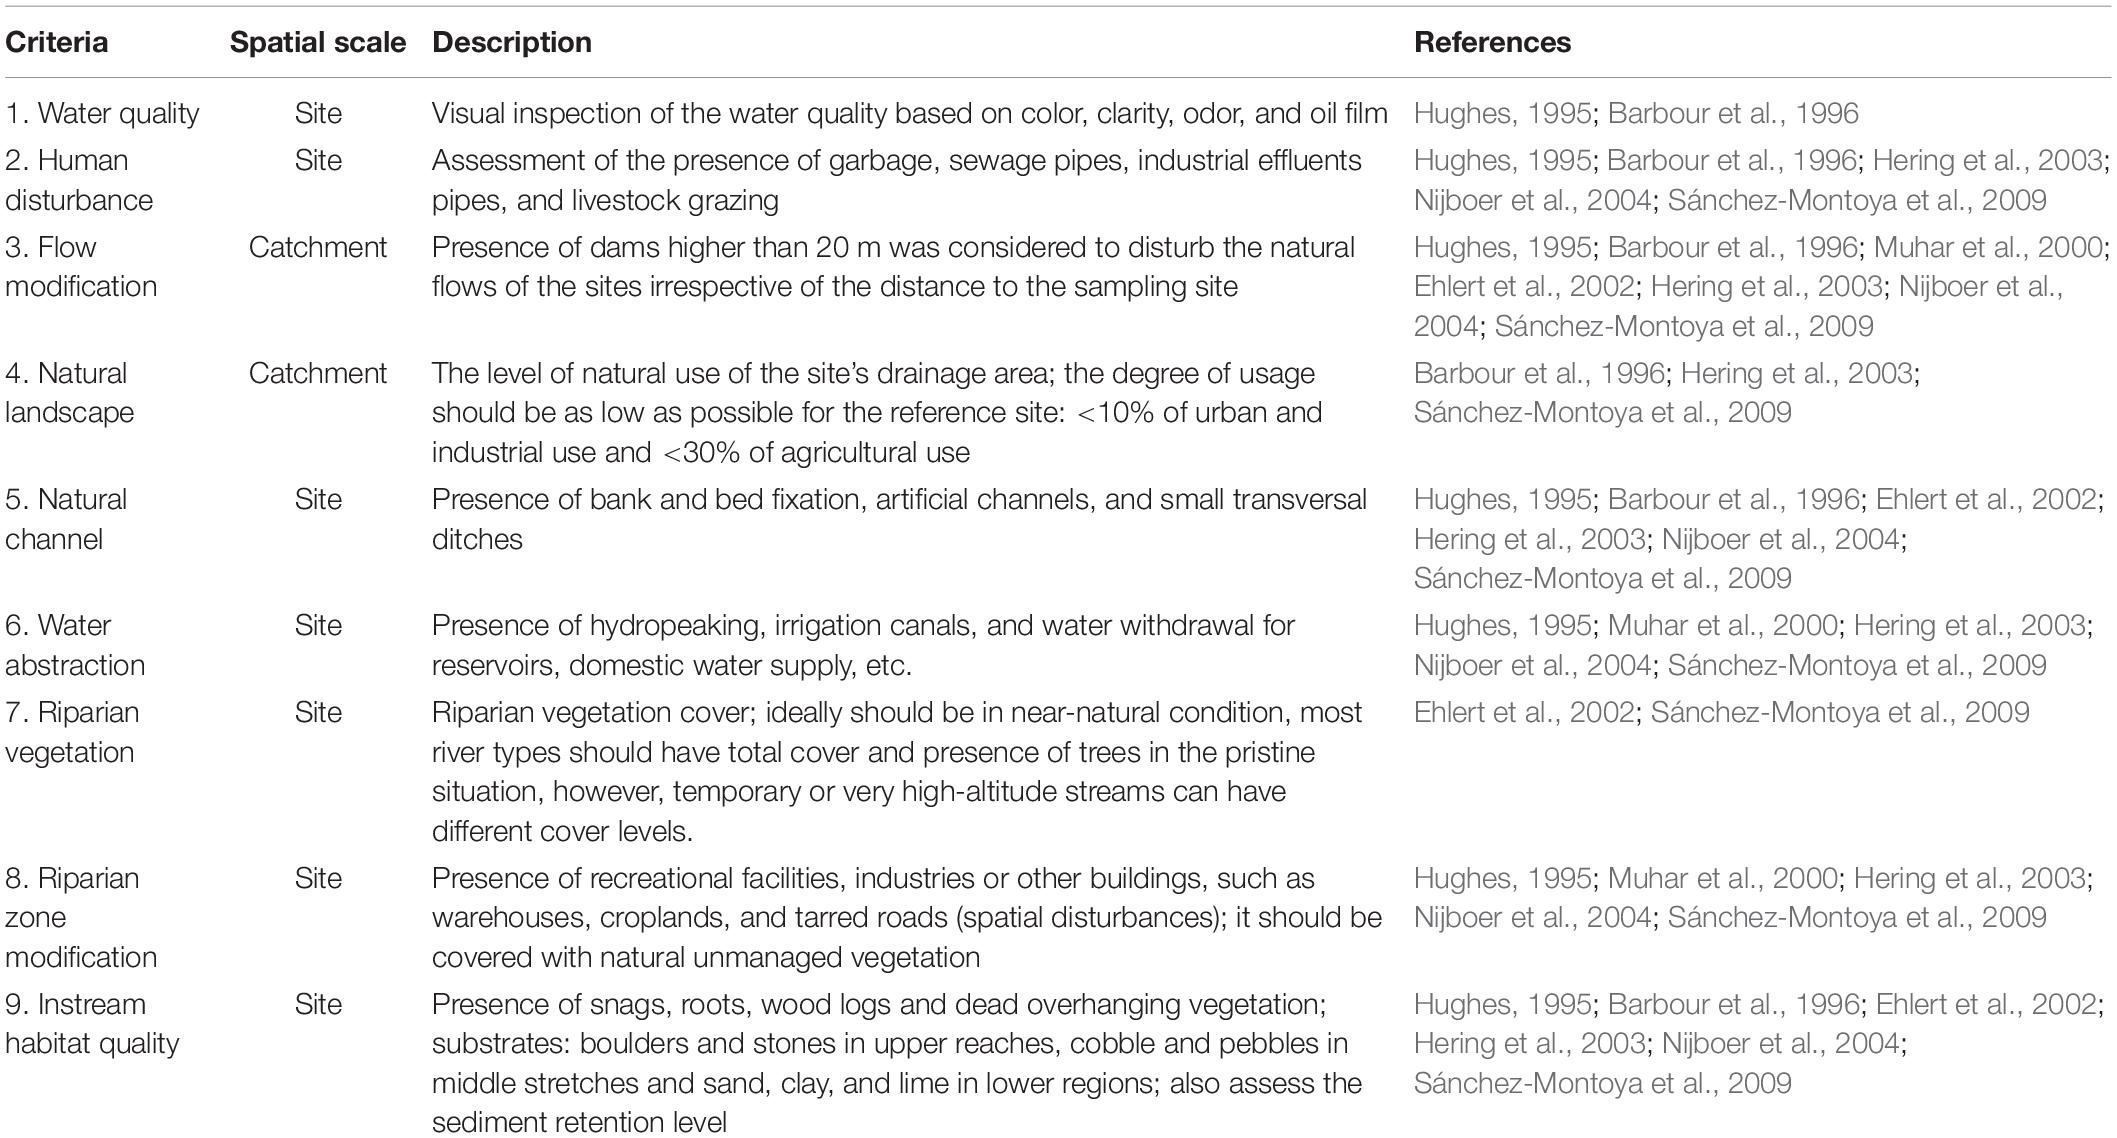
Table 5. Selection criteria for minimally disturbed KwaZulu-Natal river sites (adapted from Chaves et al., 2006).
Many of the lowland rivers of KZN failed the selection criteria, especially in the northern part as there were limited macroinvertebrate biotopes, severe river channel modifications and prevailing drought conditions. The established criteria for the selection and validation of reference conditions for this study involved the inclusion of a certain level of human disturbance or exposure to anthropogenic disturbances (Barbour et al., 1996; Economou, 2002; Bailey et al., 2004). This is because biomonitoring professionals believe that only a few pristine reference conditions still exist in the world (Stoddard, 2004). It was suggested that the absence of a criterion could be as problematic as selecting the wrong one (Chaves et al., 2006).
Analysis of Similarity
At the ecoregional scale examined in this study, macroinvertebrate assemblages showed distinct separation, as the percentage dissimilarities were high between ecoregions. The lowest dissimilarity percentage occurred between the eastern escarpment mountain (EEM) and northeastern upland (NEU) (Dissimilarity = 69.6%, 36 macroinvertebrate taxa), with EEM comprising six upland sites and NEU comprising of three upland and two lowland sites. The highest dissimilarity percentage occurred between southeastern uplands (SEU) and lowveld (LOWV) ecoregions (Dissimilarity = 81.8%, 35 macroinvertebrate taxa), with SEU comprising of three upland and three lowland sites, and LOWV comprising of two upland sites. Taxa richness between the ecoregions was similar, although taxa compositions were slightly different. While the five ecoregions had a high within-group similarities and taxa richness, the low similarity percentage (13.8%) and taxa richness (13) in the lowveld ecoregion could be a consequence of the low number of sites (2) within the region.
While ecoregional classifications based on macroinvertebrate assemblages are capable of partitioning variability in macroinvertebrate assemblages, an amount of variation in the spatial factors often remains within the classification classes (Dallas, 2004a; Stoddard et al., 2006). These factors may be at the level of river type or other aspects, such as width, depth, substratum, biotope availability, hydrological-type, and canopy cover (Dallas, 2004a; Hawkins et al., 2010). This study revealed that some upland and lowland sites were similar within the same ecoregion, though were partitioned by the longitudinal gradients. Hence, supporting the suggestion of Dallas (2004b) that, longitudinal partitioning may be incorporated into bioassessment in South Africa by separating upland sites from the lowland ones. Many studies have reported distinct differentiations in biotic assemblages between montane and non-montane regions (Tate and Heiny, 1995; Dallas, 2004a); also, that topography and climate are good partitions of biotic variation (Hawkins and Vinson, 2000). Our results showed that river types or geomorphology (upland and lowland river types) have distinct macroinvertebrate assemblages (75% variation), which showed that the RCs of each river types were different in terms of taxa composition. Our study showed macroinvertebrate taxa composition within all classification groups of KZN rivers were not significantly different, as indicated by the Global R-values. This means that sites that fall within the same groups can be used in the comparing of impaired sites in bioassessment. All groups having significant between-group differences (p < 0.05) cannot be used as reference sites in assessing each other.
Classification is a major step in bioassessment because it partitions naturally occurring variation among sites and thus allows to specify an ecologically meaningful standard against which potentially impaired sites can be compared (Van Sickle and Hughes, 2000). The ability to detect impairment is a direct function of how well classifications partition natural variation among sites (Hawkins et al., 2000a,b). Good classifications are considered to be accurate and thus unbiased in bioassessment (Ostermiller and Hawkins, 2004). Mean similarity dendrograms convey classification strengths through conceptually simple comparisons of within-class and between-class similarities, which make it an attractive non-technical tool for evaluating environmentally oriented land classifications (Van Sickle, 1997).
Conclusion
River biomonitoring practitioners have often identified potential reference sites using various methods, although the protocols for selecting these sites vary (Davies and Jackson, 2006; Stoddard et al., 2006; Dallas, 2013). The advantage of the multivariate approach for selecting reference sites is that it does not make any prior assumption of the faunal compositions, but it uses a weighting method to predict taxa assemblages or composition, thus making it a useful method for selecting RCs (Reynoldson et al., 1997; Legendre and Gauthier, 2014). Cluster and ordination analyses, together with analyses of classification strength of the different ecoregional and faunal classifications suggested that macroinvertebrate assemblages correlate to regional classifications; hence within-class similarity exceeded between-class similarity (Dallas, 2004a).
Regional classification of sites, particularly of reference sites, has a potential for the management of aquatic resources by providing a framework for bioassessment (Omernik and Griffith, 1991; Dallas, 2004a). However, this only holds if the regional classification reflects actual spatial differences in the ecosystem component or components being managed (Dallas, 2004a,b). Choice of classification system may sometimes depend on the ease of assigning new sites to classes (Gerritsen et al., 2000). Recently, site classification is often made by predictive models that provide a link between environmental variables and faunal assemblages (Wright, 1995; Smith et al., 1999; Kleynhans and Louw, 2007; Thirion, 2007). Homogeneous regions delineated along spatial lines provide for an easier and more logical classification system than non-spatial ones since the grouping of sites is determined by similarity or homogeneity of the region within which the assessment is conducted (Omernik and Griffith, 2014). Fauna classification of sites requires large sets of internally consistent data, obtained from carefully planned and spatially distributed sampling efforts (Van Sickle and Hughes, 2000). SASS score effectively differentiated the upland sites from the lowland sites. The results obtained from the analyses of the SASS scores further showed that macroinvertebrate quality values (sensitivity scores) are important in the assessment and classification of RCs when using macroinvertebrates as indicators of the ecosystem. Hence, a high SASS score represents a good RC.
Our results revealed high levels of inconsistent macroinvertebrate data in the lowland rivers of KZN, which was mainly because of natural disturbances (e.g., drought) and not pollution or water quality degradation. Most of the lowland rivers within KZN failed the selection and validation process, especially in the widely used national macroinvertebrate biotic index (SASS5), riparian vegetation cover and biotope or substrate availability. The implication of this is that these sites, especially the small tributary streams, may not have effective RCs which could be used in their assessment. Also, there is scarce or paucity of data which could suffice for setting the RCs for these lowland rivers, hence it is recommended that a type-specific RC should be developed for them. This could be achieved by using multivariate analysis and other appropriate statistical tools. However, the selection and validation of RCs should be a continuous process incorporating generation of hypotheses, rigorous data analyses and modification of hypotheses (Gerritsen et al., 2000; Dallas, 2004a; Hawkins et al., 2010).
Data Availability Statement
The raw data supporting the conclusions of this article will be made available by the authors, without undue reservation, to any qualified researcher.
Author Contributions
OA conceived the manuscript with CD and GO’B. OA collected and analyzed the data and wrote the manuscript. CD and GO’B supervised the study and contributed valuable comments to the manuscript. All authors contributed to the article and approved the submitted version.
Funding
This research was partly funded by the Department of Water and Sanitation (ZA) and uMgeni Water (ZA) through the River Health Program Project of KwaZulu-Natal Province. The National Research Foundation (ZA), provided a doctoral scholarship during this study to OA and supported a SARChI Chair for CD. The University of KwaZulu-Natal (ZA) also provided funding.
Conflict of Interest
The authors declare that the research was conducted in the absence of any commercial or financial relationships that could be construed as a potential conflict of interest.
Acknowledgments
We thank Ezemvelo KZN Wildlife and Fountainhill Farm Estate for providing accommodation during fieldwork. The staff and students of the Aquatic Ecosystem Research Group, University of KwaZulu-Natal (ZA) are thanked for their assistance with fieldwork and laboratory analyses. The content of this manuscript has been published (in part) as part of the thesis of Agboola (2017). We are most grateful to the reviewers for their constructive comments.
References
Agboola, O. A. (2017). Monitoring and Assessment of Macroinvertebrate Communities in Support of River Health Management in KwaZulu-Natal, South Africa. Ph. D thesis, University of KwaZulu-Natal, Pietermaritzburg.
Bailey, R. C., Norris, R. H., and Reynoldson, T. B. (eds) (2004). “Bioassessment of freshwater ecosystems,” in Bioassessment of Freshwater Ecosystems (Cham: Springer), 1–15. doi: 10.1007/978-1-4419-8885-0_1
Barbour, M., Gerritsen, J., Griffith, G., Frydenborg, R., McCarron, E., White, J., et al. (1996). A framework for biological criteria for Florida streams using benthic macroinvertebrates. J. N. Am. Benthol. Soc. 101, 185–211. doi: 10.2307/1467948
Bouleau, G., and Pont, D. (2015). Did you say reference conditions? Ecological and socio-economic perspectives on the European Water Framework Directive. Environ. Sci. Pol. 47, 32–41. doi: 10.1016/j.envsci.2014.10.012
Chaves, M., Costa, J., Chainho, P., Costa, M., and Prat, N. (2006). Selection and validation of reference sites in small river basins. Hydrobiology 573, 133–154. doi: 10.1007/s10750-006-0270-5
Chaves, M. L., Chainho, P. M., Costa, J. L., Prat, N., and Costa, M. J. (2005). Regional and local environmental factors structuring undisturbed benthic macroinvertebrate communities in the Mondego River basin, Portugal. Archiv. Hydrobiol. 163, 497–523. doi: 10.1127/0003-9136/2005/0163-0497
Chessman, B. C. (2006). Prediction of riverine fish assemblages through the concept of environmental filters. Mar. Fresh. Res. 57, 601–609. doi: 10.1071/mf06091
Chessman, B. C., Muschal, M., and Royal, M. J. (2008). Comparing apples with apples: use of limiting environmental differences to match reference and stressor-exposure sites for bioassessment of streams. R. Res. Appl. 24, 103–117. doi: 10.1002/rra.1053
Chessman, B. C., and Royal, M. J. (2004). Bioassessment without reference sites: use of environmental filters to predict natural assemblages of river macroinvertebrates. J. N. Am. Benthol. Soc. 23, 599–615. doi: 10.1899/0887-3593(2004)023<0599:bwrsuo>2.0.co;2
Clarke, K. R. (1993). Non-parametric multivariate analyses of changes in community structure. Aus. J. Ecol. 18, 117–143. doi: 10.1111/j.1442-9993.1993.tb00438.x
Clarke, K. R., and Warwick, R. M. (1994). Similarity-based testing for community pattern: the two-way layout with no replication. Mar. Biol. 118, 167–176. doi: 10.1007/bf00699231
Clarke, K. R., and Warwick, R. M. (2001). Change in Marine Communities: An Approach to Statistical Analysis and Interpretation, 2nd Edn, Plymouth: PRIMER-E.
Dallas, H. F. (2002). Spatial and Temporal Heterogeneity in Lotic Systems: Implications for Defining Reference Conditions for Macroinvertebrates. WRC Report No. KV 128/2. Pretoria: Water Research Commission.
Dallas, H. F. (2004a). Seasonal variability of macroinvertebrate assemblages in two regions of South Africa: implications for aquatic bioassessment. A. J. Aqua. Sci. 29, 173–184. doi: 10.2989/16085910409503808
Dallas, H. F. (2004b). Spatial variability in macroinvertebrate assemblages: comparing regional and multivariate approaches for classifying reference sites in S. A. J. Aqua. Sci. 29, 161–171. doi: 10.2989/16085910409503807
Dallas, H. F. (2013). Ecological status assessment in Mediterranean rivers: complexities and challenges in developing tools for assessing ecological status and defining reference conditions. Hydrobiology 719, 483–507. doi: 10.1007/s10750-012-1305-8
Davies, S. P., and Jackson, S. K. (2006). The biological condition gradient: a descriptive model for interpreting change in aquatic ecosystems. Ecol. Appl. 16, 1251–1266. doi: 10.1890/1051-0761(2006)016[1251:tbcgad]2.0.co;2
De Pauw, N., Gabriels, W., and Goethals, P. L. (2006). “River monitoring and assessment methods based on macroinvertebrates,” in Biological Monitoring of Rivers: Applications and Perspectives, Water Quality Measurements, eds G. Ziglio, M. Siligardi, and G. Flaim (Hoboken, NJ: Wiley), 113–134. doi: 10.1002/0470863781.ch7
Department of Water Affairs and Forestry [DWAF] (2008). National Aquatic Ecosystem Health Monitoring Programme (NAEHMP): River Health Programme (RHP Implementation Manual. Version 2. Pretoria: Department of Water Affairs and Forestry.
Department of Water and Sanitation [DWS] (2016). River Eco-Status Monitoring Programme (REMP). Pretoria: Department of Water and Sanitation [DWS].
Dickens, C. W., and Graham, P. (2002). The South African Scoring System (SASS) version 5 rapid bioassessment method for rivers. A. J. Aqua. Sci. 27, 1–10. doi: 10.2989/16085914.2002.9626569
Economou, A. (2002). Defining Reference Conditions (D3). Development, Evaluation & Implementation of a Standardized Fish-based Assessment Method for the Ecological Status of European Rivers - A Contribution to the Water Framework Directive. Vienna: University of Natural Resources and Applied Life Sciences.
Ehlert, T., Hering, D., Koenzen, U., Pottgiesser, T., Schuhmacher, H., and Friedrich, G. (2002). Typology and type specific reference conditions for medium sized and large rivers in Northrhine-Westphalia: Methodological and biological aspects. Int. Rev. Hydrobiol. 87, 151–163. doi: 10.1002/1522-2632(200205)87:2/3<151::aid-iroh151>3.0.co;2-a
European Commission (2000). Directive of the European Parliament and of the Council 2000/60/EC Establishing a Framework for Community actiOn in the Field of Water Policy. Brussels: Comunidad Europea.
Gerber, A., and Gabriel, M. J. M. (2002). Aquatic Invertebrates of South African Rivers: Illustrations. Resource Quality Services. Pretoria: Department of Water Affairs and Forestry.
Gerritsen, J., Barbour, M. T., and King, K. (2000). Apples, oranges, and ecoregions: on determining pattern in aquatic assemblages. J. N. Am. Benthol. Soc. 19, 487–496. doi: 10.2307/1468109
Harding, J. S., Winterbourn, M. J., and Mcdiffett, W. F. (1997). Stream faunas and ecoregions in South Island, New Zealand: do they correspond? Arch. Hydrobiol. 140, 289–307. doi: 10.1127/archiv-hydrobiol/140/1997/289
Hawkins, C. P., Norris, R. H., Gerritsen, J., Hughes, R. M., Jackson, S. K., Johnson, R. K., et al. (2000a). Evaluation of the use of landscape classifications for the prediction of freshwater biota: synthesis and recommendations. J. N. Am. Benthol. Soc. 19, 541–556. doi: 10.2307/1468113
Hawkins, C. P., Norris, R. H., Hogue, J. N., and Feminella, J. W. (2000b). Development and evaluation of predictive models for measuring the biological integrity of streams. Ecol. Appl. 10, 1456–1477. doi: 10.1890/1051-0761(2000)010[1456:daeopm]2.0.co;2
Hawkins, C. P., Olson, J. R., and Hill, R. A. (2010). The reference condition: predicting benchmarks for ecological and water-quality assessments. J. N. Ame. Benthol. Soc. 29, 312–343. doi: 10.1899/09-092.1
Hawkins, C. P., and Vinson, M. R. (2000). Weak correspondence between landscape classification and stream invertebrate assemblages: implications for bioassessment. J. N. Ame. Benthol. Soc. 19, 501–517. doi: 10.2307/1468111
Hering, D., Buffagni, A., Moog, O., Sandin, L., Sommerhäuser, M., Stubauer, I., et al. (2003). The development of a system to assess the ecological quality of streams based on macroinvertebrates-design of the sampling programme within the AQEM project. Int. Rev. Hydrobiol. 88, 345–361. doi: 10.1002/iroh.200390030
Hughes, R. M. (1995). “Defining acceptable biological status by comparing with reference conditions,” in Biological Assessment and Criteria. Tools for Water Resource Planning and Decision Making, eds W. S. Davies and T. P. Simon (Boca Raton, FL: Lewis Publishers), 31–47. doi: 10.1201/9789047403289-7
Karr, J. R. (1981). Assessment of biotic integrity using fish communities. Fish 6, 21–27. doi: 10.1577/1548-8446(1981)006<0021:aobiuf>2.0.co;2
Kleynhans, C., and Louw, M. (2007). Module A: Ecoclassification and Ecostatus Determination in River Ecoclassification: Manual for EcoStatus Determination (Version 2). Water Research Commission Report No. TT, 329/08. Pretoria: Water Research Commission.
Kleynhans, C. J. (2007). Module D: Fish Response Assessment Index in River Ecoclassification: Manual for Ecostatus Determination (Version 2) Joint Water Research Commission and Department of Water Affairs and Forestry Report. WRC Report No. TT 330/08. Pretoria: Water Research Commission.
Kleynhans, C. J., MacKenzie, J., and Louw, M. D. (2007). Module F: Riparian Vegetation Response Assessment Index in River Ecoclassification: Manual for Ecostatus Determination (Version 2). Joint Water Research Commission and Department of Water Affairs and Forestry Report. WRC Report No. TT 333/08. Pretoria: Water Research Commission.
Kleynhans, C. J., Mackenzie, J., and Louw, M. D. (2008). River Ecoclassification: Manual for EcoStatus Determination (Version 2) Module F: Riparian Vegetation Response Assessment Index (VEGRAI). Water Research Commission and Department of Water Affairs and Forestry, Pretoria. WRC Report No. TT333/08. Pretoria: Water Research Commission.
Kleynhans, C. J., Thirion, C., and Moolman, J. (2005). A Level 1 River Ecoregion Classification System for South Africa, Lesotho and Swaziland. Pretoria: Department of Water Affairs and Forestry.
Ladson, A. R., White, L. J., Doolan, J. A., Finlayson, B. L., Hart, B. T., Lake, P. S., et al. (1999). Development and testing of an Index of Stream condition for waterway management in Australia. Fresh. Biol. 41, 453–468. doi: 10.1046/j.1365-2427.1999.00442.x
Legendre, P., and Gauthier, O. (2014). Statistical methods for temporal and space-time analysis of community composition data. Proc. R. Soc. Lond. B: Biol. Sci. 281, 2013–2728. doi: 10.1098/rspb.2013.2728
Marchant, R., Well, F., and Newall, P. (2000). Assessment of an ecoregion approach for classifying macroinvertebrate assemblages from streams in Victoria, Australia. J. N. Am. Benthol. Soc. 19, 497–500. doi: 10.2307/1468110
Meinson, P., Idrizaj, A., Nõges, P., Nõges, T., and Laas, A. (2015). Continuous and high-frequency measurements in limnology: history, applications, and future challenges. Environ. Rev. 24, 52–62. doi: 10.1139/er-2015-0030
Moolman, J. (2008). River Long Profiles Aid in Ecological Planning. PositionIT Jan/Feb: 43-47. Available online at: https://www.ee.co.za/wp-content/uploads/legacy/VisuaT%20-%20River%20long%20profiles%20aid%20in.pdf (accessed November, 2015).
Muhar, S., Schwarz, M., Schmutz, S., and Jungwirth, M. (2000). Identification of rivers with high and good habitat quality: methodological approach and applications in Austria. Hydrobiologia 422, 343–358. doi: 10.1007/978-94-011-4164-2_28
Muxika, I., Borja, A., and Bald, J. (2007). Using historical data, expert judgement and multivariate analysis in assessing reference conditions and benthic ecological status, according to the European Water Framework Directive. Mar. Poll. Bull. 55, 16–29. doi: 10.1016/j.marpolbul.2006.05.025
Nijboer, R. C., Johnson, R. K., Verdonschot, P. F. M., Sommerhauser, M., and Buagni, A. (2004). Establishing reference conditions for European streams. Hydrobiology 516, 91–105. doi: 10.1023/b:hydr.0000025260.30930.f4
Nixon, S., Trent, Z., Marcuello, C., and Lallana, C. (2003). Europe’s Water: An Indicator-Based Assessment. EEA/92-9167-581-4. Topic report 1/2003. Copenhagen: European Environment Agency.
Omernik, J. M., and Griffith, G. E. (1991). Ecological regions versus hydrologic units: frameworks for managing water quality. J. S. Water Conserv. 46, 334–340.
Omernik, J. M., and Griffith, G. E. (2014). Ecoregions of the conterminous United States: evolution of a hierarchical spatial framework. Environ. Manag. 54, 1249–1266. doi: 10.1007/s00267-014-0364-1
Ostermiller, J. D., and Hawkins, C. P. (2004). Effects of sampling error on bioassessments of stream ecosystems: application to RIVPACS-type models. J. N. Am. Benthol. Soc. 23, 363–382. doi: 10.1899/0887-3593(2004)023<0363:eoseob>2.0.co;2
Petersen, R. C. (1992). The RCE: a riparian, channel, and environmental inventory for small streams in the agricultural landscape. Fresh. Biol. 27, 295–306. doi: 10.1111/j.1365-2427.1992.tb00541.x
Ravichandrana, S., Ramanibai, R., and Pundarikanthan, N. V. (1996). Ecoregions for describing water quality patterns in Tamiraparani basin, South India. J. Hydrol. 178, 257–276. doi: 10.1016/0022-1694(95)02801-3
Reynoldson, T., Norris, R., Resh, V., Day, K., and Rosenberg, D. (1997). The reference condition: a comparison of multimetric and multivariate approaches to assess water quality impairment using benthic macroinvertebrates. J. N. Ame. Benthol. Soc. 16, 833–852. doi: 10.2307/1468175
Roux, D. J. (2001). Strategies used to guide the design and implementation of a national river monitoring programme in South Africa. Environ. Mon. Assess. 69, 131–158. doi: 10.1023/A:1010793505708
Rowntree, K. M., Wadeson, R. A., and O’Keeffe, J. (2000). The development of a geomorphological classification system for the longitudinal zonation of South African Rivers. S. A. Geog. J. 82, 163–172. doi: 10.1080/03736245.2000.9713710
Sánchez-Montoya, M. M., Vidal-Abarca, M. R., Puntí, T., Poquet, J. M., Prat, N., Rieradevall, M., et al. (2009). Defining criteria to select reference sites in Mediterranean streams. Hydrobiology 619, 39–54. doi: 10.1007/s10750-008-9580-0
Schlacher, T. A., Schoeman, D. S., Jones, A. R., Dugan, J. E., Hubbard, D. M., Defeo, O., et al. (2014). Metrics to assess ecological condition, change, and impacts in sandy beach ecosystems. J. Environ. Manag. 144, 322–335. doi: 10.1016/j.jenvman.2014.05.036
Smith, M. J., Kay, W. R., Edward, D. H. D., Papas, P. J., Richardson, K. J., Simpson, J. C., et al. (1999). AusRivAS: using macroinvertebrates to assess ecological condition of rivers in Western Australia. Fresh. Biol. 41, 269–282. doi: 10.1046/j.1365-2427.1999.00430.x
Stoddard, J. L. (2004). Use of ecological regions in aquatic assessments of ecological condition. Environ. Manag. 34, S61–S70. doi: 10.1007/s00267-003-0193-0
Stoddard, J. L., Larsen, D. P., Hawkins, C. P., Johnson, R. K., and Norris, R. H. (2006). Setting expectations for the ecological condition of streams: the concept of reference condition. Ecol. Appl. 16, 1267–1276. doi: 10.1890/1051-0761(2006)016[1267:seftec]2.0.co;2
Swetnam, T. W., Allen, C. D., and Betancourt, J. L. (1999). Applied historical ecology: using the past to manage for the future. Ecol. Appl. 9, 1189–1206. doi: 10.1890/1051-0761(1999)009[1189:aheutp]2.0.co;2
Tate, C. M., and Heiny, J. S. (1995). The ordination of benthic invertebrate communities in the South Platte River Basin in relation to environmental factors. Fresh. Biol. 33, 439–454. doi: 10.1111/j.1365-2427.1995.tb00405.x
Taylor, J. C., Prygiel, J., Vosloo, A., Pieter, A., and van Rensburg, L. (2007). Can diatom-based pollution indices be used for biomonitoring in South Africa? A case study of the Crocodile West and Marico water management area. Hydrobiology 592, 455–464. doi: 10.1007/s10750-007-0788-1
Thirion, C. (2007). Module E: Macroinvertebrate Response Assessment Index (MIRAI). River Ecoclassification Manual for Ecostatus Determination (Version 2): Joint Water Research Commission and Department of Water and Sanitation and Forestry Report. Pretoria: Department of Water and Sanitation.
Thirion, C. (2016). The Determination of Flow and Habitat Requirements for Selected Riverine Macroinvertebrates. Ph. D thesis, North-West University, Potchefstroom.
Turak, E., Flack, L. K., Norris, R. H., Simpson, J., and Waddell, N. (1999). Assessment of river condition at a large spatial scale using predictive models. Fresh. Biol. 41, 283–298. doi: 10.1046/j.1365-2427.1999.00431.x
Van Sickle, J. (1997). Using mean similarity dendrograms to evaluate classifications. J. Agric. Biol. Environ. Stat. 2, 370–388. doi: 10.2307/1400509
Van Sickle, J., and Hughes, R. M. (2000). Classification strengths of ecoregions, catchments, and geographic clusters for aquatic vertebrates in Oregon. J. N. Am. Benthol. Soc. 19, 370–384. doi: 10.2307/1468101
Wallin, M., Wiederholm, T., and Johnson, R. (2003). Guidance on establishing reference conditions and ecological status class boundaries for inland surface waters. CIS Work. Group 2:93.
Wright, J. F. (1995). Development and use of a system for predicting the macroinvertebrate fauna in flowing waters. Aus. J. Ecol. 20, 181–197. doi: 10.1111/j.1442-9993.1995.tb00531.x
Wright, R. G., Murray, M. P., and Merril, T. (1998). Ecoregions as a level of ecological analysis. Biol. Conserv. 86, 207–213. doi: 10.1016/s0006-3207(98)00002-0
Keywords: reference conditions, macroinvertebrate, multivariate analysis, geomorphology, rivers, biomonitoring, ecoregions
Citation: Agboola OA, Downs CT and O’Brien G (2020) A Multivariate Approach to the Selection and Validation of Reference Conditions in KwaZulu-Natal Rivers, South Africa. Front. Environ. Sci. 8:584923. doi: 10.3389/fenvs.2020.584923
Received: 18 July 2020; Accepted: 14 September 2020;
Published: 30 September 2020.
Edited by:
Vinicius Fortes Farjalla, Federal University of Rio de Janeiro, BrazilReviewed by:
Luiz Ubiratan Hepp, Universidade Regional Integrada do Alto Uruguai e das Missões, BrazilMarden Seabra Linares, Federal University of Minas Gerais, Brazil
Copyright © 2020 Agboola, Downs and O’Brien. This is an open-access article distributed under the terms of the Creative Commons Attribution License (CC BY). The use, distribution or reproduction in other forums is permitted, provided the original author(s) and the copyright owner(s) are credited and that the original publication in this journal is cited, in accordance with accepted academic practice. No use, distribution or reproduction is permitted which does not comply with these terms.
*Correspondence: Colleen T. Downs, ZG93bnNAdWt6bi5hYy56YQ==
†ORCID: Colleen T. Downs, orcid.org/0000-0001-8334-1510; Gordon O’Brien, orcid.org/0000-0001-6273-1288
 Olalekan A. Agboola1
 Colleen T. Downs
 Gordon O’Brien