 Lejiang Yu
 Shiyuan Zhong3
 Xi Liang
- 1SOA Key Laboratory for Polar Science, Polar Research Institute of China, Shanghai, China
- 2Southern Marine Science and Engineering Guangdong Laboratory, Zhuhai, China
- 3Department of Geography, Environment, and Spatial Sciences, Michigan State University, East Lansing, MI, United States
- 4Aerospace Information Research Institute, Chinese Academy of Sciences, Beijing, China
- 5National Marine Environmental Forecasting Center, Beijing, China
This study examines trends in the intensity and frequency of short-duration (5 min to 3 h) rainfall extremes in Hong Kong for the period of 1984 to 2010 and the drivers for the trends using gauge observations and gridded reanalysis. Both the intensity and frequency of rainfall extremes exhibit an upward trend, with the slope for the intensity (frequency) trend increasing (decreasing) as duration lengthens from 5 min to 3 h. The upward intensity (frequency) trends appear to be a manifestation of an abrupt change around 1991/1992 (1992/1993) that separates a period of lower and fewer rainfall extremes before from a period of higher and more extremes after. The increase in Hong Kong’s extreme rainfall after the early 1990s is likely caused by a combination of stronger rising motion along Southeast China Coasts and enhanced moisture transport into South China Sea resulting from the strengthening and westward shift of the western Pacific subtropical high associated with anomalous convective activities over the tropical western Indian Ocean and a positive phase circumglobal teleconnection wavetrain.
Introduction
It has been widely recognized that heavy precipitation and the associated flooding events have serious socioeconomical consequences. For example, the 1993 summer floods in the upper Mississippi River Basin of the United States devastated many low-lying communities in the basin and cost the economy nearly $20 billion (Kunkel et al., 1994). Most recently in winter 2019–2020, extremely heavy rainfall associated with three powerful extra tropical cyclones caused widespread flooding across the United Kingdom, resulting in loss of lives and at least €150 million property damages. Understand the trends and variability as well as the drivers of these high impact extreme precipitation events is, therefore, vital for economical and societal activities.
In recent decades, extreme precipitation events have been on the rise in some parts of the world while decreasing in other parts, depending on various factors such as season, period, and geographical location (Easterling et al., 2000; Ghosh et al., 2012). For example, several studies have documented an upward trend of extreme precipitation events across much of the United States and Canada (e.g., Karl et al., 1996; Kunkel et al., 1994; Easterling et al., 2000), Japan (Iwashima and Yamamoto, 1993), Indian (Mukherjee et al., 2018), and Australia (Suppiah and Hennessy, 1998). However, in the United Kingdom (UK) heavy rainfall events have been increasing in winter, but decreasing in summer (Osborn et al., 1999) with substantial interannual variability (Jones et al., 2013; Simpson and Jones, 2014; Brown, 2018). Decreases in extreme precipitation events have been documented for the Sahel region of Nigeria (Tarhule and Woo, 1998) and across most stations in Southeast Asia and the South Pacific (Manton et al., 2001). In addition to changing frequency, the intensity of extreme precipitation events have also been changing and majority of observational evidence has suggested an increasing trend in the intensity, but the slope of the increasing trends vary substantially by region (Donat et al., 2016).
Previous studies have linked the changes in extreme precipitation frequency and intensity to increases in temperature and moisture under global warming caused by increases in anthropogenic greenhouse gas emissions (Min et al., 2011; Ghosh et al., 2012; Mishra et al., 2012; Mukherjee et al., 2018). Atmospheric circulation anomalies also play an important role. For example, the increase frequency of extreme precipitation events in the United States has been linked to the Pacific Decadal Oscillation (PDO) and Atlantic Multidecadal Oscillation (AMO) (Yu et al., 2016). A review of the recent progress toward understanding global observed long-term changes in extreme precipitation is provided by Alexander (2016).
Extreme precipitation events occur on time scales of minutes, days to weeks and among them short-duration (less than one day) events, which are mostly responsible for occurrence of flash floods, is most difficult to forecast in advance (Ahern et al., 2005). Westra et al. (2014) noted that intensity and frequency of sub-daily rainfall extremes have been increasing more rapidly than daily rainfall extremes. The change in sub-daily rainfall extremes have been attributed to local temperature change according to the Clausius-Clapeyron (CC) relation (Pall et al., 2007) and to large-scale atmosphere-ocean variability modes, such as the El Niño–Southern Oscillation (ENSO) and the monsoon systems (Blenkinsop et al., 2018). It is therefore necessary to examine the changes in sub-daily extreme precipitation in the context of internal (atmospheric circulation) and external (e.g., anthropogenic) factors. To this end, the INTElligent use of climate models for adaptation to non-Stationary hydrological Extremes (INTENSE) project sought to understand the past, present and future of sub-daily rainfall extremes using observations and models (Blenkinsop et al., 2018).
The current study focuses on trends in short-duration (≤3 h) extreme rainfall events in Hong Kong. Located in China’s southeast coast surrounded by the South China Sea by all sides except the north side, Hong Kong is subject to extreme rainfall related to the East Asian summer monsoon. The hilly and mountainous terrain makes rainfall patterns highly heterogeneous across the main peninsula and the numerous islands. As a global business and commercial center and one of the most densely populated regions in the world, heavy flooding caused by short-duration extreme precipitation can have a profound socioeconomic impact (Peterson and Kwong, 1981; Lam and Leung, 1994). Hence, understanding the trends and interannual variability of short-duration extreme rainfall events in Hong Kong is becoming increasingly important in the context of global warming and local/regional atmospheric circulation change noted above as potential drivers.
Previous studies have documented an increase in extreme precipitation in Hong Kong in the past. For example, Ginn et al. (2010) reported an increase in the annual number of days with hourly rainfall greater than 30 mm from 1947 to 2008. Wong et al. (2011) found an increase in the frequency of occurrence of extreme 1-, 2-, and 3-hourly rainfall amounts from 1885 to 2008 and a shortened return period of hourly rainfall of more than 100 mm from 37 years in 1900 to 18 years in 2000. Extreme rainfall in Hong Kong in the 21st century is projected to become more frequent. For example, Wu et al. (2006) indicated that the number of days with hourly rainfall of greater than 30 mm will increase from 5.6 days during 1961–1990 to 6.5 days for the period of 2070–2099. However, the changes in the frequency of future hourly extreme rainfall have been based primarily on projections using General Circulation Models (GCMs) with spatial resolutions too coarse to represent convection, the major driver for sub-daily extreme precipitation events (Kendon et al., 2014; Prein et al., 2015). As such, the changes between current and future sub-daily extreme precipitation events projected by coarse resolution models are associated with great uncertainty.
Although aforementioned studies have investigated the trends in extreme rainfall in Hong Kong, few have, to our knowledge, examined trends in and cause for short-duration extreme rainfall events that last from a few minutes to several hours. The relative role of atmospheric circulation and the increased greenhouse gas emissions play in the trends of extreme rainfall needs to be assessed further. The current study will examine trends in short-duration (from 5 min to 3 h) rainfall extremes in Hong Kong with a focus on their relationship to large-scale circulations.
The rest of the paper is organized as follows: the data sets and methods used in the study are described in Section “Data and Methods.” Section “Results” presents the trends of extreme rainfall in Hong Kong and their potential drivers. A summary of the results and discussion are presented in Section “Summary and Discussion.”
Data and Methods
The Geotechnical Engineering Office (GEO) of Civil Engineering and Development Department in Hong Kong has been operating a network of automated rain gauges to collect rainfall data at 5-min time interval since 1984. The number of gauges varied with time, ranging from 42 gauges in the early half of 1984 to 111 gauges in 1999. The data were missing at some gauges for December 30 and 31, 1984 and January 1-June 1, 1985. This study selected 39 GEO rain gauges for the period of 1984 to 2010, when there were no missing data records from these gauges. The locations of the 39 rain gauges are shown in Figure 1 and their coordinates and elevations are given in Table 1. Some quality control procedures were performed to identify and remove suspiciously high rainfall values, determine and remove erroneous values by comparing with other datasets and supplement missing values according to spatial and temporal continuity. More details on the data and quality control can be found in Tang and Cheung (2011).
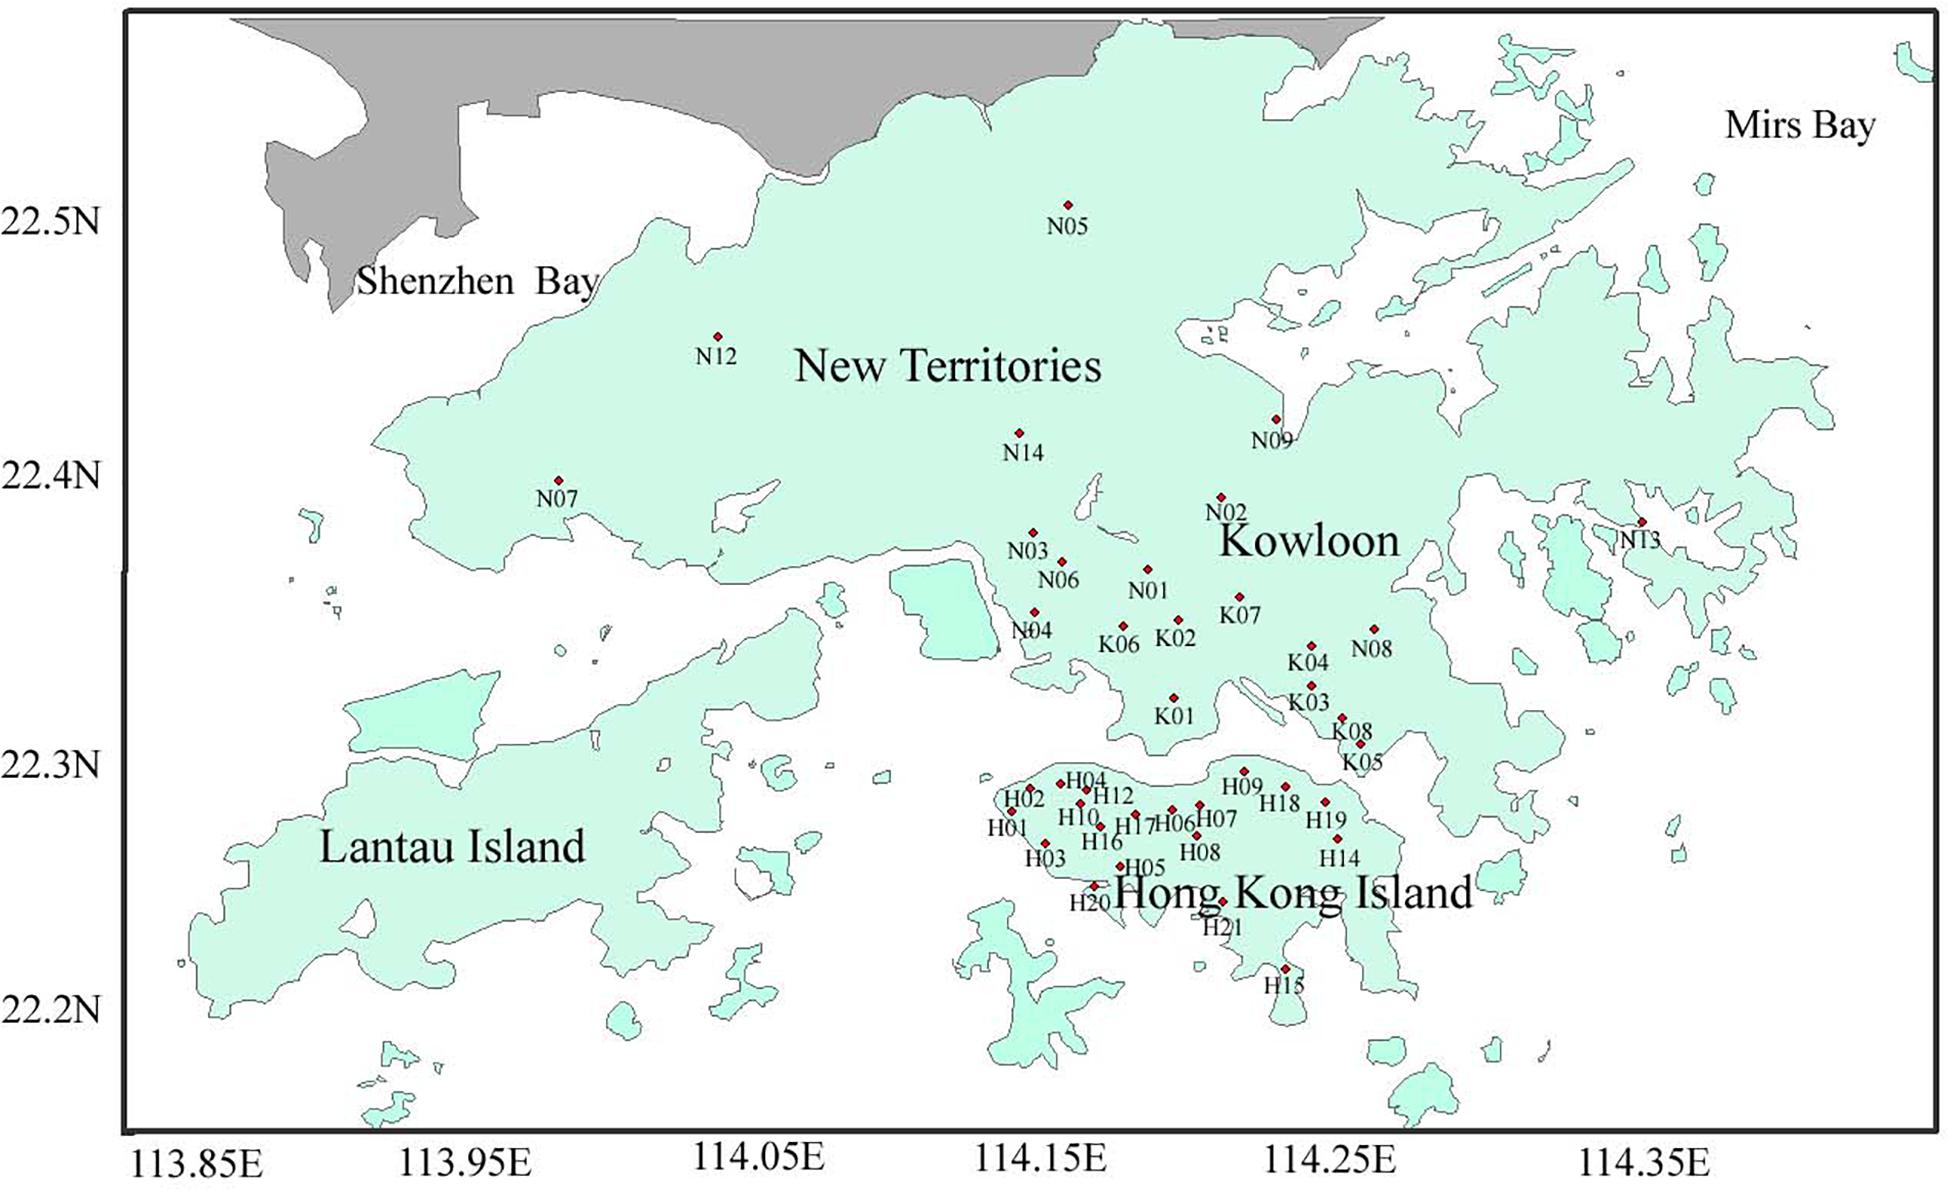
Figure 1. Locations of the 39 GEO rain gauges in Hong Kong. Refer to Table 1 for gauge latitude, longitude, and elevation.
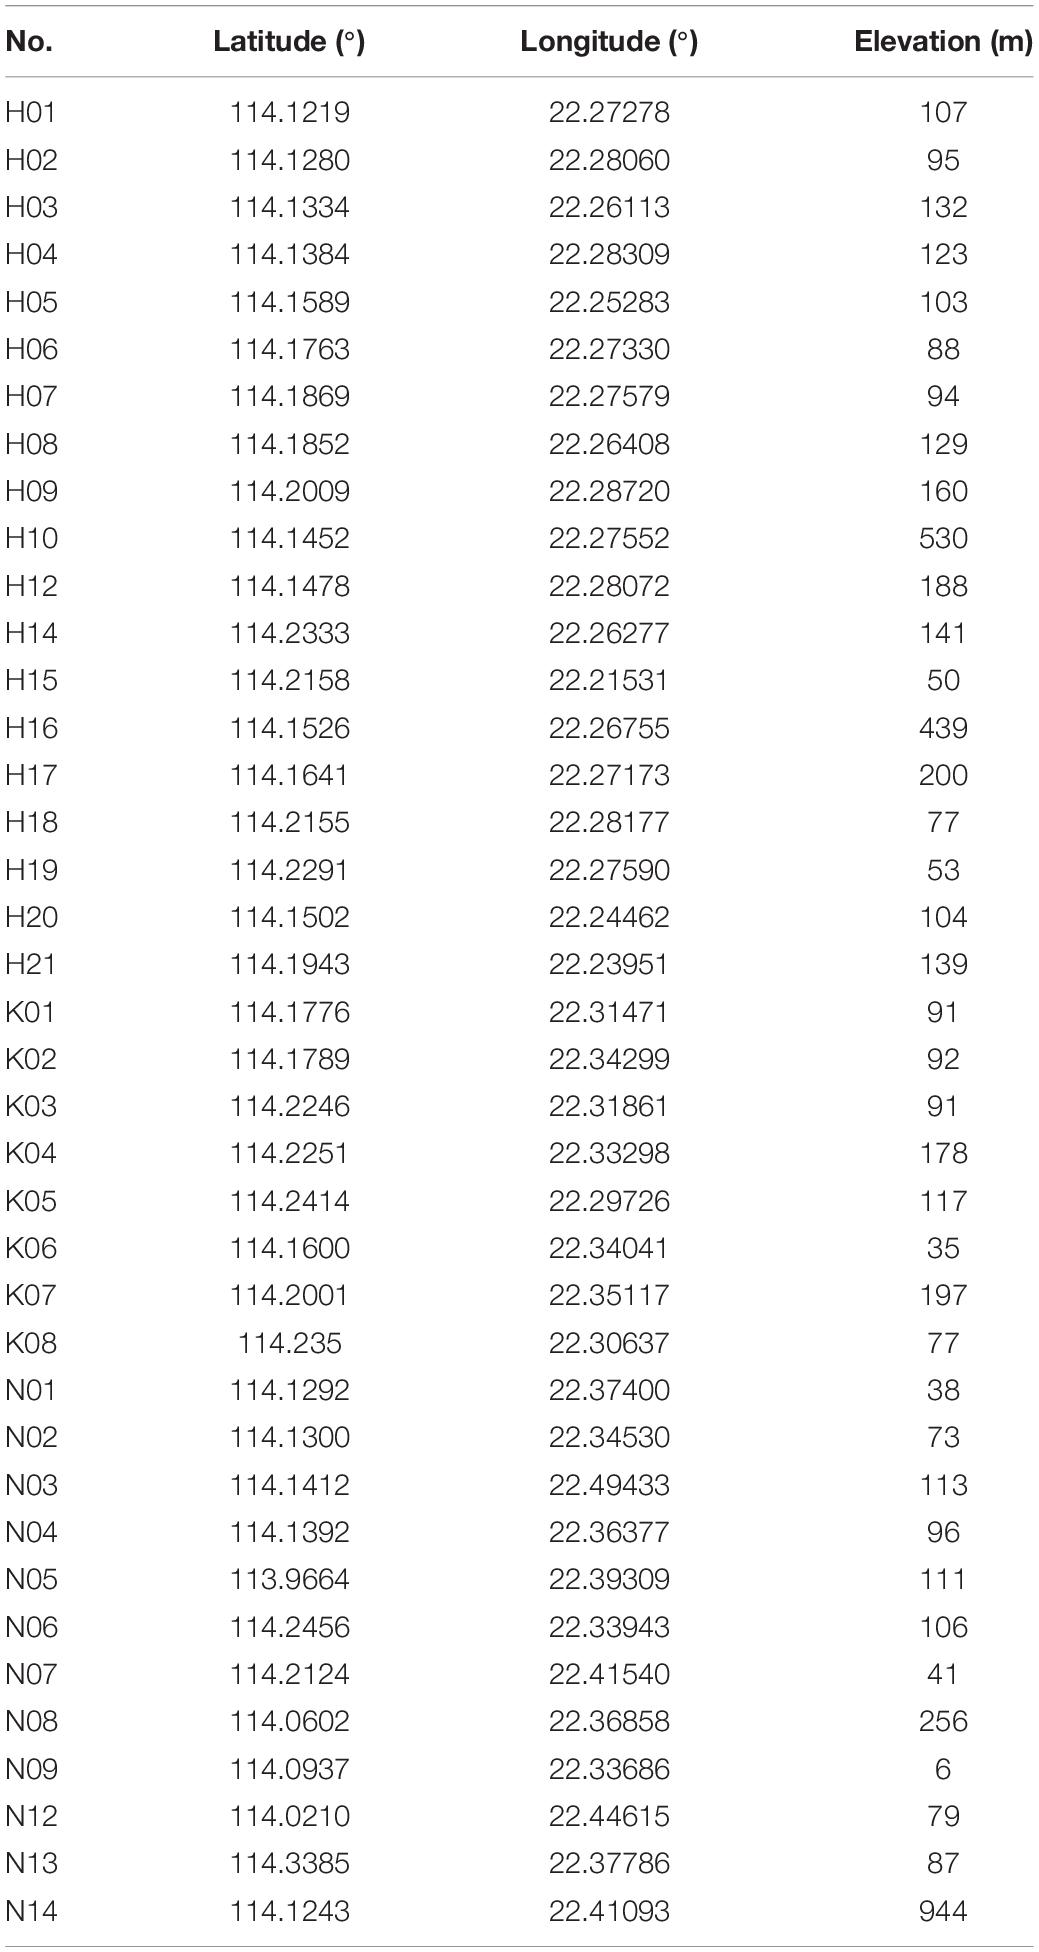
Table 1. Locations and elevations of the 39 GEO rain gauges.
In this study, we focus on the annual maxima of sub-daily rainfall extremes. Sub-daily rainfall accumulation is an important factor for flood control. The calculation of annual maxima is based on 5-min rainfall data for the 1984–2010 period. Although the analysis period is only 27 (1984–2010) years because of data availability, Evans and Yu (2001) recommended a minimum of 20 years as an adequate length of data records for examining extreme rainfall intensity. The durations of rainfall accumulations considered in the present analysis include 5, 10, and 30 min and 1, 2, and 3 h. Apart from intensity of annual maximum precipitation accumulation over the 6 durations, the frequency of extreme precipitation events defined using the 99th percentile threshold of all data over all years for each gauge is also examined.
We examine the trends and interannual variability of the extreme precipitation in Hong Kong in the context of large-scale atmospheric circulation and sea surface temperature (SST) anomalies. Large-scale atmospheric circulations are described by the anomalous fields of 500-hPa geopotential height and vertical velocity, 850-hPa wind and 1000–700 hPa specific humidity, all of which are derived from the U.S. National Centers for Environmental Prediction (NCEP) and Department of Energy (DOE) global reanalysis with a horizontal resolution of T62 (∼209 km) and 28 vertical levels and a temporal coverage of four times per day (Kalnay et al., 1996; Kistler et al., 2001; Kanamitsu et al., 2002). SST anomalies are described using the US National Oceanic and Atmospheric Administration (NOAA) Extended Reconstructed Sea Surface Temperature (Smith et al., 2008). Finally, NOAA’s Outgoing Longwave Radiation (OLR) (Liebmann and Smith, 1996) data are also analyzed as a proxy for convection1.
Since more than half of Hong Kong’s annual maxima rainfall occur in summer (June, July August), followed by nearly one third in spring (March, April, and May), we focus our analyses on the relations between summertime anomalous large-scale circulation patterns and the changes in annual maxima of extreme rainfall in Hong Kong using the composite analysis method. Mann-Kendall (MK) test (Mann, 1945) is utilized to detect significant trend and abrupt change point in the time series.
Results
The annual maxima of short-duration (5, 10, 30 min and 1, 2 3 h) rainfall extremes are estimated using 39 automated rain gauges during the 27-year period from 1984 to 2010. The values are then averaged over the 39 rain gauges to obtain domain-averaged annual maxima of rainfall extremes for the respective duration. The median of domain-averaged annual maxima of rainfall extremes over the 27 year period for the 6 gradually increasing durations are 12.5, 22.0, 46.8, 68.4, 94.3, and 110.7 mm, respectively.
The time series and trends of domain-averaged annual maxima of rainfall accumulations over the 6 durations are shown in Figure 2. The 27-year time series is characterized by a remarkable interdecadal variability and this is true for all 6 accumulation durations. Based on the Mann-Kendall (MK) (Mann, 1945) abrupt change test, an abrupt change point occurred in 1991/1992 regardless of duration (Figure 3). Corresponding to this abrupt change, the domain-averaged annual maxima are significantly smaller during 1984 – 1991 than those from 1992 to 2010.
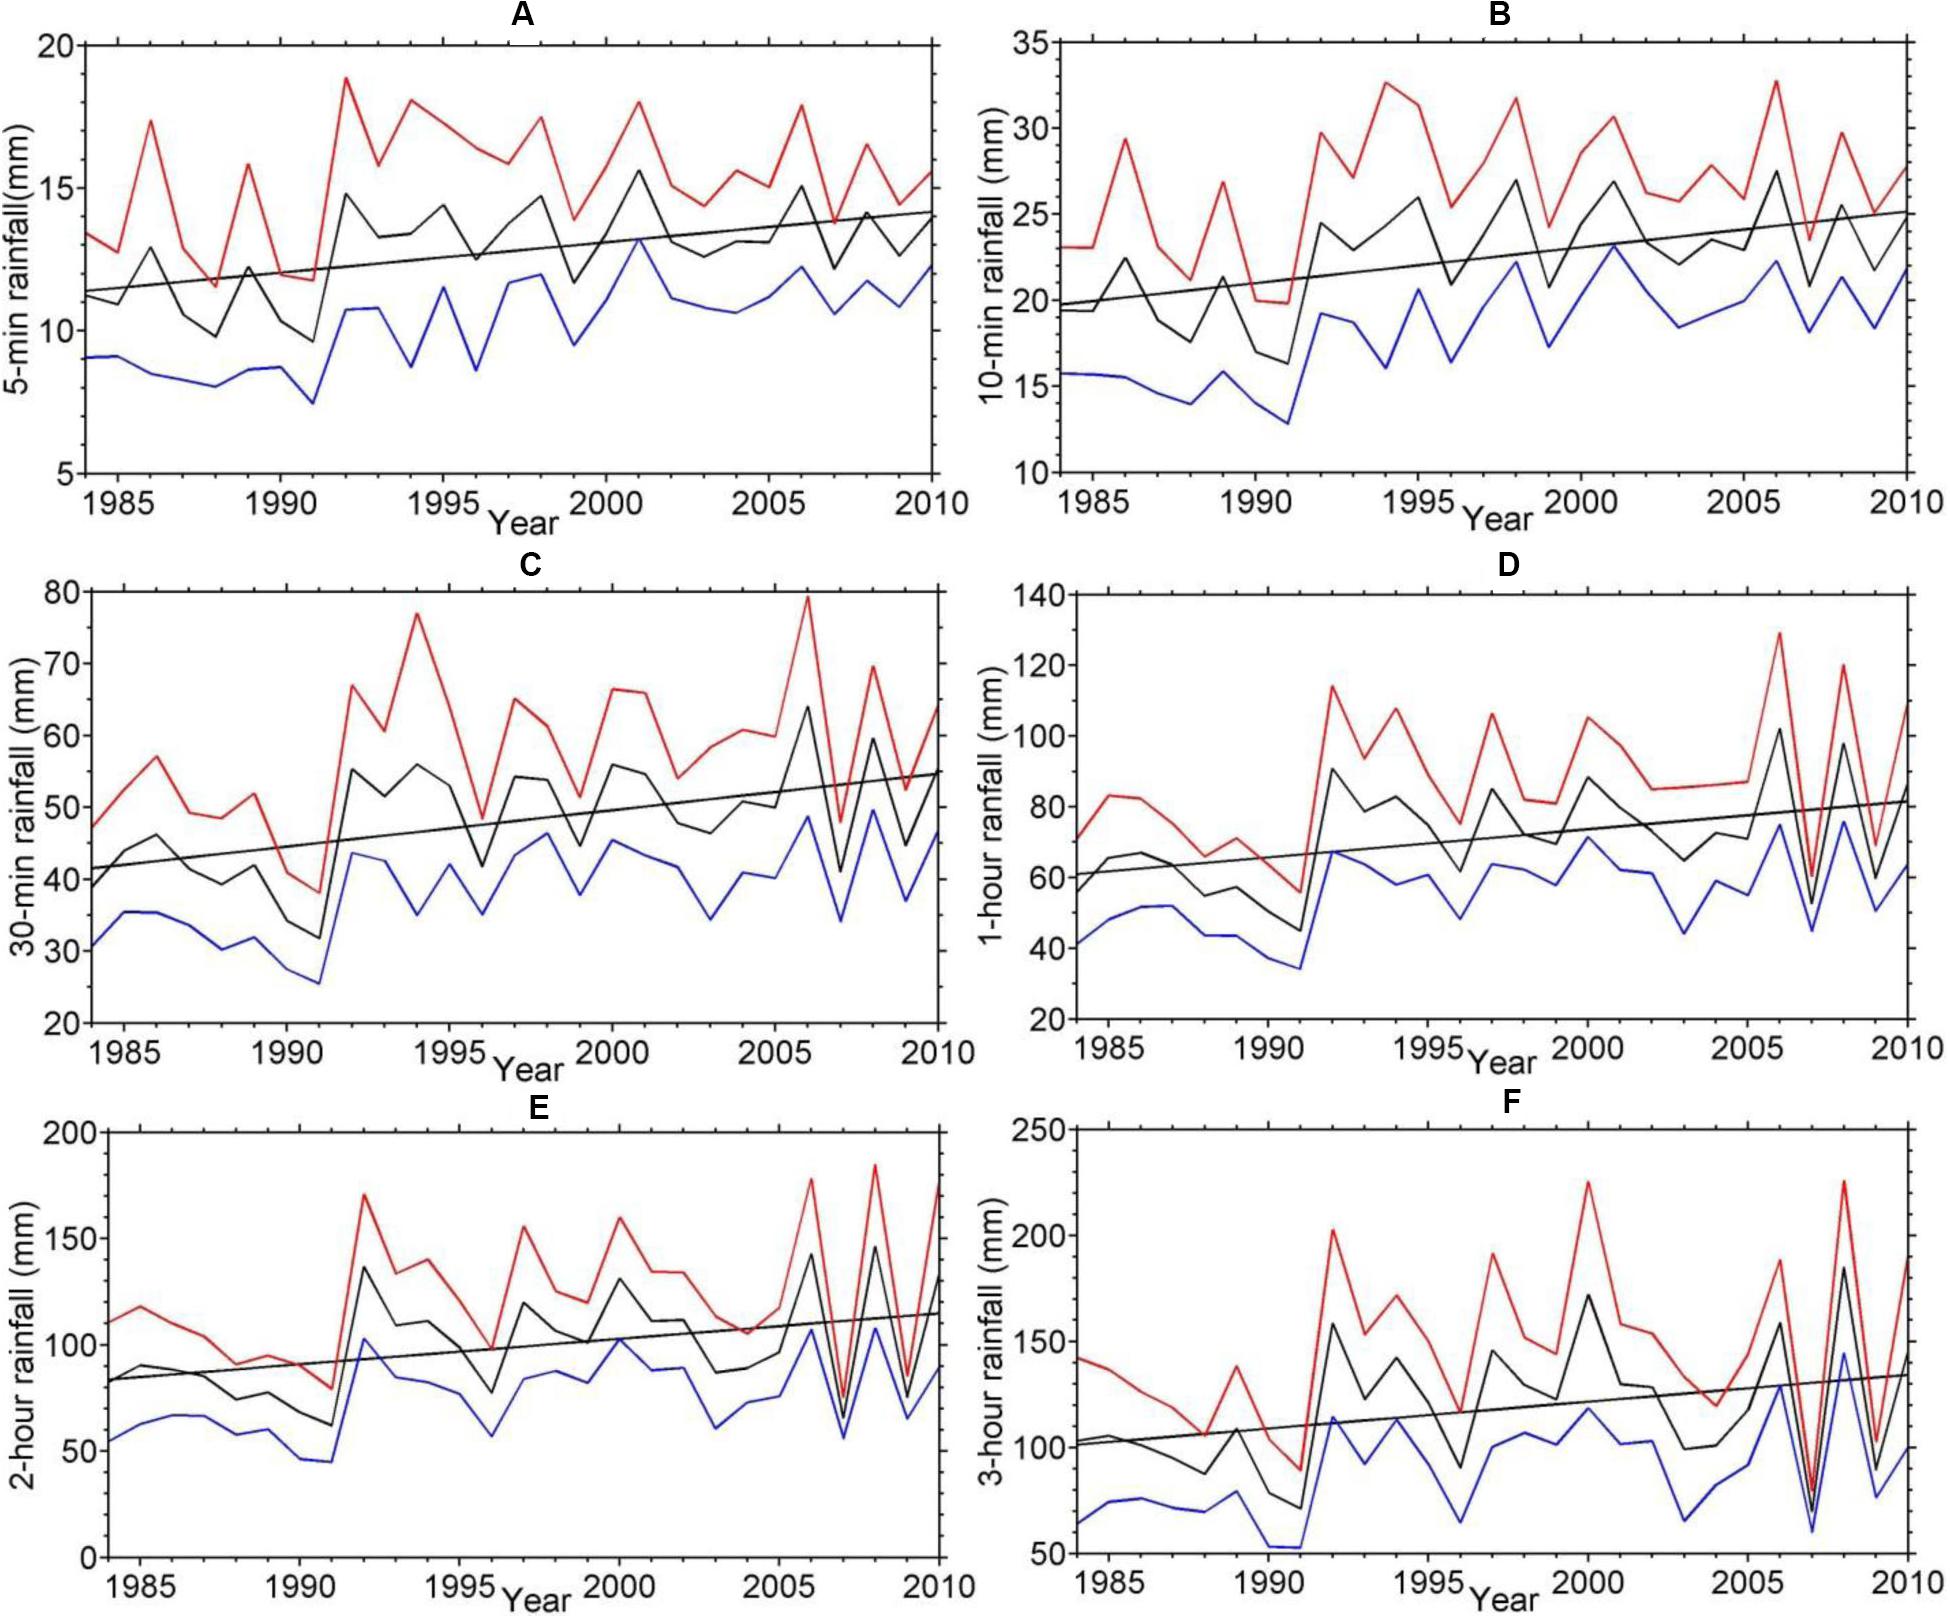
Figure 2. Time series (black lines) and trends (straight black lines) of domain-averaged annual maxima of rainfall accumulations over 5 min (A), 10 min (B), 30 min (C), 1 h (D), 2 h (E), and 3 h (F) for the period of 1984 to 2010. The red and blue lines denote the 39-station mean value plus and minus one 39-station standard deviation, respectively.
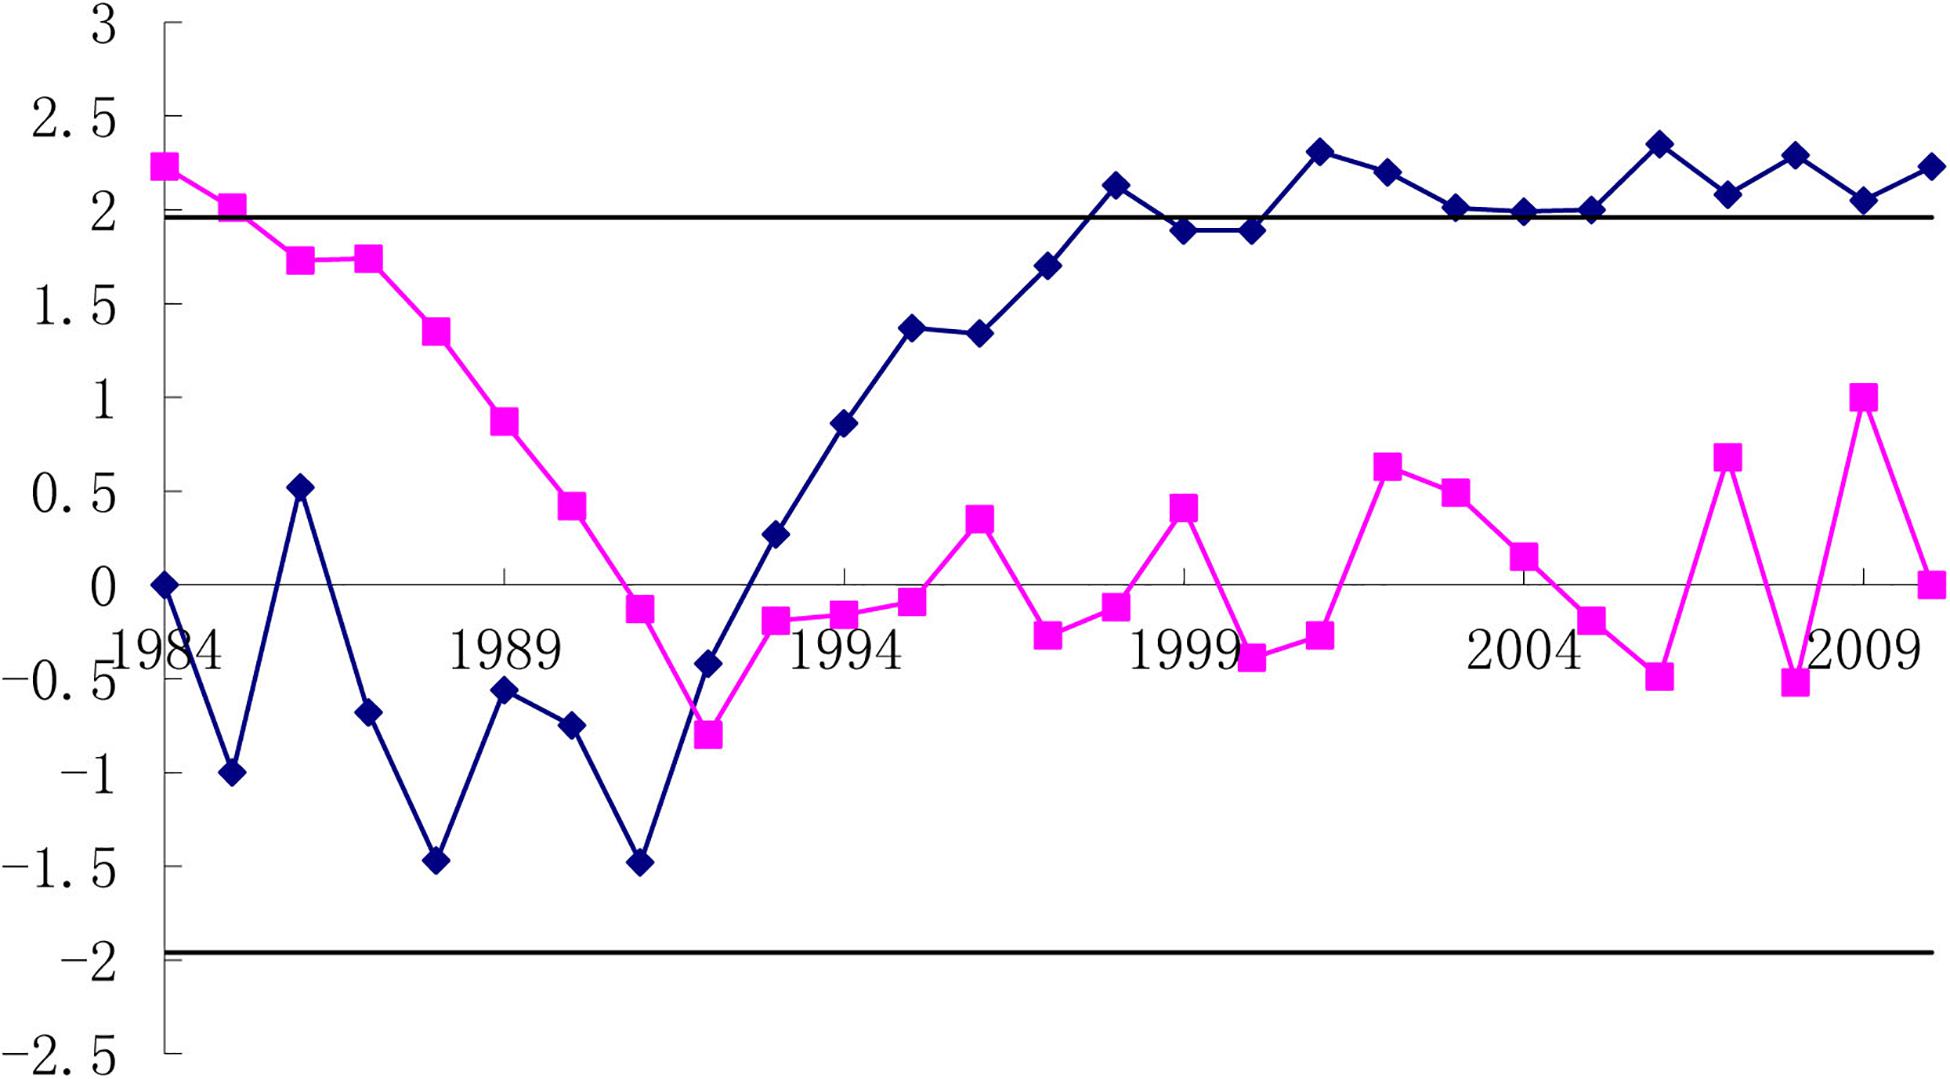
Figure 3. The statistical lines of the Mann-Kendall (MK) (Mann, 1945) abrupt change test for the time series of domain-averaged annual maxima of rainfall with 5-min accumulation in Figure 2A. The black solid straight lines denote 95% confidence levels. The vertical axis is the statistical value calculated by the statistical variables of UB (pink lines) and UF (blue lines) according to MK method.
The systematic differences in the values before and after the abrupt change point yields an upward trend in the domain-averaged annual maxima of rainfall extremes. The slope of the upward trend increases as the accumulation duration lengthens, from 0.1, 0.2, and 0.5 mm yr–1 for 5-, 10-, and 30- min durations, to 0.8, 1.2, and 1.3 mm yr–1 for the 1-, 2-, and 3-h durations, respectively. The trends are statistically significant (p ≤ 0.05) for all but the two longest (2- and 3-h) durations. The increasing trends in extreme rainfall intensity are consistent with the increasing trends in frequency of extreme rainfall in Hong Kong (Ginn et al., 2010; Wong et al., 2011). The increasing trend is mostly due to the abrupt change in 1991/1992. The 39 gauges are unevenly distributed with more than half located in Hong Kong Island while none in Lanton Island. As a result, the 39-gauge unweighted means may be skewed by those on Hong Kong Island. Figure 2 shows considerable differences among the values at different gauges, which suggests large spatial variability in the annual maximum rainfall values. As expected, the spatial standard deviations are proportional to the mean values that increases with the length of accumulation duration.
To access the domain averaged results, Empirical Orthogonal Function (EOF) analysis is performed and the results are shown in Figure 4 for the 5-min accumulation duration. The total variances explained by the first EOF mode (EOF1) range from 32.8% for the 5-min accumulation to 55.0% for the 3-h accumulation. Although the values are all positive across the entire domain, there are several localized maxima and the largest one is in the New Territories near gauge N14 (Figure 4A). An abrupt change of the EOF1 time series also occurred in 1991/1992 (Figure 4B). As such, the above domain-averaged results can reflect the common feature of annual maxima of rainfall at the 39 gauges. To further determine the abrupt change signal, we examine the time series of annual maxima of 5-min accumulated rainfall for each gauge. More than half (22) of the 39 gauges, which are scattered in different regions, show a similar abrupt change point in the early 1990s. Similar results from EOF analysis and analysis of individual gauge data are found for other 5 durations. It is, therefore, certain that there exists an abrupt change in the annual maxima of rainfall with accumulation duration up to 3 h in Hong Kong. Although the analysis here is limited to accumulation durations up to 3 h, it is highly likely that this finding can be extended to longer durations.
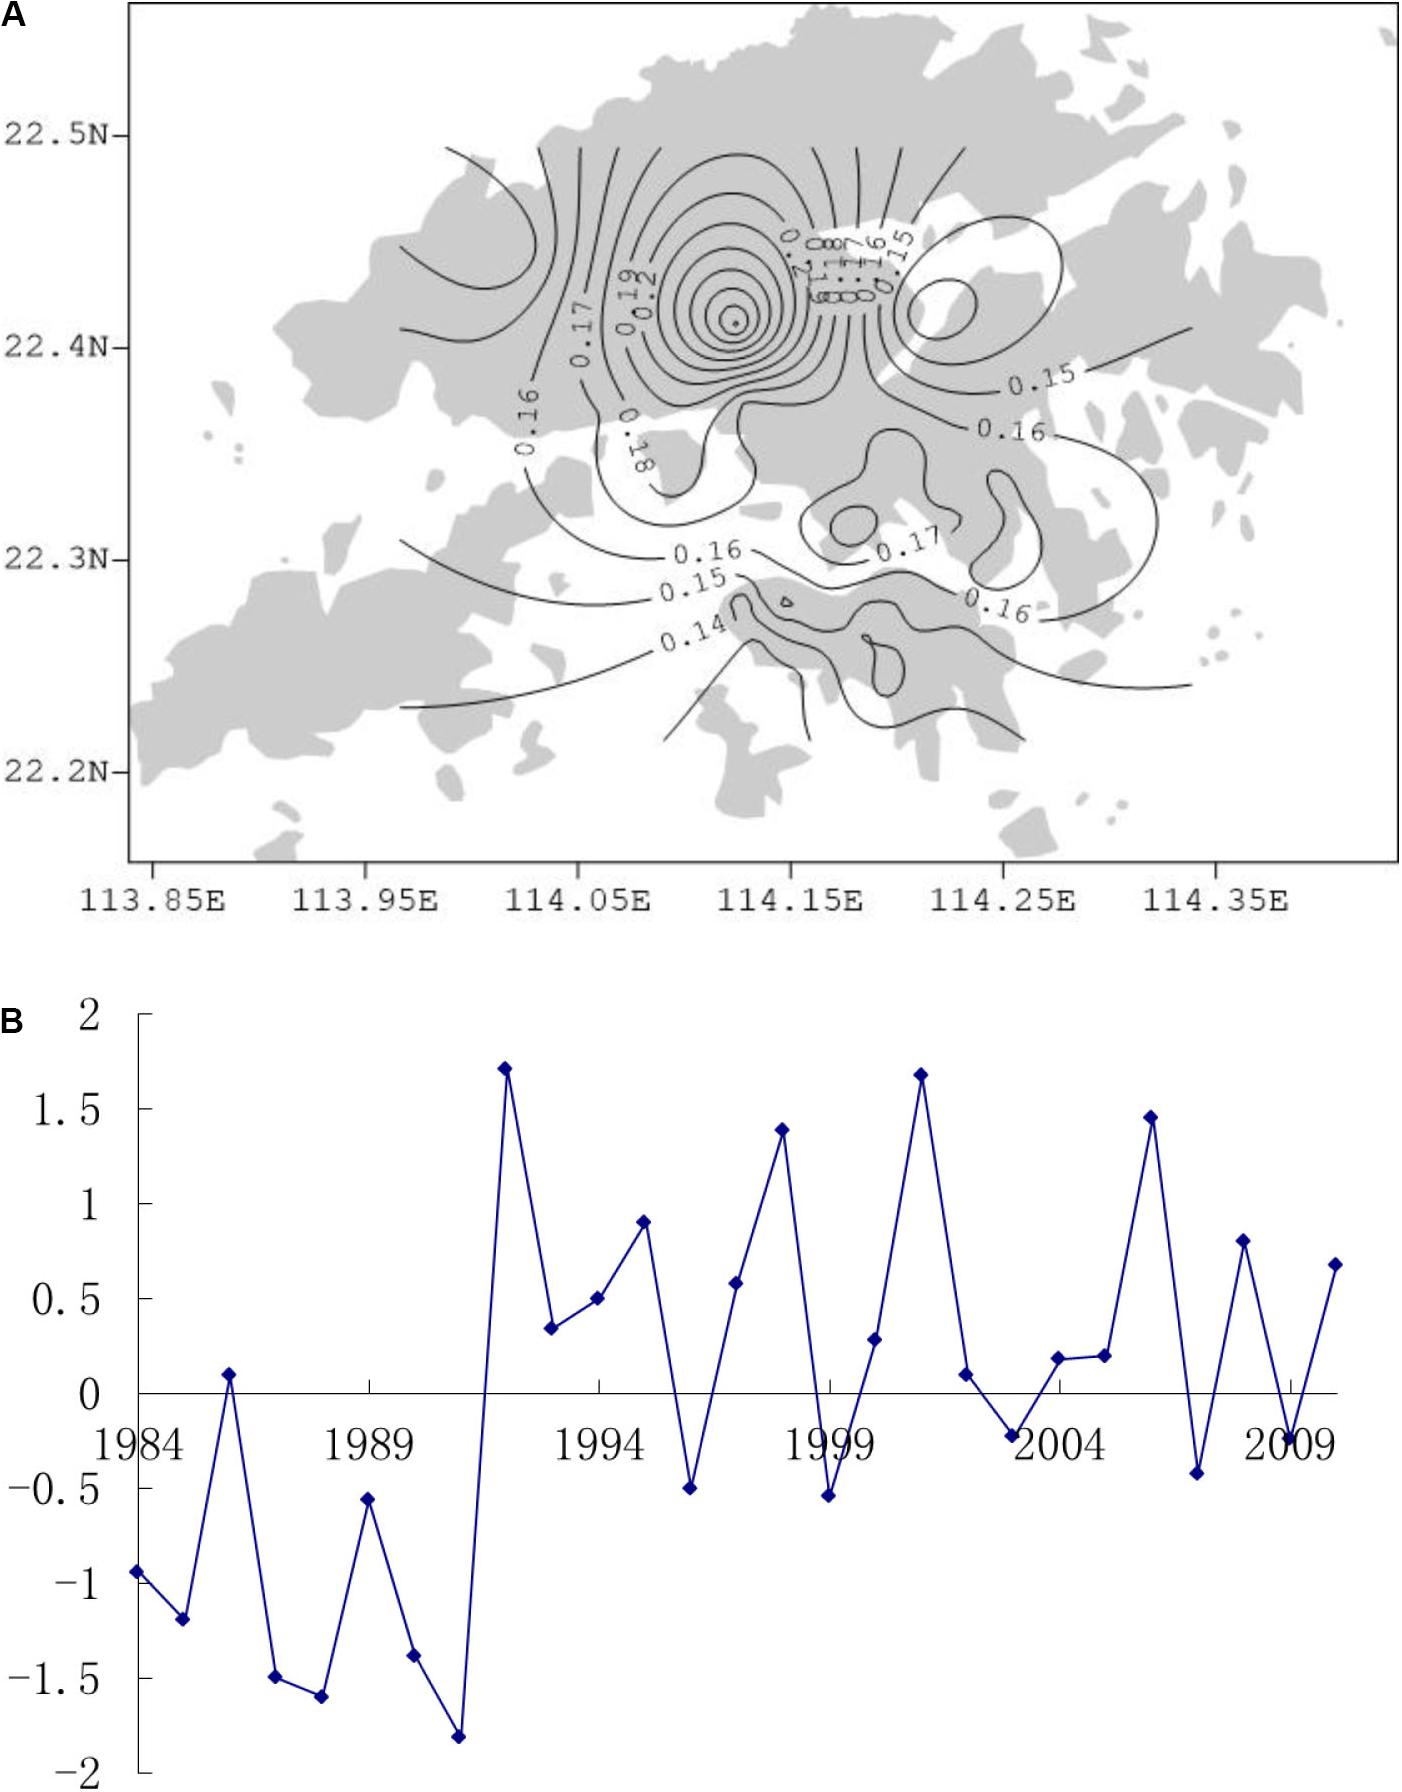
Figure 4. The spatial pattern (A) and normalized time series (B) of the first EOF mode for annual maxima of 5-min rainfall. The values in (A) (unit: decimeter) shows the response of annual maxima for each station to the change of one standard variation of the normalized time series (B).
While changes in the intensity of extreme precipitation described by the annual maxima of rainfall accumulation over the respective period is an important factor to consider for flood control, changes in the frequency of extreme precipitation is equally important for such application. Figure 5 shows the time series of domain-averaged occurrence of extreme events when rainfall amount accumulated over a given duration is above the 99th percentile of all events for the given duration over the 27-year period. The frequency time series (Figure 5) are significantly correlated with their respective intensity time series (Figure 2), with correlation coefficients varying in a narrow range from 0.59 for the 2-h accumulation to 0.68 for the 10-min accumulation (p ≤ 0.05). An abrupt change occurred in 1992/1993 based on the MK test (Not shown). Similar to the intensity time series, the frequency time series also have upward trends with slopes of 11.1, 6.1, 2.5 yr–1 for 5-, 10-, and 30-min accumulations, and 1.4, 0.8, and 0.6 yr–1 for 1-, 2-, and 3-h accumulations, respectively. But different from the intensity trends that are statistically significant for all but the two longest durations (2 and 3 h), the frequency trends are significant for all but the two shortest durations (5 and 10 min). An increasing trend in the occurrence of extreme precipitation is also found in previous studies (Ginn et al., 2010; Wong et al., 2011) that only included 1-h accumulation. Similarly to the intensity trends, the frequency trends also result from a manifestation of an abrupt change point.
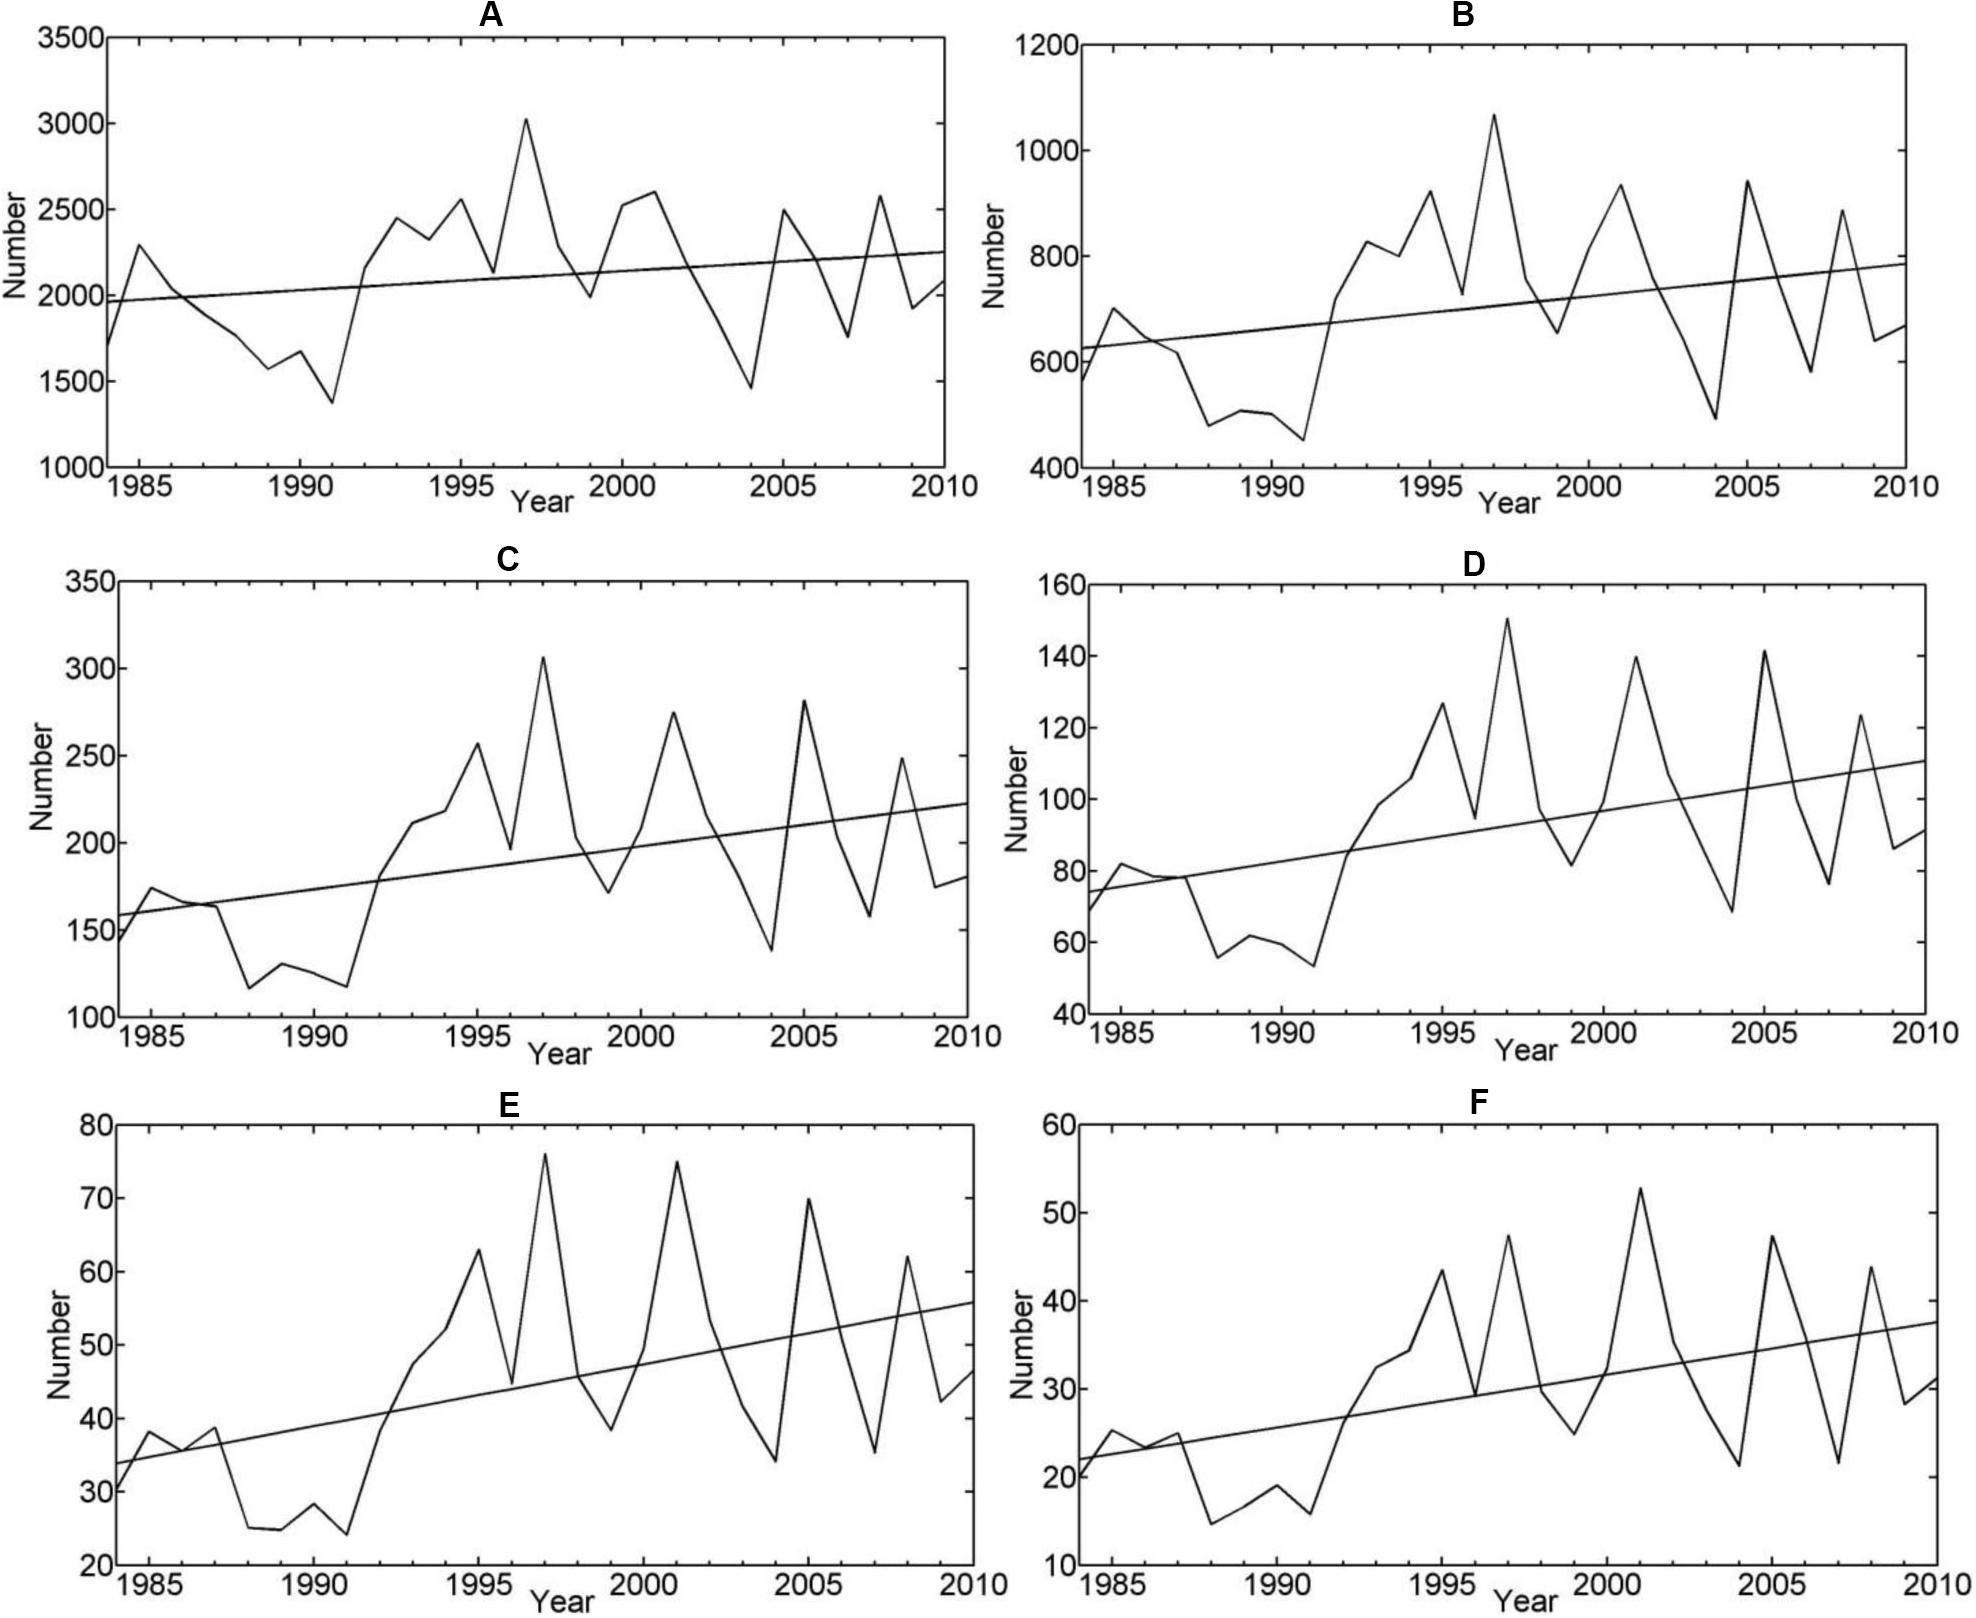
Figure 5. Time series and trends of domain-averaged number of extreme rainfall accumulations over 5 min (A), 10 min (B), 30 min (C), 1 h (D), 2 h (E), and 3 h (F) using the 99th percentile threshold for the period of 1984 to 2010.
The aforementioned results indicate that an abrupt change in both the intensity and frequency of occurrences of short-duration (<3 h) extreme precipitation events in Hong Kong occurred in the early 1990’s, with more frequent and stronger extreme precipitation following the change.
Because annual rainfall in Hong Kong usually peaks in summer, a composite analysis of summertime (JJA) atmospheric variables is performed to explore the cause for the abrupt change in the early 1990s. The 27 years in the study period are separated into two groups, the years prior to 1992 and the years afterward, which correspond to weak and less frequent extreme precipitation events and stronger and more frequent extreme precipitation events, respectively. At each grid point in the study domain, a mean value is calculated for each of the two groups and the differences between the means are examined. Similar composite analysis method was also utilized to examine an inter-decadal change of the East Asian summer monsoon (EASM) for which the abrupt changing point is 1993/1994 (Zhang et al., 2017; Zhu et al., 2018).
The western Pacific subtropical high (WPSH) is one important component of the EASM system (Tao and Chen, 1987; Ding, 1994) and its intensity and location dominates the distribution and strength of summer rainfall in southeast China (Tao and Xu, 1962; Huang, 1963) including Hong Kong. A comparison of the WPSH strengths between the two groups (Figure 6A) shows that WPSH is stronger and extends more westwards for 1992–2010 than for 1984–1991 (Figure 6A). Consistent with the westward extension of the summertime WPSH is an anomalous 850 hPa anticyclonic circulation over the western Pacific Ocean and South China Sea (Figure 7A). The anomalous southwesterly winds from the South China Sea brings moisture-laden air to Hong Kong (Figure 6B), providing an environment favorable for the occurrence of intense extreme rainfall.
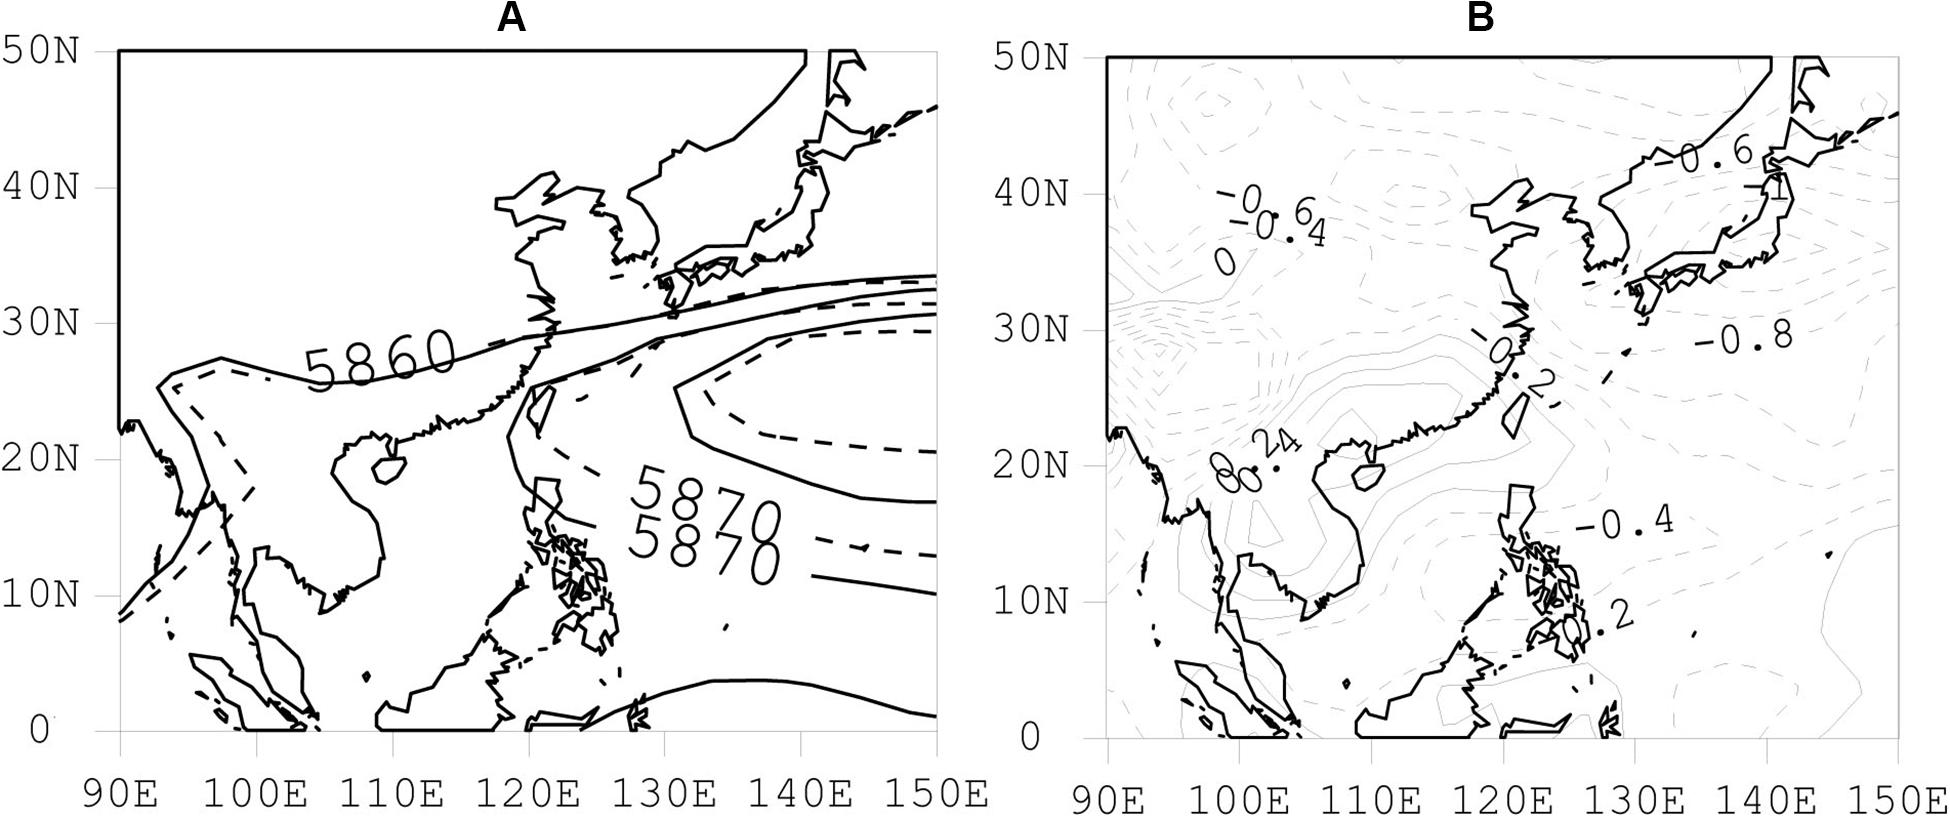
Figure 6. Locations of summertime mean 5870-gpm isoline at 500 hPa for the period of 1984–1991 (dash line) and 1992–2010 (solid line) (A), and the difference of low-level (1000–700 hPa) specific humidity (g/kg) between 1992–2010 and 1984–1991 (B).
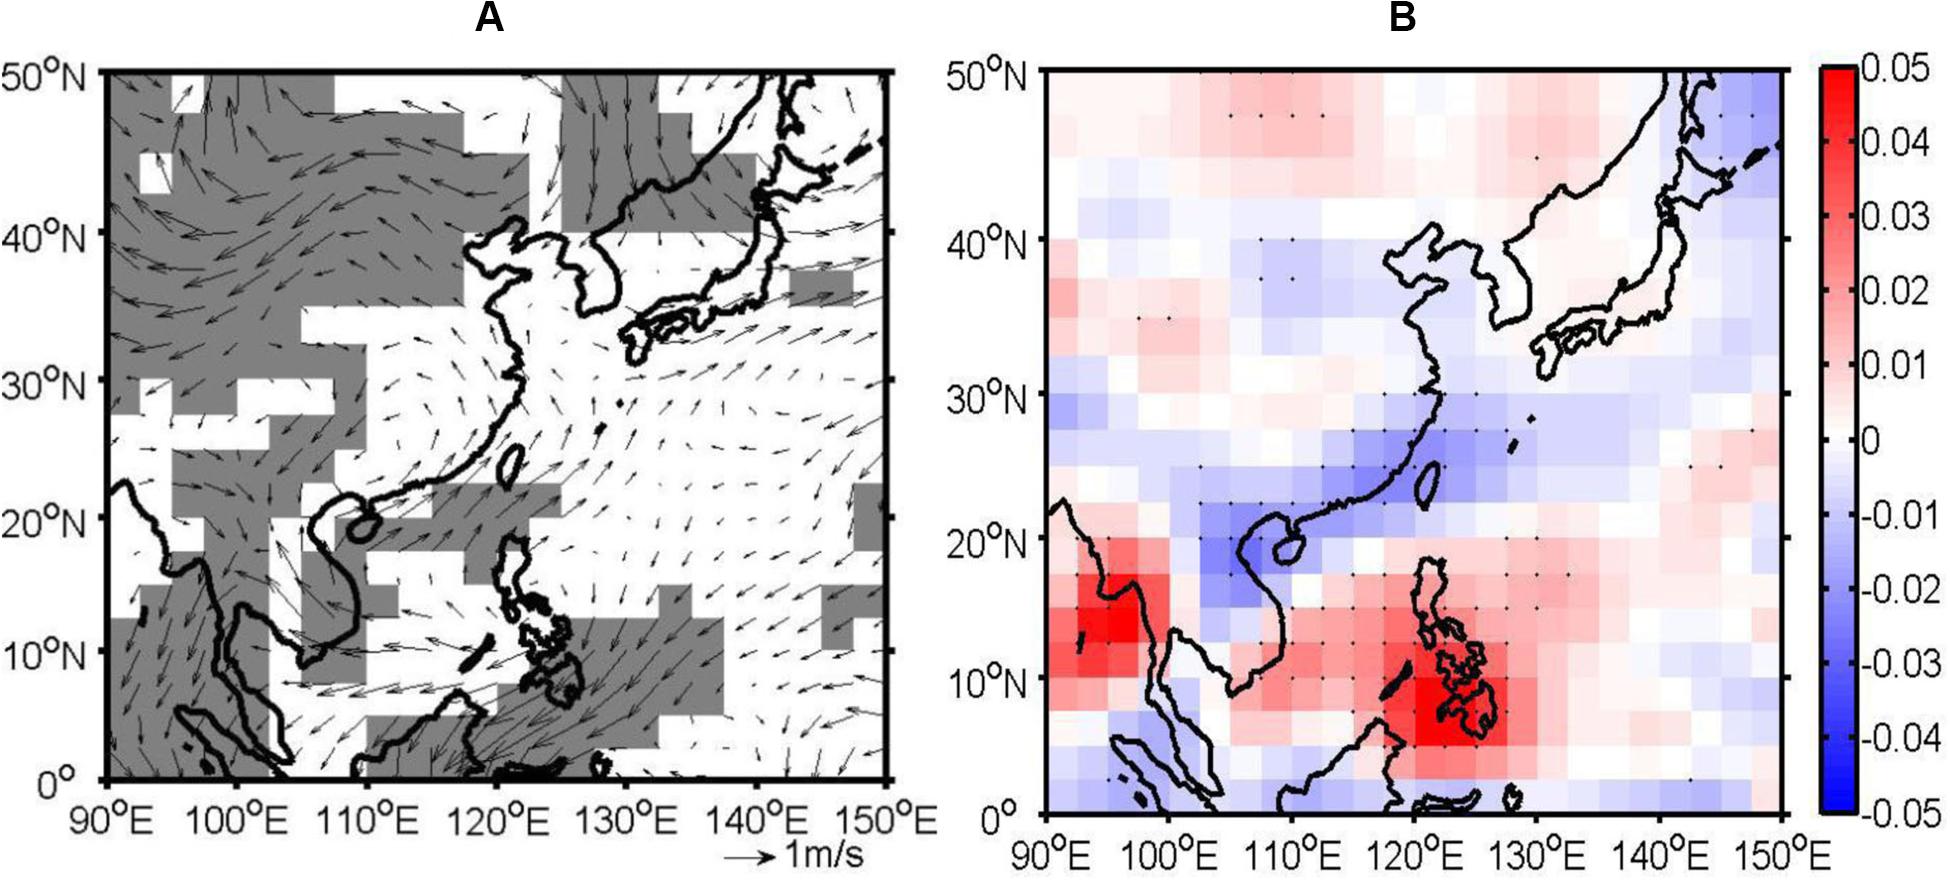
Figure 7. Differences between the 1992–2014 and 1984–1991 means of 850-hPa wind (A) and 500-hPa vertical velocity (Pa/s) (B). The shaded and dotted regions indicate the regions with above 95% confidence level using the Student’ t-test.
In addition to ample moisture, strong dynamical lifting is also necessary for extreme rainfall. The difference in the 500-hPa omega field between the two groups are negative along Southeast China coasts (Figure 7B), which indicates stronger rising motion during 1992–2010 than during 1984–1991. The stronger lifting of moisture-laden air contributes to the increase in the frequency and intensity of extreme precipitation over Hong Kong. Over the South China Sea and the Philippines, positive difference in the omega field indicates stronger sinking motion associated with the stronger WPSH in these regions.
The above results suggest that the changes in the intensity and frequency of extreme precipitation in Hong Kong between the earlier (1984–1991) and later (1992–2010) periods are consistent with the changes in atmospheric conditions resulting from the westward extension along with a slight intensification of the summertime WPSH. Hu (1997) and Zhou et al. (2009) found the westward extension of WPSH on an interdecadal time scale may be related to the Indian Ocean-western Pacific warming. Although positive SST differences occur over the tropical Indian Ocean and tropical western Pacific Ocean (Figure 8A), there is no significant negative OLR, a proxy for convection in tropical and subtropical oceans, over the tropical eastern Indian Ocean and western Pacific Ocean, indicating few convective activities there (Figure 8B). The positive SST differences over the tropical eastern Indian Ocean and western Pacific Ocean may result from the changes in radiation related to significant downward motion (Figure 7B) induced by the westward extension of WPSH. Rodwell and Hoskins (2001) found that diabatic heating related to the South-Asian-summer-monsoon rainfall could increase the strength of the WPSH. The convective activities over the tropical western Indian Ocean (Figure 8A) may help westward extension of WPSH. In summer season, there are three monsoon circulations: the transverse monsoon, the lateral monsoon and the Walker circulation (Webster et al., 1998). The transverse monsoon circulation over the Indian Ocean is associated with a subsidence (ascent) over the western (eastern) tropical Indian Ocean and East Africa (the Maritime Continent). The increased (weakened) convective activities over the western Indian Ocean (the eastern Indian Ocean and the western Pacific Ocean) (Figures 7B, 8B) can decrease the strength of the transverse circulation over the Indian Ocean, thus leading to the positive WPSH anomalies (Wu and Zhou, 2008). In addition, the large negative OLR differences over the southeastern China and northern South China Sea indicate stronger convective development and positive rainfall there after 1991 than before 1991, which also help the occurrence of stronger annual extreme rainfall.
Figure 8. Differences between the 1992–2014 and 1984–1991 means of sea surface temperature (SST) (°C) (A) and Outgoing Longwave Radiation (OLR) (W/m2) (B). The dotted regions indicate the regions with above 95% confidence level using the Student’ t-test.
Finally, putting the regional changes between the two periods into the perspective of changes in large-scale circulations, the differences in the 500-hPa geopotential height field are characterized by a Rossby wavetrain with positive values over Europe, northern China, western and eastern North Pacific Ocean, southern and northeastern North America and southern North Atlantic Ocean and negative anomalies over western Asia, Japan, central North Pacific Ocean, central North America and eastern North Atlantic Ocean (Figure 9). Similar pattern is also found in the 200 hPa geopotential height difference map (not shown). The wavetrain is similar to the positive phase of the circumglobal teleconnection (CGT) pattern in the northern hemisphere summer (Ding and Wang, 2005; Ding et al., 2011). The positive height difference over the western Pacific Ocean strengthens the WPSH. The negative height difference over western India indicates more convective activities and monsoon rainfall. Ding and Wang (2005) and Ding et al. (2011) related the CGT pattern in summer to Indian monsoon rainfall anomalies. As such, the positive phase of the CGT related to stronger Indian monsoon also helps strengthen the WPSH and extend it more westward.
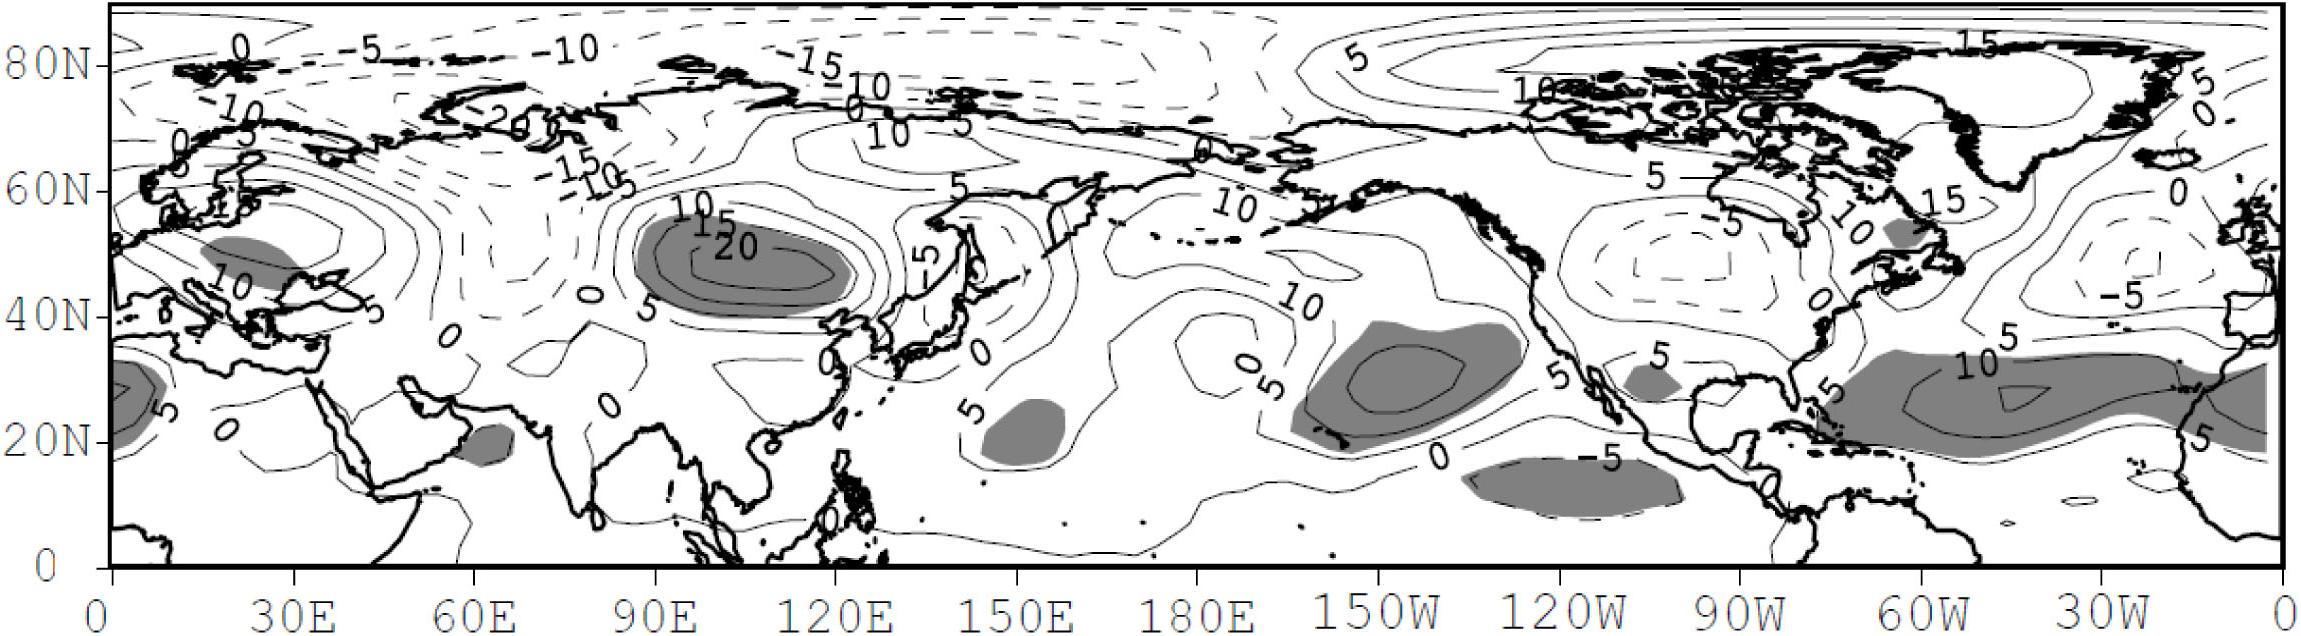
Figure 9. Differences between the 1992–2014 and 1984–1991 means of summertime 500-hPa geopotential height (gpm). The shaded regions indicate the regions with above 95% confidence level using the Student’ t-test.
Summary and Discussion
Using data from a 39-gauge network across Hong Kong, we examined the trends in both the intensity and frequency of short-duration (5, 10, 30 min and 1, 2, 3 h) rainfall extremes over the period 1984–2010.
Averaging across the gauge network, the intensity and frequency of precipitation extremes exhibit an upward trend. The intensity trend is statistically significant for all but the two longest durations (2 and 3 h) and the slope of the trend increases as the duration increases. An opposite relation is seen between the frequency trend and the length of the duration. The upward trend over the 27-year period appears to be a manifestation of an abrupt change near the beginning of 1990s that separates a period of lower and fewer precipitation extremes before, from a period of higher and more extremes after, which suggests that the use of linear trend analysis may not be appropriate.
The increases in the intensity and frequency of extreme precipitation in Hong Kong after the early 1990s is linked, through composite analyses, to strengthening and westward shift of the western Pacific subtropical high and the associated anticyclonic motion that enhances the transport of moisture-laden air as well as rising motion over Hong Kong – the two ingredients for strong convective activities responsible for extreme precipitation. The westward shift of the western Pacific subtropical high is related to the anomalous convective activities over the tropical western Indian Ocean and a positive phase circumglobal teleconnection 500 hPa wavetrain. The inter-decadal variability of extreme precipitation in Hong Kong is consistent with the inter-decadal change of the East Asian summer monsoon (EASM) (Zhang et al., 2017; Zhu et al., 2018), but the exact change point is different. The abrupt change point for EASM is 1993/1994, the same change point for the mean summer rainfall in Hong Kong (not shown), but the changes in extreme precipitation in Hong Kong occurred 2 years earlier round 1991/1992 for intensity and 1 year earlier around 1992/1993 for frequency. It is unclear what caused these small shifts in the exact year of change, which can be a topic of future investigation. Despite the small differences in the exact change point, the similar inter-decadal variability between the extreme precipitation and EASM suggests that extreme precipitation in Hong Kong is strongly linked to monsoon precipitation, not to typhoon precipitation that, according to Chang et al. (2012), did not exhibit a similar pattern of inter-decadal variability. Kajikawa and Wang (2012) and Xiang and Wang (2013) documented an abrupt change of South China Sea summer onset in 1993/1994. The summertime rainfall in Hong Kong also performs an abrupt change in 1993/1994 (not shown). The reason of the difference between the two abrupt years also needs to be further investigated.
Previous studies usually presumed the role of anthropogenic global warming in increasing extreme precipitation. For example, Wong et al. (2011) also noted the increasing trends in the frequency of occurrence of extreme 1-, 2-, and 3-h rainfall amounts from 1885 to 2008. They simply attributed the increasing trends to global warming and did not consider the impact from the natural factors. Our results suggest that natural variability could potentially be a significant driver for the increasing intensity and frequency of extreme precipitation in recent decades. Another active debate is on the relative role atmospheric thermodynamic and dynamic processes play in the changes of extreme rainfall. Pfahl et al. (2017) noted that an increase in atmospheric upward vertical motion, a dynamic process, makes the most contribution to annual daily maximum precipitation in the Asian monsoon region. Their results agree with our conclusion, though they focused on daily rainfall amount. Our conclusions offer some insights into processes that could subsequently be used to develop a predictive tool for occurrence of sub-daily extreme precipitation, especially those of less than 3 h that are mostly responsible for flash floods.
Data Availability Statement
The original contributions presented in the study are included in the article/supplementary materials, further inquiries can be directed to the corresponding author.
Author Contributions
LY analyzed the data and wrote the manuscript. SZ revised the manuscript. YQ and XL offered the suggestion.
Funding
This study was supported by the National Key R&D Program of China (Nos. 2017YFE0111700 and 2019YFC1509102).
Conflict of Interest
The authors declare that the research was conducted in the absence of any commercial or financial relationships that could be construed as a potential conflict of interest.
Acknowledgments
The authors thank the Geotechnical Engineering Office (GEO) of Civil Engineering and Development Department in Hong Kong for 5-min rainfall data at 39 rain gauges and NCEP for the global reanalysis data.
Footnotes
References
Ahern, M., Kovats, R. S., Wilkinson, P., Few, R., and Matthies, F. (2005). Global health impacts of floods: epidemiologic evidence. Epidemiol. Rev. 27, 36–46. doi: 10.1093/epirev/mxi004
Alexander, L. V. (2016). Global observed long-term changes in temperature and precipitation extremes: a review of progress and limitations in IPCC assessments and beyond. Weather Clim. Extre. 11, 4–46. doi: 10.1016/j.wace.2015.10.007
Blenkinsop, S., Fowler, H. J., Barbero, R., Chan, S. C., Guerreiro, S. B., Kendon, E., et al. (2018). The INTENSE project: using observations and models to understand the past, present and future of sub-daily rainfall extremes. Adv. Sci. Res. 15, 117–126. doi: 10.5194/asr-15-117-2018
Brown, S. J. (2018). The drivers of variability in UK extreme rainfall. Int. J. Climatol. 38, e119–e130. doi: 10.1002/joc.5356
Chang, C.-P., Lei, Y., Sui, C.-H., Lin, X., and Ren, F. (2012). Tropical cyclone and extreme rainfall trends in East Asian summer monsoon since mid-20th century. Geophys. Res. Lett. 39:L18702.
Ding, Q., and Wang, B. (2005). Circumglobal teleconnection in the Northern Hemisphere summer. J. Clim. 18, 3483–3505. doi: 10.1175/jcli3473.1
Ding, Q., Wang, B., Wallace, J. M., and Branstator, G. (2011). Tropical-extratropical teleconnections in boreal summer: observed interanual variability. J. Clim. 24, 1878–1896. doi: 10.1175/2011jcli3621.1
Donat, M. G., Alexander, L. V., Herold, N., and Dittus, A. J. (2016). Temperature abd precipitation extremes in century-long gridded observations, reanalyses, and atmospheric model simulations. J. Geophys. Res. Atmos. 121, 11174–11189. doi: 10.1002/2016JD025480
Easterling, D. R., Evans, J. L., Groisman, P. Y., Karl, T. R., Kunkel, K. E., and Ambenje, P. (2000). Observed variability and trends in extreme climate events: a brief review. Bull. Am. Meteorol. Soc. 81, 417–425. doi: 10.1175/1520-0477(2000)081<0417:ovatie>2.3.co;2
Evans, N. C., and Yu, Y. F. (2001). Regional Variation in Extreme Rainfall Values, GEO Report No.115. Hong Kong: Geotechnical Engineering Office.
Ghosh, S., Das, D., Kao, S. C., and Ganguly, A. R. (2012). Lack of uniform trends but increasingspatial variability in observed Indian rainfall extremes. Nat. Clim. Change 2, 86–91. doi: 10.1038/nclimate1327
Ginn, W.-L., Lee, T.-C., and Chan, K.-Y. (2010). Past and future changes in the climate of Hong Kong. Acta Meteor. Sinica 24, 163–175.
Hu, Z.-Z. (1997). Interdecadal variability of summer climate over East Asia and its association with 500 hPa height and global sea surface temperature. J. Geophys. Res. 102, 19403–19412. doi: 10.1029/97jd01052
Huang, S. S. (1963). Longitudinal movement of the subtropical anticyclone and its prediction (in Chinese). Acta Meteorol. Sin. 33, 320–332.
Iwashima, T., and Yamamoto, R. (1993). A statistical analysis of the extreme events: long-term trend ofheavy precipitation. J. Meteor. Soc. Japan 71, 637–640. doi: 10.2151/jmsj1965.71.5_637
Jones, M. R., Fowler, H. J., Kilsby, C. G., and Blenkinsop, S. (2013). An assessment of changes in seasonal and annual extreme rainfall in the UK between 1961 and 2009. Int. J. Climatol. 33, 1178–1194. doi: 10.1002/joc.3503
Kajikawa, Y., and Wang, B. (2012). Interdecadal change of the South China Sea summer monsoon onset. J. Clim. 25, 3207–3218. doi: 10.1175/jcli-d-11-00207.1
Kalnay, E., Kanamitsu, M., Kistler, R., Collins, W., Deaven, D., Gandin, L., et al. (1996). The NCEP/NCAR 40-year reanalysis project. Bull. Am. Meteorol. Soc. 77, 437–471.
Kanamitsu, M., Ebisuzaki, W., Woollen, J., Yang, S.-K., Hnilo, J. J., Fiorino, M., et al. (2002). NCEP/DOE AMIP-Reanalysis (R-2). Bull. Am. Meteorol. Soc. 83, 1631–1643. doi: 10.1175/bams-83-11-1631(2002)083<1631:nar>2.3.co;2
Karl, T. R., Knight, R. W., Easterling, D. R., and Quayle, R. G. (1996). Indices of climate change for the United States. Bull. Am. Meteorol. Soc. 77, 279–291.
Kendon, E. J., Roberts, N. M., Fowler, H. J., Roberts, M. J., Chan, S. C., and Senior, C. A. (2014). Heavier summer downpours with climate changerevealed by weather forecast resolution model. Nat. Clim. Change 4, 570–576. doi: 10.1038/nclimate2258
Kistler, R., Kalnay, E., Collins, W., Saha, S., White, G., Woollen, J., et al. (2001). The NCEP-NCAR 50-year reanalysis: monthly means CD-ROM and documentation. Bull. Am. Meteorol. Soc. 82, 247–267. doi: 10.1175/1520-0477(2001)082<0247:tnnyrm>2.3.co;2
Kunkel, K. E., Changnon, S. A., and Angel, J. R. (1994). Climatic aspects of the 1993 upper Mississippi River basin flood. Bull. Am. Meteorol. Soc. 75, 811–822. doi: 10.1175/1520-0477(1994)075<0811:caotum>2.0.co;2
Lam, C. C., and Leung, Y. K. (1994). Extreme Rainfall Statistics and Design Rainstorm Profiles at Selected Locations in Hong Kong. Hong Kong Observatory Technical Note 86. Kowloon: Royal Observatory.
Liebmann, B., and Smith, C. A. (1996). Description of a complete (interpolated) outgoing longwave radiation dataset. Bull. Am. Meteorol. Soc. 77, 1275–1277.
Manton, M. J., Della-Marta, P. M., Haylock, M. R., Hennessy, K. J., Nicholls, N., Chambers, L. E., et al. (2001). Trends in extreme daily rainfall and temperature in Southeast Asia and the South Pacific:1961-1998. Int. J. Clim. 21, 269–284. doi: 10.1002/joc.610
Min, S.-K., Zhang, Z., Zwiers, F. W., and Hegerl, G. C. (2011). Human contribution to more-intense precipitation extremes. Nature 470, 378–381. doi: 10.1038/nature09763
Mishra, V., Wallace, J. M., and Lettenmaier, D. P. (2012). Relationship between hourly extreme precipitation and local air temperature in the United States. Geophys. Res. Lett. 39:L16403. doi: 10.1029/2012GL052790
Mukherjee, S., Aadhar, S., Stone, D., and Mishra, V. (2018). Increase in extreme precipitation events under anthropogenic warming in India. Weather Clim. Extre. 20, 45–53. doi: 10.1016/j.wace.2018.03.005
Osborn, T. J., Hulme, M., Jones, P. D., and Basnett, T. A. (1999). Observed trends in the daily intensity of United Kingdom precipitation. Int. J. Clim. 20, 347–364. doi: 10.1002/(sici)1097-0088(20000330)20:4<347::aid-joc475>3.0.co;2-c
Pall, P., Allen, M. R., and Stone, D. A. (2007). Testing the Clausius-Clapeyron constraint on changes in extreme precipitation under CO2 warming. Clim. Dynam. 28, 351–363. doi: 10.1007/s00382-006-0180-2
Peterson, P., and Kwong, H. (1981). A Design Rain Storm Profile for Hong Kong. London: Royal Observatory.
Pfahl, S., O’Gorman, P. A., and Fischer, E. M. (2017). Understanding the regional pattern of projected future changes in extreme precipitation. Nat. Clim. Change 7, 423–427. doi: 10.1038/nclimate3287
Prein, A. F., Langhans, W., Fosser, G., Ferrone, A., Ban, N., Goergen, K., et al. (2015). A review on regional convection-permitting climate modeling: demonstrations, prospects, and challenges. Rev. Geophys. 53, 323–361. doi: 10.1002/2014RG000475
Rodwell, M. J., and Hoskins, B. J. (2001). Subtropical anticyclones and summer monsoons. J. Clim. 14, 3192–3211. doi: 10.1175/1520-0442(2001)014<3192:saasm>2.0.co;2
Simpson, I. R., and Jones, P. D. (2014). Analysis of UK precipitation extremes derived from met office gridded data. Int. J. Climatol. 34, 2438–2449. doi: 10.1002/joc.3850
Smith, T. M., Reynolds, R. W., Peterson, T. C., and Lawrimore, J. (2008). Improvements NOAAs historical merged land-ocean temp analysis (1880-2006). J. Clim. 21, 2283–2296. doi: 10.1175/2007jcli2100.1
Suppiah, R., and Hennessy, K. (1998). Trends in seasonal rainfall, heavy rain-days, and number if dry days in Australian 1910-1990. Int. J. Climatol. 18, 1141–1151.
Tang, C. S. C., and Cheung, S. P. Y. (2011). Frequency Analysis of Extreme Rainfall Values. GEO Report No. 261. Kowloon: Geotechnical Engineering Office, Civil Engineering and Development Department, 209.
Tao, S. Y., and Chen, L. X. (1987). “A review of recent research on the East Asian summer monsoon in China,” in Monsoon Meteorology, Oxford Monogr. On Geology and Geophysics, Vol. 7, eds P. Chang and T. N. Krishnamurti (Oxford: Oxford University Press).
Tao, S. Y., and Xu, S. Y. (1962). Circulation characteristics in association with persistent summer drought and flood in the Yangtze-Huaihe River reaches. Acta Meteorol. Sin. 32, 1–18.
Tarhule, S., and Woo, M. (1998). Changes in rainfall characteristics in northern Nigeria. Int. J. Climatol. 18, 1261–1272.
Webster, P. J., Magaña, V. O., Palmer, T. N., Shukla, J., Tomas, R. A., Yanai, M., et al. (1998). Monsoons: processes, predictability, and the prospects for prediction. J. Geophys. Res. 103, 14451–14510.
Westra, S., Fowler, H. J., Evans, J. P., Alexander, L. V., Berg, P., Johnson, F., et al. (2014). Future changes to the intensity and frequency of short-duration extreme rainfall. Rev. Geophys. 52, 522–555. doi: 10.1002/2014RG000464
Wong, M. C., Mok, H. Y., and Lee, T. C. (2011). Observed changes in extreme weather indices in Hong Kong. Int. J. Climatol. 31, 2300–2311.
Wu, B., and Zhou, T. (2008). Oceanic origin of the interannual and interdecadal variability of the summertime western Pacific subtropical High. Geophys. Res. Lett. 35:L13701. doi: 10.1029/2008GL034584
Wu, M. C., Leung, Y. K., and Yeung, K. H. (2006). Projected change in Hong Kong’s Rainfall in the 21st century. Hong Kong Meterorl. Soc. Bull. 15:644.
Xiang, B., and Wang, B. (2013). Mechanisms for the advanced Asian summer monsoon onset since the mid-to-late 1990s. J. Clim. 26, 1993–2009.
Yu, L., Zhong, S., Pei, L., Bian, X., and Heilman, W. E. (2016). Contribution of large-scale circulation anomalies to changes in extreme precipitation frequency in the United States. Environ. Res. Lett. 11:044003. doi: 10.1088/1748-9326/11/4/044003
Zhang, H., Wen, Z., Wu, R., Chen, Z., and Guo, Y. (2017). Inter-decadal changes in the East Asian summer monsoon and associations with sea surface temperature anomaly in the South Indian Ocean. Clim. Dyn. 48, 1125–1139. doi: 10.1007/s00382-016-3131-6
Zhou, T., Yu, R., Zhang, J., Drange, H., Cassou, C., Deser, C., et al. (2009). Why the western Pacific subtropical high has extended westward since the late 1970s. J. Clim. 22, 2199–2215.
Keywords: extreme rainfall, climate analysis, climate extremes, monsoon, climate of Hong Kong
Citation: Yu L, Zhong S, Qiu Y and Liang X (2020) Trend in Short-Duration Extreme Precipitation in Hong Kong. Front. Environ. Sci. 8:581536. doi: 10.3389/fenvs.2020.581536
Received: 09 July 2020; Accepted: 18 August 2020;
Published: 09 September 2020.
Edited by:
Qingxiang Li, Sun Yat-sen University, ChinaReviewed by:
Zengyun Hu, Chinese Academy of Sciences (CAS), ChinaFangxing Tian, University of Reading, United Kingdom
Copyright © 2020 Yu, Zhong, Qiu and Liang. This is an open-access article distributed under the terms of the Creative Commons Attribution License (CC BY). The use, distribution or reproduction in other forums is permitted, provided the original author(s) and the copyright owner(s) are credited and that the original publication in this journal is cited, in accordance with accepted academic practice. No use, distribution or reproduction is permitted which does not comply with these terms.
*Correspondence: Lejiang Yu, yulejiang@sina.com.cn