- Civil and Environmental Engineering, Duke University, Durham, NC, United States
This study examines the implications of Tropical Montane Forests (TMFs) loss on orographic precipitation in the Eastern slopes of the Andes (EADS). The focus is on moist processes for synoptic regimes associated with significant EADS precipitation: (1) monsoon rainfall for weak and strong South America Low-Level Jet (LLJ) conditions and (2) heavy rainfall associated with cold air intrusions (CAI) in the dry season. High-resolution simulations using the Weather Research and Forecasting (WRF) model were conducted for realistic and modified land-cover resulting from the conversion of TMFs to savanna. The deforestation scenarios result in 50–100% decrease (up to ∼400 J kg–1) in Convective Available Potential Energy (CAPE) spatially organized by land-cover change along the EADS. Analysis of the differences in simulated frequency distributions of rainfall intensity shows robust daytime increases in light rainfall (<2 mm h–1) and decreases in moderate rainfall rates (2–10 mm h–1) in the altitudinal band 500–2,000 m where orographic enhancement is dominant. Whereas there are negligible changes in the spatial patterns of precipitation and hydrologic response for monsoon conditions, rainfall accumulations decrease for all cases, and the precipitation maxima shift downslope into the Amazon lowlands. Changes in rainfall amount and intensity result in runoff decreases of 5–10% at the event-scale for the CAI case. Sensitivity simulations for lower initial soil moisture conditions indicate a strong positive feedback of forest loss to hydrologic drought along the EADS foothills in the austral spring when CAIs play a key role in the tropical EADS dry season hydrometeorology.
Introduction
Tropical Montane Forests (TMFs)—prevalent in the altitudinal band between ∼500 and 3,500 m (e.g., Fadrique et al., 2018)—have a complex connection to weather and climate, both globally and regionally. While the role of tropical lowland forests in the Earth’s carbon cycle has long been studied (e.g., Phillips et al., 1998; Malhi et al., 2009; and many others), there has been less research on the role of montane forests (Girardin et al., 2010). On the eastern slopes of the tropical Andes (EADS), forests are among the richest hotspots of biodiversity and endemism in the world, and because of steep slopes and fragile soils, they are also highly susceptible to erosion and degradation via landslide activity that in turn source the material fluxes from the Andes into the Amazon. Lowman and Barros (2014) demonstrated the strong association between landform in the Tropical Andes, including EADS drainage networks, and the spatial distribution of precipitation and erosion rates. Drier climate in the future and upslope expansion of anthropogenic land-use and land-cover change have been linked to increased fire activity in tropical cloud forests (typically at elevations > 2,500 m; e.g., Román-Cuesta et al., 2011 among others). Oliveras et al. (2014) showed that TMFs go through a complex rejuvenation process that takes at least 15 years to recover after disturbances near the Andean tree line. While fires might result in downward forest migration, increasing temperatures due to climate change could drive upward expansion of tropical forests. Feeley et al. (2011) examined the sensitivity of the distribution of tropical forests to climate variability. Their analysis of forest inventory data between 950 and 3,400 m in Manu National Park, Peru, shows a gradual upward shift of elevation mean distribution, possibly already evidence of adaptation to rising temperatures. In the tropical Andes, a recent survey using ground-validated MODIS land cover data reveals significant forest loss from 2001 to 2014 between 1,000 and 1,499 m and a gain for elevations above 1,500 m (Aide et al., 2019).
The impact of deforestation below 1,500 m on the local climate is complicated due to non-linear climate–vegetation interactions. The compounding effect of forest loss and increased air temperatures is expected to result in increased water stress in the dry season under future climate conditions (Malhi et al., 2008). One mechanistic pathway to explain the potential for enhanced drought severity is through the land surface energy budget whereby decreases in albedo result in increases in net shortwave radiation and land surface temperature and sensible heat fluxes, thus larger Bowen ratios. Sun and Barros (2015a; 2015b) investigated the contribution of surface evapotranspiration to cloudiness, moist convection and precipitation along the eastern flanks of the tropical Andes (EADS) during the wet season through numerical experiments designed to elucidate the specific pathways of Evapotranspiration-Precipitation Interactions (EtPI). In their idealized experiments, the moisture input to the planetary boundary layer via local surface latent heat fluxes (i.e., evapotranspiration) was isolated and removed while land surface conditions were kept the same. In particular, Sun and Barros (2015a) showed that the contribution of surface latent heat fluxes explains a positive storm-scale EtPI feedback on precipitation (enhancement factor of 1.6) realized through increases in low-level instability and entropy that impact convective activity along the foothills and favor upslope moisture transport from low to mid and high-elevations. Even if specific long-term secondary impacts on regional climate are difficult to extrapolate due to non-linear interactions among large-scale remote climate change impacts on moisture flux convergence patterns and precipitation at local and regional scales, these previous studies support the hypothesis that decreases in orographic precipitation, and thus intensification of meteorological drought, and through cascading effects hydrological drought and fire risk should be expected from EtPI feedbacks associated with forest removal.
In this study, the objective is to investigate how realistic land-cover changes impact orographic precipitation processes in the EADS with implications for hydrologic response. In particular, the impact of extending land-cover changes due to anthropogenic activities from low (∼500 m) to high elevations near the treeline (∼3,500 m) is examined by converting TMFs to savanna in the tropical EADS (Figure 1) for three weather regimes that dominate regional precipitation climatology. Building on previous work, a Cold Air Intrusion (CAI) during October 3–6, 2013, associated with extreme rainfall in the central Andes (Eghdami and Barros, 2019a), is selected for the dry season. CAIs are recurrent synoptic-scale features in South-America, and Eghdami and Barros showed that during CAI events, high atmospheric moisture contents and strong shallow convection lead to localized extremes in orographic precipitation along the EADS foothills as the cold front propagates northward. The two other cases are monsoon events from Sun and Barros (2015a, b) associated with South America Weak Low-Level Jet (WLLJ) and Strong Low-Level Jet (SLLJ) conditions along the tropical EADS slopes at low levels. Note that by changing vegetation from TMF to savanna, this implies changes not only in evapotranspiration tied to plant functional type but also changes in surface albedo, emissivity, and surface roughness, which is different from Sun and Barros (2015a, b). The manuscript is organized as follows. Section “Experimental Design” describes the numerical experiment design and provides an overview of the meteorological setting for each of the three cases. The results are analyzed and discussed in Section “Results and Discussion”, followed by Conclusions and Outlook in Section “Conclusion and Outlook”.
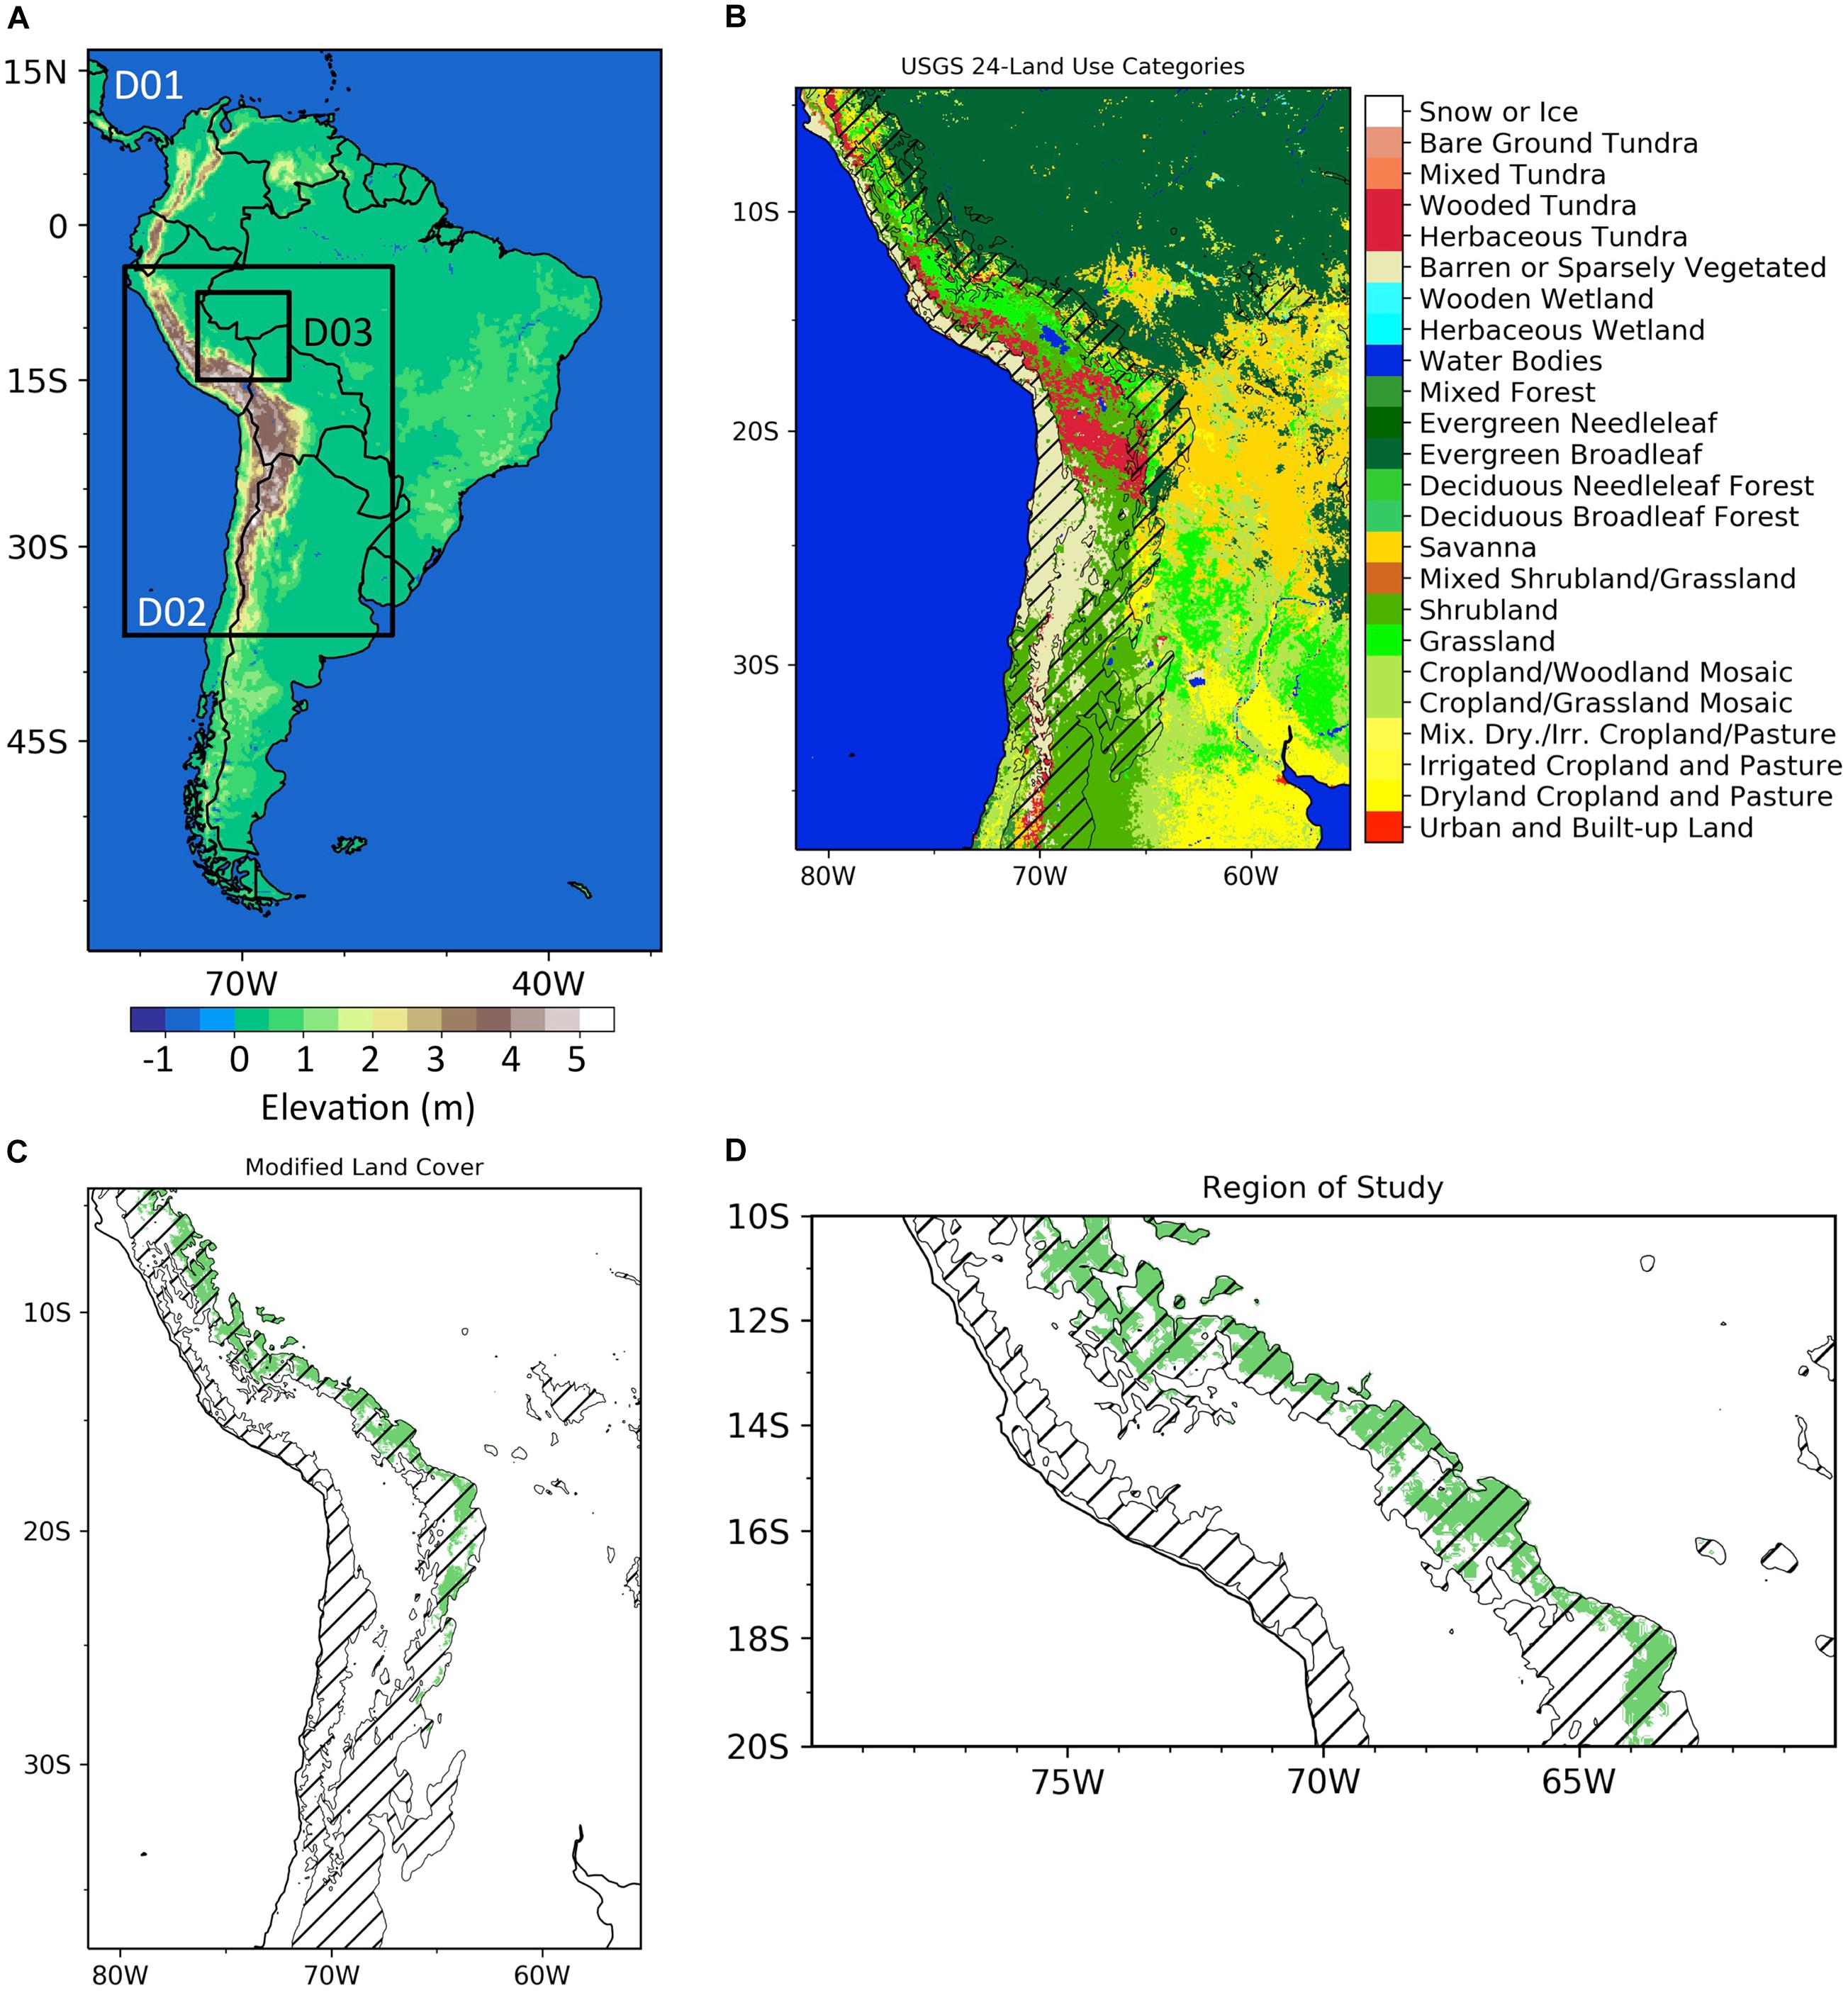
Figure 1. (A) Domain setup for numerical simulations with 3 nested domains with gradually smaller grid spacing: D01 (18 km), D02 (6 km), and D03 (1.2 km). (B) Default USGS 24-land use categories in WRF version 4.1 for (D02, 18 km) and (C) modified land use category shown with a green shade. The hashed contour areas show the elevations between 500 and 3,500 m. (D) Zoom of (B) over the region of study.
Experimental Design
The numerical experiments are designed to investigate the impact of replacing tropical montane forests by savanna on moist processes and atmospheric circulation in the eastern Andes at the storm-scale following previous studies (Sun and Barros, 2015a, b; Eghdami and Barros, 2019a, b). The numerical set-up (Figure 1A) consists of 3-domain nested grids, and 1.2 km grid-spacing in the inner nested domain to capture the interactions between strong synoptic systems and complex topography. The grid-spacing ratio between the outer (D01, 18 km) and intermediate (D02, 6 km) domains is 1:3 with 316 × 496 and 442 × 607 horizontal grid points, respectively (Figure 1). The grid-spacing ratio between the intermediate and inner domains (D03, 1.2 km) with 756 × 726 horizontal grid points is 1:5. All the domains have 60 vertical layers in the atmosphere with the top at 50 hPa and 4 soil layers at the bottom. Here, the latest version of the Weather and Research Forecasting model (WRF version 4.1, Skamarock et al., 2019) to solve the compressible Eulerian non-hydrostatic flow equations is applied with a 6-h spin-up time in the outer domain grid (D01) and one-way coupling between nested grids. WRF version 4.1 uses terrain-following, mass-based, hybrid sigma-pressure vertical coordinates, superior to the previous vertical coordinates in complex topography. Initial and boundary conditions are extracted from the National Centers for Environmental Prediction Final Operational Global Analysis (NCEP FNL) available at 1° × 1° resolution every 6 h (Kalnay et al., 1996) with 26 vertical layers between 1,000 and 10 hPa in addition to the surface layer. The selection of physical parameterizations follows recent studies of orographic precipitation (e.g., Wilson and Barros, 2015, 2017) and includes the Mellor–Yamada–Nakanishi–Niino (MYNN level 2.5; Nakanishi and Niino, 2006) planetary boundary layer scheme, the Milbrandt microphysics scheme (Milbrandt and Yau, 2005a, b), and the Noah land surface model (Ek et al., 2003). The Rapid Radiative Transfer Model (RRTM) (Mlawer et al., 1997) and the Dudhia scheme (Dudhia, 1989) are used to estimate longwave and shortwave radiation at 1 min intervals. The Kain-Fritsch cumulus parameterization (Kain, 2004) scheme is applied in the outer and intermediate domains, whereas in the inner domain, convective processes are explicitly resolved.
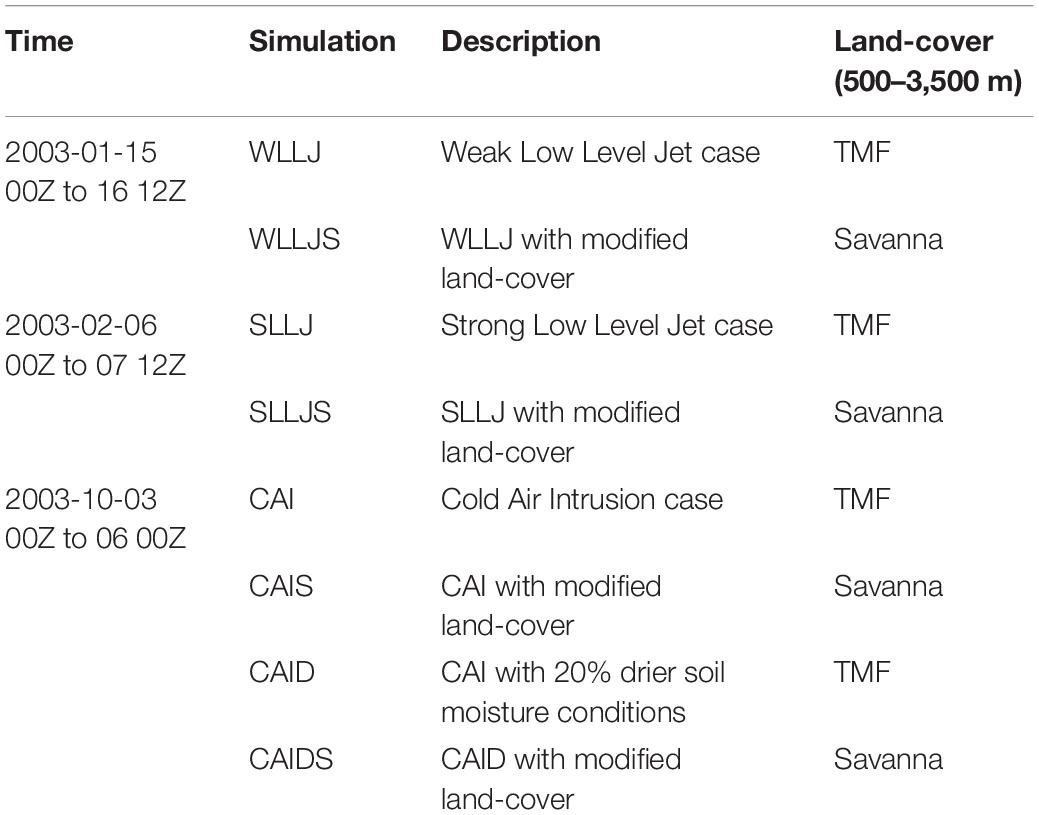
The control simulations rely on land-cover classes from the default United States Geological Survey (USGS) datasets available in WRF. Figure 1B shows the WRF default land cover and topography. In the modified land cover simulations, the evergreen broadleaf trees index between 500 and 3,500 m is overwritten with the savanna index (Figure 1C, green colors). Note the latitudinal variability of the altitudinal extent of this replacement that tracks the tree line. The Weak and Strong Low-Level Jet (hereafter, WLLJ and SLLJ, respectively) and the Cold Air Intrusion (hereafter, CAI) events are simulated for both control (original TMF) and modified land-cover conditions (savanna). The letter “S” is appended to the name of simulations using the modified land cover referred to as WLLJS, SLLJS, and CAIS (Table 1).
Detailed synoptic-scale analysis of the three events simulated here can be found in Sun and Barros (2015a, b) for the WLLJ and SLLJ cases, and in Eghdami and Barros (2019a) for the CAI case. For assessing the impact of land-cover change on atmospheric moist processes, the focus here is on low-level instability changes as measured by Maximum Convective Available Potential Energy (MCAPE) and precipitation changes along the EADS foothills. Lastly, an exploratory sensitivity analysis to examine the hydrometeorological feedback of forest loss for dry spells in the austral spring season is conducted by repeating the CAI case-study for initial conditions corresponding to a 20% decrease in soil moisture as a proxy of water stress conditions for both control (CAID) and deforestation scenarios (CAIDS). A summary list of the eight simulations is presented in Table 1.
Even small differences in land-cover and topography can have an important impact on high-resolution Numerical Weather Prediction (NWP) simulations of surface temperature and precipitation (Schicker et al., 2016; Serafin et al., 2018) that can be amplified depending on stability conditions (Tao and Barros, 2008). Saavedra et al. (2020) used an updated land use and topography dataset (the data are from Eva et al., 2004) instead of the default datasets in their simulations with WRF v3.7 and claimed reduced bias of simulated January precipitation and surface temperature in the Andes against observations. This improvement was attributed to changes in circulation to better representation of moist fluxes near the surface. Here, the focus is on assessing the impact of land-atmosphere interactions tied to land-cover changes on stability conditions and precipitation by differencing Control (original TMF) and modified land-cover simulations.
Figures 2, 3 show the evolution of MCAPE and 850 hPa winds at selected times during the WLLJ and SLLJ events, respectively. The WLLJ case (January 15 00Z to 16 12Z, 2003) is associated with persistent northwesterly winds along the eastern flanks of the Andes. The maximum equivalent potential temperature (θe) height level in the lowest 3,000 m is found as a reference for MCAPE using a parcel with a depth of 500 m centered at this maximum reference. The moisture and temperature characteristics of this parcel are used for calculating the MCAPE using wrf-python software (Ladwig, 2017). The CAPE values during the afternoon (January 15 18Z and January 16 00Z) are between 1,000 and 2,000 J Kg–1, indicative of unstable conditions and convective activity that can be further enhanced by orographic forcing. The SLLJ case (February 06 00Z to 07 12Z, 2003) is dominated by a stronger northwesterly low-level jet, a prominent monsoontrait. Due to the presence of strong synoptic controls on moisture flux convergence, the local impacts on rainfall due to the savanna expansion are very small. The CAPE values are generally higher for SLLJ than for WLLJ conditions and peak in the afternoon (February 06 18Z and February 07 00Z) in the 2,000–3,000 J Kg–1 range. In this SLLJ case, there is no system of high pressure in the mid latitudes, which is a significant feature of the CAI case.
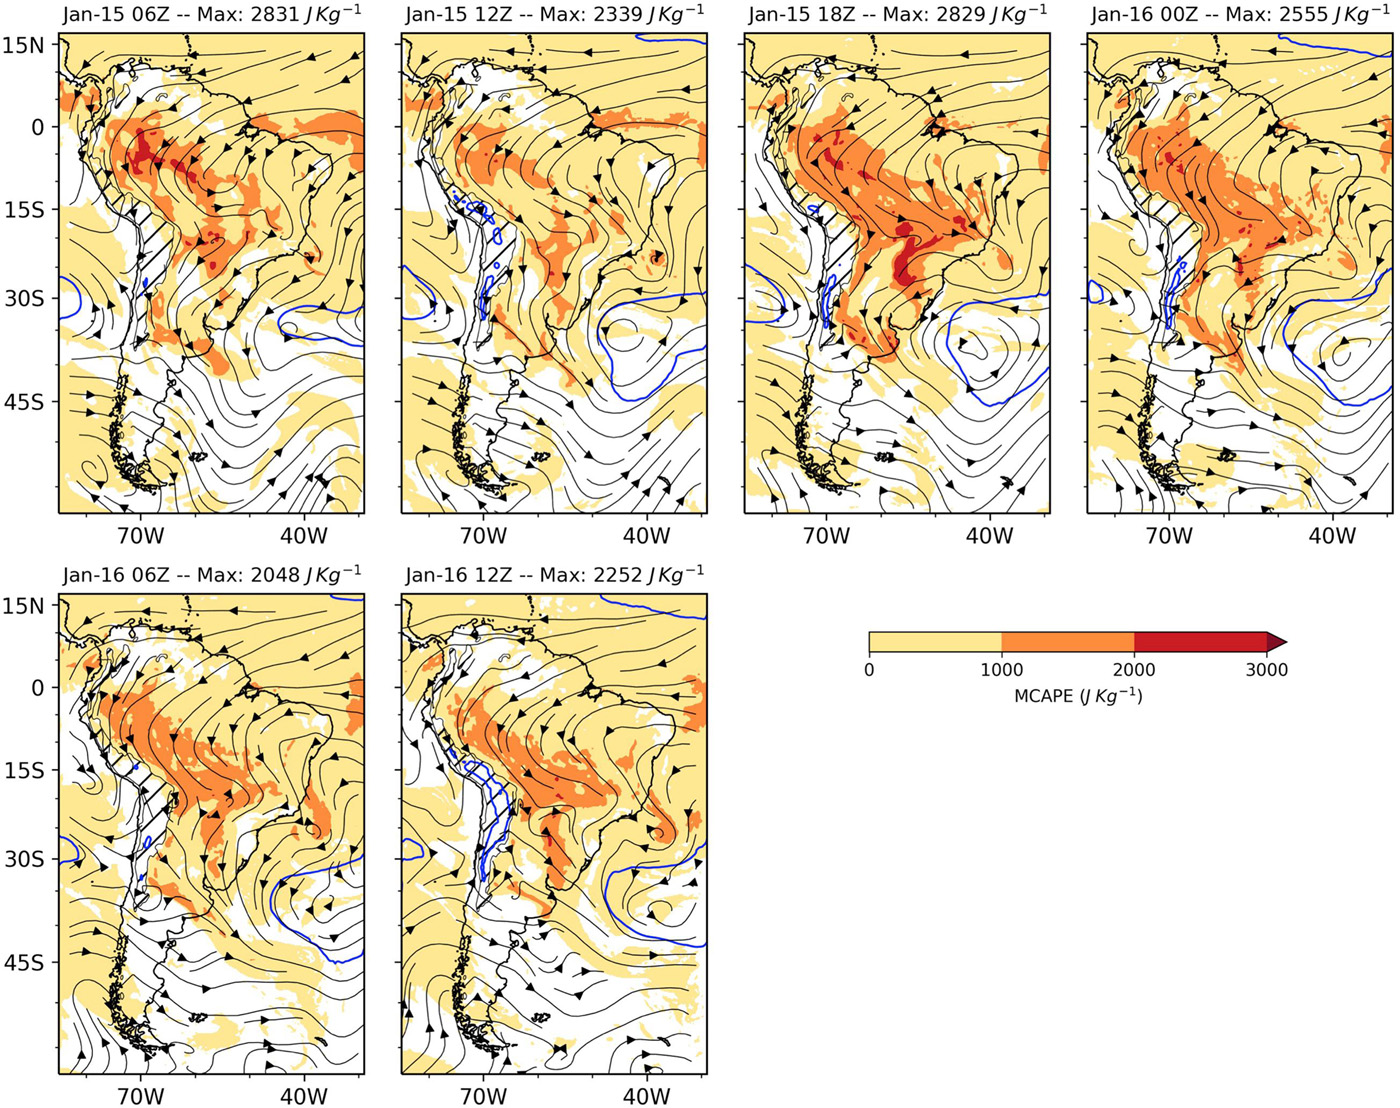
Figure 2. WRF simulation (D01, 18 km) of the WLLJ case during January 15 00Z to 16 12 Z, 2003. The maps show the evolution of the MCAPE in the lower 3,000 m during the simulation. The streamlines show the 850 hPa horizontal wind and the blue contour delineate the 1,020 hPa sea level pressure.
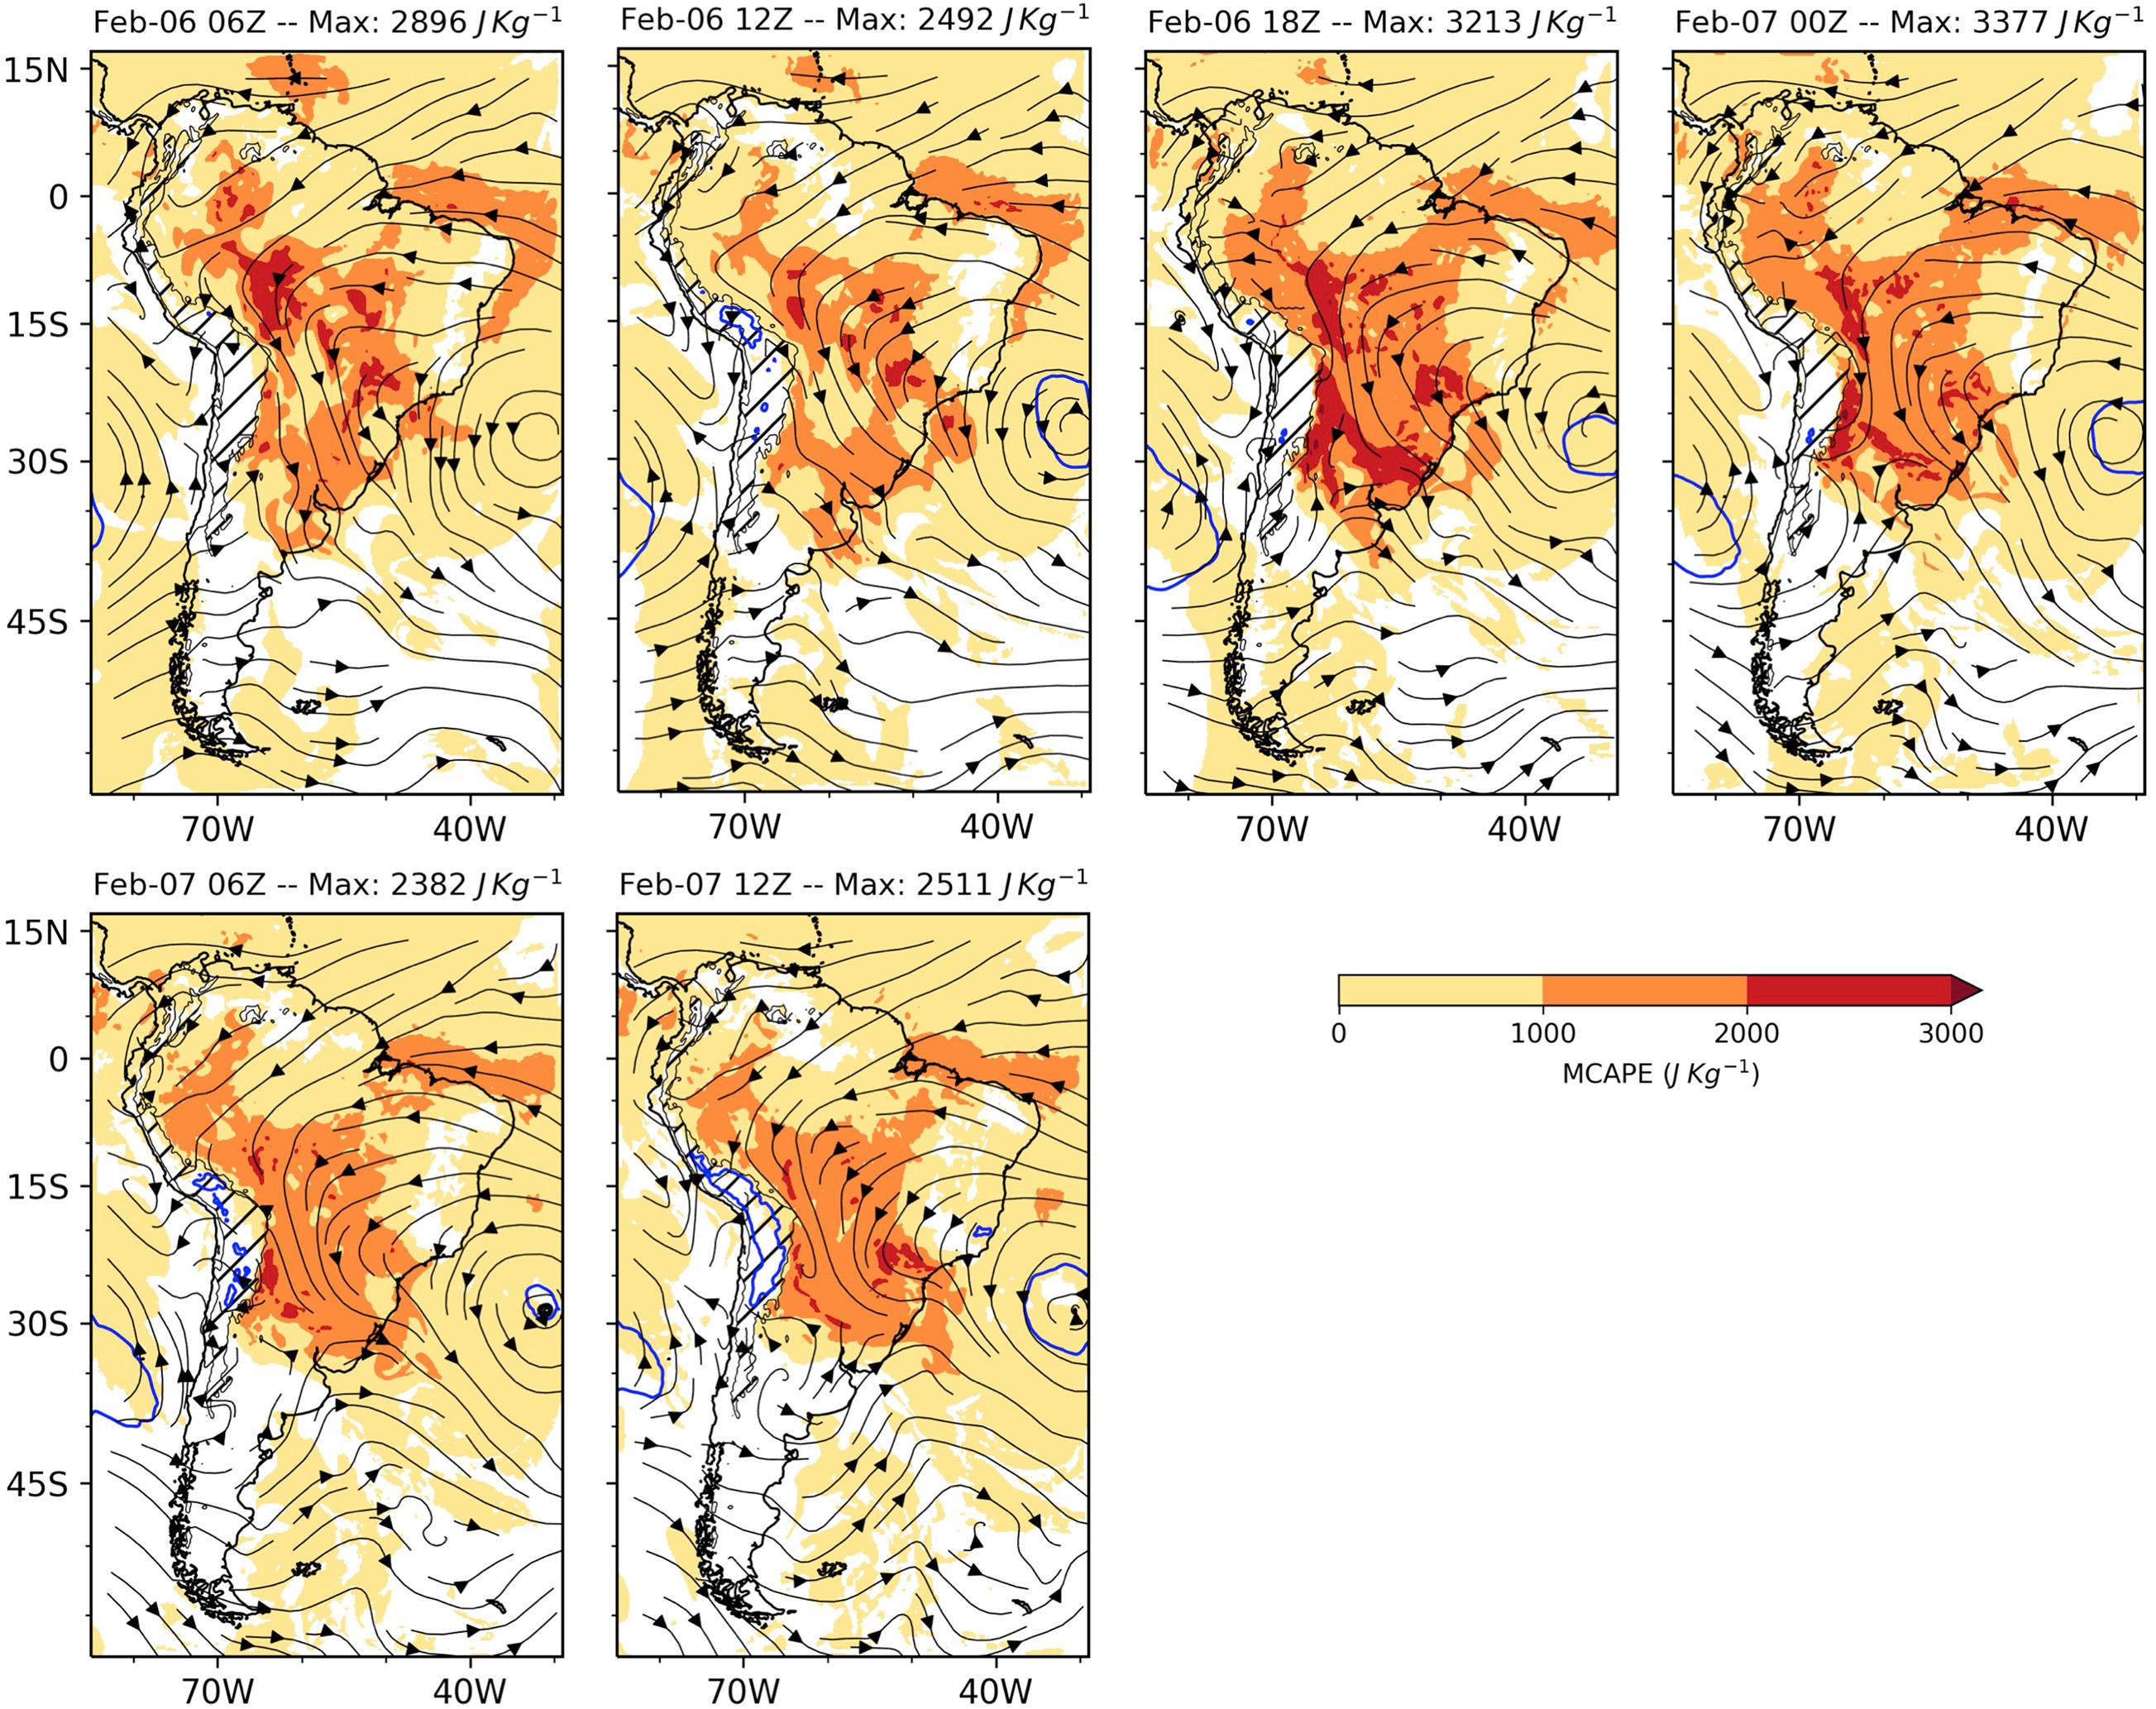
Figure 3. WRF simulation (D01, 18 km) of the SLLJ case during February 06 00Z to 07 12 Z, 2003. The maps show the evolution of the MCAPE in the lower 3,000 m during the simulation. The streamlines show the 850 hPa horizontal wind and the blue contour delineate the 1,020 hPa sea level pressure.
The CAI case (October 3 00Z to 6 00Z, 2013) is associated with a torrential rainfall event on October 4, 2013, recorded by rain gauges along an altitudinal transect in the Madre de Dios river basin (Barros, 2013) with up to 200 mm of rainfall measured over approximately 6 h at the orographic optimum (~1,500 m elevation). The MCAPE evolution during the CAI case is shown in Figure 4. In this case, northwesterly 850 hPa horizontal winds can be seen along the eastern flanks of Peruvian Andes during the first day of simulation (October 3). The cold front propagates northward, bringing cold and dry southerly winds to the tropics by the second and the third days. CAPE values during the second and third days of the simulations (October 4 18Z, 5 00Z and 5 18Z, 6 00Z) exceed 2,000 J Kg–1 (3,500 J Kg–1 in D03, not shown) consistent with highly unstable conditions and enhanced convective activity along and ahead of the CAI front.
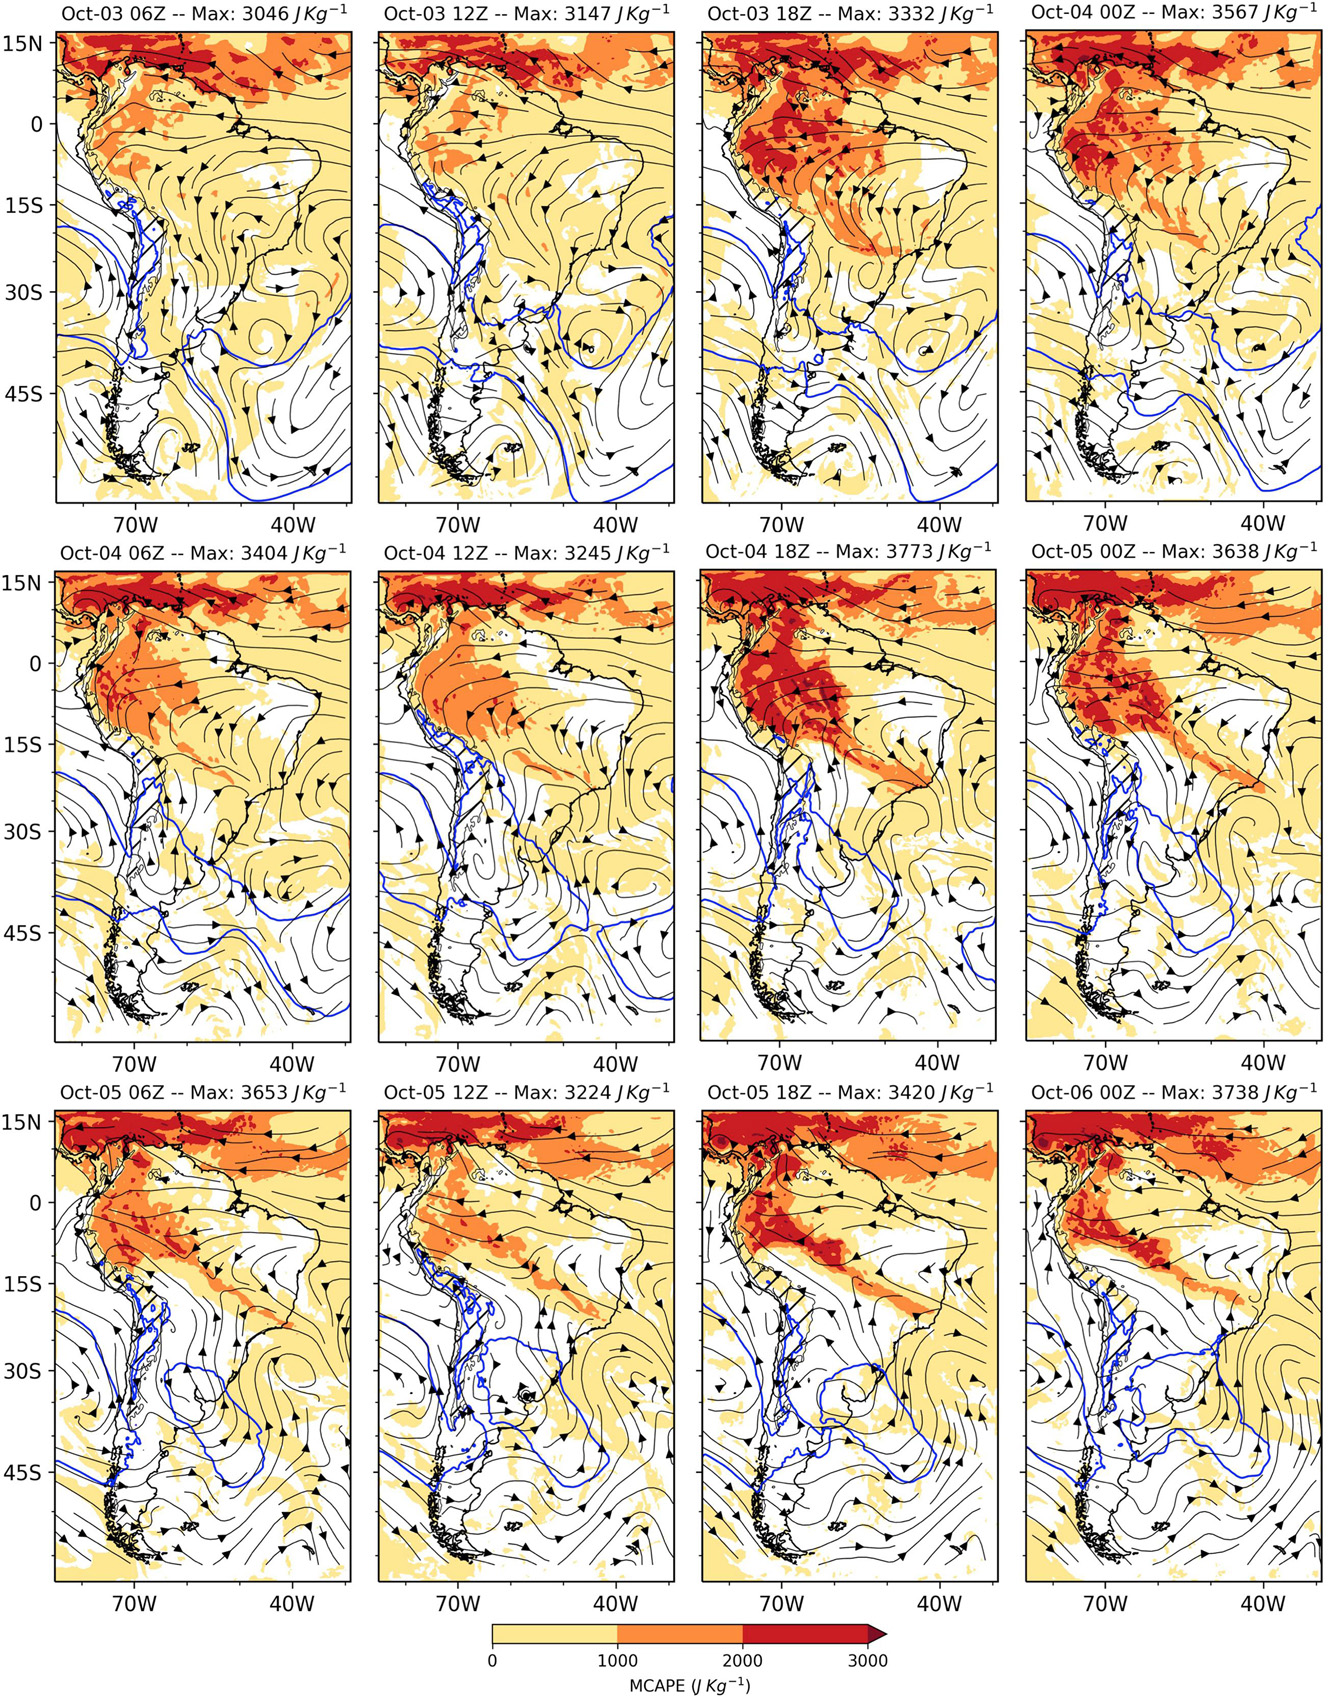
Figure 4. WRF simulation (D01, 18 km) of the CAI case from October 3 00Z to 6 00Z, 2013. The maps show the evolution of the MCAPE in the lower 3,000 m during the simulation. The streamlines show the 850 hPa horizontal wind and the blue contours delineate the 1,020 hPa sea level pressure.
Results and Discussion
Figures 5A,B show the mean and standard deviation of the daytime differences in MCAPE calculated as (TMF-Savanna) for the WLLJ case (10 a.m. to 6 p.m.) when convective activity is dominant. The positive differences in mean MCAPE within the EADS’ hatched area are closely aligned with the land cover changes depicted in Figure 1D. Higher convective activity above the 500 m elevation contour line in the control case promotes convective cloudiness and rainfall at higher elevations. Consequently, a downslope shift in the precipitation pattern results from the replacement of the montane forests with savanna. The spatial co-organization of changes in the mean MCAPE away from the EADS into the Amazon foreland basin along with larger standard deviations are attributed to the inherent chaotic properties of weather systems in those areas and do not represent a systematic cause-effect impact of land-cover change. Similar maps of the mean and standard deviation of the daytime differences in MCAPE for the SLLJ case (10 a.m. to 6 p.m.) are presented in Figures 5C,D. The positive differences in mean MCAPE in the EADS hatched area exhibit features similar to the WLLJ, showing a systematic enhancement of land-atmosphere interactions when the forest is present. Albeit small, the results further support the downslope shift in the precipitation pattern due to the replacement of montane forests with savanna. Whereas land-cover change impacts similarly both monsoon cases, event-specific impacts are quantitatively constrained by the synoptic environment. The enhancement seen in the lower elevations and away from the foothills is not similar to the WLLJ case, and the overall impact is much reduced.
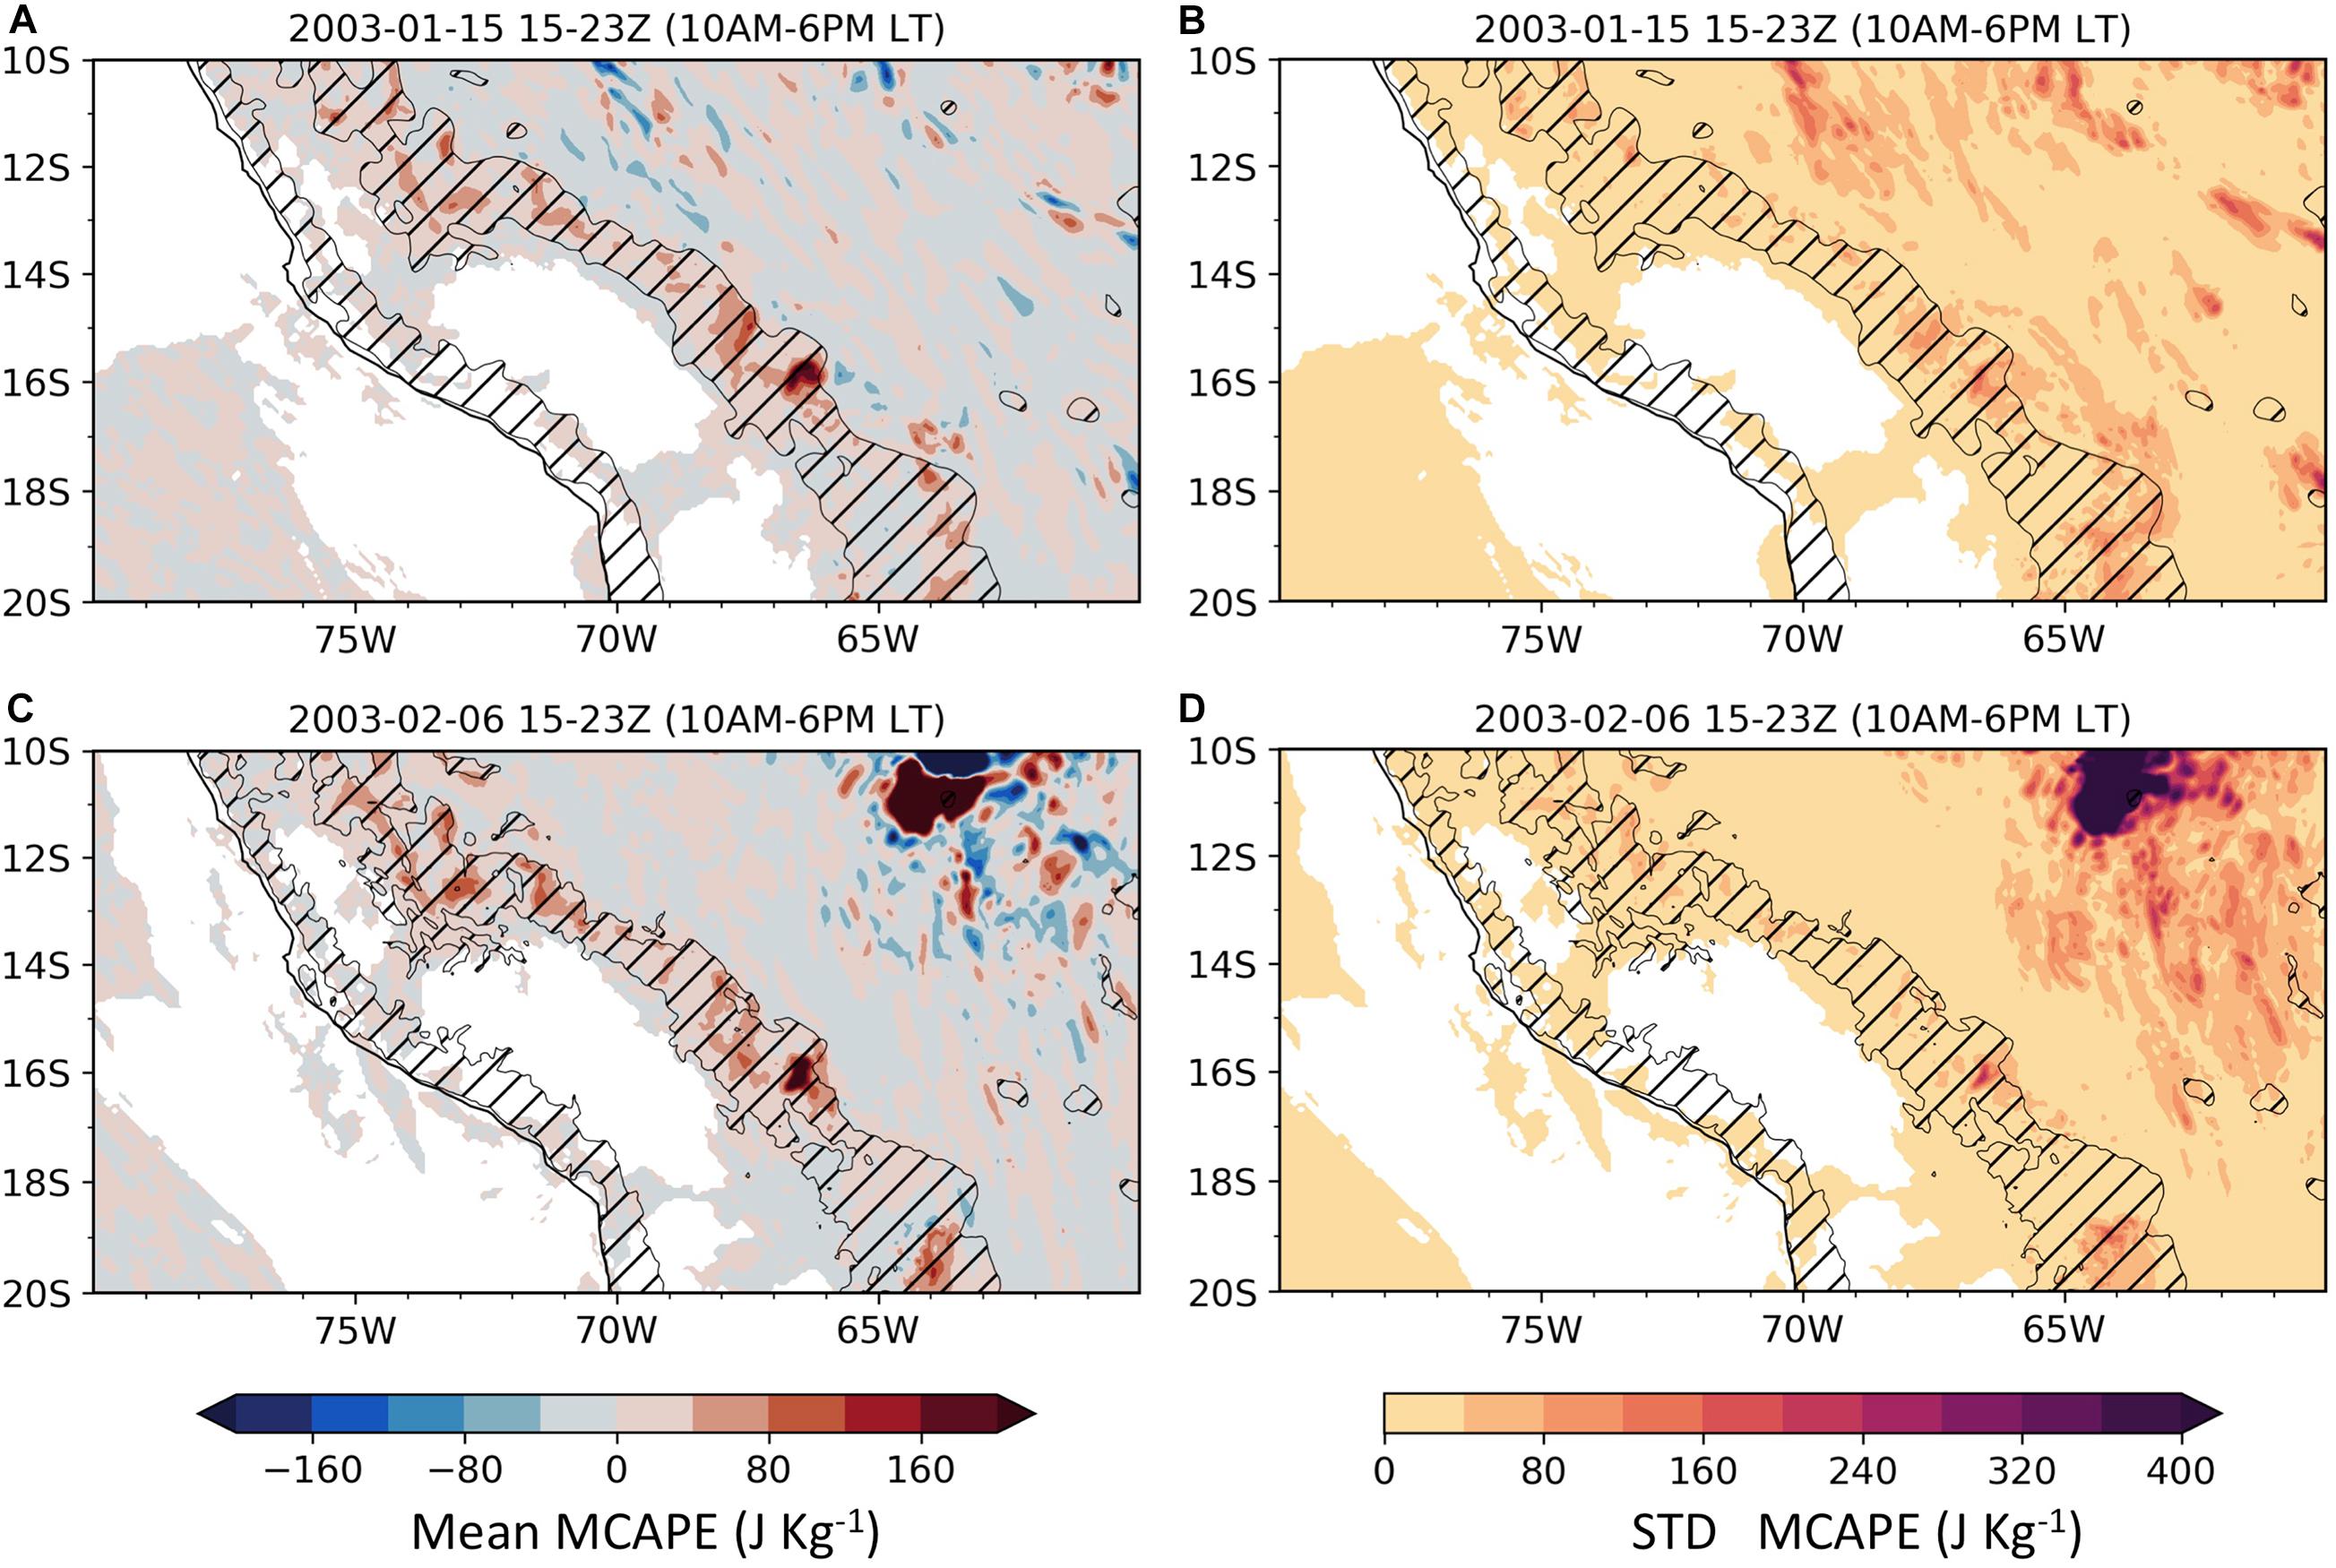
Figure 5. Mean (A) and standard deviation (B) of differences (WLLJ – WLLJS) in MCAPE between the control and the modified land-use simulation from the WRF simulation (D02, 6 km) for WLLJ case. The mean and standard deviation are calculated for the daytime that is between 15Z and 23Z (10 a.m. to 6 p.m. LT). The hashed lines show the elevation band between 500 and 3,500 m. (C,D) are similar but for SLLJ case.
The spatial patterns on the EADS slopes (hatched area) in Figure 6 are similar to those in Figure 5, and show enhanced MCAPE above the 500 m contour during the first day (top row) with enhanced MCAPE areas aligned with the regions where the TMF was replaced. During the second (middle row) and third days (bottom row), significant differences in the spatial patterns of mean MCAPE associated with savanna in the 500–3,500 m elevation bands track the northward propagation of the CAI front. On the first day, EtPI play a governing role in organizing EADS convective activity everywhere. Upon the arrival of the CAI front, synoptic and regional scale dynamics are dominant, stable and cold conditions prevail behind the front, and thus EtPI are active ahead of the front only in the second and third CAI days. Note the spatial agreement between the standard deviation and the average daytime MCAPE differences consistent with intense convective activity at the intersection of the front with the topography, as pointed out by Eghdami and Barros (2019a) along the EADS, and ahead of the front at low elevations in the Amazon basin. Furthermore, the reduction in MCAPE (up to 400 J kg–1) for the savanna simulation relative to the TMFamounts to 50–100% decrease (see Supplementary Information S1). This reduction results in less convective activity after conversion to savanna due to the decrease of latent heat fluxes into the planetary boundary layer.
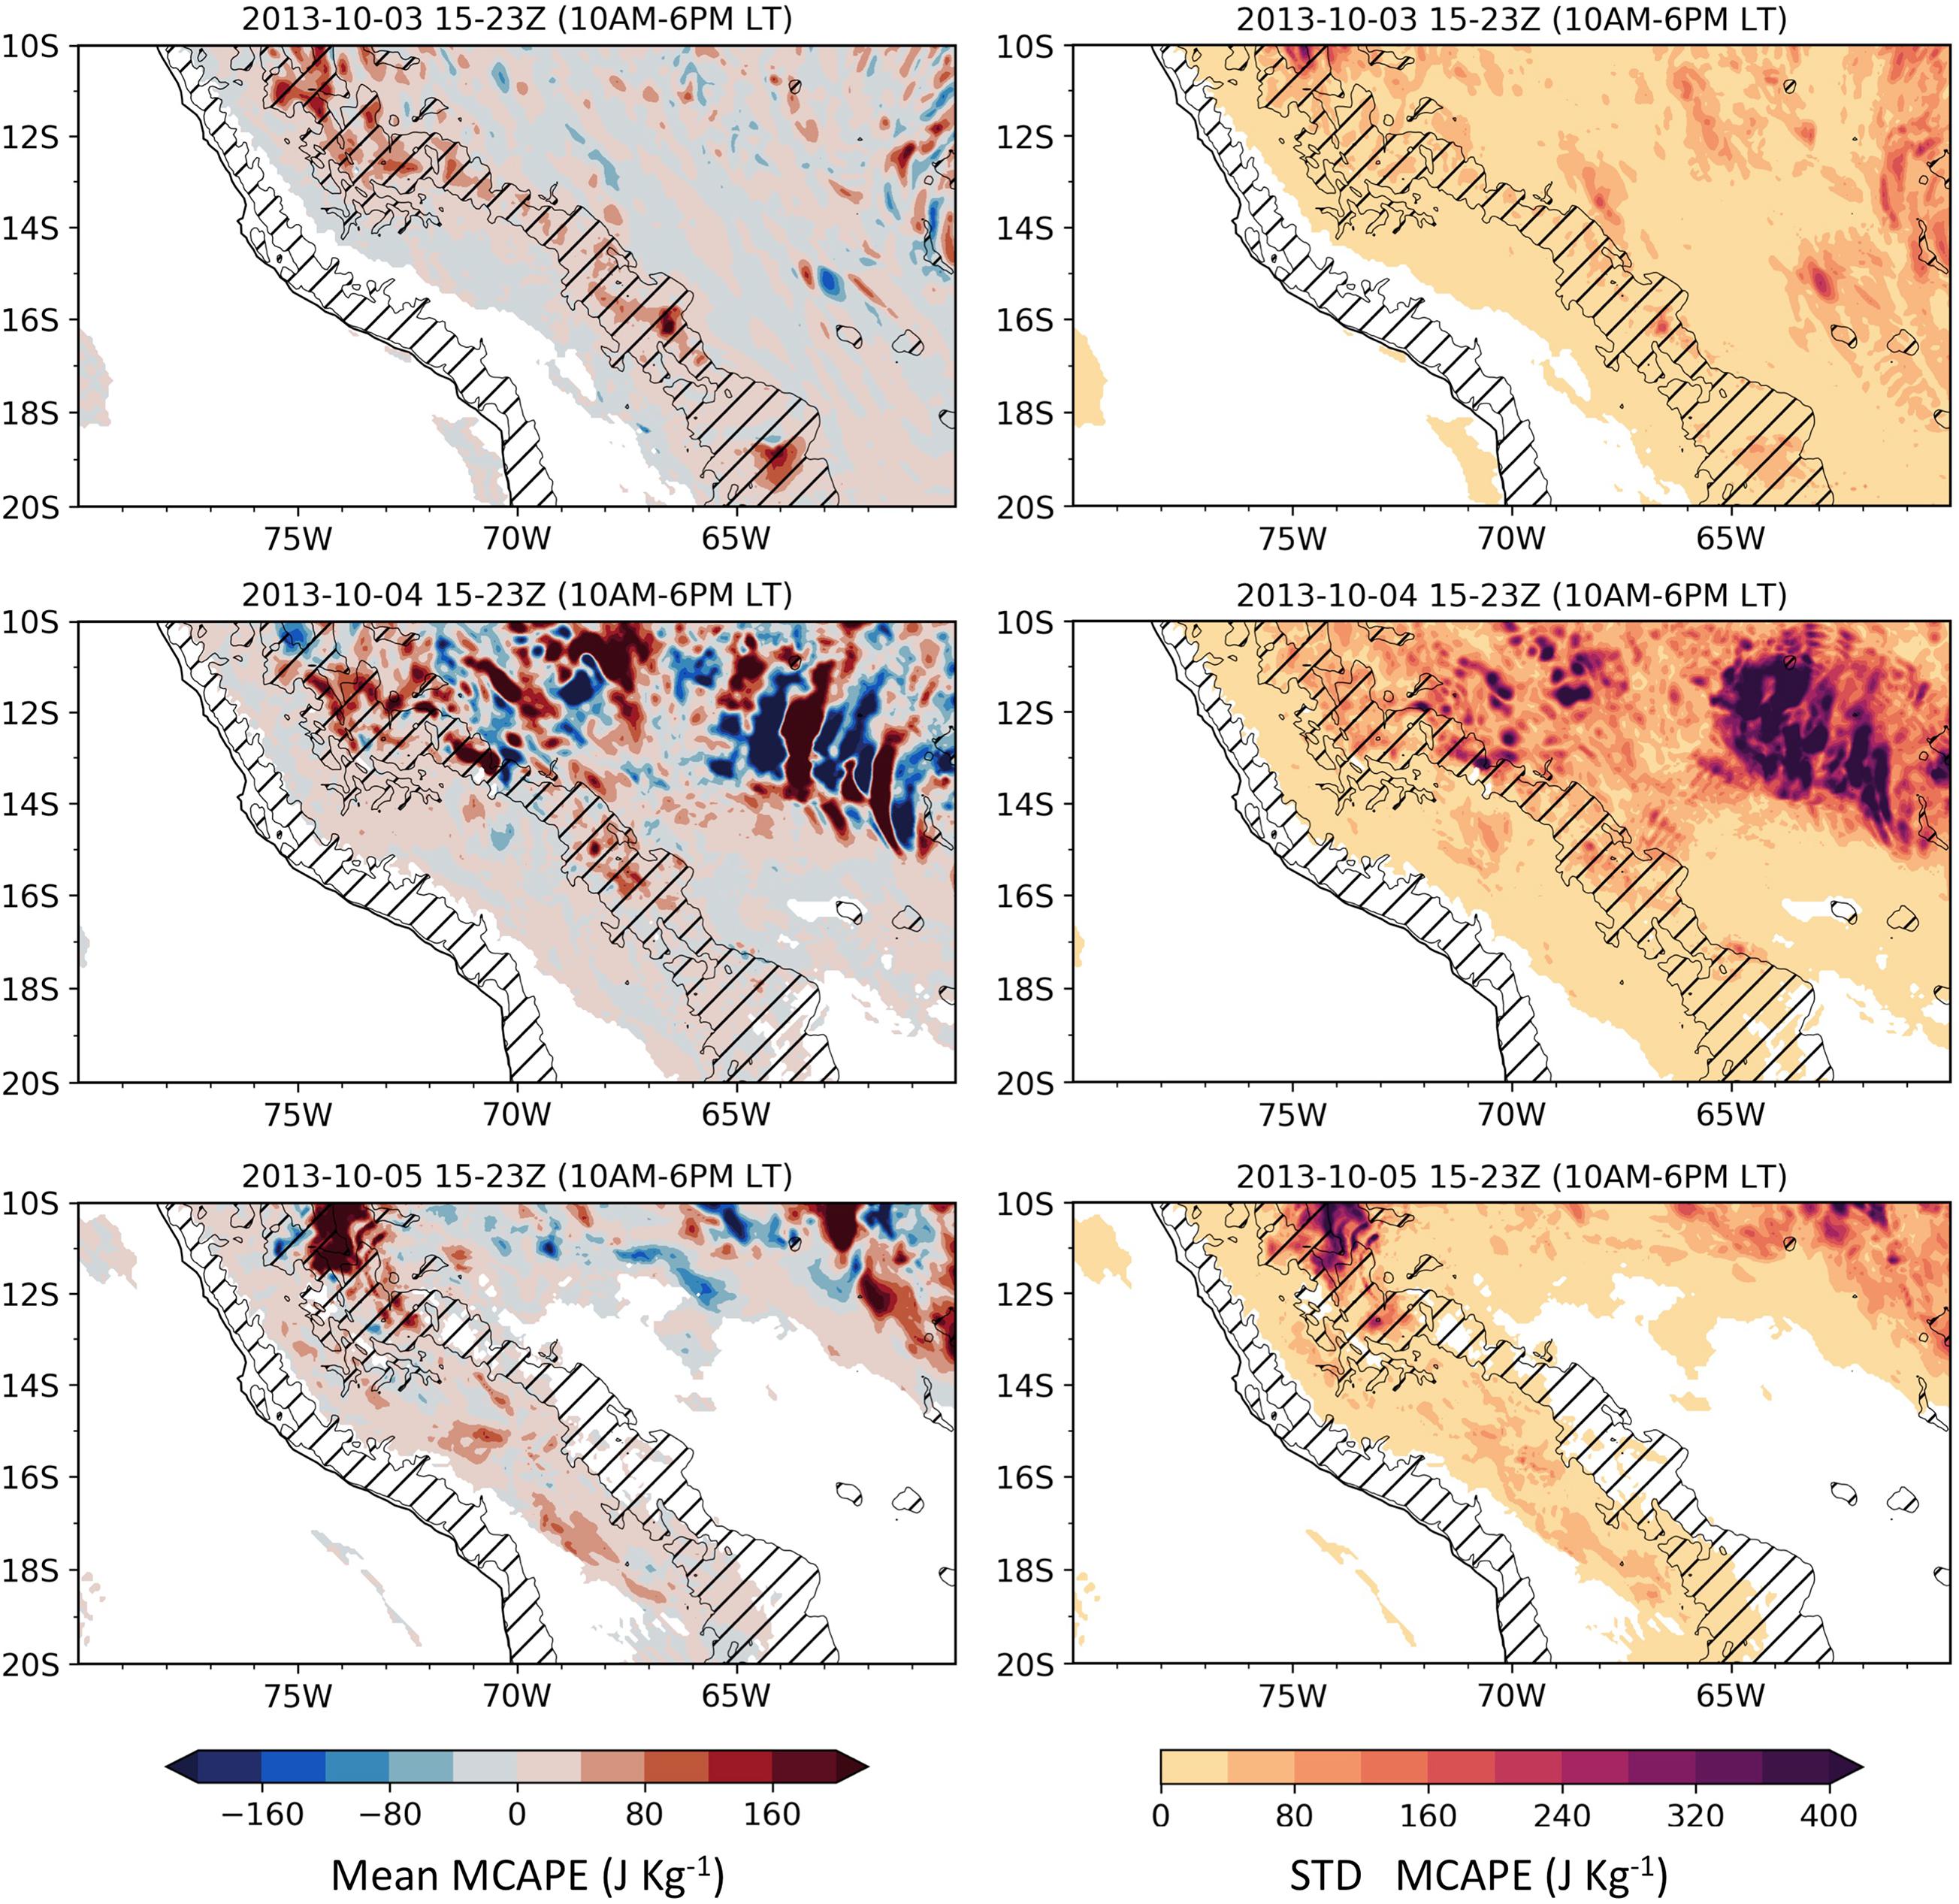
Figure 6. Mean (left column) and standard deviation (right column) of differences (CAI – CAIS) in MCAPE between the control and the modified land-use simulation from the WRF simulation (D02, 6 km) for the CAI case. The mean and standard deviation are calculated for daytime that is between 15Z and 23Z (10 a.m. to 6 p.m. LT). The hashed lines show the elevations between 500 and 3,500 m. white background-not defined.
Replacement of the TMF with savanna results in reduced latent heat flux, weaker convective activity, and vertical transport of moisture leading to decreased precipitation on the EADS slopes above 500 m. Figure 7 shows the average accumulative rainfall from the high-resolution domain (D03, 1.2 km) for a 30 km wide cross-section centered at 13.00 S. This cross-section is chosen as it is close to the Madre de Dios rain gauge network that measured a record high rainfall of 200 mm in less than 6 h on October 3–4, 2013 (CAI case, see Eghdami and Barros, 2019a). The overall precipitation pattern over the mountains does not change significantly (Figure 8, top row), but the peak of accumulated rainfall shifts downslope with rainfall decreasing between 500 and 1,500 m and rainfall increasing toward the lower elevations (below 500 m). The results are similar for the WLLJ case (Figure 8, bottom row) with weak attenuation of rainfall over the EADS, especially at mid elevations (between 500 and 1,500 m, the orographic optimum), and heavier rainfall lower elevations similar to results in Sun and Barros (2015a). The precipitation is not significantly impacted for the SLLJ case. The results are in agreement with the changes in the MCAPE patterns (Figures 5, 6) and the spatial fields of the daily averaged cloud content (Supplementary Information S2).
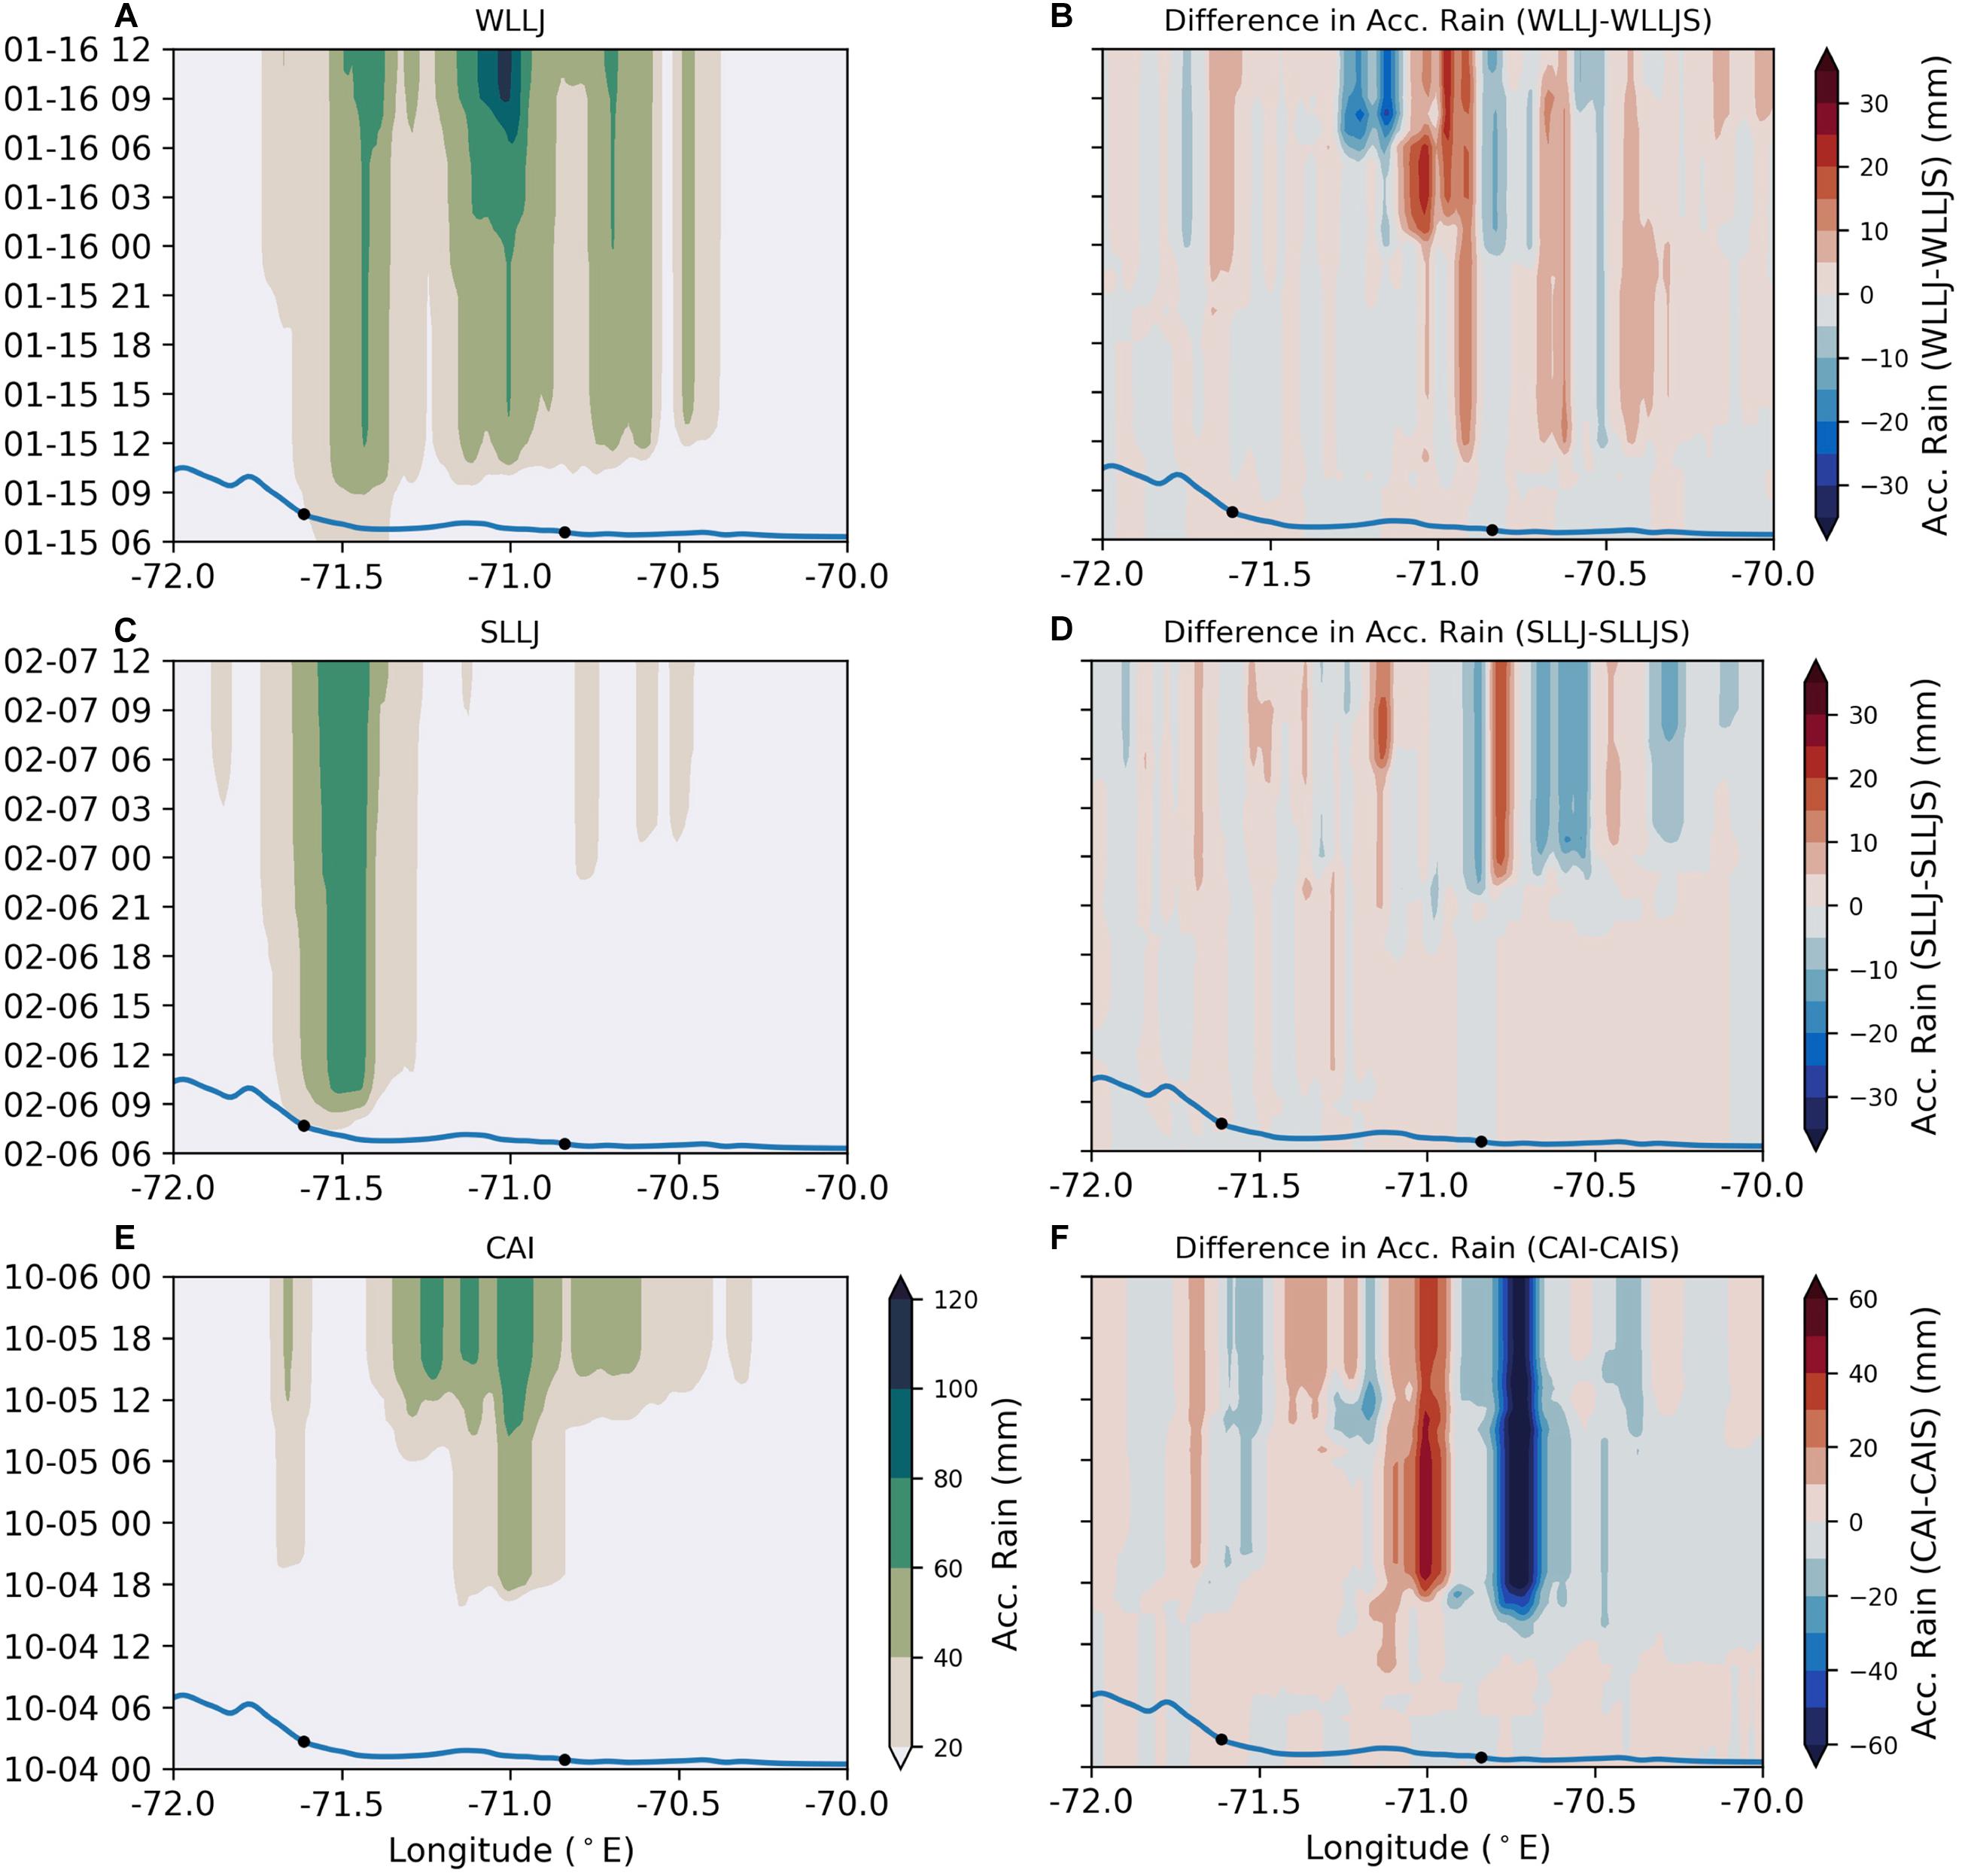
Figure 7. Hövmöller diagram of the evolution of accumulative rain for TMF runs (left column) and the accumulative rain differences TMF-savanna (right column), respectively, for WLLJ and WLLJS (A,B), SLLJ and SLLJS (C,D), and CAI and CAIS (E,F) cases. The rain is accumulated from the beginning of each simulation. The values are from the WRF high-resolution domain (D03, 1.2 km) averaged over a 30 km wide cross-section band centered at latitude 13.00 S. The blue line shows the topographic profile at 13.00 S. The circles mark the 500 and 1,500 m elevations.
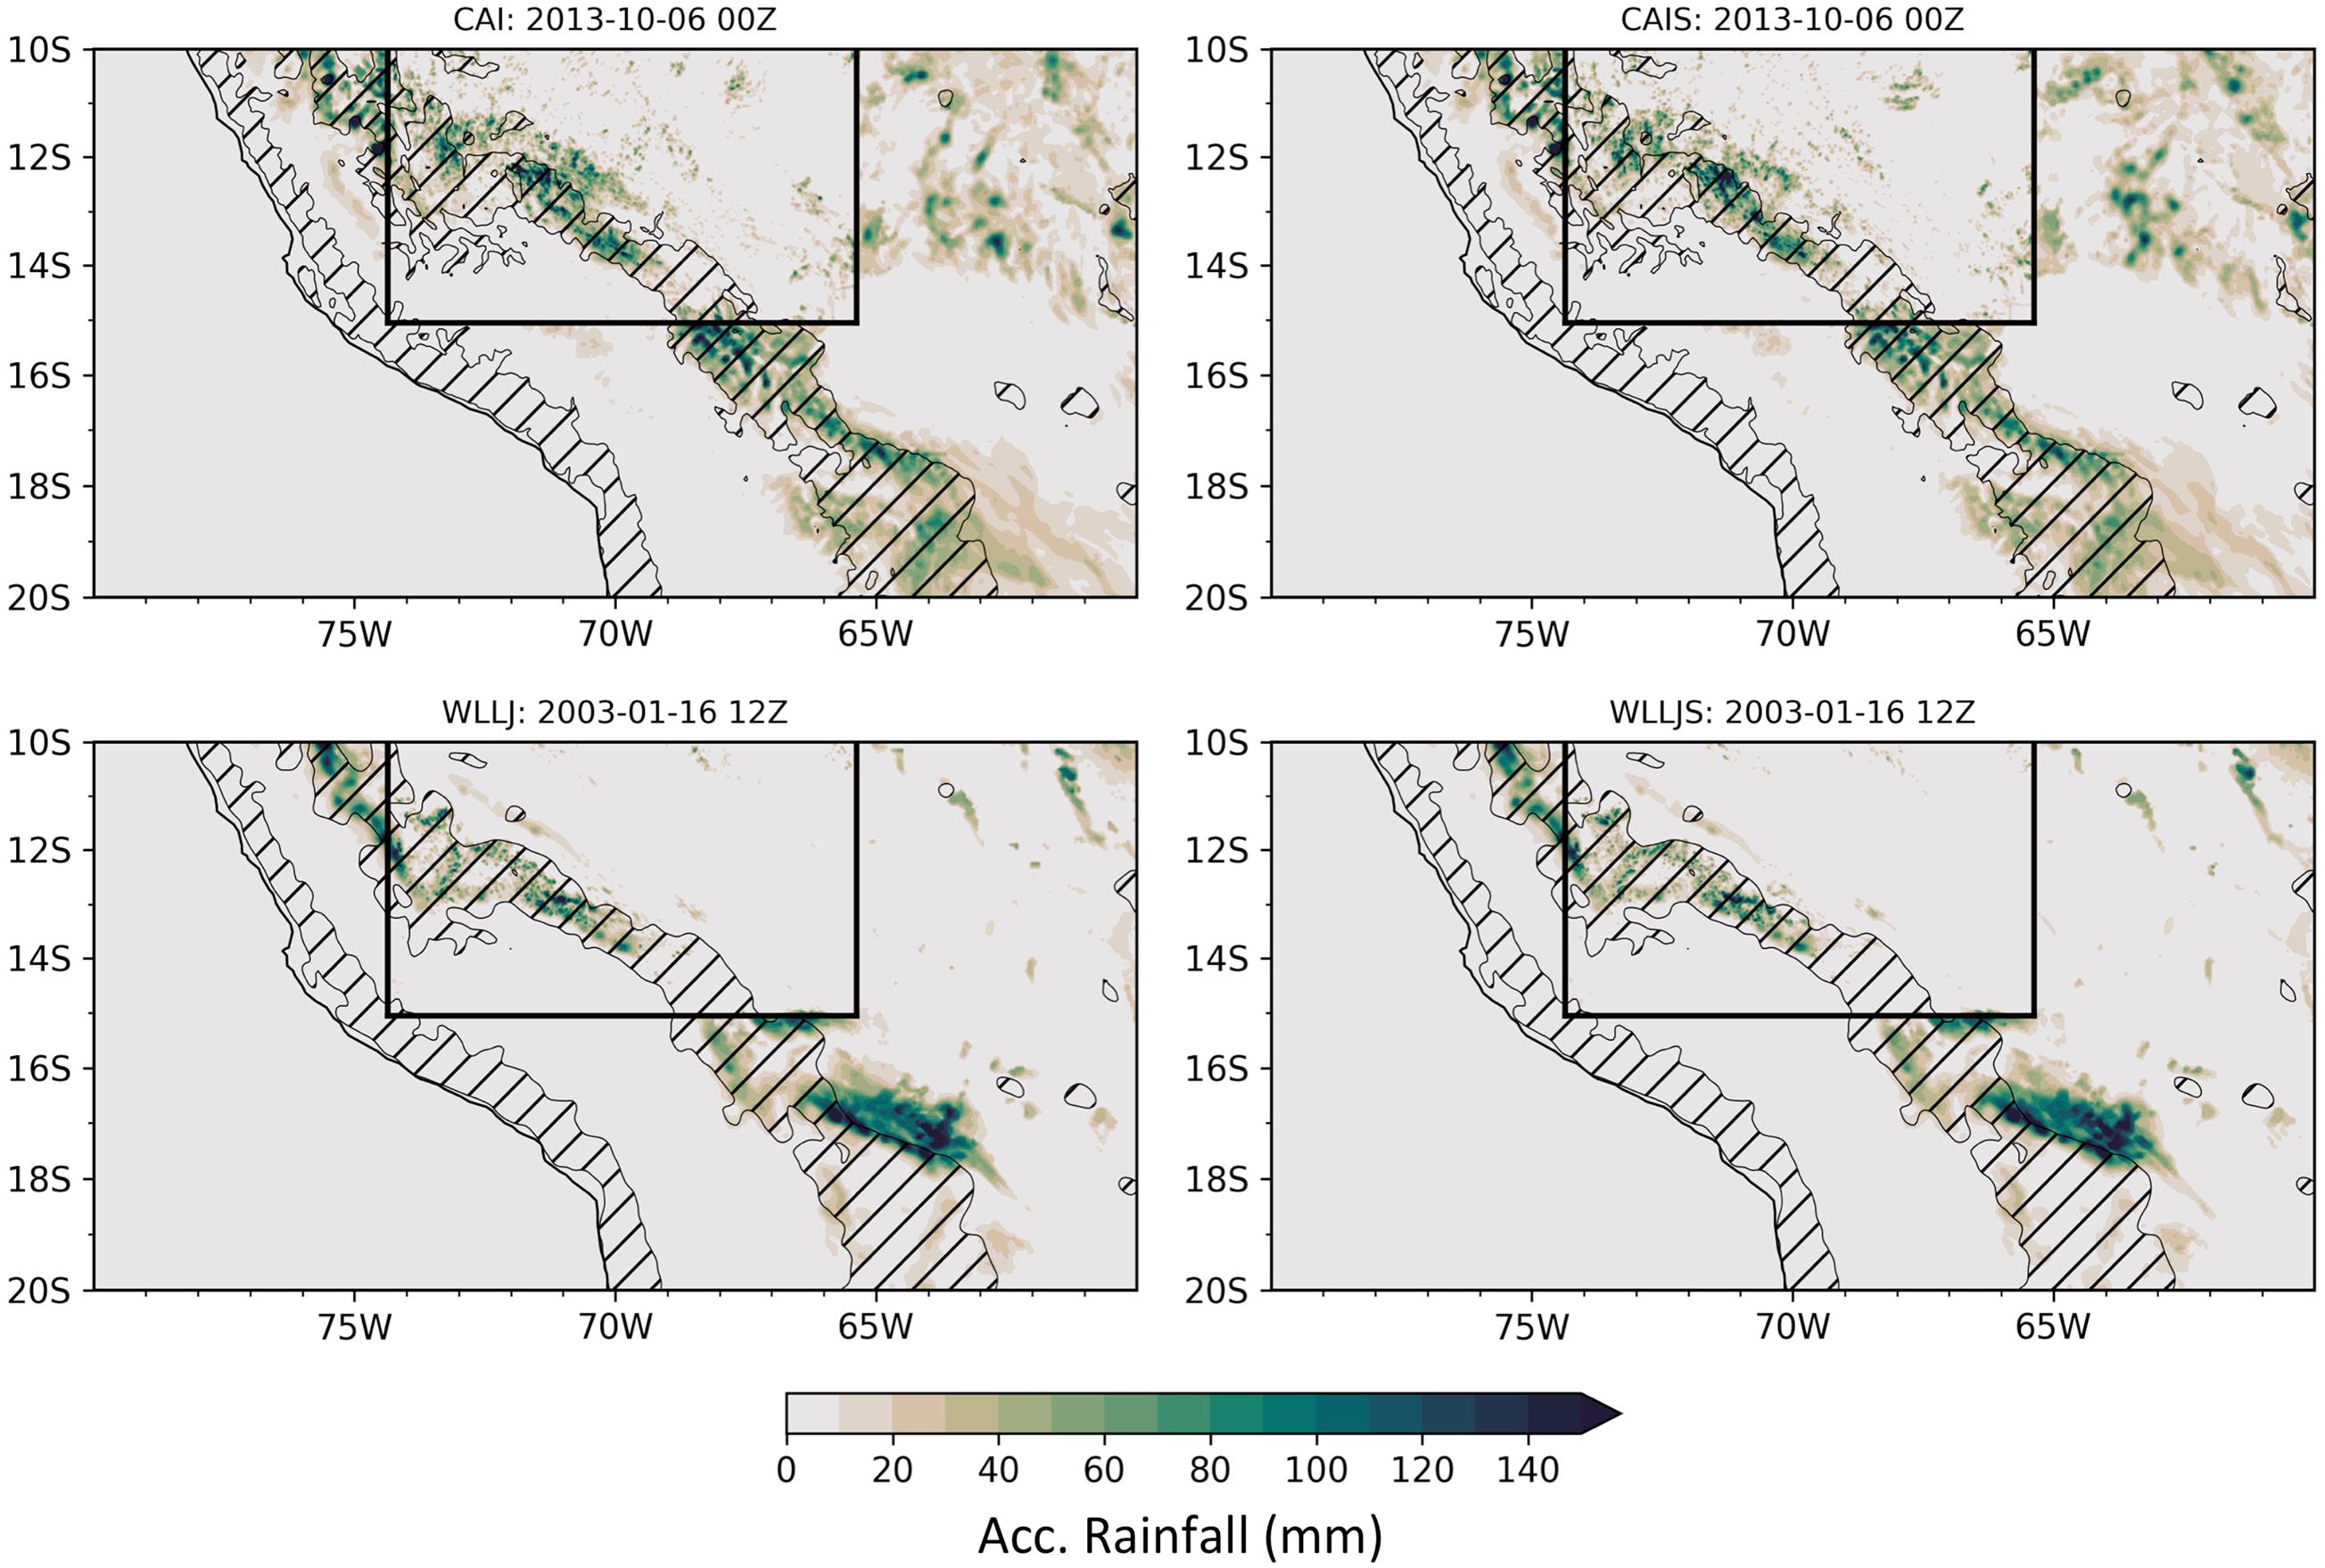
Figure 8. Map of rainfall accumulation for CAI and CAIS (top row) and WLLJ and WLLJS (bottom row) WRF simulations over D02. The box delineates D03.
Differences in the frequency distribution of daytime rainfall intensities between the TMF and the savanna simulations organized by altitudinal band are shown in Figure 9 for D02. The results show increases in the frequency of light rainfall rates (< 2 mm/h) and decreases in moderate rain rates (2–10 mm h–1), especially at intermediate elevations where orographic enhancement is stronger (500–2,000 m; Classes B, C, and D, confidence level in the 95–99%, Supplementary Information S1). The decrease in the frequency of rainfall intensity in the 8–12 mm/h range in the 500–1,000 m elevation band (Class B) and the 20 km downslope shift in maximum precipitation on the second day of the CAI event are closely associated (Figure 7, CAI case). Rain rates at low elevations (Class A, Figure 9A) generally remain unaltered, and changes at high elevations (Class E, 2,000–2,500 m) are only significant in the first day of the CAI event when the front is still to the south of the region of interest. The switch to light rainfall in the WLLJ and SLLJ cases is consistent with Sun and Barros (2015a) who linked the altitudinal reach of daytime orographic precipitation to upslope moisture flux convergence enhanced by EtPI. The differences are less pronounced for the SLLJ case for which local impacts are very small. Changes are negligible for heavy rainfall rates (> 10 mm/h) due to the WRF model lacking the ability to produce intense rainfall in D02 (6 km resolution) since convective processes are not resolved explicitly.
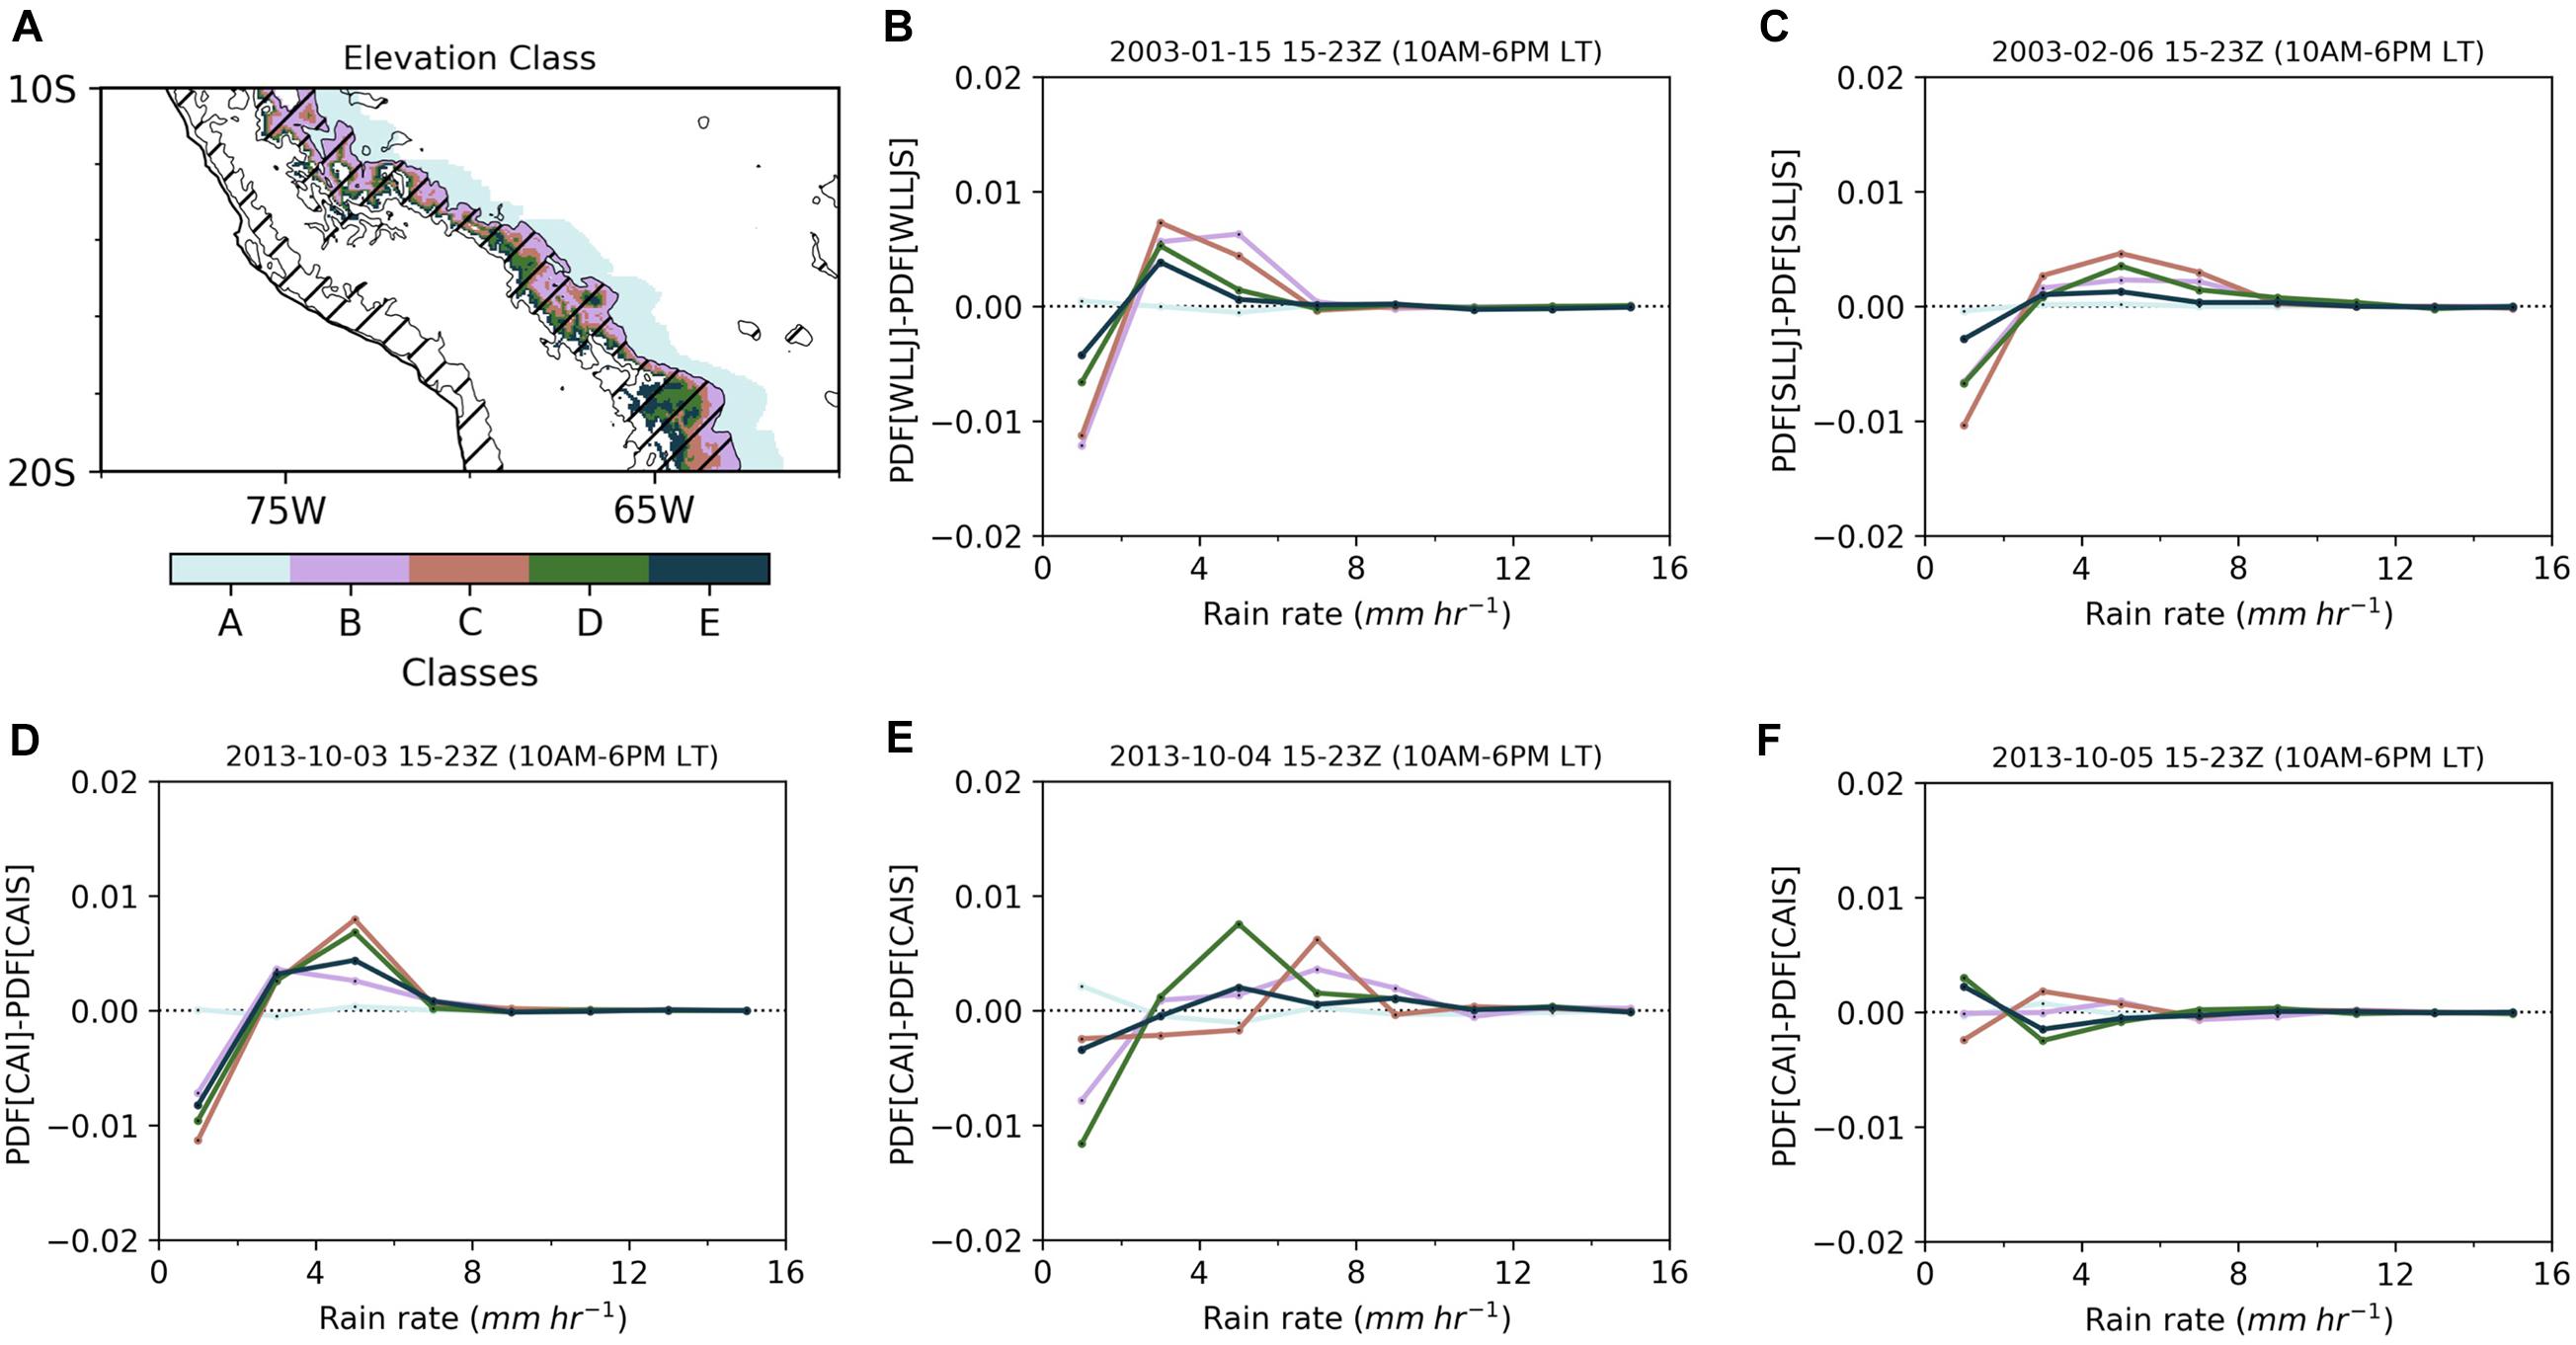
Figure 9. Map of (A) elevation classes, where A corresponds to the 120 km through the east of the 500 m elevation contour, B, C, D, and D correspond to 500–1,000, 1,000–1,500, 1,500–2,000, and 2,000–2,500 m, respectively. Difference in distribution of rain rate between the control and the modified simulation from the WRF simulation (D02, 6 km) classified by elevation and 10-20S latitudes for WLLJ, SLLJ, and CAI cases are shown in (B–F), respectively. The values for each distribution are for daytime between 15Z and 23Z corresponding to 10 a.m. to 6 p.m. local time.
Despite significant differences in rainfall intensity organized by altitude, the simulations show no significant differences in soil moisture fields (<5%) between TMF and savanna scenarios for all simulations (Supplementary Information S3). The small differences in soil moisture suggest that the hydrologic response to lower rainfall intensities must be to lower runoff production. The runoff impacts are very small for the WLLJ and SLLJ cases during the monsoon, however, they are substantive for the CAI case in the dry season as shown by Figure 10. Note the much smaller area of runoff production as compared to rainfall and the difference in the spatial patterns. Whereas the rainfall difference maps between CAI and CAIS show the shift of heavy precipitation to lower elevations (blue tones aligned with the 500 m contour), the runoff difference patterns do not follow the rainfall and show high spatial variability within an elevation band reflecting the role of initial soil moisture conditions (e.g., locally available infiltration capacity at the beginning of the storm event) and other landscape heterogeneities (e.g., soil texture and landform) in runoff production.
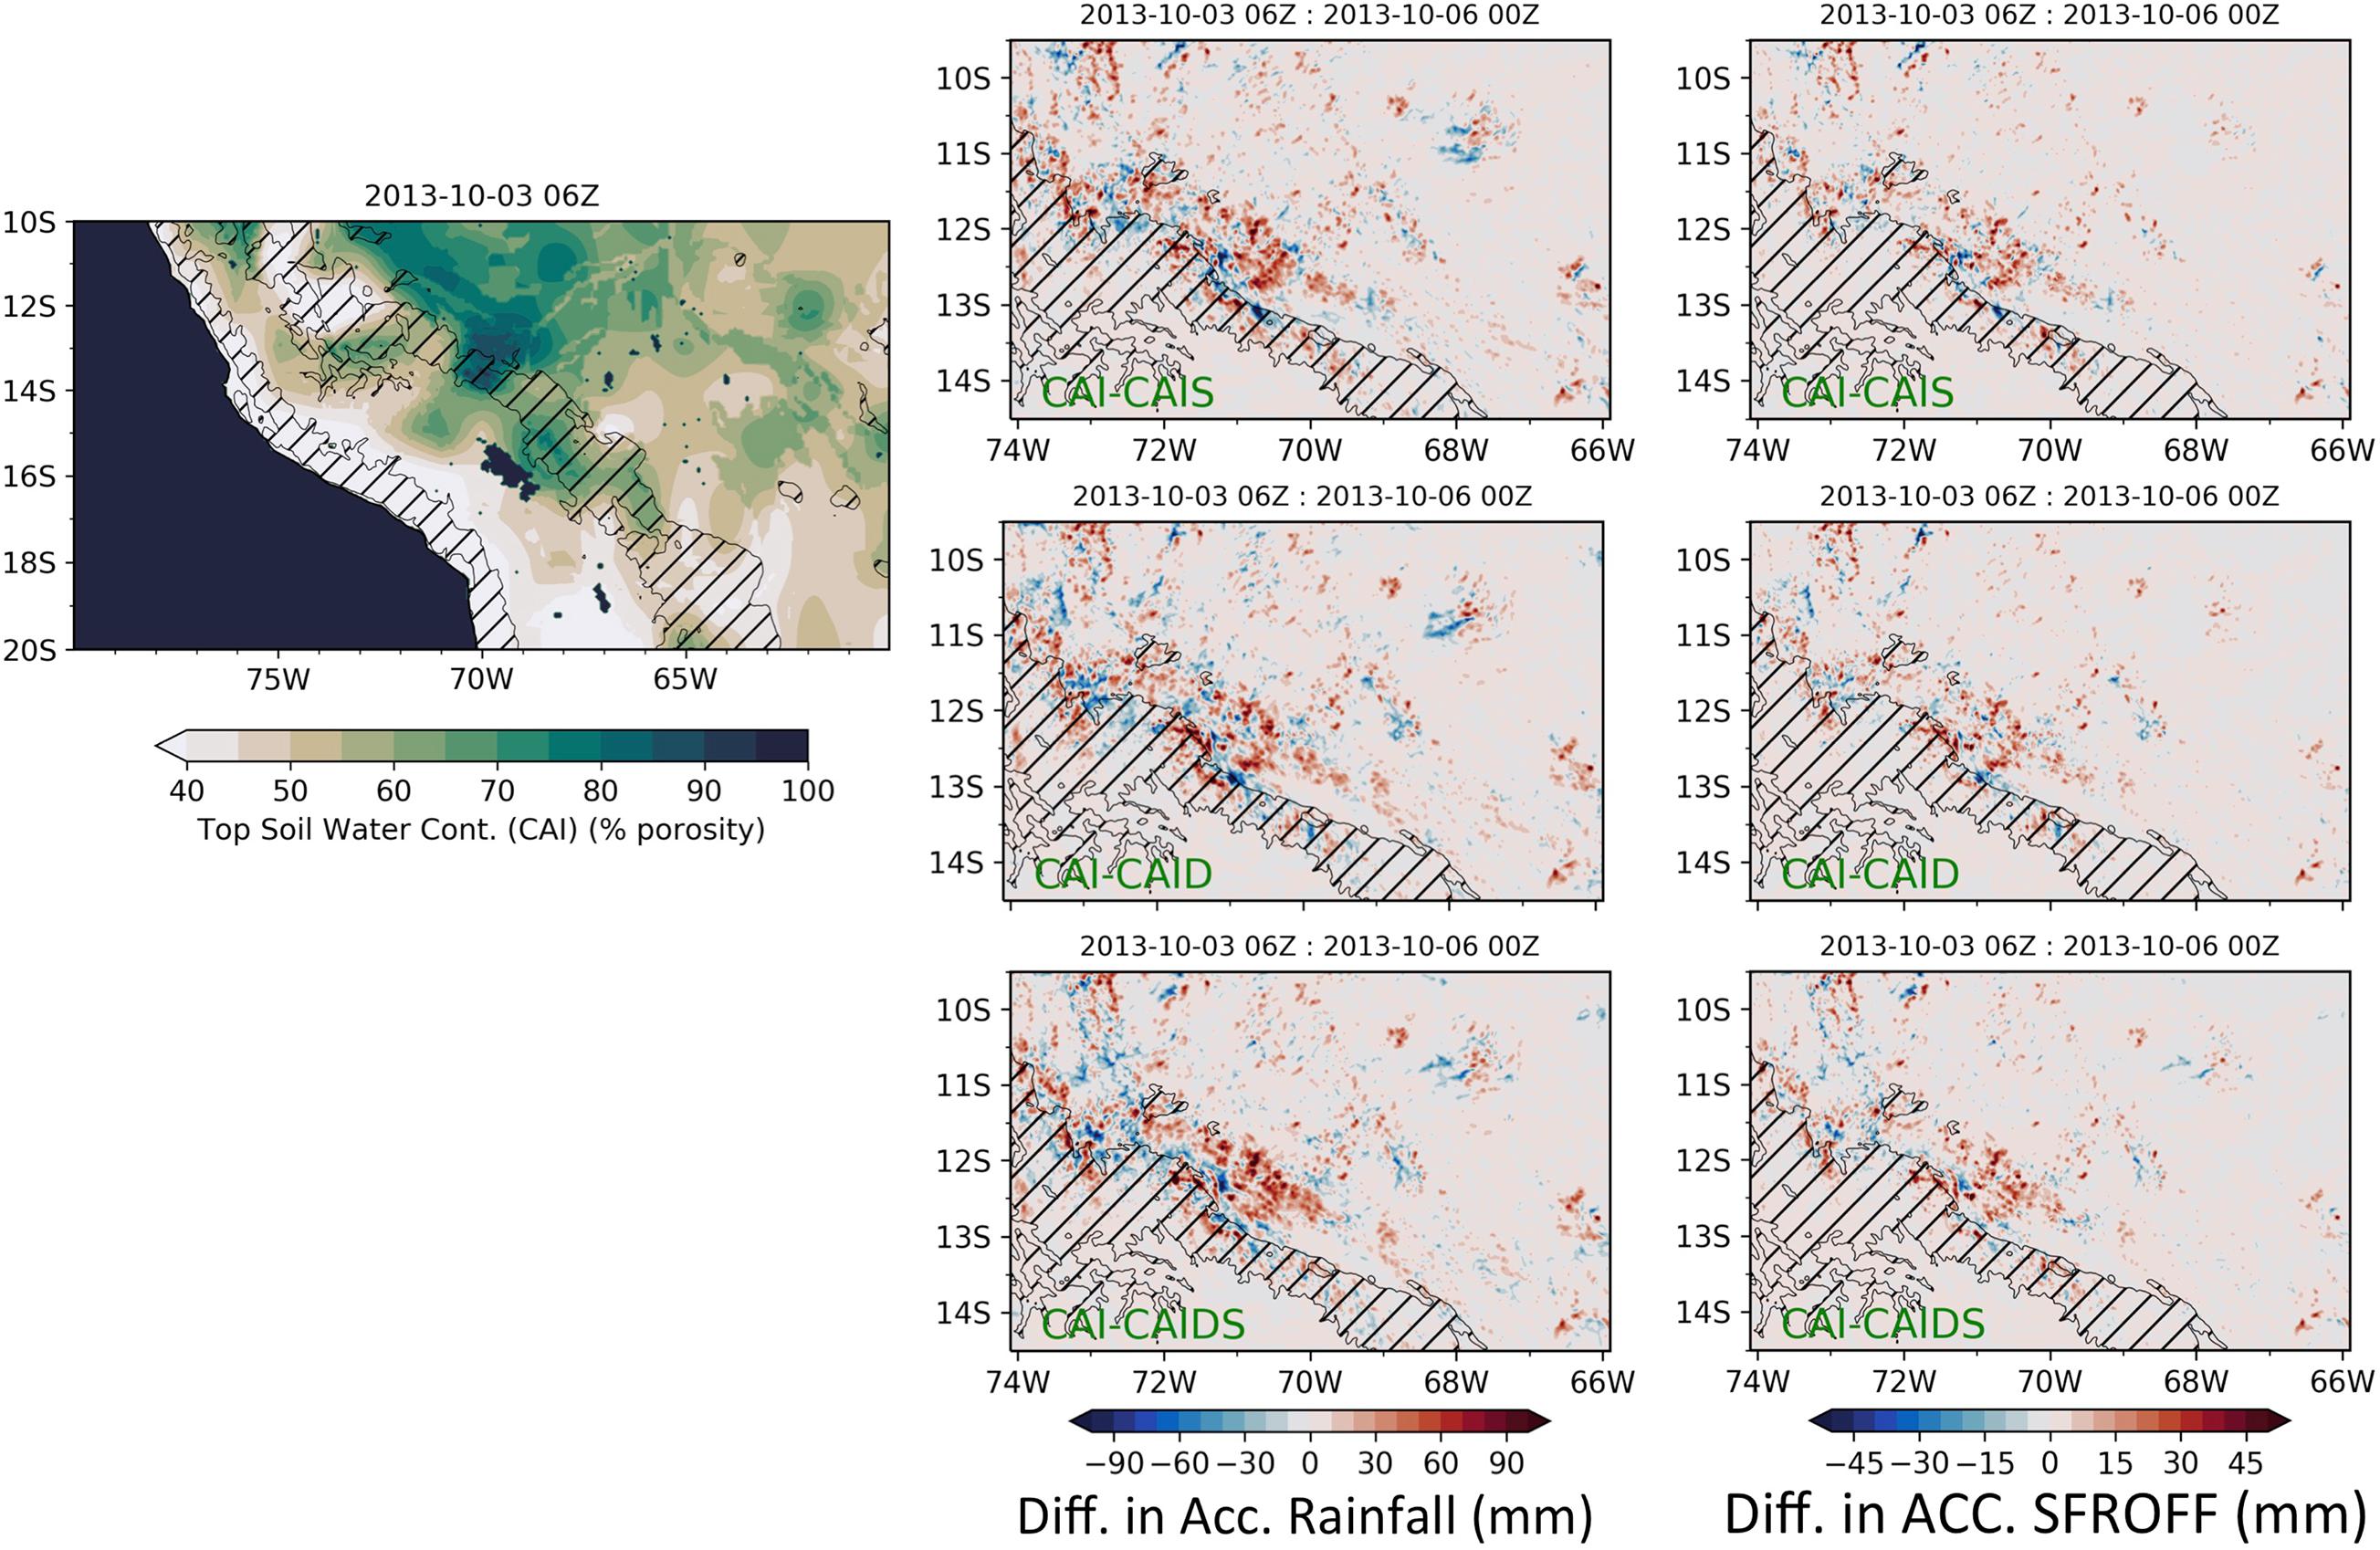
Figure 10. Map of top 40 cm (top two layers) initial soil moisture conditions (D02, 6 km) for the CAI and CAIS WRF simulations (left panel). Maps (D03, 1.2 km) of differences in accumulative rainfall (mid panel) at the end of the simulation and in surface runoff (right panel) between CAI and CAIS; CAID and CAIDS. Blue (red) tones indicate higher (lower) values for CAIS (CAID and CAIDS).
The initial soil moisture conditions during the monsoon are very wet north of 13S and exhibit large spatial variability. Similarly, the initial soil moisture fields were high in the context of typical dry season conditions for the specific CAI case examined here. To address concerns regarding uncertainty in the spatial variability of initial soil moisture, two CAI TMF and savanna simulations were conducted prescribing uniform initial soil moisture conditions east of the continental divide at 85% saturation representative of highest soil moisture among all cases studied. The results (Supplementary Information S4) show changes in MCAPE organized by savanna, downslope displacements of precipitation features, and shifts in rainfall from moderate to light rainrates similar to CAI-CAIS and CAID-CAIDS, which supports the governing role of EtPI processes in regional moist processes. To examine the sensitivity of the hydrologic response under water stress conditions, two additional CAI simulations were conducted with initial soil moisture reduced by 20% relative to the control to mimic changes in antecedent conditions at the end of a drought spell (e.g., CAID and CAIDS in Table 1). The CAID simulations for the realistic TMF scenario show no significant changes in rainfall and significant changes in runoff production relative to CAI. The CAIDS simulations exhibit the same spatial patterns in rainfall distribution and rainfall intensity (Supplementary Information S5) at intermediate elevations as CAIS albeit with a significant reduction in cumulative precipitation that translates into a reduction in area and depth of runoff production across altitudes where orographic enhancement is most effective (B and C: 500–1,500 m; Figure 11A). More importantly, if the runoff producing areas are separated in two areas with grid-scale cumulative runoff (CR) depth below (Figure 11B) and above 20 mm (Figure 11C), it is apparent that the shift of heavy precipitation from altitudinal band C (1,000–1,500 m) to B (500–1,000 m) results in clusters of high runoff production in B for CAIS. The overall reduction of runoff volume along the EADS foothills is amplified by more than 10-fold for CAIDS relative to CAI (47.2 × 10⁻³ km3) vis-à-vis CAIS relative to CAI (3.4 × 10⁻³ km3). Furthermore, the runoff volume reduction between control (CAI) and dry initial soil moisture is twice as large for CAIDS (23%) as for CAID (12%), a difference that is equivalent to the low mean daily volume of discharge of the Ucayali River (a tributary of the Amazon River) at Puccalpa in the spring (Ettmer and Alvarado-Ancieta, 2010; see Supplementary Information S6 for map). This amounts therefore to a large positive feedback of forest loss and savanna expansion that enhances hydrologic drought in the austral spring in the region of the EADS that spans the headwaters of the Amazon River and its tributaries. In summary, the conversion of TMF to savanna potentially leads to the amplification of hydrologic drought in the dry season over the EADS resulting in less erosion at the event-scale due to decreases in rainfall intensity and runoff (e.g., Lowman and Barros, 2014; Angulo-Martínez and Barros, 2015), decreased river discharge and river carrying capacity, and consequently reduction in material fluxes from the EADS to the Amazon foreplain.

Figure 11. Total surface runoff (A) from D02 (6 km) for the time of the duration of the CAI event and surface runoff stratified by grid-scale cumulative runoff depth (CR) below (B) and above (C) 20 mm for each elevation class as shown in Figure 9. Altitudinal bands: A corresponds to the 120 km through the east of the 500 m elevation contour, B, C, D, and D correspond to 500–1,000, 1,000–1,500, and 1,500–2,000, respectively. The runoff producing area varies with elevation band (e.g., Figure 10 for CAI and CAIS).
Conclusion and Outlook
The Weather Research and Forecasting (WRF) model was used to investigate the impact of changes in land-cover, in particular ongoing removal and replacement of Tropical Montane Forests (TMFs) in the eastern flanks of the Andes, on orographic precipitation. Three synoptic regimes representative of regional rain-producing conditions were selected to evaluate the land cover change in the TMF altitudinal band (500–3,500 m), specifically replacing evergreen broadleaf forest with woody savanna. The results show that conversion to savanna in the orographically active TMF altitudinal band will directly impact the surface energy and moisture budgets, low-level stability in the atmosphere, upslope moisture flux convergence, and consequently, the diurnal cycle and spatial distribution of precipitation on the eastern flanks of the tropical Andes. More importantly, changes in the frequency distribution of rainfall intensity point to a shift from moderate intensity (2–10 mm h–1) to light rainfall (<2 mm h–1). Changes in heavy rainfall cannot be assessed conclusively because of the limitations of parameterized convection at the relatively coarse resolution of D02 (6 km) on the one hand, and the limited size of D03 (1.2 km) on the other. Decreases in rainfall intensity result in systematic decreases in runoff production along the EADS that are especially significant for the CAI event that is representative of regional hydrometeorology in the dry season.
This manuscript provides a mechanistic framework to examine the implications of ongoing deforestation in the western Amazon through the lens of the moisture pathway of land-atmosphere interactions: changes in evapotranspiration drive changes in atmospheric stability that in turn drive changes in rainfall intensity and consequently changes in rainfall-runoff response. This physics explains how documented decreases in dry season (austral winter and spring) river discharge in the western and southern Amazon basin can be attributed, at least in part, to forest loss and land-cover change (e.g., Upper Madeira basin over the last 20 years, Aide et al., 2019; Espinoza et al., 2019). Whereas this positive feedback is unambiguous at weather scales, only long-term simulations can provide fully quantitative insight into the impact of persistent land-cover changes on regional hydrology and ecohydrology. Projected dry season increases in drought severity from climate change should further stress the coupled land-atmosphere system. The compound effect of forest loss and warmer temperatures can be assessed best through long-term simulations including inter-annual and decadal climate variability (e.g., Nobre et al., 2016) that are out of the scope of the present study.
Data Availability Statement
The raw data supporting the conclusions of this article will be made available by the authors, without undue reservation, to any qualified researcher.
Author Contributions
AB proposed the research idea and the research plan. ME implemented the research plan, performed the WRF simulations, and conducted the analysis and interpretation of the results under the guidance of the AB. Both authors worked collaboratively in the preparation of the manuscript.
Funding
We would like to acknowledge high-performance computing support from Cheyenne (doi: 10.5065/D6RX99H) provided by NCAR’s Computational and Information Systems Laboratory, sponsored by the National Science Foundation. This research was funded in part by NASA Grant 80NSSC19K0685 with AB.
Conflict of Interest
The authors declare that the research was conducted in the absence of any commercial or financial relationships that could be construed as a potential conflict of interest.
Supplementary Material
The Supplementary Material for this article can be found online at: https://www.frontiersin.org/articles/10.3389/fenvs.2020.580159/full#supplementary-material
References
Aide, T. M., Grau, H. R., Graesser, J., Andrade-Nuñez, M. J., Aráoz, E., Barros, A. P., et al. (2019). Woody vegetation dynamics in the tropical and subtropical Andes from 2001 to 2014: satellite image interpretation and expert validation. Glob. Change Biol. 25, 2112–2126. doi: 10.1111/gcb.14618
Angulo-Martínez, M., and Barros, A. P. (2015). Measurement uncertainty in rainfall kinetic energy and intensity relationships for soil erosion studies: an evaluation using PARSIVEL disdrometers in the Southern Appalachian Mountains. Geomorphology 228, 28–40. doi: 10.1016/j.geomorph.2014.07.036
Barros, A. P. (2013). “Orographic precipitation, freshwater resources, and climate vulnerabilities in mountainous regions,” in Climate Vulnerability, ed. R. A. Pielke (Oxford: Academic Press), 57–78. doi: 10.1016/B978-0-12-384703-4.00504-9
Dudhia, J. (1989). Numerical study of convection observed during the winter monsoon experiment using a mesoscale two-dimensional model. J. Atmos. Sci. 46, 3077–3107. doi: 10.1175/1520-04691989046<3077:NSOCOD<2.0.CO;2
Ek, M. B., Mitchell, K. E., Lin, Y., Rogers, E., Grunmann, P., Koren, V., et al. (2003). Implementation of NOAH land surface model advances in the national centers for environmental prediction operational mesoscale eta model. J. Geophys. Res. 108:8851. doi: 10.1029/2002JD003296
Eghdami, M., and Barros, A. P. (2019a). Extreme orographic rainfall in the eastern Andes tied to cold air intrusions. Front. in Env. Sci. 7:101. doi: 10.3389/fenvs.2019.00101
Eghdami, M., and Barros, A. P. (2019b). Vertical dependence of horizontal scaling behavior of orographic wind and moisture fields in atmospheric models. Earth Space Sci. 6, 1957–1975. doi: 10.1029/2018EA000513
Espinoza, J. C., Sörensson, E., Ronchail, J., Molina-Carpio, J., Segura, H., Gutierrez-Cori, O., et al. (2019). Regional hydro-climatic changes in the Southern Amazon basin (Upper Madeira Basin) in the 1982-2017 period. J. Hydrol. Reg. Stud. 26:100637. doi: 10.1016/j.ejrh.2019.100637
Eva, H. D., Belward, A. S., De Miranda, E. E., Di Bella, C. M., Gond, V., Huber, O., et al. (2004). A land cover map of South America. Glob. Change Biol. 10, 731–744. doi: 10.1111/j.1529-8817.2003.00774.x
Ettmer, B., and Alvarado-Ancieta, C. A. (2010). Morphologische entwicklung des ucayali in peru ohne menschliche einfllüsse. Waldökologie Landschaftsforschung Naturschutz 10, 77–84.
Fadrique, B., Báez, S., Duque, Á, Malizia, A., Blundo, C., Carilla, J., et al. (2018). Widespread but heterogeneous responses of Andean forests to climate change. Nature 564, 207–212. doi: 10.1038/s41586-018-0715-9
Feeley, K. J., Silman, M. R., Bush, M. B., Farfan, W., Cabrera, K. G., Malhi, Y., et al. (2011). Upslope migration of Andean trees. J. Biogeogr. 38, 783–791. doi: 10.1111/j.1365-2699.2010.02444.x
Girardin, C. A., Malhi, Y., Aragão, L. E., Mamani, M., Huaraca Huasco, W., Durand, L., et al. (2010). Net primary productivity allocation and cycling of carbon along a tropical forest elevational transect in the Peruvian Andes. Glob. Change Biol. 16, 3176–3192. doi: 10.1111/j.1365-2486.2010.02235.x
Kain, J. S. (2004). The Kain-Fritsch convective parameterization: an update. J. Appl. Meteorol. 43, 170–181. doi: 10.1175/1520-0450(2004)043<0170:tkcpau>2.0.co;2
Kalnay, E., Kanamitsu, M., Kistler, R., Collins, W., Deaven, D., Gandin, L., et al. (1996). The NCEP/NCAR 40-year reanalysis project. Bull. Am. Meteorol. Soc. 77, 437–471. doi: 10.1175/1520-04771996077<0437:TNYRP<2.0.CO;2
Lowman, L. E. L., and Barros, A. P. (2014). Investigating links between climate and orography in the central Andes: coupling erosion and precipitation using a physical-statistical model. J. Geophys. Res. Earth Surf. 119, 1322–1353. doi: 10.1002/2013JF002940
Malhi, Y., Roberts, J. T., Betts, R. A., Killeen, T. J., Li, W., and Nobre, C. A. (2008). Climate change, deforestation, and the fate of the Amazon. Science 319, 169–172. doi: 10.1126/science.1146961
Malhi, Y., Aragão, L. E., Galbraith, D., Huntingford, C., Fisher, R., Zelazowski, P., et al. (2009). Exploring the likelihood and mechanism of a climate-change-induced dieback of the Amazon rainforest. Proc. Natl. Acad. Sci. U.S.A. 106, 20610–20615. doi: 10.1073/pnas.0804619106
Milbrandt, J. A., and Yau, M. K. (2005a). A multimoment bulk microphysics parameterization. part I: analysis of the role of the spectral shape parameter. J. Atmos. Sci. 62, 3051–3064. doi: 10.1175/JAS3534.1
Milbrandt, J. A., and Yau, M. K. (2005b). A multimoment bulk microphysics parameterization. part II: a proposed three-moment closure and scheme description. J. Atmos. Sci. 62, 3065–3081. doi: 10.1175/JAS3535.1
Mlawer, E. J., Taubman, S. J., Brown, P. D., Iacono, M. J., and Clough, S. A. (1997). Radiative transfer for inhomogeneous atmospheres: RRTM, a validated correlated-k model for the longwave. J. Geophys. Res. 102, 16663–16682. doi: 10.1029/97JD00237
Nakanishi, M., and Niino, H. (2006). An improved mellor–yamada level-3 model: its numerical stability and application to a regional prediction of advection fog. Bound. Layer Meteorol. 119, 397–407. doi: 10.1007/s10546-005-9030-8
Nobre, C. A., Sampaio, G., Borma, L., Castilla-Rubio, J. C., Silva, J., and Cardoso, M. (2016). Land-use and climate change risks in the Amazon and the need of a novel sustainable development paradigm. PNAS 113, 10759–10768. doi: 10.1073/pnas.1605516113
Oliveras, I., Malhi, Y., Salinas, N., Huaman, V., Urquiaga-Flores, E., Kala-Mamani, J., et al. (2014). Changes in forest structure and composition after fire in tropical montane cloud forests near the Andean treeline. Plant Ecol. Divers. 7, 329–340. doi: 10.1080/17550874.2013.816800
Phillips, O. L., Malhi, Y., Higuchi, N., Laurance, W. F., Núnez, P. V., Vásquez, R. M., et al. (1998). Changes in the carbon balance of tropical forests: evidence from long-term plots. Science 282, 439–442. doi: 10.1126/science.282.5388.439
Román-Cuesta, R. M., Salinas, N., Asbjornsen, H., Oliveras, I., Huaman, V., Gutiérrez, Y., et al. (2011). Implications of fires on carbon budgets in Andean cloud montane forest: the importance of peat soils and tree resprouting. For. Ecol. Manage. 261, 1987–1997. doi: 10.1016/j.foreco.2011.02.025
Saavedra, M., Junquas, C., Espinoza, J. C., and Silva, Y. (2020). Impacts of topography and land use changes on the air surface temperature and precipitation over the central Peruvian Andes. Atmos. Res. 234:104711. doi: 10.1016/j.atmosres.2019.104711
Schicker, I., Arnold Arias, D., and Seibert, P. (2016). Influences of updated land-use datasets on WRF simulations for two Austrian regions. Meteorol. Atmos. Phys. 128:279. doi: 10.1007/s00703-015-0416-y
Serafin, S., Adler, B., Cuxart, J., De Wekker, S. F. J., Gohm, A., Grisogono, B., et al. (2018). Exchange processes in the atmospheric boundary layer over mountainous terrain. Atmosphere 9:102. doi: 10.3390/atmos9030102
Skamarock, W. C., Klemp, J. B., Dudhia, J., Gill, D. O., Liu, Z., Berner, J., et al. (2019). A Description of the Advanced Research WRF Model Version 4 (No. NCAR/TN-556+STR). doi: 10.5065/1dfh-6p97
Sun, X., and Barros, A. P. (2015a). Impact of Amazonian evapotranspiration on moisture transport and convection along the eastern flanks of the tropical Andes. Q. J. R. Meteorol. Soc. 141, 3325–3343. doi: 10.1002/qj.2615
Sun, X., and Barros, A. P. (2015b). Isolating the role of surface evapotranspiration on moist convection along the eastern flanks of the tropical andes using a quasi-idealized approach. J. Atmos. Sci. 72, 243–261. doi: 10.1175/JAS-D-14-0048.1
Tao, K., and Barros, A. P. (2008). Metrics to describe the dynamical evolution of atmospheric moisture: intercomparison of model (NARR) and observations (ISCCP). J. Geophys. Res. 113, D14125. doi: 10.1029/2007JD009337
Wilson, A. M., and Barros, A. P. (2015). Landform controls on low level moisture convergence and the diurnal cycle of warm season orographic rainfall in the Southern Appalachians. J. Hydrol. 531, 475–493. doi: 10.1016/j.jhydrol.2015.10.068
Keywords: tropical montane forests, land-atmosphere interactions, Andes, extreme events, water cycle
Citation: Eghdami M and Barros AP (2020) Deforestation Impacts on Orographic Precipitation in the Tropical Andes. Front. Environ. Sci. 8:580159. doi: 10.3389/fenvs.2020.580159
Received: 04 July 2020; Accepted: 30 October 2020;
Published: 20 November 2020.
Edited by:
Yuqing Wang, University of Hawaii at Manoa, United StatesReviewed by:
Rosmeri Porfirio Da Rocha, University of São Paulo, BrazilDaoyi Gong, Beijing Normal University, China
Copyright © 2020 Eghdami and Barros. This is an open-access article distributed under the terms of the Creative Commons Attribution License (CC BY). The use, distribution or reproduction in other forums is permitted, provided the original author(s) and the copyright owner(s) are credited and that the original publication in this journal is cited, in accordance with accepted academic practice. No use, distribution or reproduction is permitted which does not comply with these terms.
*Correspondence: Ana P. Barros, YmFycm9zQGR1a2UuZWR1
 Masih Eghdami
 Ana P. Barros