Corrigendum: Environmental and Biological Determinants of Algal Lipids in Western Arctic and Subarctic Seas
 Vincent Marmillot
 Christopher C. Parrish
 Jean-Éric Tremblay
 Michel Gosselin
 Jenna F. MacKinnon
- 1Département de Biologie, Université Laval, Québec City, QC, Canada
- 2Department of Ocean Sciences, Memorial University of Newfoundland, St. John's, NL, Canada
- 3Institut des Sciences de la mer de Rimouski, Université du Québec à Rimouski, Rimouski, QC, Canada
The Arctic is undergoing numerous environmental transformations. As a result of rising temperatures and additional freshwater inputs, ice cover is changing, with profound impacts on organisms at the base of food webs and consequently on the entire Arctic ecosystem. Indeed, phytoplankton not only provide energy as lipids, but also essential fatty acids (EFA) that animals cannot synthesize and must acquire in their diet. Omega-3 (ω3) and omega-6 (ω6) polyunsaturated fatty acids (PUFA) are essential for the healthy development and function of organisms. The high energy potential of monounsaturated fatty acids (MUFA) is of particular importance in cold waters, and various fatty acids including saturated fatty acids (SFA) are involved in organismal responses to environmental stressors. Yet relatively little is known of how variability or change in physicochemical seawater properties (e.g., temperature, light, salinity, pH and nutrients) may affect lipid synthesis in polar environments, either directly, by altering algal physiology, or indirectly, by promoting shifts in phytoplankton species composition. Here we investigated these two possibilities by sampling along a 3,000-km transect spanning 28 degrees of latitude across the subarctic and Arctic domains of Canada. The taxonomic composition of phytoplankton mainly drove the FA profiles measured in particulate organic matter (POM). Strong, positive correlations between 16:1ω7 and diatoms were observed while the proportion of PUFA and ω6 FA increased with flagellate abundance. Among specific FAs, eicosapentaenoic acid (EPA; 20:5ω3) was positively correlated with diatoms but the expected relationship between docosahexaenoic acid (DHA; 22:6ω3) and dinoflagellates was not observed. Decreasing pH had a negative effect on EPA and MUFA proportions, and DHA proportions tended to decrease with higher temperature. These two effects were primarily driven by differences in phytoplankton assemblage composition. Overall, the results of this geographically extensive study provide new information into the use of lipid markers and the ecological determinants of FA synthesis in the North. It also highlights the importance of long-lived subsurface chlorophyll maximum layers in supplying PUFA-rich POM to the food web and suggests that this situation may persist despite ongoing changes in the physical environment.
Introduction
Phytoplankton account for nearly half of global primary production (Field et al., 1998) and their productivity is often greatest at high latitudes (Huston and Wolverton, 2009). In seasonally ice-free waters of the Arctic Ocean, the timing of phytoplankton blooms is usually controlled by light, while nutrient availability dictates the magnitude of annual net primary production (Tremblay and Gagnon, 2009; Tremblay et al., 2015). In addition to the total amount of primary production, the quantity and type of lipids synthesized by phytoplankton are crucial for the health and function of polar food webs, as well as for humans who consume marine foods (Lemire et al., 2015). Specific fatty acids (FA) can also be used as markers of taxonomic composition and tracers of food source in consumers (Dalsgaard et al., 2003). Since phytoplankton are the major organisms able to produce essential FA de novo in sufficient quantities, several studies have focused on the environmental controls of primary production and fatty acid (FA) synthesis in unicellular algae. These characteristics were found to be influenced by a host of factors in addition to light and nutrients, including physicochemical variables (e.g., salinity, temperature, pH), geographical parameters (e.g., latitude, seasonality) and taxonomic composition (Leu et al., 2006; Galloway and Winder, 2015). In addition to their crucial roles in nutrition and health, the carbon-rich FA synthesized by phytoplankton, once incorporated into zooplankton, may substantially contribute to oceanic carbon sequestration via their vertical migrations (Jónasdóttir et al., 2015).
De novo FA synthesis is a complex process starting with acetyl-CoA and involving fatty acid synthase for carbon chain elongation resulting in a 16-carbon molecule (i.e., palmitic acid, 16:0) that corresponds to the most common FA. In addition to other elongations that may occur to form longer carbon chains, some reactions lead to unsaturation of FAs by inserting a double bond between the carbons. Beyond this first unsaturation, other double bonds can be inserted into the carbon chain resulting in the synthesis of polyunsaturated FA (PUFA) (Parrish, 2009). Specific types of PUFA, such as α-linolenic acid (ALA; 18:3ω3), eicosapentaenoic acid (EPA; 20:5ω3), docosahexaenoic acid (DHA; 22:6ω3), linoleic acid (LA; 18:2ω6) and arachidonic acid (ARA; 20:4ω6), better known as ω3 FA and ω6 FA essential fatty acids (EFA), are synthesized almost exclusively by primary producers and certain bacteria. Animals must acquire these vital molecules from their diet (Parrish, 2009). As Budge et al. (2006) pointed out, FA are rarely found in their free form in nature and are mainly incorporated into more complex molecules constituting different lipid classes with diversified metabolic functions (Guschina and Harwood, 2009; Gladyshev et al., 2013). In this regard, it is useful to distinguish between polar (e.g., phospholipids) and non-polar lipids. Phospholipids (PL) are major components of biological membranes and, with sterols (ST), play a major role in organismal responses to environmental change by acting as a semi-permeable and selective barrier (Guschina and Harwood, 2009). Non-polar lipids such as triacylglycerols (TAG) are used for energy storage (Gurr et al., 2002) and are especially crucial in polar regions where the growing season is short (Falk-Petersen et al., 2000; Leu et al., 2015).
Given the key role of microbial organisms in supplying the entire food web with lipids and essential fatty acids in particular, it appears vital to better understand how multiple environmental factors act or interact to influence algal lipid profiles and the extent to which these profiles will either subsist or be altered in the future Arctic. The Arctic Ocean is experiencing the greatest and most rapid environmental change on Earth (IPCC, 2014). Projections suggest that sea surface temperatures will keep rising, that the extent and thickness of sea ice will continue to decline, and that freshwater loading and ocean acidification will further increase in this ocean. The manifestations and biological impacts of these changes are likely to differ across different sectors (Langen et al., 2018) and a recent study showed that primary production has either declined, not changed or increased in specific areas (Lewis et al., 2020), presumably due to a shifting balance between processes that reinforce vertical stratification and those that promote mixing and nutrient replenishment in surface waters. These changes are also likely to induce shifts in the taxonomic composition of bacterial and phytoplankton assemblages, thereby altering the lipid composition of particulate organic matter (POM), and may cause a mismatch between primary and secondary production as a consequence of early, seasonal sea-ice retreat (Leu et al., 2011).
It is generally accepted that low temperature favors greater proportions of unsaturated FAs (Guschina and Harwood, 2009) that maintain the membrane fluidity necessary for several physiological processes (e.g., permeability, photosynthesis, respiration; Harwood, 1998). Several studies reported inverse relationships between temperature and unsaturation levels or the proportions of EPA, DHA and total PUFA (Tatsuzawa and Takizawa, 1995; Thompson, 1996; Zhu et al., 1997; Jiang and Gao, 2004). The effect of irradiance, which fluctuates widely in polar environments, has also been extensively studied (Thompson et al., 1990; Henriksen et al., 2002; Leu et al., 2006). Negative relationships between unsaturation proportion and light intensity seem to be the norm. For example, the proportion of storage lipids, ω3 FA and EPA were shown to increase with decreasing light, while proportions of polar lipids and saturated FA (SFA) such as 16:0 were found to increase with light (Thompson et al., 1990; Mock and Kroon, 2002; Fábregas et al., 2004). Greater unsaturation and proportions of PUFA under low light presumably serve to boost the efficiency of photosynthesis by increasing membrane fluidity and electron flow.
The magnitude of primary production and therefore overall lipid synthesis are highly conditioned by nutrient availability in the ocean. Nitrogen and, to a lesser extent, iron (as in the Southern Ocean for example) are often considered to be the main elements limiting primary production (Moore et al., 2013). For the Arctic, Tremblay and Gagnon (2009) showed a strong correlation between initial nitrate concentration at the onset of phytoplankton blooms and the magnitude of annual primary production. In cultures, low nitrate availability was shown to induce reduced cell division rates while increasing the proportion of storage lipids (e.g., triacylglycerol or TAG) (Pruvost et al., 2009; Rodolfi et al., 2009; Sobczuk and Chisti, 2010), and nitrogen limitation also reduces unsaturation through a shift from polar lipids to saturated storage lipids. However, responses to nutrient limitation vary considerably among species (Reitan et al., 1994). A high variability of responses is also observed in studies testing the effect of pH or pCO2. While Thompson (1996) showed that high CO2 concentrations decreased unsaturation, Leu et al. (2013) found positive correlations between PUFA proportions and pCO2 and attributed these responses to a decline in the relative contribution of diatoms to the phytoplankton assemblage. This notion is in agreement with the metanalysis of Galloway and Winder (2015), who showed that taxonomic composition (e.g., chlorophytes, cryptophytes, cyanobacteria, diatoms, dinoflagellates, and haptophytes) is the main determinant of lipid profiles and differences in essential FA composition among laboratory cultures (Galloway and Winder, 2015).
Faced with rapid climate change, the multiplicity of lipid responses observed in previous studies, and the fact that most of these studies were performed on monospecific laboratory cultures, our primary objective was to assess how physicochemical conditions affect the lipid composition of natural phytoplankton assemblages along macro-ecological environmental gradients. Here we did so by sampling across a 3,000-km stretch of ocean that traversed several distinct oceanographic regions of the western Arctic and subarctic. Beyond the major influence of taxonomy, which can be expected from prior studies, we also expected to see secondary effects of physicochemical variables on the assemblages present. Since the temperature of surface waters generally decreases poleward, we hypothesized that PUFA and EFA proportions should correlate positively with latitude and negatively with temperature. We also hypothesized that PUFA proportions in POM should increase with nutrient availability and the time elapsed since ice break-up (a surrogate for the seasonal maturity of the system). The reverse should be observed for SFA and TAG proportions. A second objective of the study was to identify fatty acid markers of specific phytoplankton groups and assess if they differ from those previously established in other environments.
Materials and Methods
Survey Area
Sampling was conducted with the Canadian icebreaker CCGS Amundsen from 29 July to October 2, 2016 (Figure 1). The 44 stations were spread out across Baffin Bay (29 July - 3 August and 26–28 September), Nares Strait (6–16 August), the Northwest Passage (4 August and 17–24 August and 18–25 September), the Beaufort Sea (28 August - 5 September) and the Labrador Sea (1–2 October). According to the general ocean circulation pattern, different water masses influence the overall sampling area. The western parts of Baffin Bay and the Labrador Sea are exposed to cold and relatively fresh waters descending from the high Arctic, such as the Baffin Island Current and the Labrador Current (Tremblay et al., 2018). These two currents carry predominantly Pacific-derived waters that previously transited across the Beaufort Sea and enter the Canadian Archipelago via Nares Strait and the Northwest Passage's Barrow Strait and Lancaster Sound. By contrast, Atlantic waters enter the survey area around the southern tip of Greenland and propagate northward with the West Greenland Current along the eastern edges of the Labrador Sea and Baffin Bay eventually crossing to the west. Most of the sampling stations were located in relatively shallow waters but regional differences in average bottom depths were present, with shelf stations of the Labrador sea (153 ± 13 m) and Northwest Passage (204 ± 26 m) being shallower than stations in the Beaufort Sea (352 ± 70 m), Nares Strait (476 ± 31 m) and Baffin Bay (489 ± 42 m).
FIGURE 1
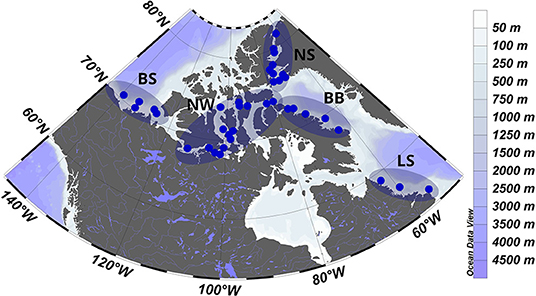
Figure 1. Locations of the sampling stations in different oceanographic regions [Beaufort Sea (BS), Northwest Passage (NW), Nares Strait (NS), Baffin Bay (BB), and Labrador Sea (LS)] of the Canadian Arctic from 29 July to 2 October 2016.
Sampling
At each station, sensors mounted on a rosette sampler provided detailed vertical profiles of temperature and salinity (Sea-Bird SBE-911 CTD), nitrate (in-situ Ultraviolet Spectrometer, ISUS, Satlantic), dissolved oxygen (Seabird SBE-43, calibrated onboard against Winkler titrations: Martin et al., 2010), photosynthetically available radiation (PAR, 400–700 nm; Biospherical Instruments QDP2300) and chlorophyll fluorescence (Seapoint). The latter was used to determine the depth of the subsurface chlorophyll maximum (SCM) for sampling purposes. Water was collected at the surface (SUR) and at the SCM with 12-L Niskin bottles mounted on the rosette.
The pH of seawater was measured at 25°C with a spectrophotometer using red phenol (433 and 558 nm) and cresol purple (434 and 578 nm) according to Robert-Baldo et al. (1985), Clayton and Byrne (1993), and Millero et al. (2009). Total alkalinity was measured by potentiometric titration combined with pH electrodes and dilute HCl (0.02 M) as a titrant. We used CO2sys (Lewis and Wallace, 1998) to convert pH measurements into in situ pH and pCO2 by using alkalinity, temperature and salinity data. Note that pH measurements were not performed in the Beaufort Sea. Subsamples for nutrient determinations were pre-filtered on GF/F filters and the concentrations of phosphate () and nitrate () were analyzed fresh with a Bran-Luebbe auto-analyzer 3 using colorimetric methods adapted from Hansen and Koroleff (1999). The detection limit was 0.03 μM for phosphate and nitrate. Sea-ice concentrations provided by AMSR-E/AMSR2 and SSMI (Brodzik and Stewart, 2016; Meier et al., 2018; Earth Observing System Data and Information System, EOSDIS) were used to estimate the date when sea ice had declined by 50% and to calculate the numbers of days elapsed between this date and sampling time for each station (hereafter abbreviated as SID for Sea Ice Decline).
For each station and the two sampling depths, a 200-ml aliquot of seawater was preserved with acidic Lugol's and stored at 4°C in the dark for taxonomic analysis of phytoplankton phylum, class and species. Particulate organic matter (POM) for lipid analysis was collected by filtering 3 L of seawater through 47-mm GF/C filters. The filters were stored in pre-burned aluminum foil at −80°C until analysis at the home laboratory. The carbon content of different phytoplankton groups was estimated from visual counting and sizing of cells under visible light microscopy (Lund et al., 1958; Utermöhl, 1958; Menden-Deuer and Lessard, 2000). The database produced by the HELCOM Phytoplankton Expert Group was used to calculate the biovolume of single cells, which was multiplied by the number of cells to get total biovolume. Following Menden-Deuer and Lessard (2000) we converted the biovolume to carbon quantity using conversion factors i.e., pg C cell−1 = 0.288 × Vol0.811 for diatoms, pg C cell−1 = 0.760 × Vol0.819 for dinoflagellates and pg C cell−1 = 0.216 × Vol0.939 for other groups such as chlorophyte, chrysophyte, dictyochophyte, cryptophyte, euglenophyte, prasinophyte, prymnesiophyte, unidentified flagellates, raphidophyte, heterotrophic group, choanoflagellate, ciliates, and others (i.e., unidentified cells and cysts).
Lipid Extraction
Each filter collected was put in lipid clean vials with 4 ml of chloroform, flushed with nitrogen and sealed with Teflon tape before storage at −20°C. Lipids were extracted with chloroform:methanol:water (1:2:1) following Folch et al. (1957) as modified by Parrish (1999). Filters were ground using a rod, sonicated and centrifuged three times in order to extract lipid layers (lower) with two Pasteur pipettes (double pipetting). Lipid extracts were stored at −20°C in 2 ml vials capped under N2 and sealed with Teflon tape until further analyses.
Lipid Classes
We used thin-layer chromatography with flame ionization detection (TLC-FID, Mark V Iatroscan, Iatron Laboratories) to determine lipid classes (Parrish, 1987). We spotted extracts on silica gel-coated Chromarods and we used a three-stage development system to separate lipid classes. The first and second hexane-based developments separated triacylglycerol (TAG) sterol (ST) and free fatty acid (FFA). Then more polar systems separated acetone-mobile polar lipid (AMPL) and phospholipid (PL). Nine Sigma Chemical Inc saturated standards ranging in polarity from nonadecane to dipalmitoyl phosphatidylcholine were used for FID calibration via Peak Simple software (version 4.54).
Derivatization and Fatty Acids
Extracts were put in lipid clean vials where we added a mixture of H2SO4-MeOH prior to heating at 100°C for 1 h. We then added 1.5 ml of hexane and removed the upper layer containing lipids. Samples were dried under N2 prior to resuspension and storage at −20°C until fatty acid methyl ester (FAME) analyses by GC-FID (Budge and Parrish, 1998, 1999).
Data Reporting and Statistical Analyses
In the Results section, deviations from mean values are reported as ± one standard error. Since the overall lipid content of organisms is proportional to their biomass, relationships between FA proportions and the taxonomic composition of phytoplankton were explored using the contribution of different groups to total phytoplankton carbon (μg C L−1). However, relationships between physicochemical variables and assemblage composition were established using the numerical contribution of different groups to total cell counts (cells L−1) in order to avoid propagating possible errors associated with the carbon biomass estimation. To simplify the text, use of the words “abundance” or “carbon” after a taxonomic group (e.g., diatom carbon) hereafter designates the relative contribution of this group to total phytoplankton counts or carbon. Considering that a major portion of water-column phytoplankton biomass occurs within the SCM layer during summer and fall in our study area (Martin et al., 2010, 2013), our analyses of FA composition focused on this layer. Nonetheless, surface data were considered in order to refine interpretations and differences between the two sampling layers were examined using paired t-tests. ANOVA and multivariate PERMANOVA were used to test for differences between oceanographic regions (i.e., Beaufort Sea, Northwest Passage, Nares Strait, Baffin Bay, and Labrador Sea).
Given the complexity of the data set obtained, different statistical approaches were employed to explore relationships between physicochemical variables, taxonomic composition and FA profiles. In the search for the best variables explaining FA proportions, the Akaike information criterion (AICc) was used first to rank different possible models and test for interactions between variables. While highly useful, the AICc analysis excludes stations with incomplete datasets (e.g., pH in the Beaufort Sea) and possibly overemphasizes significant relationships for variables with the greatest availability. The AICc scores (not shown) were therefore used as initial guidance in the selection of generalized linear models (where the slopes of regression models were defined by β), break-point regression models or multiple regression models with linear or quadratic terms. For conciseness, only the statistical parameters of regressions that do not already appear in the supplement will be detailed in the main text. Finally, distance-based redundancy analysis (dbRDA) based on a Chi squared distance resemblance matrix and multivariate plots were used to visualize the overall structure of the dataset using R (R Core Team, 2020), RStudio (RStudio Team, 2020) and PRIMER-e software. Methods such as the Grubbs test (R package Outliers; Komsta, 2011) were used to identify statistical outliers in the dataset.
Results
Across the survey area, water temperature at the SCM was confined to a narrow range (−1.55–1.75°C, −0.36 ± 0.14°C on average) and was not related to latitude although significant differences (pperm < 0.05) were found between sampling regions (Supplementary Figure 1 and Supplementary Tables 1.1, 1.2). The highest (1.44 ± 0.45°C) and lowest (−0.67 ± 0.36°C) average values occurred in the Labrador Sea and in Baffin Bay, respectively. The SCM depth also varied significantly between regions (pperm ≤ 0.001). The deepest and shallowest ones were observed in the Beaufort Sea (mean = 46 ± 4.55 m) and the Labrador Sea (mean = 23 ± 3.36 m), respectively, consistent with a strong positive relationship between SCM depth and longitude (r2 = 0.42, p < 0.001). Salinity was negatively correlated with longitude (r2 = 0.13, p < 0.01), indicating a greater presence of freshwater in the western part of the survey area. SCM depth did not correlate with latitude, sampling date or SID. The pH ranged from 8.01 to 8.23 (8.11 ± 0.01 on average) at the SCM and significant regional differences were found (pperm ≤ 0.001), with relatively low average values in the Northwest Passage and the Labrador Sea (8.07 ± 0.01 and 8.08 ± 0.02, respectively), and higher ones in Baffin Bay and Nares Strait (8.13 ± 0.01 and 8.15 ± 0.01, respectively). Overall, pH showed a strong negative relationship with longitude (r2 = 0.27, p < 0.01) and a weak positive one with latitude (r2 = 0.13, p < 0.05). Average nitrate concentrations (2.01 ± 0.29 μM) and PAR levels (2.01 ± 0.63 μE m−2 s−1) at the time of sampling were both generally low and did not exhibit significant differences between regions (PERMANOVA). Instantaneous PAR levels correlated negatively with latitude (r2 = 0.14, p < 0.01) but not with SCM depth, sampling date nor SID. With the exception of nutrient concentrations, the range of values for abiotic variables was often larger at the surface than at the SCM (see Supplementary Table 1) and paired t-tests revealed significant differences (p < 0.05) between the two depths for temperature, salinity, PAR, nitrate and phosphate.
When averaged over the entire sampling area, phytoplankton assemblages at the SCM were numerically dominated by diatoms (38.0 ± 4.3% of centrics and 5.1 ± 0.9% of pennates) and unidentified flagellates (18.6 ± 1.7%), followed by prymnesiophytes (8.9 ± 1.8%), dinoflagellates (4.8 ± 0.4%), choanoflagellates (3.5 ± 0.6%) and chrysophytes (1.6 ± 0.4%) (Figure 2A). The sum of all these groups minus the diatoms and dinoflagellates accounted for 32.6 ± 2.9 % of total cell counts and is hereafter referred to as “flagellates.” Minor identified taxa represented 4.4% and included cryptophytes (1.5%), prasinophytes (1.1%), ciliates (0.67%), dictyochophytes (0.48%), heterotrophic species (0.36%, mainly composed of Leucocryptos marina, Meringosphaera mediterranea, and Telonema sp.), raphidophytes (0.27%), euglenophytes (0.02%), and chlorophytes (0.003%). Other groups comprised small unrecognized cells and cysts that collectively accounted for 15.1% of total counts. Some differences emerged in the relative importance of taxonomic groups when considering carbon biomass (μg C L−1) instead of cell counts (cells L−1); dinoflagellates and ciliates contributions increased at the expense of unidentified flagellates and prymnesiophytes while the contribution of centric diatoms remained stable (see Supplementary Table 2 for details).
FIGURE 2
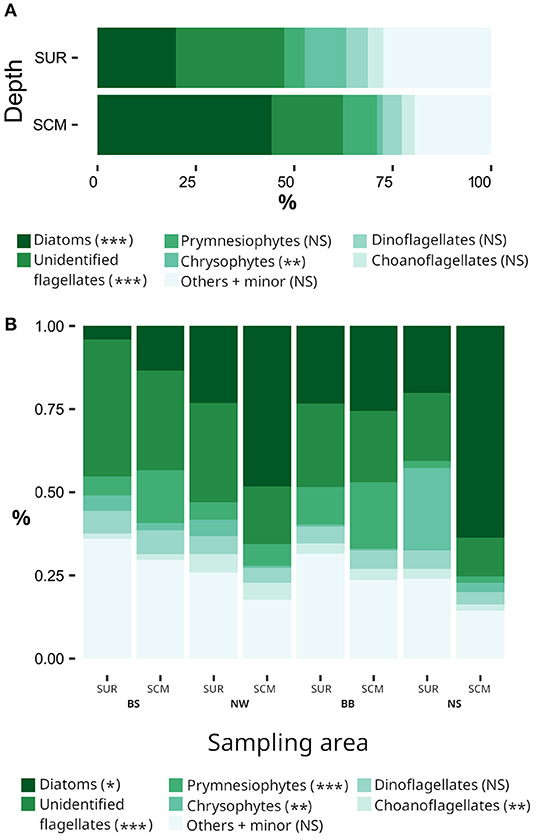
Figure 2. Contributions of the main phytoplankton groups to total cell abundance (A) at the surface (SUR) and at the subsurface chlorophyll maximum (SCM) depth and (B) in the different oceanographic regions of the Canadian Arctic. No taxonomic data are available for the Labrador Sea. The PERMANOVA results are defined by ***pperm < 0.001; **pperm < 0.01; *pperm ≤ 0.05; NS, not significant. The “Others + minor” group is composed of unidentified cells and cysts and prasinophytes, cryptophytes, dictyochophytes, heterotrophic taxa, raphidophytes, euglenophytes, and chlorophytes. In (A) the PERMANOVA results compare the SUR and SCM depth while in (B) the PERMANOVA results compare regions.
On average, the total number of cells was 1.8 × higher at the SCM than at the surface and the difference was similar in terms of carbon content (1.9 ×). The same occurred for relative abundance of diatoms but it was the reverse for unidentified flagellates, chrysophytes and prasinophytes. Finally the proportions of prymnesiophytes, dinoflagellates, and choanoflagellates were similar at the two sampling depths (Figure 2A).
Differences in the taxonomic composition of phytoplankton assemblages between regions are shown in Figure 2B. Among the major cell groups at the SCM, the relative abundances of diatoms and flagellate were the most spatially variable between regions (pperm < 0.01). Regional differences were also observed for prasinophytes and a few other groups (pperm < 0.05; Supplementary Tables 3.1, 3.2) but not for dinoflagellates. The same patterns were observed when considering carbon biomass, except for cryptophytes which exhibited significant regional contrasts (Supplementary Tables 3.1, 3.2).
Next, we sought the most robust FA trophic markers (hereafter FATM) of different phytoplankton groups at the SCM. The relationship between diatoms and palmitoleic acid (16:1ω7, Figure 3A) gave the strongest correlation between a specific FA and the relative contribution of a phytoplankton group. FA ratios such as 16:1ω7/16:0 and ΣC16/ΣC18 or Σ16:1/Σ18:1 were also highly correlated with diatom carbon (Supplementary Table 4). Moreover, proportions of MUFA, 14:0, i15:0, 16:0, 16:3ω4, or EPA (r2 = 0.11) correlated positively with diatom carbon. Conversely, flagellate carbon at the SCM was negatively correlated with the proportions of 16:1ω7 (r2 = 0.25, p < 0.01), EPA (r2 = 0.23, p < 0.01) and MUFA (r2 = 0.16, p < 0.05). The proportions of ω6 FA (r2 = 0.24), overall PUFA (r2 = 0.31), 18:4ω1 (r2 = 0.44) and the ΣC18-PUFA in particular (r2 = 0.49) were positively correlated with flagellate carbon (Figure 3B). It follows that the latter was negatively correlated with the ΣC16:ΣC18 ratio (r2 = 0.25, p < 0.01), underlining high ΣC18 proportions in flagellates and high ΣC16 proportions in diatoms. A similar negative trend was found between dinoflagellates and ΣC16:ΣC18 (r2 = 0.22, p < 0.01). However, we did not find significant relationships between dinoflagellate carbon and previously identified FATM of this group such as DHA or OTA (18:4ω3). Overall, the strong correlations observed here (e.g., diatoms and 16:1ω7, flagellates and ΣC18-PUFA) at the SCM were much weaker when the analyses were based on SUR data alone or a combination of all SCM and SUR data (Figure 3).
FIGURE 3
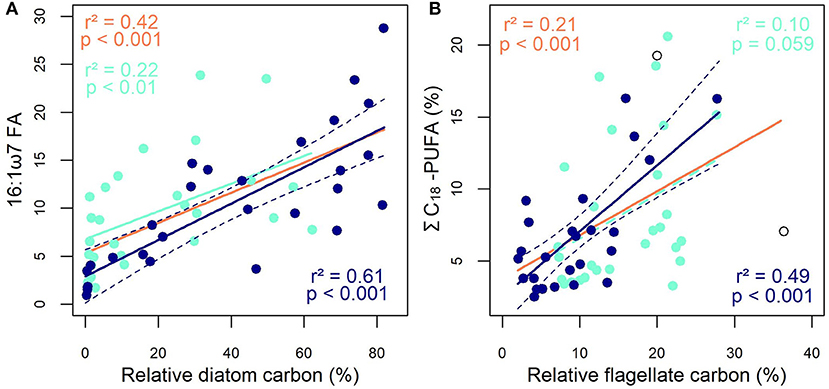
Figure 3. Relationships between (A) the 16:1ω7 FA proportion and the relative carbon biomass of diatoms and between (B) the ΣC18-PUFA proportion and the relative carbon biomass of flagellates. The dark-blue symbols, lines and text represent the subsurface chlorophyll maximum (SCM), the turquoise symbols, lines and text represent the surface (SUR) while the orange lines and text represent the SCM and SUR data combined. The dashed dark-blue line represents the 95% confidence interval and open circles represent outliers in the SCM dataset (Grubbs test, p < 0.05).
Despite the regional contrasts in taxonomic composition (Figure 2) and the strong correlations between specific taxonomic groups and FATM (Figure 3), the lipid profiles of POM at the SCM were relatively stable across regions in terms of FA composition and lipid classes (i.e., TAG, ST, PL and AMPL). According to the PERMANOVA, MUFA was the only lipid group that showed significant differences between regions (Figure 4). The ANOVA performed to elucidate these differences identified the proportions of diatoms (p < 0.01), flagellates and dinoflagellates (p < 0.05) as the primary cause since the interaction terms between sampling region and taxonomic composition were not significant. However, when using longitude and latitude instead of regional divisions, spatial trends in the lipid composition of POM at the SCM became apparent. Diatom FATM (e.g., 16:1ω7, ΣC16, Σ16:1/Σ18:1) were positively correlated with latitude (see Supplementary Table 5 for details), consistent with the northward increase in relative diatom abundance (r2 = 0.23, p < 0.01) to the detriment of flagellates (r2 = 0.29, p < 0.01). Significant trends were also found between the longitude as an independent variable and the relative diatom abundance (β = −0.53, r2 = 0.15, p < 0.05), diatom FATM (e.g., 16:1ω7, see Supplementary Table 5) and also the sum of known bacterial FA markers (i.e., denoted ΣBFATM and including i15:0, αi15:0, 15:0, 15:1, i16:0, ai16:0, i17:0, ai17:0, 17:0, 17:1, and 18:1ω6). This implies a general westward decrease in diatoms and bacteria coincident with the decline in pH and salinity noted above.
FIGURE 4
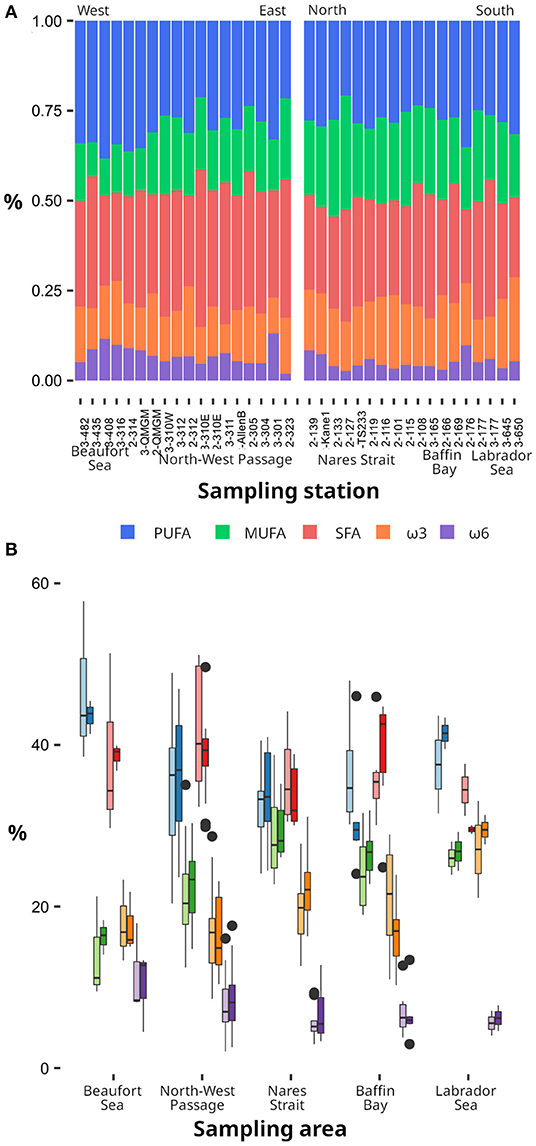
Figure 4. Relative contribution of PUFA, MUFA, SFA, ω3, and ω6 fatty acids in particulate organic matter (A) along a longitudinal transect from the Beaufort Sea to the Northwest Passage (left) and a latitudinal transect from Nares Strait to the Labrador Sea (right), and (B) in the different oceanographic regions. In (A) the mean values (i.e., at the SUR and SCM) are represented while in (B), the light shades represents the SUR and the dark shades represent the SCM.
Several relationships emerged between the proportions of different FAs, FATM or taxonomic groups and abiotic variables at the SCM. Firstly, the vertical position of the SCM had a significant impact on the proportions of EPA (r2 = 0.10) and MUFA (r2 = 0.20), which all tended to decrease as the SCM deepened while ΣC18-PUFA increased (r2 = 0.19; see Supplementary Table 5 for details). Two of the relationships observed between FAs and abiotic variables are highlighted in Figure 5, which shows decreasing proportions of ω6 FA with increasing salinity (Figure 5A) and a positive correlation between EPA proportion and pH (Figure 5B). Temperature was one of the few variables that significantly, but weakly, correlated with DHA proportion. Indeed, negative correlations were found between temperature and DHA (r2 = 0.11) or ΣC18-PUFA (r2 = 0.09). Warming was also associated with rising proportions of ΣBFATM (r2 = 0.21) and dinoflagellates (r2 = 0.12, p < 0.05) and the latter was positively correlated with the SID index (r2 = 0.23, p < 0.001). SFA proportion correlated positively with the concentrations of nitrate (r2 = 0.14) and phosphate (r2 = 0.11) but numerous other FAs were negatively correlated with phosphate concentration [particularly diatom FATM such as 16:1ω7 (r2 = 0.09), MUFA (r2 = 0.19) and EPA (r2 = 0.09)]. With respect to lipid classes, the only significant relationship observed was between the proportion of TAG and pH (β = 21.09, r2 = 0.11, p < 0.05).
FIGURE 5
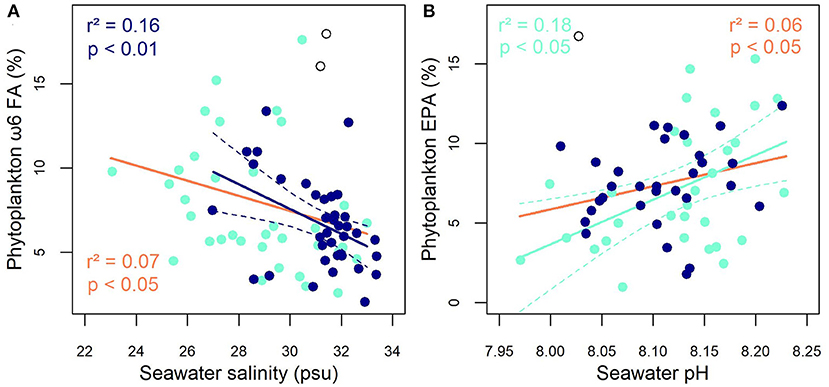
Figure 5. Significant relationships between (A) ω6-FA proportion and salinity, and (B) EPA proportion and seawater pH. The dark-blue symbols, lines and text represent the subsurface chlorophyll maximum (SCM), the turquoise symbols, lines and text represent the surface (SUR) and the orange lines and text represent the SCM and SUR combined. The dashed line represents the 95% confidence interval and open circles represent outliers in the SCM dataset (Grubbs test, p < 0.05).
Based on AICc model selections, stepwise multiple linear regressions were employed to better tease out the respective effects of abiotic factors and taxonomy (on a carbon basis) on lipid profiles. The best single variable explaining PUFA proportions at the SCM was flagellate carbon and the coefficient of determination was highest when considering a quadratic model (r2 = 0.42, p < 0.001) instead of a linear one (r2 = 0.31, p < 0.01). Only the latter was improved by the inclusion of salinity, sampling depth, phosphate or SID (r2 = 0.37 −0.43, p < 0.01) as a second independent variable. By contrast, the PUFA or MUFA proportion was explained nearly equally by diatom carbon (r2 = 0.20, p < 0.05), sampling depth (r2 = 0.20, p < 0.01) or phosphate concentration (r2 = 0.19, p < 0.01) and a linear model combining diatoms and phosphate provided the highest coefficient of determination (r2 = 0.49, p < 0.01). Note that phosphate and SCM depth were not used together in the same models because they were significantly correlated (Pearson, p < 0.001). Nutrient concentrations such as nitrate and phosphate were the only variables explaining some of the variability in SFA proportion (r2 = 0.14, p < 0.01, and r2 = 0.11, p < 0.05 respectively). We were unable to explain any of the variability in the proportions of overall ω3-FA and ARA; however, when considering specific ω3-EFA such as EPA, the best single explanatory variable was diatom carbon (r2 = 0.11, p < 0.05; Figure 6A). The coefficient of determination was improved with a quadratic model (r2 = 0.26, p < 0.05) and the best multiple linear model included latitude as a second independent variable (r2 = 0.48, p < 0.01; Figure 6B). Seawater temperature and sampling date were the only variables that explained some of the variability in DHA. Finally ω6 FA variability was mainly explained with flagellate carbon (r2 = 0.24, p < 0.01). Here again, predictive power was increased with a quadratic model (r2 = 0.28, p < 0.01) and the inclusion of a second independent variable, in this case SID (r2 = 0.36, p < 0.01) or pH (r2 = 0.33, p < 0.05).
FIGURE 6
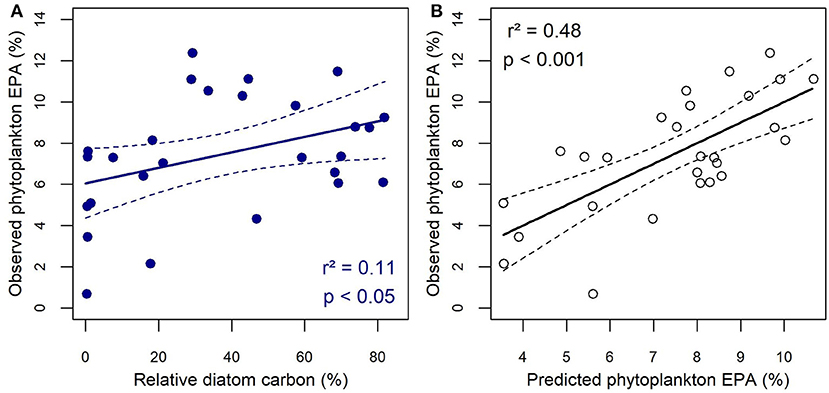
Figure 6. Relationship between the relative contribution of EPA measured in particulate organic matter at the SCM and (A) the relative carbon biomass of diatoms and (B) the EPA contribution predicted by a multiple regression model that includes diatom carbon and latitude as independent variables. The dashed lines represent the 95% confidence interval.
Figure 7 presents a dbRDA with the major variables explored in this study and highlights the similarities and contrasts between the SCM and SUR. For both depths, EPA, pH, latitude and phosphate concentration are the main contributors to the first axis. Other major contributors are MUFA at the SCM and ω3 FA at SUR. Differences between the two depths are greater for the second axis. Salinity, nitrate concentration and to a lesser extent taxonomic composition are important contributors to this axis at the SCM, while FAs such as PUFA, ω6 FA, SFA and also carbon from flagellates are the main contributors at SUR. These differences imply that the choice of explanatory models made previously for the SCM should not be considered as systematically valid for each depth. Furthermore, we also plotted the scores of PCA axes 1 and 2 against FA and taxonomy variables in order to explore general multivariate trends. While new relevant correlations did not emerge with this approach, it underscored the major structuring effect of taxonomy on the dataset. Indeed, flagellate carbon was significantly correlated with the scores of PCA axes 1 and 2 at the SCM. It was the same for PC-2 scores at the SUR or a combination of SUR and SCM (Supplementary Figure 2).
FIGURE 7
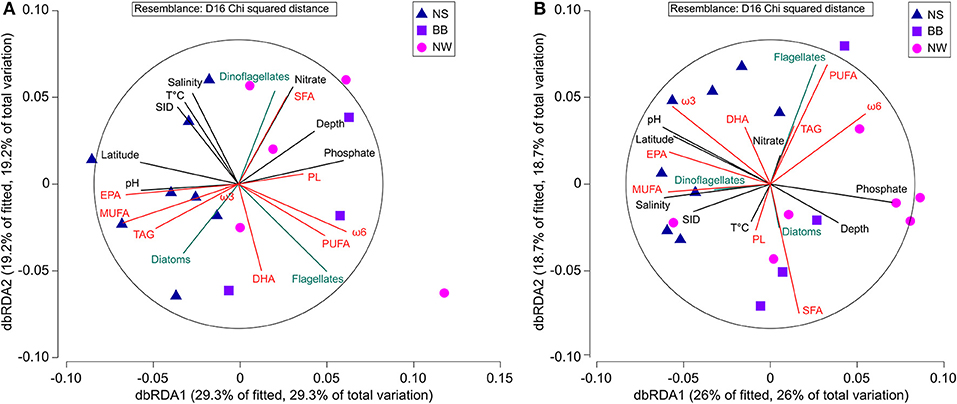
Figure 7. Distance based Redundancy Analysis of lipid composition (red arrows), phytoplankton taxonomy (in term of carbon, blue arrows) and abiotic variables (black arrows) at (A) the subsurface chlorophyll maximum and (B) the surface. The blue triangles represent data from Nares Strait (NS), the purple squares represents Baffin Bay (BB) and pink circles represent the Northwest Passage (NW).
The effects of environmental variables and taxonomy on PUFA, MUFA and SFA proportions at SUR where similar to those at the SCM, with the best explanatory models including flagellate carbon and salinity for PUFA (r2 = 0.30, p < 0.01) while diatom carbon and phosphate mainly explained MUFA variations (r2 = 0.49, p < 0.001). Nitrate concentration explained some of the variance in SFA at SUR (r2 = 0.09, p < 0.05), but flagellate carbon was the best single predictor (r2 = 0.15, p < 0.05) and the coefficient of determination increased with the inclusion of pH (r2 = 0.31, p < 0.01). For ω3 FA, none of the variability could be explained at the SCM whereas pH (r2 = 0.16, p < 0.05), salinity (r2 = 0.16, p < 0.01), and nutrients such as phosphate (r2 = 0.24, p < 0.01) and nitrate (r2 = 0.13, p < 0.05) had a significant effect at SUR. Including diatom carbon along with pH in a multiple model resulted in the highest coefficient of determination (r2 = 0.32, p < 0.05). For EPA, pH was the best single explanatory variable at SUR (r2 = 0.18, p < 0.05) but including diatom carbon did not improve the coefficient of determination like as it did at the SCM. In further contrast to the SCM, none of the variability in this DHA could be explained at SUR with the exception of sampling date. Finally the proportion of ω6 FA at SUR was best explained by phosphate concentration and the inclusion of flagellate carbon increased the coefficient of determination (r2 = 0.30, p < 0.05). As above, we were unable to explain any ARA variability.
In rare cases, FA responses to abiotic variables at SUR were opposite to those described previously at the SCM. For instance, the proportions of SFA decreased with rising nitrate concentration at SUR (r2 = 0.09, p < 0.05). In other cases, relationships observed at one depth held when data from the other depth were pooled, but this generally decreased the coefficient of determination (Figures 3, 5; Supplementary Tables 4, 5). Finally, combining SUR and SCM data gave rise to new but weak relationships, including a positive correlation between flagellates and DHA (r2 = 0.06) and a negative one between flagellates and salinity (r2 = 0.07, p < 0.05) and also between ALA and depth (r2 = 0.16) or temperature (r2 = 0.13) and finally between sampling date and specific FA ratios such as DHA/EPA (r2 = 0.11) or ω3/ω6 FA (r2 = 0.07).
Discussion
Most prior investigations of the influence of physicochemical factors on phytoplankton lipid composition were based on monospecific cultures of freshwater and marine algae (Guschina and Harwood, 2009). While some general trends emerge from this literature, the results are inconsistent among species, and given the sudden and often strong perturbations employed, cannot be transposed directly to natural communities (Galloway and Winder, 2015). Thus, we considered how multiple environmental drivers or stressors impact lipid synthesis across environmental gradients spanning large spatial scales allowing shifts in assemblage composition as well as local algal acclimation or adaptation. The results presented suggest that physicochemical factors can strongly influence FA composition of marine phytoplankton, even at large scales. Interpreting this is not straightforward since it may occur through changes in assemblage composition or as a direct physiological impact on algae. The following aims to disentangle these possibilities. In addition, our results partly confirm literature-based expectations for FATM that can be used to identify phytoplankton groups. This analysis also produced intriguing results that we explore below. We conclude the discussion by considering how the results may influence carbon cycling with respect to the phenology and vertical partitioning of primary production in the Pacific-influenced sector of the Arctic Ocean.
Fatty Acid Markers
Our results confirm that previously identified diatom FATM, such as the specific FAs 14:0 (myristic) and 16.1ω7 (Supplementary Table 4), as well as the FA ratios 16:1ω7/16:0 and ΣC16/ΣC18 (Pepin et al., 2011; Parrish, 2013), are valid over a large portion of the western Arctic. Based on correlation analyses, 16:1ω7 and Σ16:1/Σ18:1 can be considered as the most robust diatom markers in this region. Proportions of EPA and diatoms were correlated at the SCM but, surprisingly, not at the surface. This could be explained by differences in taxonomic composition between SUR and SCM as well as differences in environmental stability between the two layers. The overall proportion of diatoms was halved at the SUR while the proportion of flagellates doubled (Figure 2; Supplementary Table 2) and was composed of different taxa with distinct FATM (Supplementary Table 4). For example, the chrysophytes that were included in the flagellate group were positively correlated with EPA proportion, which might partially mask the relationship between diatoms and EPA. As well, unidentified cell abundances, whose counts were higher than diatoms at the SUR (Supplementary Table 2), may have influenced the relationship with EPA. Relatively frequent or pronounced environmental fluctuations at SUR in terms of pH, salinity or temperature may also blur the relationship since algae may often modulate the degree of FA unsaturation in order to adjust membrane fluidity in changing environments (Tatsuzawa et al., 1996; Bigogno et al., 2002; Los et al., 2013). In this respect, the SCM is generally sheltered within the pycnocline and thus tends to maintain relatively stable physicochemical conditions over time (Martin et al., 2010; Schiffrine et al., 2020). This creates a setting in which the influence of phytoplankton assemblage composition on lipid profiles is less prone to be obscured by short-term physiological responses to fluctuating temperature, salinity, pH or light. While the sampling scheme used here precluded an assessment of the recent light history of algal cells at a given station, phytoplankton at the surface experience daily fluctuations in absolute irradiance that are 5-fold larger than those experienced at a depth corresponding to 20% of incident light, for instance.
Flagellates were the second major taxonomic group in our study and their presence was associated with elevated proportions of ΣC18-PUFA, PUFA and ω6 FA but not with 20:4ω6 (ARA) as previously reported by Connelly et al. (2014). Experimental work with heterotrophic freshwater flagellates showed that different species have contrasted lipid profiles (Véra et al., 2001), suggesting that specific FATM may be more or less present depending on the actual assemblage composition. Since coarse groupings are typically employed due to the difficulty of identifying flagellates to the lowest taxonomic rank with light microscopy, the disparity between our study and Connelly et al. (2014) might be due to unresolved differences in dominant species. Future work would benefit from improved identification of key flagellates and their FATM using laboratory cultures or a combination of molecular tools (Lovejoy et al., 2006), electron microscopy and signature pigments with field samples (Coupel et al., 2015).
Surprisingly, our results did not confirm expected relationships between the contribution of dinoflagellate carbon and known FATM for this group, including DHA, 18:5ω3, or 18:4ω3 (OTA). However, as described by Kelly and Scheibling (2012), the literature supporting the use of DHA as a dinoflagellate marker is based mostly on laboratory cultures with few species (Mansour et al., 1999; Usup et al., 2008). It follows that the lack of correlation observed here for a cold polar environment might be due to the presence of different species. It might also be caused by a bias resulting from the estimation of biovolume prior to the calculation of carbon biomass. Here, the shape of dominant dinoflagellate genera such as Gyrodinium and Gymnodinium were considered as flattened ellipsoid (Olenina et al., 2006), which possibly induced an overestimation of dinoflagellate carbon relative to other groups. Finally, the potential contribution of dinoflagellates to DHA could be masked by the dominance of other DHA-rich taxa such as cryptophytes (Peltomaa et al., 2018) given low contributions of dinoflagellates.
Abiotic Factors and Taxonomy
The decrease in ΣC18-PUFA and DHA with rising temperature at the SCM is consistent with the literature since PUFA are used to counteract the adverse effect of cold temperatures on membrane fluidity (Hixson and Arts, 2016). These correlations are weak however, which may be related to the very narrow range of temperatures observed at the SCM (Supplementary Table 1). Despite the much broader temperature range at SUR, this variable had no apparent effect on PUFA at this depth. It did however explain some of the variability in 20:1ω11 and 22:5ω6, although we have no physiological rationale to propose for these relationships (Supplementary Table 5). The contrast in PUFA response between the SCM and SUR suggests that other factors superseded the influence of temperature at the surface (e.g., daily light cycle) or that algae do not invest in the adjustment of membrane fluidity in the presence of rapid temperature fluctuations (e.g., such as daily or hourly temperature changes at SUR due to weather and solar radiation). Another noteworthy effect of temperature was on ΣBFATM at the SCM, suggesting that warming increases the contribution of bacteria to total microbial biomass and production. This is consistent with bacterial production increasing with temperature in the Arctic Ocean which may reduce vertical carbon export and the contribution of this ocean to the global CO2 sink (Vaqué et al., 2019).
The increase in ΣBFATM with rising pH contrasts with the experimental results of Vaqué et al. (2019), who reported that bacterial production increased with higher pCO2. However, the highest pCO2 used by the authors was 5 times higher than the pCO2 value corresponding to the lowest in-situ pH observed in our study, which could therefore partly explain the difference. In addition, the aggregated ΣBFATM variable that we used was composed of different FA previously used as distinct bacterial FATM (Parrish, 2013). Based on the observation that small variations in pH differentially affect distinct components of bacterial assemblages (Krause et al., 2012), the contrast in results might be due to a difference in the taxonomic composition of dominant bacteria although in our study, only two significant and positive relationships were found between pH and specific bacterial FATM (i.e., i15:0 and ai17:0).
For phytoplankton, a few expectations concerning the effect of pH on the lipid profiles of individual species can be derived from prior laboratory studies with single cultures. One study found that low pH can adversely affect the degree of lipid unsaturation and reduce membrane fluidity in a green alga (Tatsuzawa et al., 1996), and another showed a negative effect of low pH on total lipid content and the PUFA/SFA ratio in a centric diatom (Rossoll et al., 2012). These responses, if they occur at all in natural settings, were overridden by other factors or community-level processes since the overall proportions of PUFA or unsaturated FA in POM did not correlate with pH. Prior community-level studies simulating future scenarios of low pH (minimum of 7.51) in experimental mesocosms found weak effects on the overall proportion of essential polyunsaturated FA in phytoplankton (Leu et al., 2013; Bermúdez et al., 2016) but reported shifts in the relative contribution of diatoms (Leu et al., 2013) or in the cell size of dominant taxa (Sommer et al., 2015). Knowing that the most abundant diatoms in our study were Chaetoceros species (with an apical length of 5–10 μm) while the most abundant flagellates measured 2–5 μm in diameter, the increased dominance of the latter at low pH might be linked to a differential positive effect of elevated pCO2 on small cells (Bermúdez et al., 2016).
We surmise that in our study the influence of phytoplankton assemblage composition superseded the effect of pH on FA profiles since pH was related positively to the diatom FATMs 16:1ω7, ΣC16, ΣC16/ΣC18, MUFA, and EPA (Supplementary Table 5) and inversely to relative flagellate abundance or flagellate FATM such as ΣC18; Supplementary Table 4. While this implies a declining proportion of diatoms with decreasing pH, significant correlations between pH and the relative contribution of diatoms to carbon were not found here. This raises the possibility that phytoplankton carbon, when estimated using a series of assumptions, might be a less robust indicator of the contribution of different algal groups to biomass than FATM or that the latter are directly influenced by pH. These hypotheses would have to be tested in the laboratory with cultures of ecologically-relevant species. The fact that pH slightly improved the coefficient of determination of multiple linear regressions of several FA proportions at SUR (e.g., ω3 FA and MUFA) suggests that a direct physiological influence on algal cells cannot be excluded, although it would require membrane reconfiguration to be caused by relatively small or transient changes in seawater pH.
Most studies report increasing proportions of saturated FA under nutrient limitation (Siron et al., 1989; Yongmanitchai and Ward, 1991; Reitan et al., 1994) which has been attributed to an increase in neutral lipids such as TAG and composed mainly of saturated or monounsaturated FA (Parrish and Wangersky, 1987). By either pooling data from the SUR and the SCM or considering the latter only, our analysis revealed a surprising positive relationship between saturated FA proportion and nitrate concentration (Supplementary Table 5), which is opposite to the frequently observed increase of TAG in nutrient-limited diatoms (Alonso et al., 2000; Lynn et al., 2000). However, the positive relationship became negative when using data from the surface only, where high irradiance and low nutrient concentrations typical of late to post-bloom conditions occurred (Supplementary Figure 1). This pattern is consistent with the literature (Grosse et al., 2019; Jónasdóttir, 2019) and suggests that light-limited growth forestalls the influence of variable nitrate at the SCM.
Since nitrate is considered as the limiting element in the study area (e.g., Tremblay and Gagnon, 2009) and since phosphate remained in excess in samples where nitrate was depleted (Supplementary Table 1.2), it may seem surprising to see that phosphate concentration was strongly and positively correlated with ΣC18, ΣC18-PUFA, or ω6 FA at SUR and negatively correlated with 16:1ω7, ΣC16/ΣC18, ΣMUFA, and EPA at the SCM. However, the fact that ω6 FA and ΣC18-PUFA were also positively correlated with flagellate carbon whereas 16:1ω7, ΣC16/ΣC18, ΣMUFA, and EPA were positively correlated with diatom carbon (Supplementary Table 4) suggests that phosphate is the dependent variable here and merely marks progress in the productive season and phytoplankton succession. The negative relationship found between phosphate and SID at SUR (r2 = 0.08, p < 0.05) and the positive ones between phosphate and the date of sea ice melt at SUR (r2 = 0.30, p < 0.001), SCM (r2 = 0.09, p < 0.05) and for both datasets pooled (r2 = 0.10, p < 0.01) are in agreement with the previous interpretation. However, correlations are weak, suggesting other influences are important.
It is noteworthy that EPA was the only single FA for which pH alone explained more variability than any other variable at SUR (r2 = 0.18, p < 0.05). While a positive correlation also existed between pH and salinity (r2 = 0.16, p < 0.001), the lack of relationship between EPA and the latter suggests a causal role for pH at this depth. At the SCM, EPA accounted for 42.5% of total ω3 FA on average and correlated positively with diatom FATM but not with pH nor salinity when all stations were considered. An attempt to remove the influence of taxonomy at this depth produced a surprising result. Upon keeping only the stations (n = 12) where diatom carbon contributed more than 55% of phytoplankton carbon (range 55 to 82%, see Figure 3), salinity was the only abiotic factor explaining a decrease in EPA (r2 = 0.37, p < 0.05). Similar or even stronger negative correlations were found with ω3 FA (r2 = 0.59, p < 0.01), PUFA (r2 = 0.37, p < 0.05) and the PUFA/SFA ratio (r2 = 0.44, p < 0.05) but not with DHA nor ω6 FA. For the surface, a grouping of diatoms such as the one made for the SCM was not achievable given the data spread but when considering stations (n = 14) where diatom carbon contributed between 0 and 10% of phytoplankton carbon, phosphate concentration and pH were the only physicochemical variables correlating with any specific FA or FA group we focused on in this study. At these fourteen stations, pH positively correlated with ω3 FA (r2 = 0.69, p < 0.01) while phosphate correlated negatively with ω3 FA (r2 = 0.53, p < 0.01) or EPA (r2 = 0.32, p < 0.01), and positively with ω6 FA (r2 = 0.48, p < 0.01). Although our 1-year sampling in various environments did not reveal significant differences in taxonomic composition with respect to sampling date or SID, previous studies have shown changes in phytoplankton assemblage composition over several years (Li et al., 2009; Coupel et al., 2015). In keeping with the notion that phosphate is a relatively robust indicator of seasonal maturity, the last correlations suggest that the assemblage composition of flagellates evolves during the productive season and progressively shifts toward ω3 FA-rich species.
In addition to the potential taxonomic shift, the above analysis of diatom and flagellate-dominated stations suggests that salinity can trigger physiological responses. A previous experimental study with the diatom Nitzschia laevis showed that EPA proportions were highest at an intermediate salinity of 20 g L−1 but reduced at low (10 g L−1) or high (30 g L−1) salinities (Chen et al., 2008). This is consistent with our results and suggests the existence of an optimum salinity window in which EPA production is maximized in diatoms. Galloway and Winder (2015) later showed that this pattern also holds for long-chain EFA (which include ω3 and ω6 FA) in diatoms but not in other taxonomic groups. The authors found indeed that FA profiles either do not respond or vary linearly and positively or negatively with salinity. Such group-specific responses, when combined with the positive effect of salinity on the flagellates possibly explains why ω6 FA increase with salinity at SUR, while ω3 FA decrease at the SCM where diatoms dominate.
Despite environmental differences between SUR and SCM in terms of nutrient availability, PAR, temperature or salinity, the overall FA composition of POM did not differ between the two depths, except for MUFA. Elevated proportions of MUFA at the surface are consistent with an increase in neutral lipids under nutrient-limited conditions, although significant depth-related differences in TAG or PL proportion were not observed. The lack of differences in overall lipid composition between the surface and the SCM is unexpected given the differences observed by Leu et al. (2006) during the spring bloom in a fjord. Over the large spatial scales considered here, the vertical similarity of lipid profiles might simply arise from different drivers acting differently on distinct algal groups in each layer and resulting in convergent FA profiles. For instance, a greater proportion of flagellates inducing elevated proportions of ALA at SUR could be offset by low irradiance inducing a higher proportion of EPA at the SCM (Khotimchenko and Yakovleva, 2005) thereby reducing possible differences in overall ω3 FA and PUFA between the two depths. The same mechanism also potentially masks intra-depth differences. For instance, higher nutrient limitation at SUR resulting in an increased SFA proportion might be counterbalanced by higher PUFA proportions caused by an increase in flagellates. This might result in an apparent relatively invariant PUFA/SFA ratio. These offsets caused by species or group-specific responses within phytoplankton assemblages underscore the difficulties of extrapolating the results of monospecific culture studies found in the literature to the natural environment.
While our study focused on snapshots of lipid profiles at many different sites, integrating measurements of the absolute quantity of lipids throughout the entire phytoplankton succession encompassing the spring bloom and subsequent SCM development would be useful to fully assess the implication of our results for grazers and the food web. Yet the long duration (3 months from the end of July to the beginning of October) and broad geographical scope of our study (3,000 km) somehow captured a portion of this succession. Overall, sampling started in the southern part of Baffin Bay, moved north to Nares Strait, then west to the Beaufort Sea through the Northwest Passage prior, finally returning to Baffin Bay and the Labrador Sea (Figure 1). As a consequence, the SID (number of days elapsed between sea ice decline and sampling date, a surrogate for the degree of seasonal development) and latitude variables covaried to some extent and teasing apart their respective impacts is difficult. Nevertheless, latitude explained a larger portion of the variability in PUFA, MUFA, ALA, OTA and the EPA/DHA ratio than SID (Supplementary Table 5), which improved the coefficient of determination of some multiple regressions. Finally, as many variables co-varied, we elected to note weaker, but significant relationships (and the inclusion of these variable in multiple regressions models) since this could provide useful guidance for future studies or experiments.
Perspective
Prior studies of algal lipids in cold temperate waters and the Atlantic sector of the Arctic ocean showed that the spring diatom bloom in the upper euphotic zone is the major source of PUFA-rich lipids (Parrish et al., 2005; Leu et al., 2006). However, in several regions of the Pacific-influenced Arctic and sub-Arctic (e.g., Beaufort Sea, Northwest Passage and the western parts of Baffin Bay and the Labrador Sea), the enhanced vertical stratification caused by freshwater inputs curtails nutrient replenishment during winter and leads to a relatively modest and short-lived surface bloom in spring or early summer (Tremblay et al., 2015). A major if not larger portion of annual POM synthesis therefore occurs in the subsurface during the following weeks and months (e.g., Martin et al., 2010, 2013), resulting in a distinct phenology of FA production and food availability that we now explore.
In Kongsfjorden (Svalbard), Leu et al. (2006) showed that PUFA proportions declined from a maximum of 45%, 2 weeks before the diatom-dominated bloom reached peak biomass, to 28% when the bloom ended (overall average of 31.5% for the time course during 2003). Here, PUFA proportions averaged 35.7 ± 1.2% at the SCM, and the mean contributions of ω6 FA (18.9 ± 0.83%) and ω3 FA (53.3 ± 1.98% of PUFA) to PUFA were higher than in Kongsfjorden despite the fact that sampling occurred ca 2 months (median SID value) after ice break up (and presumably followed the end of the surface bloom by a month at least). Phytoplankton biomass at the SCM ranged from 16 to 371 μg C L−1 (122 ±15 μg C L−1 on average) and was comparable to or higher than in Kongsfjorden during the spring bloom (5–150 μg C L−1). These comparisons indicate that subsurface phytoplankton layers are a quantitatively major and seasonally persistent source of high-quality POM across the large domain surveyed here. Since warming and the ongoing rise in freshwater loading generally increase vertical stratification in the Arctic Ocean, the SCM is likely to become even more crucial as a source of POM and nutritious lipids to the food web in some areas, whereas episodic upwelling (Tremblay et al., 2011) or mixing (Lewis et al., 2020) can foster the reverse in other areas.
The decline in PUFA proportion observed by Leu et al. (2006) during the course of the bloom in Kongsfjorden was partly attributed to a transition from diatoms to flagellates. This contrasts with our observation where flagellate carbon at the SCM was positively correlated with PUFA, ω6 FA and DHA. One likely explanation for this difference is that the communities we sampled between 29 July and 2 October represented more advanced stages of seasonal succession (see above discussion of SUR communities with < 10% contributions of diatoms) relative to the communities sampled ca 2–3 weeks after the peak of the spring bloom in Kongsfjorden. In addition, the algae sampled in the short-lived SCM there exhibited signs of senescence, which also contrasts with the observation that SCM communities in Baffin Bay, the North West Passage and the Beaufort Sea retain high photosynthetic efficiency throughout summer and early fall (Martin et al., 2010, 2013). In terms of PUFA, our results imply that the phytoplankton biomass decline in the upper euphotic zone after the initial bloom is mitigated by protracted diatom production at the SCM, and also by a rising contribution of flagellates as the season progresses and biomass eventually declines.
This second mitigating process may prove especially important for food web resiliency in the Canada Basin, where small-sized flagellates have partially replaced large-sized phytoplankton (Li et al., 2009; Coupel et al., 2015). This analysis also suggests that the looming threat of a temporal mismatch between primary and secondary production due to early ice break-up in the Arctic Ocean (e.g., Leu et al., 2011) is a greater cause of concern in the Atlantic sector than in the Pacific-influenced domain.
Any projection of future changes in FA profiles for the Arctic Ocean is subject to considerable uncertainty since the combined effects of the different growth factors affected by climate change on a given algal group or species may be neutral, additive, synergistic or antagonistic (e.g., Gao et al., 2019). It is nevertheless likely that the transition from diatoms to flagellates will continue given expected trends of further warming, freshening and acidification for the Arctic Ocean (e.g., Bellerby et al., 2018). Based on prior experimental or field studies, this combination of trends should favor small-sized algae over diatoms (Gao et al., 2019). The direct, apparent effects of physicochemical variables on the FA profiles of the mixed communities sampled here were generally weak and secondary in the multiple regressions. As previously mentioned, straightforward interpretations of these emergent effects are difficult since they result from the various responses of all constituents in the community. Nevertheless, our finer analysis of SUR data focusing on flagellate-dominated stations (i.e., where diatoms accounted for < 10% of phytoplankton carbon) suggest that the surface communities are unlikely to be modulated by salinity, temperature or nitrate but potentially by pH. Conversely, the FA profiles of diatom-dominated communities at the SCM might respond primarily to changes in salinity in the Pacific-influenced Arctic. In this case, further reductions in salinity can be expected to have a positive effect on overall PUFA proportions (as long as salinity does not drop below 20 g L−1). However, since the effect of salinity differs depending on the specific EFA considered (e.g., negative correlations with EPA or ω3 FA and non-significant relationships with DHA or ω6 FA), ongoing environmental changes could result in significant modification of specific FA ratios considered as indicators of food quality (e.g., DHA/EPA, ω3/ω6 FA) in terms of reproductive success and growth for grazers and other consumers higher up the food chain (Milke et al., 2004; Arendt et al., 2005).
Conclusion
Our extended temporal and spatial sampling scheme combined post-bloom conditions at the surface with nutrient-rich conditions at the SCM, covering a broad range of growth settings. Results confirmed the applicability of previously identified fatty acid trophic markers of diatoms and flagellates to several sectors of the western Arctic but indicate that other FATM should provisionally be considered unreliable, notably for dinoflagellates (DHA, OTA, 18:5ω3) and flagellates (ARA). The analyses underscored that the main effect of physicochemical, environmental factors on the lipid composition of POM in western Arctic seas is indirect and results from taxonomic variability and succession, especially at the SCM. This observation further extends to the field the conclusion of a prior compilation of laboratory studies showing that taxonomy is generally the major single driver of FA profiles. At the SCM, the highest proportions of overall PUFA and ω6 FA were caused by a rising proportion of flagellates as the growth season progressed, with secondary influences of salinity, phosphate and SID. Increases in MUFA and EPA proportions were driven by increasing contributions of diatoms, with secondary influences of phosphate and latitude. Among all the independent variables considered, none emerged as a significant predictor of ω3 FA variability at the SCM. By contrast, the SUR dataset showed a greater direct influence of environmental variables such as the effect of pH on ω3 FA and EPA. With the exception of DHA, none of the variability in the proportions of different FA groups (e.g., SFA, MUFA, PUFA, EPA, ω3 FA, and ω6 FA) could be related to temperature, which for the SCM is possibly due to the narrow range of temperatures encountered. For SUR, where the range was broader, the lack of correlation suggests that the dominant phytoplankton are either well-acclimated to ambient temperatures and do not respond to the rapid fluctuations (i.e., daily or hourly) found in this layer.
Among the relationships explored, the highest coefficients of determination (r2) were 0.69, 0.59, and 0.53, with several other values being in the 0.30–0.40 range or much lower. While this can be considered as significant progress given the high complexity and large geographical scope of our data set, it implies that a large portion of the variance in FA profiles remains to be explained in natural settings. Refinements in the estimation of carbon content for different phytoplankton groups and species as well as an improved resolution of taxonomic composition using a variety of complementary techniques would certainly help in future studies. Diatoms are important providers of POM for Arctic food webs by virtue of both the high biomasses attained by this group and the quality of their FA. We propose that in several sectors of the perennially stratified Pacific-influenced western Arctic, the protracted seasonal persistence of diatoms at the SCM plays a role that is similar or perhaps even more crucial than the spring bloom does in other areas where relatively deep vertical mixing occurs in winter (i.e., the Atlantic sector). While an experimental study investigating the effect of ocean acidification on FA profiles in a natural setting produced insightful results (e.g., Leu et al., 2013), additional studies simulating the development of high diatom biomasses under both surface and SCM conditions and different combinations of physicochemical forcing's would be useful. Our results for diatom-dominated stations suggest that salinity may play an important but previously overlooked role in affecting their FA profiles. Although flagellates typically exhibit relatively low biomass, this group was also associated with high-quality POM in our study area and we hypothesize that this quality increases as seasonal succession progresses. Overall, the analyses presented here suggest that the production of PUFA-rich phytoplankton in the Beaufort Sea, the Northwest Passage and the western sectors of Baffin Bay and the Labrador Sea is likely to persist in the near future.
Data Availability Statement
The datasets presented in this study can be found online: https://dataverse.scholarsportal.info/dataset.xhtml?persistentId=doi:10.5683/SP2/RQR8LN.
Author Contributions
VM conducted the field sampling, performed the laboratory and statistical analysis, and wrote the manuscript. J-ÉT and CP created the project, designed the sampling, and revised the manuscript. JM performed some lipid analyses. MG provided samples for taxonomic data and revised the manuscript. All authors contributed to the article and approved the submitted version.
Funding
This work was supported by a grant from the Natural Sciences and Engineering Research Council of Canada (NSERC) to J-ÉT and CP via the strategic network CHONe (Canadian Healthy Oceans Network), a grant from the Sentinel North program of the Canada First Research Excellence Fund to J-ÉT (project BriGHT), and a grant from the network center of excellence ArcticNet to J-ÉT and MG. This work contributes to the scientific programs of the FRQNT strategic cluster Québec-Océan and the Institut Nordique du Québec.
Conflict of Interest
The authors declare that the research was conducted in the absence of any commercial or financial relationships that could be construed as a potential conflict of interest.
Acknowledgments
We are grateful to the officers and crew of NGCC Amundsen, to Jonathan Gagnon, Gabrièle Deslongchamps, and Jeanette Wells for technical support, Pascal Guillot for CTD data processing, Sylvie Lessard for phytoplankton identification and enumeration, and also to the contributors of free or open source software (CRAN-R, Ocean Data View, LibreOffice, Inkscape and Linux community).
Supplementary Material
The Supplementary Material for this article can be found online at: https://www.frontiersin.org/articles/10.3389/fenvs.2020.538635/full#supplementary-material
Abbreviations
AIC, Akaike information criterion; ALA, α-linolenic acid; AMPL, acetone-mobile polar lipids; ARA, arachidonic acid; BFATM, bacterial fatty acid trophic marker; BB, Baffin Bay; BS, Beaufort Sea; DHA, docosahexaenoic acid; EFA, essential fatty acid; EPA, eicosapentaenoic acid; FA, fatty acid; FAME, fatty acid methyl ester; FATM, fatty acid trophic marker; FFA, free fatty acid; FID, flame ionization detector; LS, Labrador Sea; MUFA, monounsaturated fatty acid; NS, Nares Strait; NW, Northwest Passage; PAR, photosynthetically available radiation; PCA, Principal Component Analysis; PL, phospholipid; POM, particulate organic matter; PUFA, polyunsaturated fatty acid; SCM, subsurface chlorophyll maximum; SFA, saturated fatty acid; SID, numbers of days elapsed between the date of 50% sea ice declined and sampling date; ST, sterol; SUR, surface; TAG, triacylglycerol; TLC, thin layer chromatography; ω3, omega-3 fatty acid; ω6, omega-6 fatty acid.
References
Alonso, D. L., Belarbi, E. H., Fernández-Sevilla, J. M., Rodríguez-Ruiz, J., and Grima, E. M. (2000). Acyl lipid composition variation related to culture age and nitrogen concentration in continuous culture of the microalga Phaeodactylum tricornutum. Phytochemistry 54, 461–471. doi: 10.1016/S0031-9422(00)00084-4
Arendt, K. E., Jónasdóttir, S. H., Hansen, P. J., and Gärtner, S. (2005). Effects of dietary fatty acids on the reproductive success of the calanoid copepod Temora longicornis. Mar. Biol. 146, 513–530. doi: 10.1007/s00227-004-1457-9
Bellerby, R., Anderson, L. G., Osborne, E., Steiner, N., Pipko, I., Cross, J., et al. (2018). “Arctic ocean acidification: an update,” in AMAP Assessment 2018: Arctic Ocean Acidification. [Tromsø: Arctic Monitoring and Assessment Programme (AMAP)], 5–14.
Bermúdez, J. R., Riebesell, U., Larsen, A., and Winder, M. (2016). Ocean acidification reduces transfer of essential biomolecules in a natural plankton community. Sci. Rep. 6:27749. doi: 10.1038/srep27749
Bigogno, C., Khozin-Goldberg, I., and Cohen, Z. (2002). Accumulation of arachidonic acid-rich triacylglycerols in the microalga Parietochloris incisa (Trebuxiophyceae, Chlorophyta). Phytochemistry 60, 135–143. doi: 10.1016/S0031-9422(02)00037-7
Brodzik, M. J., and Stewart, J. S. (2016). Near-Real-Time SSM/I-SSMIS EASE-Grid Daily Global Ice Concentration and Snow Extent, Version 5. Boulder, CO: NASA National Snow and Ice Data Center Distributed Active Archive Center
Budge, S. M., Iverson, S. J., and Koopman, H. N. (2006). Studying trophic ecology in marine ecosystems using fatty acids: A primer on analysis and interpretation. Mar. Mammal Sci. 22, 759–801. doi: 10.1111/j.1748-7692.2006.00079.x
Budge, S. M., and Parrish, C. C. (1998). Lipid biogeochemistry of plankton, settling matter and sediments in Trinity Bay, Newfoundland. II. Fatty acids. Org. Geochem. 29, 1547–1559. doi: 10.1016/S0146-6380(98)00177-6
Budge, S. M., and Parrish, C. C. (1999). Lipid class and fatty acid composition of Pseudo-nitzschia multiseries and Pseudo-nitzschia pungens and effects of lipolytic enzyme deactivation. Phytochemistry 52, 561–566. doi: 10.1016/S0031-9422(99)00241-1
Chen, G. Q., Jiang, Y., and Chen, F. (2008). Salt-induced alterations in lipid composition of the diatom Nitzschia laevis (Bacillariophyceae) under heterotrophic culture condition. J. Phycol. 44, 1309–1314. doi: 10.1111/j.1529-8817.2008.00565.x
Clayton, T. D., and Byrne, R. H. (1993). Spectrophotometric seawater pH measurements: total hydrogen ion concentration scale calibration of m-cresol purple and at-sea results. Deep Sea Res. 40, 2115–2129. doi: 10.1016/0967-0637(93)90048-8
Connelly, T. L., Deibel, D., and Parrish, C. C. (2014). Trophic interactions in the benthic boundary layer of the Beaufort Sea shelf, Arctic Ocean: combining bulk stable isotope and fatty acid signatures. Prog. Oceanogr. 120, 79–92. doi: 10.1016/j.pocean.2013.07.032
Coupel, P., Matsuoka, A., Ruiz-Pino, D., Gosselin, M., Marie, D., Tremblay, J.-É., et al. (2015). Pigment signatures of phytoplankton communities in the Beaufort Sea. Biogeosciences 12, 991–1006. doi: 10.5194/bg-12-991-2015
Dalsgaard, J., St. John, M., Kattner, G., Müller-Navarra, D., and Hagen, W. (2003). Fatty acid trophic markers in the pelagic marine environment. Adv. Mar. Biol. 46, 225–340. doi: 10.1016/S0065-2881(03)46005-7
Fábregas, J., Maseda, A., Domínguez, A., and Otero, A. (2004). The cell composition of Nannochloropsis sp. changes under different irradiances in semicontinuous culture. World J. Microb. Biot. 20, 31–35. doi: 10.1023/B:WIBI.0000013288.67536.ed
Falk-Petersen, S., Hop, H., Budgell, W. P., Hegseth, E. N., Korsnes, R., Løyning, T. B., et al. (2000). Physical and ecological processes in the marginal ice zone of the northern Barents Sea during the summer melt period. J. Mar. Syst. 27, 131–159. doi: 10.1016/S0924-7963(00)00064-6
Field, C. B., Behrenfeld, M. J., Randerson, J. T., and Falkowski, P. (1998). Primary production of the biosphere: integrating terrestrial and oceanic components. Science 281, 237–240. doi: 10.1126/science.281.5374.237
Folch, J., Lees, M., and Sloane Stanley, G. H. (1957). A simple method for the isolation and purification of total lipids from animal tissues. J. Biol. Chem. 226, 497–509.
Galloway, A. W. E., and Winder, M. (2015). Partitioning the relative importance of phylogeny and environmental conditions on phytoplankton fatty acids. PLoS ONE 10:e0130053. doi: 10.1371/journal.pone.0130053
Gao, K., Beardall, J., Häder, D. P., Hall-Spencer, J. M., Gao, G., and Hutchins, D. A. (2019). Effects of ocean acidification on marine photosynthetic organisms under the concurrent influences of warming, UV radiation, and deoxygenation. Front. Mar. Sci. 6:322. doi: 10.3389/fmars.2019.00322
Gladyshev, M. I., Sushchik, N. N., and Makhutova, O. N. (2013). Production of EPA and DHA in aquatic ecosystems and their transfer to the land. Prostag. Oth. Lipid M. 107, 117–126. doi: 10.1016/j.prostaglandins.2013.03.002
Grosse, J., Brussaard, C. P. D., and Boschker, H. T. S. (2019). Nutrient limitation driven dynamics of amino acids and fatty acids in coastal phytoplankton. Limnol. Oceanogr. 64, 302–316. doi: 10.1002/lno.11040
Gurr, M. I., Harwood, J. L., and Frayn, K. N. (2002). Lipid Biochemistry. Oxford: Blackwell Science.
Guschina, I. A., and Harwood, J. L. (2009). Lipids in Aquatic Ecosystems. New York, NY: Springer. 1–24. doi: 10.1007/978-0-387-89366-2_1
Hansen, H. P., and Koroleff, F (1999). “Determination of nutrients,” in Methods of Seawater Analysis. 3rd ed. Weinheim: Wiley Blackwell, 159–228.
Harwood, J. L. (1998). “Membrane lipids in algae,” in Lipids in Photosynthesis: Structure, Function and Genetics. Advances in Photosynthesis and Respiration, Vol. 6. Dordrecht: Springer. doi: 10.1007/0-306-48087-5_3
Henriksen, P., Riemann, B., Kaas, H., Sørensen, H. M., and Sørensen, H. L. (2002). Effects of nutrient-limitation and irradiance on marine phytoplankton pigments. J. Plankton Res. 24, 835–858. doi: 10.1093/plankt/24.9.835
Hixson, S. M., and Arts, M. T. (2016). Climate warming is predicted to reduce omega-3, long-chain, polyunsaturated fatty acid production in phytoplankton. Glob. Change Biol. 22, 2744–2755. doi: 10.1111/gcb.13295
Huston, M. A., and Wolverton, S. (2009). The global distribution of net primary production: resolving the paradox. Ecol. Monogr. 79, 343–377. doi: 10.1890/08-0588.1
IPCC (2014). “Climate change 2014: synthesis report,” in Contribution of Working Groups I, II and III to the Fifth Assessment Report of the Intergovernmental Panel on Climate Change. eds R. K. Pachauri and L. A. Meyer (Geneva: IPCC), 151.
Jiang, H., and Gao, K. (2004). Effects of lowering temperature during culture on the production of polyunsaturated fatty acids in the marine diatom Phaeodactylum tricornutum (Bacillariophyceae). J. Phycol. 40, 651–654. doi: 10.1111/j.1529-8817.2004.03112.x
Jónasdóttir, S. H. (2019). Fatty acid profiles and production in marine phytoplankton. Mar. Drugs. 17:151. doi: 10.3390/md17030151
Jónasdóttir, S. H., Visser, A. W., Richardson, K., and Heath, M. R. (2015). Seasonal copepod lipid pump promotes carbon sequestration in the deep North Atlantic. Proc. Natl. Acad. Sci. U.S.A. 112, 12122–12126. doi: 10.1073/pnas.1512110112
Kelly, J. R., and Scheibling, R. E. (2012). Fatty acids as dietary tracers in benthic food webs. Mar. Ecol. Prog. Ser. 446, 1–22. doi: 10.3354/meps09559
Khotimchenko, S. V., and Yakovleva, I. M. (2005). Lipid composition of the red alga Tichocarpus crinitus exposed to different levels of photon irradiance. Phytochemistry 66, 73–79. doi: 10.1016/j.phytochem.2004.10.024
Komsta, L. (2011). Package ‘Outliers’ (Online R Package Version 0.14). Lublin: Medical University of Lublin.
Krause, E., Wichels, A., Giménez, L., Lunau, M., Schilhabel, M. B., and Gerdts, G. (2012). Small changes in pH have direct effects on marine bacterial community composition: a microcosm approach. PLoS ONE 7:e0047035. doi: 10.1371/journal.pone.0047035
Langen, P. L., Grenier, P., and Brown, R. (2018). “Marine ecosystems,” in Adaptation Actions for a Changing Arctic: Climatic drivers (Oslo: Arctic Monitoring and Assessment Programme (AMAP)), 39–76
Lemire, M., Kwan, M., Laouan-Sidi, A., Muckle, G., Pirkle, C., Ayotte, P., et al. (2015). Local country food sources of methylmercury, selenium and omega-3 fatty acids in Nunavik, Northern Quebec. Sci. Total Environ. 509–510, 248–259. doi: 10.1016/j.scitotenv.2014.07.102
Leu, E., Daase, M., Schulz, K. G., Stuhr, A., and Riebesell, U. (2013). Effect of ocean acidification on the fatty acid composition of a natural plankton community. Biogeosciences 10, 1143–1153. doi: 10.5194/bg-10-1143-2013
Leu, E., Falk-Petersen, S., Kwaśniewski, S., Wulff, A., Edvardsen, K., and Hessen, D. O. (2006). Fatty acid dynamics during the spring bloom in a High Arctic fjord: Importance of abiotic factors versus community changes. Can. J. Fish. Aquat. Sci. 63, 2760–2779. doi: 10.1139/f06-159
Leu, E., Mundy, C., Assmy, P., Campbell, K., Gabrielsen, T., Gosselin, M., et al. (2015). Arctic spring awakening - Steering principles behind the phenology of vernal ice algal blooms. Prog. Oceanogr. 139, 151–170. doi: 10.1016/j.pocean.2015.07.012
Leu, E., Søreide, J. E., Hessen, D. O., Falk-Petersen, S., and Berge, J. (2011). Consequences of changing sea-ice cover for primary and secondary producers in the European Arctic shelf seas: timing, quantity, and quality. Prog. Oceanogr. 90, 18–32. doi: 10.1016/j.pocean.2011.02.004
Lewis, E., and Wallace, D. (1998). Program developed for CO2 system calculations. Ornl. Cdiac. 105 1–21. doi: 10.2172/639712
Lewis, K. M., van Dijken, G. L., and Arrigo, K. R. (2020). Changes in phytoplankton concentration now drive increased Arctic Ocean primary production. Science 369, 198–202. doi: 10.1126/science.aay8380
Li, W. K. W., McLaughlin, F. A., Lovejoy, C., and Carmack, E. C. (2009). Smallest algae thrive as the arctic ocean freshens. Science 326:539. doi: 10.1126/science.1179798
Los, D. A., Mironov, K. S., and Allakhverdiev, S. I. (2013). Regulatory role of membrane fluidity in gene expression and physiological functions. Photosynth. Res. 116, 489–509. doi: 10.1007/s11120-013-9823-4
Lovejoy, C., Massana, R., and Pedrós-Alió, C. (2006). Diversity and distribution of marine microbial eukaryotes in the Arctic Ocean and adjacent seas. Appl. Environ. Microb. 72, 3085–3095. doi: 10.1128/AEM.72.5.3085-3095.2006
Lund, J. W. G., Kipling, C., and Le Cren, E. D. (1958). The inverted microscope method of estimating algal numbers and the statistical basis of estimations by counting. Hydrobiologia 11, 143–170. doi: 10.1007/BF00007865
Lynn, S. G., Kilham, S. S., Kreeger, D. A., and Interlandi, S. J. (2000). Effect of nutrient availability on the biochemical and elemental stoichiometry in the freshwater diatom Stephanodiscus minutulus (Bacillariophyceae). J. Phycol. 36, 510–522. doi: 10.1046/j.1529-8817.2000.98251.x
Mansour, M. P., Volkman, J. K., Jackson, A. E., and Blackburn, S. I. (1999). The fatty acid and sterol composition of five marine dinoflagellates. J. Phycol. 35, 710–720. doi: 10.1046/j.1529-8817.1999.3540710.x
Martin, J., Dumont, D., and Tremblay, J.-É. (2013). Contribution of subsurface chlorophyll maxima to primary production in the coastal Beaufort Sea (Canadian Arctic): a model assessment. J. Geophys. Res. Oceans 118, 5873–5886. doi: 10.1002/2013JC008843
Martin, J., Tremblay, J.-É., Gagnon, J., Tremblay, G., Lapoussière, A., Jose, C., et al. (2010). Prevalence, structure and properties of subsurface chlorophyll maxima in Canadian Arctic waters. Mar. Ecol. Prog. Ser. 412, 69–84. doi: 10.3354/meps08666
Meier, W. N., Markus, T., and Comiso, J. C. (2018). AMSR-E/AMSR2 Unified L3 Daily 12.5 km Brightness Temperatures, Sea Ice Concentration, Motion and Snow Depth Polar Grids, Version 1. Boulder, CA: NASA National Snow and Ice Data Center Distributed Active Archive Center.
Menden-Deuer, S., and Lessard, E. J. (2000). Carbon to volume relationships for dinoflagellates, diatoms, and other protist plankton. Limnol. Oceanogr. 45, 569–579. doi: 10.4319/lo.2000.45.3.0569
Milke, L. M., Bricelj, V. M., and Parrish, C. C. (2004). Growth of postlarval sea scallops, Placopecten magellanicus, on microalgal diets, with emphasis on the nutritional role of lipids and fatty acids. Aquaculture 234, 293–317. doi: 10.1016/j.aquaculture.2003.11.006
Millero, F. J., Woosley, R., Ditrolio, B., and Waters, J. (2009). Effect of ocean acidification on the speciation of metals in seawater. Oceanography 22, 72–85. doi: 10.5670/oceanog.2009.98
Mock, T., and Kroon, B. M. A. (2002). Photosynthetic energy conversion under extreme conditions - II: the significance of lipids under light limited growth in Antarctic sea ice diatoms. Phytochemistry 61, 53–60. doi: 10.1016/S0031-9422(02)00215-7
Moore, C. M., Mills, M. M., Arrigo, K. R., Berman-Frank, I., Bopp, L., Boyd, P. W., et al. (2013). Processes and patterns of oceanic nutrient limitation. Nat. Geosci. 6, 701–710. doi: 10.1038/ngeo1765
Olenina, I., Hajdu, S., Edler, L., Andersson, A., Wasmund, N., Busch, S., et al. (2006). “Biovolumes and size-classes of phytoplankton in the Baltic Sea,” in HELCOM Baltic Sea Environment Proceedings (Helsinki), 106.
Parrish, C. C. (1987). Separation of aquatic lipid classes by Chromarod thin-Layer chromatography with measurement by Iatroscan flame ionization detection. Can. J. Fish Aquat. Sci. 44, 722–731. doi: 10.1139/f87-087
Parrish, C. C. (1999). In: Lipids in Freshwater Ecosystems. New York, NY: Springer. doi: 10.1007/978-1-4612-0547-0_2
Parrish, C. C. (2009). In: Lipids in Aquatic Ecosystems. New York, NY: Springer. doi: 10.1007/978-0-387-89366-2_13
Parrish, C. C. (2013). Lipids in marine ecosystems. Oceanography 2013:604045. doi: 10.5402/2013/604045
Parrish, C. C., Thompson, R. J., and Deibel, D. (2005). Lipid classes and fatty acids in plankton and settling matter during the spring bloom in a cold ocean coastal environment. Mar. Ecol. Prog. Ser. 286, 57–68. doi: 10.3354/meps286057
Parrish, C. C., and Wangersky, P. J. (1987). Particulate and dissolved lipid classes in cultures of Phaeodactylum tricornutum grown in cage culture turbidostats with a range of nitrogen supply rates. Mar. Ecol. Prog. Ser. 35, 119–128. doi: 10.3354/meps035119
Peltomaa, E., Johnson, M. D., and Taipale, S. J. (2018). Marine cryptophytes are great sources of EPA and DHA. Mar. Drugs 16:3. doi: 10.3390/md16010003
Pepin, P., Parrish, C. C., and Head, E. J. H. (2011). Late autumn condition of Calanus finmarchicus in the Northwestern Atlantic: evidence of size-dependent differential feeding. Mar. Ecol. Prog. Ser. 423, 155–166. doi: 10.3354/meps08952
Pruvost, J., Van Vooren, G., Cogne, G., and Legrand, J. (2009). Investigation of biomass and lipids production with Neochloris oleoabundans in photobioreactor. Bioresour. Technol. 100, 5988–5995. doi: 10.1016/j.biortech.2009.06.004
R Core Team (2020). R: A Language and Environment for Statistical Computing. R Foundation for Statistical Computing, Vienna.
Reitan, K. I., Rainuzzo, J. R., and Olsen, Y. (1994). Effect of nutrient limitation on fatty-acid and lipid-content of marine microalgae. J. Phycol. 30, 972–979. doi: 10.1111/j.0022-3646.1994.00972.x
Robert-Baldo, G. L., Morris, M. J., and Byrne, R. H. (1985). Spectrophotometric determination of seawater pH using phenol red. Anal. Chem. 57, 2564–2567. doi: 10.1021/ac00290a030
Rodolfi, L., Zittelli, G. C., Bassi, N., Padovani, G., Biondi, N., Bonini, G., et al. (2009). Microalgae for oil: Strain selection, induction of lipid synthesis and outdoor mass cultivation in a low-cost photobioreactor. Biotechnol. Bioeng. 102, 100–112. doi: 10.1002/bit.22033
Rossoll, D., Bermúdez, R., Hauss, H., Schulz, K. G., Riebesell, U., Sommer, U., et al. (2012). Ocean acidification-induced food quality deterioration constrains trophic transfer. PLoS ONE, 7. doi: 10.1371/journal.pone.0034737
Schiffrine, N., Tremblay, J.-É., and Babin, M. (2020). Growth and elemental stoichiometry of the ecologically-relevant Arctic diatom Chaetoceros gelidus: a mix of polar and temperate. Front. Mar. Sci. 6:790. doi: 10.3389/fmars.2019.00790
Siron, R., Giusti, G., and Berland, B. (1989). Changes in the fatty acid composition of Phaeodactylum tricornutum and Dunaliella tertiolecta during growth and under phosphorus deficiency. Mar. Ecol. Prog. Ser. 55, 95–100. doi: 10.3354/meps055095
Sobczuk, T. M., and Chisti, Y. (2010). Potential fuel oils from the microalga Choricystis minor. J. Chem. Technol. Biot. 85, 100–108. doi: 10.1002/jctb.2272
Sommer, U., Paul, C., and Moustaka-Gouni, M. (2015). Warming and ocean acidification effects on phytoplankton - From species shifts to size shifts within species in a mesocosm experiment. PLoS ONE 10:5. doi: 10.1371/journal.pone.0125239
Tatsuzawa, H., and Takizawa, E. (1995). Changes in lipid and fatty acid composition of Pavlova lutheri. Phytochemistry 40, 397–400. doi: 10.1016/0031-9422(95)00327-4
Tatsuzawa, H., Takizawa, E., Wada, M., and Yamamoto, Y. (1996). Fatty acid and lipid composition of the acidophilic green alga Chlamydomonas sp. J. Phycol. 32, 598–601. doi: 10.1111/j.0022-3646.1996.00598.x
Thompson, G. A. (1996). Lipids and membrane function in green algae. Biochim. Biophys. Acta 1302, 17–45. doi: 10.1016/0005-2760(96)00045-8
Thompson, P. A., Harrison, P. J., and Whyte, J. N. C. (1990). Influence of irradiance on the fatty acid composition phytoplankton. J. Phycol. 26, 278–288. doi: 10.1111/j.0022-3646.1990.00278.x
Tremblay, J.-É., Sejr, M., Bélanger, B., Devred, E., Archambault, P., Arendt, K., et al. (2018). “Marine Ecosystems,” in Adaptation Actions for a Changing Arctic: Perspectives from the Baffin Bay/Davis Strait Region. (Oslo: Arctic Monitoring and Assessment Programme (AMAP)), 139–149.
Tremblay, J. É., Anderson, L. G., Matrai, P., Coupel, P., Bélanger, S., Michel, C., et al. (2015). Global and regional drivers of nutrient supply, primary production and CO2 drawdown in the changing Arctic Ocean. Prog. Oceanogr. 139, 171–196. doi: 10.1016/j.pocean.2015.08.009
Tremblay, J. É., and Gagnon, J. (2009). “The effects of irradiance and nutrient supply on the productivity of Arctic waters: a perspective on climate change,” in Influence of Climate Change on the Changing Arctic and Sub-Arctic Conditions. in NATO Science for Peace and Security Series C: Environmental Security (Dordrecht: Springer), 6–7. doi: 10.1007/978-1-4020-9460-6_7
Tremblay, J. É., Bélanger, S., Barber, D. G., Asplin, M., Martin, J., Darnis, G., et al. (2011). Climate forcing multiplies biological productivity in the coastal Arctic Ocean. Geophys. Res. Let. 38:L18604. doi: 10.1029/2011GL048825
Usup, G., Hamid, S. Z., Chiet, P. K., Wah, C. K., and Ahmad, A. (2008). Marked differences in fatty acid profiles of some planktonic and benthic marine dinoflagellates from Malaysian waters. Phycologia 47, 105–111. doi: 10.2216/07-55.1
Utermöhl, H. (1958). Zur Vervollkommnung der quantitativen Phytoplankton-Methodik. Mitteilungen der internationale vereinigung für theoretische und angewandte. Limnologie 9, 1–38. doi: 10.1080/05384680.1958.11904091
Vaqué, D., Lara, E., Arrieta, J. M., Holding, J., Sà, E. L., Hendriks, I. E., et al. (2019). Warming and CO2 enhance arctic heterotrophic microbial activity. Front. Microbiol. 10:494. doi: 10.3389/fmicb.2019.00494
Véra, A., Desvilettes, C., Bec, A., and Bourdier, G. (2001). Fatty acid composition of freshwater heterotrophic flagellates: an experimental study. Aquat. Microb. Ecol. 25, 271–279. doi: 10.3354/ame025271
Yongmanitchai, W., and Ward, O. P. (1991). Growth of and omega-3 fatty acid production by Phaeodactylum tricornutum under different culture conditions. Appl. Environ. Microb. 57, 419–425. doi: 10.1128/AEM.57.2.419-425.1991
Keywords: lipids, phytoplankton, ω3 FA, ω6 FA, Arctic, taxonomy, environment
Citation: Marmillot V, Parrish CC, Tremblay J-É, Gosselin M and MacKinnon JF (2020) Environmental and Biological Determinants of Algal Lipids in Western Arctic and Subarctic Seas. Front. Environ. Sci. 8:538635. doi: 10.3389/fenvs.2020.538635
Received: 27 February 2020; Accepted: 30 November 2020;
Published: 23 December 2020.
Edited by:
Adam Jerold Reed, University of Southampton, United KingdomReviewed by:
Mark Andrew Stevenson, Newcastle University, United KingdomOlesia Nikolaevna Makhutova, Institute of Biophysics of Federal Research Center “Krasnoyarsk Science Center” of Siberian Branch of Russian Academy of Sciences, Russia
Copyright © 2020 Marmillot, Parrish, Tremblay, Gosselin and MacKinnon. This is an open-access article distributed under the terms of the Creative Commons Attribution License (CC BY). The use, distribution or reproduction in other forums is permitted, provided the original author(s) and the copyright owner(s) are credited and that the original publication in this journal is cited, in accordance with accepted academic practice. No use, distribution or reproduction is permitted which does not comply with these terms.
*Correspondence: Vincent Marmillot, vincent.marmillot.1@ulaval.ca; Christopher C. Parrish, cparrish@mun.ca