 El Jirie N. Baticados
 Sergio C. Capareda
 Shuhao Liu2
 Mustafa Akbulut
- 1BioEnergy Testing and Analysis Laboratory (BETA), Biological and Agricultural Engineering Department (BAEN), Texas A&M University, College Station, TX, United States
- 2Department of Chemical Engineering, Texas A&M University, College Station, TX, United States
Solar distillation system depends on adhesion of water molecules inside the glass cover of solar stills. Regular glass surfaces are prone to adsorbing other unwanted compounds and in turn lower the percentage of recovery of pure distilled water. In this study, the production of purified distilled water was compared with and without the use of graphene-based surface modifiers. In areas where salt content is high, the first pass is still usually laden with salts. Hence, to improve adhesion of water and rejection of salts, both the inside glass cover surfaces and the metal absorber plates were modified using oxygen plasma treatment and graphene surface enhancement. Results showed a 48.9% improvement of distilled water recovery from an initial recovery of 2.90 L/m2 per day to an average of 4.32 L/m2 per day. In addition, the resulting distilled water passes the World Health Organization drinking water standards such as pH, electrical conductivity (EC), and salinity. The average reduction in EC was 96.52%, an average increase of 5.06% of pH, and an average reduction of salinity of 96.52%, all measured at the highest brine salinity of 5%. The reported value of EC was 23.33 μS/cm, a lowest and near-neutral pH of 6.85, and an average salinity of 12.10 ppm.
Introduction
There are numerous areas in the world, especially along coastal regions, without potable water or water for irrigation purposes (Rakib et al., 2019). Problems with salinity bring about severe drinking water crisis and affect the health of the population. In many areas, natural drinking water is being infused by high salt content due to poor environmental management and as a result of climate change (Vineis et al., 2011). The problem is enhanced by rising sea levels including farming. Desalination plants are commonly used by many countries to partly remove the salts and other minerals from water sources. However, many of these advanced desalination systems, such as reverse osmosis and membrane systems, are quite expensive (Voutchkov, 2017 and van Wyk et al., 2020). Notable countries are those in Europe (the Netherlands), Australia, Brazil, and Asia (Bangladesh and Malaysia). According to Jones et al. (2019), about 141.5 million m3/day of desalinated water is produced globally each day, while brine water production totals 141.5 m3/day (Jones et al., 2019). About half of this production is produced in the Middle East and North African Region. The use of conventional approaches to supply clean and potable water is no longer sufficient to meet the demands of the human population. Hence, in the near future, newer cost-effective means are necessary to reduce the gap between supply and demand.
In this study, a basic solar still was initially designed to generate irrigable or potable water from brine solutions or wastewaters to simulate areas with high salt water content but with no source of drinking water or irrigable water. The distilled water recovered was meant to be tested and used for growing food crops inside a newly built renewable greenhouse system located at the BETA Laboratory of BAEN, Texas A&M University. The greenhouse is designed to house a solar-assisted evaporative cooler to achieve optimum temperature and 3-kW external photovoltaic panels with electric batteries system to run internal water pumps and evaporative fans. However, the output of the existing basic solar still is rather low and would increase the required solar still area to recover irrigable water from brine (Mechell et al., 2011).
Researches on solar stills were traditionally focused on optimizing design and operating parameters (Arunkumar et al., 2012; Kumar et al., 2015; Panchal, 2016). In recent years, solar still studies are gradually shifting toward more advanced research areas such as nanotechnology. Nanoparticles, such as aluminum oxide (Al2O3), cuprous oxide (CuO), silicon dioxide (SiO2), and titanium dioxide (TiO2), could be potentially mixed into base fluids such as saline water, in order to improve heat transfer characteristics (Faizal et al., 2013). Using a modified solar still, nanomaterials were tested at concentrations of 0.02 to 0.20% mixed into saline waters. The nanofluid system (suspension of nanoparticle and base fluid) was able to achieve a maximum productivity of 93.87% (addition of CuO) and 88.97% (addition of Al2O3) compared to a conventional still (Kabeel et al., 2014). Another study involving a solar still equipped with an external heat exchanger and SiO2 nanofluid was able to obtain a 36.37% thermal efficiency and a maximum distillate yield of 2.93 L/m2 per day (Mahian et al., 2017). A different thermal efficiency study on passive double slope solar still systems was conducted considering TiO2, Al2O3, and CuO nanofluids by Sahota and Tiwari (2016). Overall, the resulting model showed that the nanofluid systems have higher thermal energy efficiency compared to solar still that only has the base fluid (water). The Al2O3 nanoparticles were found to provide higher productivity when mixed with saline waters.
The applications of nanomaterials for surface modification has gained considerable attention for improving solar still designs. Absorber basin is an integral component of solar stills. Its surface is often coated with black paints to enhance absorptivity (Kabeel et al., 2017). Blending of CuO nanomaterials into the black paint resulted to an increased distillate recovery of up to 25% compared to conventional absorber basins. The CuO nanomaterials were mixed into the paint at 10 to 40% concentrations by weight (Kabeel et al., 2017). Another separate study to improve thermal conductivity of the basin area using nano-Fe2O3 materials was found to produce a distillate yield of 3.23 kg/m2 for the microabsorbent layer solar still, while a higher yield of 4.39 kg/m2 was obtained for the nanoabsorbent layer solar still (Balachandran et al., 2019). The nano-Fe2O3 was blended into the black enamel paint at 10% concentration by weight. A pyramidal basin type solar still was used to evaluate the effects of mixing TiO2 nanoparticles with the black paint coating of the absorber basin. The use of nano-TiO2 resulted to an increase of the average water bulk temperature of 1.50° C. The nanocoated pyramid solar still was 6.1% higher compared to the conventional still in terms of distillate yield (Kabeel et al., 2019b). Phase change materials (PCMs), often installed with the absorber plates, are used as thermal energy media to improve energy efficiency in solar stills (Hafs et al., 2018). Hybrid PCMs were prepared using nanographites at a 20% maximum concentration by weight. This resulted into a 94.52% improvement on the distillate production compared to a solar still with PCM alone (Kabeel et al., 2019a). The addition of graphene oxide nanoparticles improved the thermal performance of a PCM based solar still by 52% and a corresponding saline water temperature increase of 7° C. The total distillate produced for the nanoPCM system was 5.62 kg/m2 (Kabeel et al., 2020).
Most of surface modification researches focus on enhancing the thermal properties and energy efficiency in the absorber basin for higher distillate yield (Kabeel et al., 2017, 2020; Hafs et al., 2018; Balachandran et al., 2019). However, for an absorber basin to be more effective for desalination, it should also possess excellent hydrophobicity. Graphene is a material that is known to exhibit excellent mechanical, thermal, and electrical properties. However, only recently that researches have taken into account the potential of its surface wetting properties (Feng and Guo, 2019). Graphene is one of the favorable surface material of choice when it comes to investigating water–carbon interactions (Zhang and Zhao, 2009). The potential hydrophobic property of graphene can reduce liquid deposition and prevent surface contamination, making it a good candidate to prevent corrosion. One way to achieve superhydrophobic properties is by hybrid silane–graphene nanosheet coating for improved corrosion protective performance of surfaces (Ahmadi et al., 2016).
Most recently, graphene membranes have been developed for brine water purification. It was observed that using graphene led to larger water permeability on thin-film composite membranes and showed greater resistance to fouling (Homaeigohar and Elbahri, 2017). Porous graphene sheets also resulted to high rejection ratio for organic molecules (Yang et al., 2019). Understanding the wettability performance of graphene with respect to water could potentially improve the current solar still designs, particularly those designs scaled to remote areas where pure water is not available. It is therefore theorized that by doing graphene-enhanced surface modification to our original solar still design, distilled water output could be improved. This was accomplished by modifying both the glass inner surfaces for effective water condensation and the absorber steel surface to accommodate salt ions and improve water rejection.
Materials and Methods
The Solar Still Prototype
A prototype advanced solar desalination system has been fabricated. Shown in Figure 1 is an 8.5″ × 8.5″ acrylic glass panel attached to a 4130-alloy steel to simulate a laboratory-scale thermal desalination system similar to that of the original solar still designs of Mechell et al. (2011). All possible leaks were sealed using silicone rubber sealant (Mfr. Model #00753, Grainger). The whole setup was completely insulated to ensure high solar energy heat absorption. Preliminary tests were made to ensure no leaks as well as continuous production of distilled water. When this was done, the system was simulated using carefully prepared brine solutions and established full performance. This prototype already has the surface modification treatment using graphene materials.
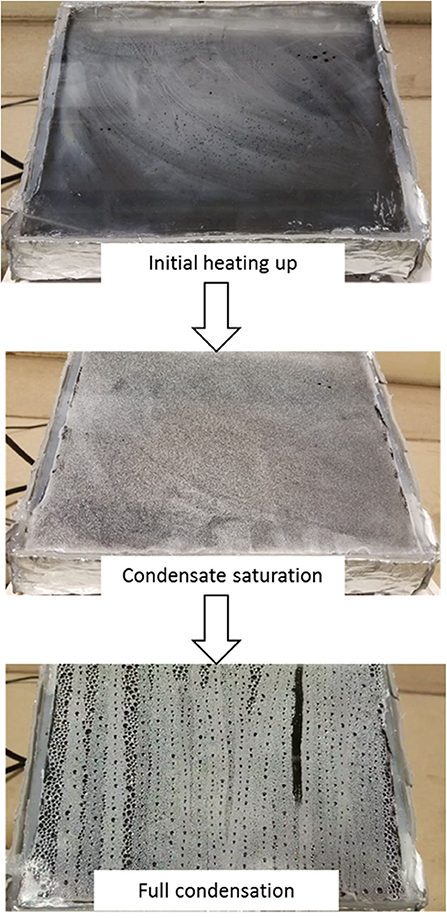
Figure 1. Visual observation of the advanced solar thermal still during desalination runs.
Full-Scale Solar Still and Testing of Prototype
Figure 1 also shows the laboratory-scale simulated solar desalination system during testing. Heating up of the model still lasted for about 20 to 30 min to achieve the first condensate drop. During the initial heat-up, the inside surface of the glass became foggy until crystals of water were formed as the temperature increased. Upon reaching a feed temperature of around 60° C, the glass surface was observed to exceed its capacity to hold the accumulated water condensates. Small water crystals further agglomerate and eventually reached droplet sizes heavy enough to slide down the glass panel surface as shown in the last picture in Figure 1.
Test Run of Solar Desalination System
Testing of the advanced solar desalination system was made. We have used three different levels of salinity (1, 2, and 5%) with three replications for a total of nine runs. These ranges of concentrations are typical of many brine water sources in some areas such as that in Egypt. Each run lasted for about 1 to 1.25 h. The actual run time considered the time = 0, where the first drop of the condensate was observed.
The temperatures of the feedwater inside the still, the glass panel outside surface temperature, and relative humidity (RH) were recorded on a 10-min interval. A U23 HOBO data logger with built-in sensor (Onset Computer Corp., Bourne, MA, USA) was placed on top of the glass panel to monitor the temperature (T) and RH changes at the outside surface. Another T sensor was inserted on one side of the still for feedwater monitoring. The sensors have an accuracy of T ± 0.21° C and RH ± 2.5%.
For the choice of water quality parameters, three major parameters were identified:
a. pH,
b. EC, and
c. salinity for both the feed and products.
Surface Modification Experiments
Graphene may potentially be produced from pyrolysis of biomass resources after rigorous purification of resulting biochar. Parallel studies are being conducted for that purpose from various biomass resources such as coconut shell, wood wastes, cotton gin trash, and wastewater residues (biosolids). However, for this initial study, research-grade graphene powder samples were used. It has a Brunauer–Emmett–Teller surface area of >500 m2/g with determined lateral size of 0.5 to 5 μm (Sigma–Aldrich, St. Louis, MO, USA).
The surface modification experiments were carried out on the condenser surface (glass transparent cover) and the absorber surface (stainless-steel plate). The transparent cover is a 3/8-inch-thick borosilicate glass sheet, often known for excellent clarity even upon exposure to most chemicals (McMaster-Carr, Santa Fe Springs, CA, USA), and the metal absorber is a 304 stainless sheet, resistant to corrosion up to temperatures of 1,500°F (McMaster-Carr). Figure 2 shows the polymer coating process nomenclature. To increase the hydrophobicity of steel, sintering and chemical binder were both used to prepare the graphene coating. Fluorinated silane [trichloro (1H,1H,2H,2H-heptadecafluorodecyl)] silane or THFS (purity: >96.0%; TCI America, Portland, OR, USA) was used to modify the coating and enhance the hydrophobicity of the absorber. The THFS is commonly used as a binder to graphene and to its derivative, graphene oxide. It has one major advantage—primarily from the resulting carbon–fluorine (C–F) bond, of providing good thermal stability, chemical resistance, and super hydrophobicity (Ahmadi et al., 2016; Husamelden and Fan, 2019). The transparent cover underwent oxygen plasma treatment, a common method to improve hydrophilic surface property (Tan et al., 2010).
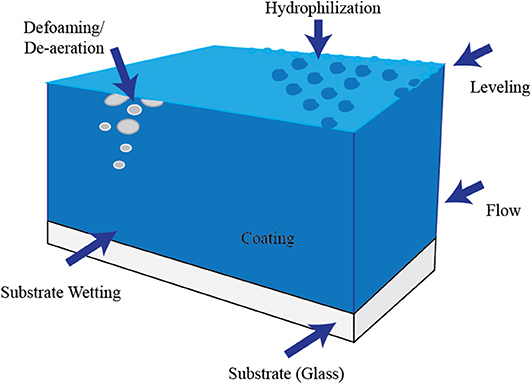
Figure 2. Process of modifying surface for polar and non-polar compound groups.
Hydrophilic Modification of Glass Surfaces
Increasing wettability of glass was achieved by oxygen plasma treatment. In oxygen plasma, gas atoms are excited to higher energy states and are also ionized (Mushtaq, 2020). The oxygen species created in the plasma (O2+, O2−, O, O+) attack and bond on the glass surface to increase the surface wettability. For this study, a bench-top plasma system was used (PDC-32G; Harrick Plasma, NY, USA) to treat the glass cover surface. The plasma parameters used were as follows: pressure up to 0.2 mbar, gas flow at 8 cm3/min (STP), excitation frequency of 13.56 MHz, and treatment times varying from 1 to 8 min. The time between plasma exposure and contact angle (CA) measurements never exceeded 3 min, at room temperature.
CA measurements were carried out using ImageJ software (National Institutes of Health, Bethesda, MD, USA) via low-bond axisymmetric drop shape analysis adopted from Stalder et al. (2010). The CA measurements underwent five repetitions for different samples for statistical reliability.
Typical glass cover treatment steps
Refer to Figure 2 for nomenclatures used.
1. The glass (called the substrate) first undergoes oxygen plasma treatment. The oxygen species bond on the glass surface to increase what one may call “surface wettability —how well the surface will adhere to hydrophilic substances after application of a polymer coating.
2. The polymer coating must be made uniform (called leveling), and it must flow uniformly on the substrate. One must also avoid foam formation or bubbles (aeration). Hence, if these are widespread, de-foaming and de-aeration must be made.
3. This surface wettability is improved with proper treatment exposure times. Hence, we design our treatment as a function of time of exposure.
4. In most cases, once the hydrophilic polymer coating is done (hydrophilization), the surface is tested for its wetting properties. For this study, the glass covers were only exposed to oxygen plasma treatment. Shown in Figure 3 are the typical behaviors of target compounds adherence to the surface as illustrated by what we call “contact angle.”
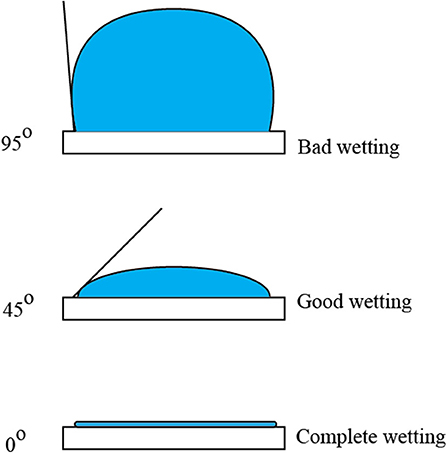
Figure 3. Evaluate wetting properties of substances on treated surface.
Shown in Figure 3 are 95°, 45°, and 0° C As showing bad wetting, good wetting, and complete wetting, respectively.
Hydrophobic Modification of Steel Surface
The first method to increase hydrophobic property of steel surface was by direct coating of graphene, with and without THFS modification. This method permanently fuses the graphene coating via sintering for 2 h at 500° C, after air-drying the steel sheets at room temperature for 12 h.
The second method was by the use of a binder (without sintering). The graphene powder was functionalized by using a THFS solution, dissolved in 5 mM hexane. The binder was coated on the steel surfaces first, and then the graphene suspension was slowly dropped on the binder while performing spin coating (usually at spin speed of about 1,600 rpm) for about 30 s. Figure 4 shows the spin coating process to ensure uniformity of flow and proper leveling of the functionalized graphene coating.
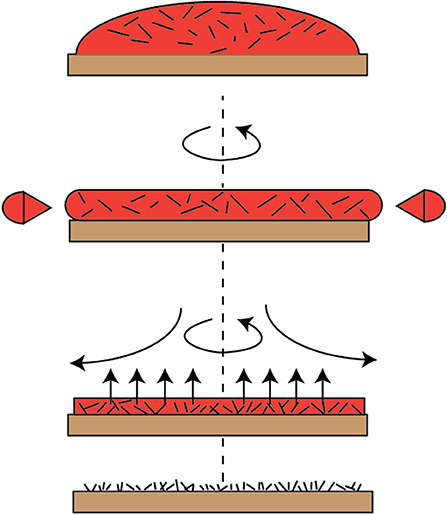
Figure 4. Spin coating process to ensure uniformity of flow and proper leveling.
Distilled Water Analysis
The analysis of distilled water coming out of the solar still were measured using standard methods for the examination of water and wastewater (Greenberg et al., 1992). The three major water quality parameters tested were electrical conductivity (EC), pH, and salinity. The standard procedures for the analysis were as follows:
a. (a) ED method (method 2520B), (b)
b. pH, and (c)
c. salinity (method 2520A).
The EC method is the most commonly used parameter to determine salinity of water or wastewater. EC is a measure of the ability of an aqueous solution to carry an electric current. This ability depends on the presence of ions; on their total concentration, mobility, and valence; and on the temperature measurement. The International System of units (SI) for EC is in Siemens (S) per unit of cm (μS/cm). Conductance, G, is defined as the reciprocal of resistance (G = 1/R), where R is in units of ohm. The reciprocal of the ohm is the Siemens, S. Conductance of a solution is measured between two spatially fixed and chemically inert electrodes. To avoid polarization at the electrode surfaces, the conductance measurement is made with an alternating current signal (Willard et al., 1974). The conductance of a solution, G, is directly proportional to the electrode surface area, A, cm2, and inversely proportional to the distance between the electrode, L, cm. The constant of proportionality, k, is shown in Equation (1) and is called the “conductivity.”
The apparatus used for this method is a research-grade self-contained conductivity instrument as recommended in the standards. The pH measurement made use of laboratory-grade digital pH meter from Mettler Toledo (Model SevenEasy pH meter S20; Mettler Toledo, Schwerzenbach, Germany).
Salinity is a measure of dissolve salts in a given mass of solution. The salinity of brine water was determined by hydrometric and argentometric methods, as specified in Standard Methods (Greenberg et al., 1992). These instruments were calibrated against standards of KCl. However, because of its high sensitivity and ease of measurement, the conductivity method is also the most commonly used method to determine salinity. This study made use of carefully prepared brine solutions following Practical Salinity Scale. This scale was developed relative to a KCl solution. For example, a seawater with a conductivity at 15° C equal to that of a KCl solution containing a mass of 32.4356 g in a mass of 1 kg of solution is defined as having a practical salinity of 35. This value was determined as an average of three independent laboratory readings. The salinity is dependent of the conductivity, R, and as a function of temperature. Hence, the study reported the temperature during laboratory experiments for future comparative studies.
The values of the parameters above were compared with those reported by the World Health Organization (WHO), drinking water standards [World Health Organization (WHO), 2011, 2017]. While the study used the WHO standards for drinking water, the project requires the use of the distilled water for irrigation purposes only. Hence, satisfying drinking water standards would mean the output water is also safe for growing plants in greenhouse as well.
Results and Discussions
Surface Modification Results
The wetting properties of any surface material can be defined by the interactions between the material surface and water molecules (Li and Guo, 2018). Hydrophilic properties are exhibited when water molecules spread out and form a thin liquid film on the surface, with CA <90°. This happens when the associated dispersion energy between the water and the material surface is higher than the internal binding energies between water molecules. Hydrophobic properties are typically observed by the agglomeration of water molecules on the material surface, often forming spherical droplets with CA more than 90° (Feng and Guo, 2019). In some cases, superhydrophobic surfaces could be achieved exhibiting CA of more than 150° (Cai et al., 2018).
Figure 5 shows the photographs of glass covers treated by oxygen plasma with different exposure time of up to 8 min. Figure 6 shows the resulting CAs on glasses treated by oxygen plasma at various exposure times. The lowest CA was measured at 31.77° showing excellent wetting. The surface transparence of glass was visually observed after different exposure times to oxygen plasma treatment. The results showed that some part of the surface became blurry after 4-min treatment, which was caused by the exposure to plasma. The static CA of water droplets on bare glass surfaces was θ = 57.50° ± 0.60°, indicating surfaces were hydrophilic. In comparison, the CA range of the different time treated glass surfaces are from θ = 37.51° ± 0.55° to θ = 31.77° ± 0.72°, showing a higher wettability than bare glasses.
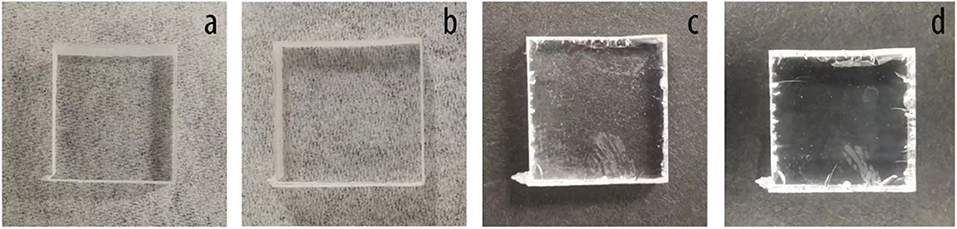
Figure 5. Glasses treated by oxygen plasma with different times. (a) Bare glass, (b) 1-min treatment, (c) 4-min treatment, (d) 8-min treatment.
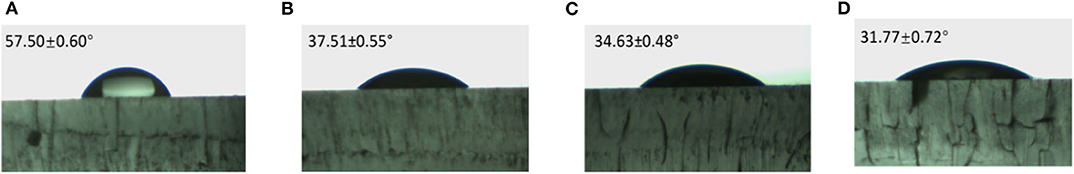
Figure 6. Contact angle on glasses treated by oxygen plasma with different time. (A) Bare glass, (B) 1-min treatment, (C) 4-min treatment, (D) 8-min treatment.
Figure 7 indicates the hydrophobic properties of Gr-coated steels after 500° C sintering treatment. The CA of bare steel is θ = 43.55° ± 0.3°. In comparing a with b, the Gr coating without sintering increased the CA to θ = 83.99° ± 0.7°, which is still considered as a hydrophilic surface (<90°). The coatings without sintering were observed to be unstable and easily broken by scratching. Graph c shows that the heating procedure could have oxidized the graphene material, thereby producing graphene oxide, which has high wettability. The THFS would bond on the graphite oxide and provide a low surface energy to increase the hydrophobicity of the steel surfaces, which has a CA of θ = 128.73° ± 0.6°.
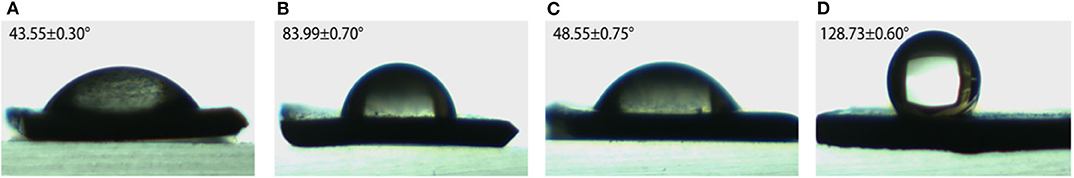
Figure 7. Contact angle on steel and Gr-coated steel treated by sintering to 500° C. (A) Bare steel, (B) Steel + Gr without heating, (C) steel + Gr 500° C, (D) Steel + Gr 500° C + THFS.
In order to increase the stability of the Gr-coating, the chemical binder was coated between steel and Gr coating by spin coating method, described in earlier section. The binder was coated on the steel surfaces first, and then the graphite suspension was dropped on the binder and run the spin coating again. The static CA of water droplets on the steel–binder–Gr sample surfaces was determined (Figure 8). Images (A) and (B) show the pure binder on the steel surfaces has higher CA (θ = 80° ± 0.7° and 67.5° ± 0.5°) than the bare steel. The increasing surface roughness caused by the binder is attributed to this phenomenon. Graphene coating on the binder increased hydrophobicity to θ =130° ± 0.4°. After modifying the graphite surfaces with THFS, the surface energy was decreased even more, and a CA at θ = 150 ± 0.5° was obtained, which exhibits superhydrophobicity.
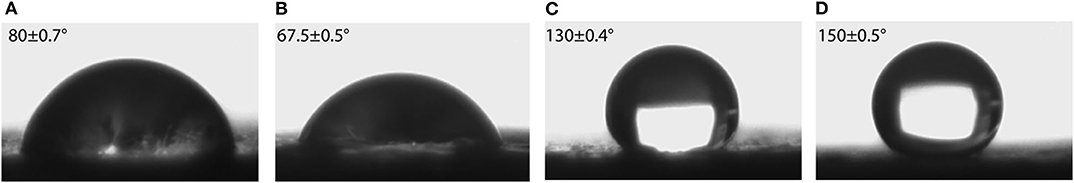
Figure 8. Contact angle on steel and Gr-coated steel treated polymer binder. (A) Steel + binder, (B) steel + binder + solvent, (C) steel + binder + Gr, (D) steel + binder + Gr + THFS.
Figure 9 illustrates the surface morphology of steel–binder and steel–binder–Gr surfaces using scanning electron microscopy. Images (A) and (D) show that highly polymerized binder formed an entire part to provide a smooth surface on the steel. Some holes and convex could be found on the surface, which provide higher roughness than bare steel, which may cause the CA (θ = 80 ± 0.7°) to be higher than bare steel. For the binder and graphene coating, a higher roughness was observed. The graphene provides bigger contact area for the low polymerized binder, which forms small particles with a roughly 200-nm size. Furthermore, bigger amounts of graphene pieces were exposed on the surfaces. The better hydrophobicity of steel–binder–Gr surfaces was found because of the synergism of low surface tension of graphene and rough surface structure. Furthermore, the THFS modification decreased surface tension compared with the sample with only graphene.
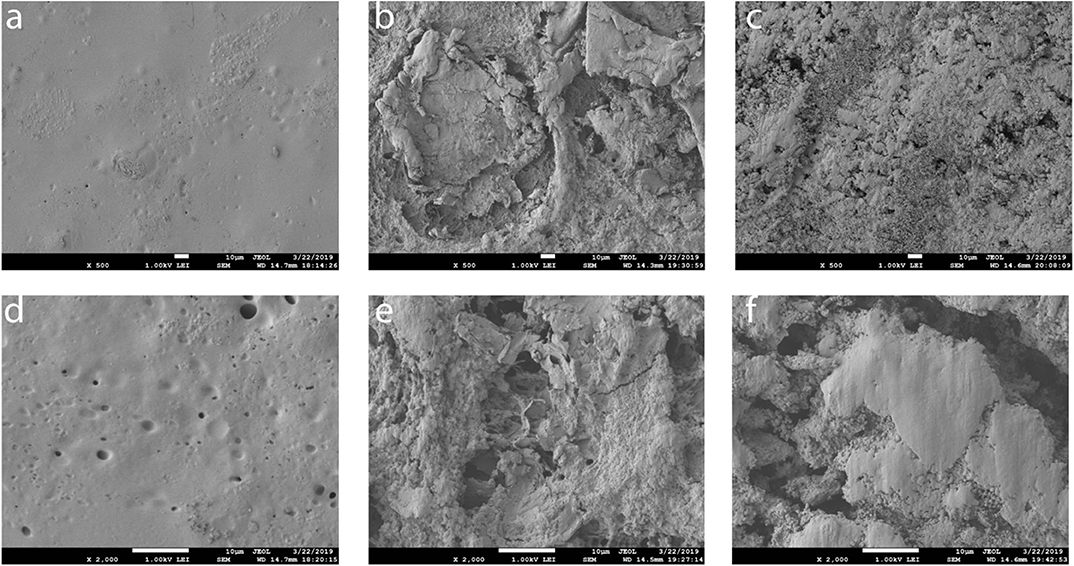
Figure 9. Scanning electron microscope (SEM) of steel and Gr-coated steel treated by polymer binder. (a,d) Steel + binder, (b,e) steel + binder +Gr, (c,f) steel + binder + Gr + THFS.
Advanced Solar Still Experimental Results
Distilled Water Quality
Table 1 shows the average water quality data for the three major parameters used in this study. There were significant decreases in the average EC measurements for all the triplicated runs. All pH values were near-neutral, and the average salinity values were all below the drinking water standards set by the World Health Organization (WHO) (2011). The lowest values of EC and salinity were achieved at the highest initial brine concentrations of 5%.
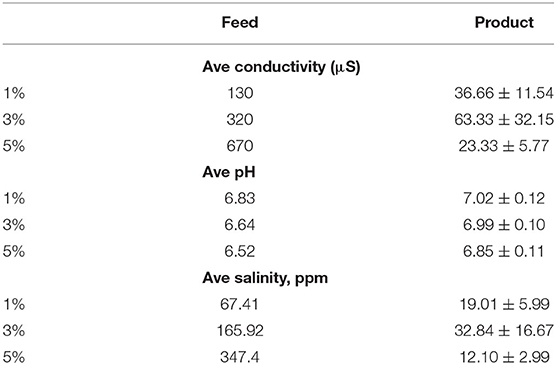
Table 1. Average water quality data.
pH Values of Feed and Product Water
The WHO of the United Nations standard for safe drinking water is in the range of 6.5 to 8.5 (shaded region of Figure 10). The product water was observed to have relatively higher pH compared to that of the feedwater. The feedwater has low pH values prior desalination. The pH of the water increased after desalination but still around neutral pH of 7. The purified water has pH values that were within the acceptable range for drinking. Note that irrigation water had lower standards than drinking water. This study proposes to ensure that we are producing very high-grade water for irrigation purposes.
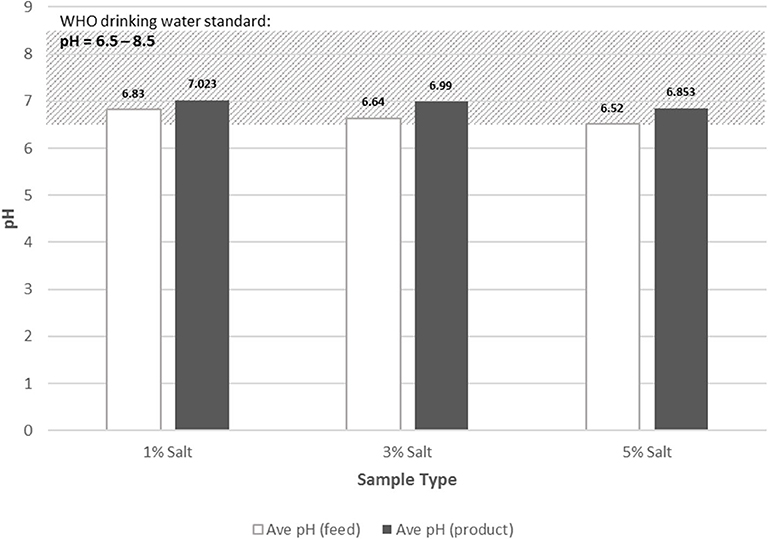
Figure 10. Values of pH of feed and product water.
Electrical Conductivity
The safety range for drinking water in terms of EC values is 250 μS/cm [World Health Organization (WHO), 2017]. The feedwater with 3 and 5% salt content was all outside the safety range. After desalination, all product waters have acceptable values of EC to drink (Figure 11). The reduction in EC was within the range of about 70 to 96% upon using the designed still. The reduction in EC from the highest salt water concentration of 5% was about 96.52%
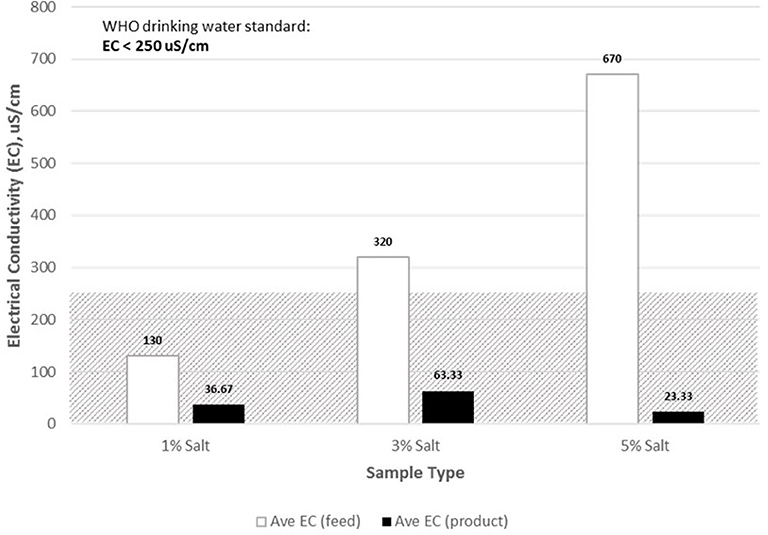
Figure 11. Electrical conductivity values of feed and product water.
Salinity Values of Feed and Product Water
By WHO standards, salinity levels should not exceed 250 ppm, in terms of chloride concentration. The highest salinity level was recorded at 670 ppm, corresponding to 5% salt level of feedwater (Figure 12). Both the 3 and 5% feedwater salt levels were beyond the salinity threshold for drinking water. The resulting product water contained significantly low levels of salt compared to that of the feedwater. The lowest product salinity level was 23.33 ppm, and the highest was 63.33 ppm. All product water salinity values were acceptable for drinking water, by WHO standards for drinking water. At the highest salt water concentrations used, there was a reduction of about 96.52% in salinity.
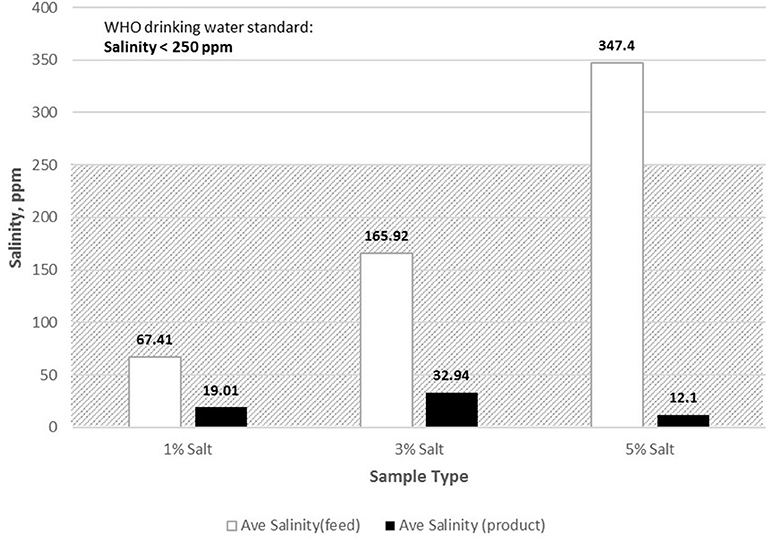
Figure 12. Salinity values of feed and product water.
The advanced and surface-improved desalination still has quite high removal efficiency of salt, such that it can be a good purification device even for turning salt water into fresh water.
Advanced Solar Desalination Production Rate
Table 2 shows the data for the condensate production rate. About 0.5 mL/min is the highest condensation rate and equivalent to around 0.4 L/day of output as shown in the calculations below. The theoretical average number of sunshine hours in College Station, Texas, from April to June is around 13.4 h. If one would factor in the surface area of the desalination system and project production per unit area, the total daily production will be 4.32 L/m2 per day, way above our target and about 48.9% increase from unmodified glass and metal surfaces. However, the clearness index in College Station, Texas, during these months averaged around 0.56; hence, the actual production will be around 2.42 L/m2 per day quite close to the published 2.90 L/m2 per day in earlier studies by Dr. Capareda (Mechell et al., 2011). Note that the published value is the average for the year. The data shown are lower because of lower clearness index during the experimental period. The higher clearness index in Texas occurs during the months of July and August (0.61) bringing the actual production rate value to 2.63 L/m2 per /m2 per day (within 9%). The project will continue to implement improvements to the current system to achieve much improved results from the original landmark study. The theoretical and average daily water production rate calculations are shown below.
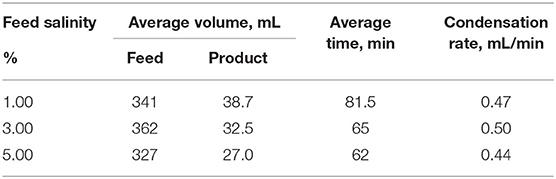
Table 2. Average advanced desalination condensate production rate.
Conclusions
This work demonstrates the proof-of-concept that by modifying the surface wettability of both the condenser and absorber of conventional solar still, a higher purified water recovery could be achieved without sacrificing water quality based on WHO standards. Hydrophilic glass cover was produced achieving the least CA of 31.77° after 8 min of oxygen plasma exposure. Superhydrophobic absorber basin surface was observed to have superior stability and a candidate anticorrosion protective material against saline water exposures. The best modified surface CA was between 130° and 150° after undergoing THFS-graphene functionalization and spin coating.
The surfaced modified solar still design has 48.9% improvement in distilled water recovery. The original unit with unmodified surface had an output of 2.90 L/m2 per day, whereas the graphene modified unit had a yearly average output of 4.32 L/m2 per day. The output water from the advanced solar still has superior versatile applicability after satisfying the minimum criteria of WHO standards.
Data Availability Statement
The datasets generated for this study are available on request to the corresponding author.
Author Contributions
EB prepared the actual testing of surface modified solar still. SL prepared the surface modification experiments. SC planned the whole hypothesis of improving solar still design by surface modification, particularly graphene enhanced absorber surfaces. MA prepared the protocol for plasma modifications and identification of chemical modifiers.
Funding
This is project is being funded by the National Academy of Sciences, Engineering and Medicine under contract number: AID-263-A-15-0002 entitled Advanced Solar Energy-Assisted Water Desalination System in High Salinity Brackish Water Areas Controlled Greenhouse for Sustainable Agriculture: A Water –Energy-Food (WEF) Nexus Project.
Conflict of Interest
The authors declare that the research was conducted in the absence of any commercial or financial relationships that could be construed as a potential conflict of interest.
Acknowledgments
This is project acknowledges the assistance of 2019 BAEN Capstone Course students (Justin Macmanus, Michael Boyd and Cheyenne Storm) for the testing of irrigable water produced by the advanced solar distillation system developed by the project in a greenhouse growing lettuce in the Spring of 2019. In addition, we would like to acknowledge the help of BAEN 485 Special Topics (Graphene Research) students for the preparation of biochar from various biomass resources (Morgan Bailey Griffin, Aaron Cole Marien, Laura Allison Peppel, Michael B. Unterman, Gus T. Waters, Avery L. Womble, and Reagan S. Giesenschlag).
References
Ahmadi, A., Ramezanzadeh, B., and Mahdavian, M. (2016). Hybrid silane coating reinforced with silanized graphene oxide nanosheets with improved corrosion protective performance. RSC Adv. 6, 54102–54112. doi: 10.1039/C6RA04843A
Arunkumar, T., Vinothkumar, K., Ahsan, A., Jayaprakash, R., and Kumar, S. (2012). Experimental study on various solar still designs. ISRN Renew. Energ. 2012:569381. doi: 10.5402/2012/569381
Balachandran, G. B., David, P. W., Mariappan, R. K., Kabeel, A. E., Athikesavan, M. M., and Sathyamurthy, R. (2019). Improvising the efficiency of single-sloped solar still using thermally conductive nano-ferric oxide. Environ. Sci. Pollut. Res. 27, 32191–32204 doi: 10.1007/s11356-019-06661-2
Cai, Y., Li, J., Yi, L., Yan, X., and Li, J. (2018). Fabricating superhydrophobic and oleophobic surface with silica nanoparticles modified by silanes and environment-friendly fluorinated chemicals. Appl. Surf. Sci. 450, 102–111. doi: 10.1016/j.apsusc.2018.04.186
Faizal, M., Saidur, R., Mekhilef, S., and Alim, M. (2013). Energy, economic and environmental analysis of metal oxides nanofluid for flat-plate solar collector. Energy Convers. Manage 76, 162–168. doi: 10.1016/j.enconman.2013.07.038
Feng, J., and Guo, Z. (2019). Wettability of graphene: from influencing factors and reversible conversions to potential applications. Nanoscale Horiz. 4, 339–364 doi: 10.1039/C8NH00348C
Greenberg, A.E., Lenore, S.C., and Eaton, A.D. (Eds). (1992). “Standard methods for the examination of water and wastewater,” in American Public Health Association, American Water Works Association and Water Environment Federation. 18th Edn, (Washington, DC: American Public Health Association).
Hafs, H., Zaaoumi, A., Ansari, O., Bah, A., Asbik, M., and Malha, M. (2018). “Effect of the nanofluid (Brackish water/Al2O3) on the passive solar still desalination performance with heat storage system,” in 10th International Conference on Electronics, Computers and Artificial Intelligence, (Iasi: ECAI), 1–6.
Husamelden, E., and Fan, H. (2019). Fluorinated functionalization of graphene oxide and its role as a reinforcement in epoxy composites. J Polym Res 26:42. doi: 10.1007/s10965-018-1687-z
Homaeigohar, S., and Elbahri, M. (2017). Graphene membranes for water desalination. NPG Asia Mater. 9:e427. doi: 10.1038/am.2017.135
Jones, E., Qdir, M., van Vliet, M. T. H., Smakhtin, V., and Kang, S. M. (2019). The state of desalination and brine production: a global outlook. Sci. Total Environ. 657, 1343–1356. doi: 10.1016/j.scitotenv.2018.12.076
Kabeel, A. E., Omara, Z. M., and Essa, F. A. (2014). Improving the performance of solar still by using nanofluids and providing vacuum. Energy Convers. Manag. 86, 268–274. doi: 10.1016/j.enconman.2014.05.050
Kabeel, A. E., Omara, Z. M., Essa, F. A., Abdullah, A. S., Arunkumar, T., and Sathyamurthy, R. (2017). Augmentation of a solar still distillate yield via absorber plate coated with black nanoparticles. Alexandria Eng. J. 56, 433–438. doi: 10.1016/j.aej.2017.08.014
Kabeel, A. E., Sathyamurthy, R., Manokar, A., Sharshir, S., Essa, F., and Elshiekh, A. (2020). Experimental study on tubular solar still using graphene oxide nano particles in phase change material (NPCM's) for fresh water production. J. Energy Storage 28:101204. doi: 10.1016/j.est.2020.101204
Kabeel, A. E., Sathyamurthy, R., Sharshir, S. W., Muthumanokar, A., Panchal, H., Prakash, N., et al. (2019b). Effect of water depth on a novel absorber plate of pyramid solar still coated with TiO2 nano black paint. J. Clean Prod. 213, 185–191. doi: 10.1016/j.jclepro.2018.12.185
Kabeel, A. E., Abdelgaied, M., and Eisa, A. (2019a). Effect of graphite mass concentrations in a mixture of graphite nanoparticles and paraffin wax as hybrid storage materials on performances of solar still. Renew. Energy 132, 119–128. doi: 10.1016/j.renene.2018.07.147
Kumar, V., Kumar, A., Prakash, O., and Kaviti, A. (2015). Solar stills system design: a review. Renew. Sust. Energy Rev. 51, 153–182. doi: 10.1016/j.rser.2015.04.103
Li, Q., and Guo, Z. (2018). Fundamentals of icing and common strategies for designing biomimetic anti-icing surfaces. J. Mater. Chem. A 6, 13549–13581. doi: 10.1039/C8TA03259A
Mahian, O., Kianifar, A., Heris, S., Wen, D., Sahin, A., and Wongwises, S. (2017). Nanofluids effects on the evaporation rate in a solar still equipped with a heat exchanger. Nano Energy 36, 134–155. doi: 10.1016/j.nanoen.2017.04.025
Mechell, J. K., Lesikar, B. J., and Capareda, S. C. (2011). Performance characteristics of four solar still designs. applied engineering in agriculture. Appl. Eng. Agric. 27, 425–432. doi: 10.13031/2013.37069
Mushtaq, S. (2020). Charge transfer excitation processes in analytical glow discharges – a review. J. Anal. At. Spectrom. 35, 1814–1826. doi: 10.1039/D0JA00001A
Panchal, H. (2016). Use of thermal energy storage materials for enhancement in distillate output of solar still: a review. Renew. Sust. Energy Rev. 61, 86–96. doi: 10.1016/j.rser.2016.03.043
Rakib, M. A., Sasaki, J., Matsuda, H., and Fukunaga, M. (2019). Severe salinity contamination in drinking water and associated human health hazards increase migration risk in the southwestern coastal part of Bangladesh. J. Environ. Manage. 240, 238–248. doi: 10.1016/j.jenvman.2019.03.101
Sahota, L., and Tiwari, G. N. (2016). Effect of nanof1uids on the performance of passive double slope solar still: a comparative study using characteristic curve. Desalination 388, 9–21. doi: 10.1016/j.desal.2016.02.039
Stalder, A. F., Melchior, T., Müller, M., Sage, D., Blu, T., and Unser, M. (2010). Low-bond axisymmetric drop shape analysis for surface tension and contact angle measurements of sessile drops. Colloids Surf. 364, 72–81. doi: 10.1016/j.colsurfa.2010.04.040
Tan, S. H., Nguyen, N. T., Chua, Y. C., and Kang, T. G. (2010). Oxygen plasma treatment for reducing hydrophobicity of a sealed polydimethylsiloxane microchannel. Biomicrofluidics 4:32204. doi: 10.1063/1.3466882
van Wyk, S., van der Ham, A., Sascha, R., and Kersten, A. (2020). Analysis of the energy consumption of supercritical water desalination (SCWD). Desalination 474:114189. doi: 10.1016/j.desal.2019.114189
Vineis, P., Chan, Q., and Khan, A. (2011). Climate change impacts on water salinity and health. J. Epidemiol. Glob. Health 1, 5–10. doi: 10.1016/j.jegh.2011.09.001
Voutchkov, N. (2017). Pretreatment for Reverse Osmosis Desalination. 1st Edn. (Amsterdam: Elsevier Publications), 308.
Willard, H. H., Merrit, L., and Dean, J. A. (1974). Instrumental Methods of Analysis, 5th Edn. (New York, NY: D. Van Nostrand Company).
World Health Organization (WHO). (2011). Guidelines for Drinking Water Quality, 4th Edn. (Geneva: World Health Organization).
World Health Organization (WHO). (2017). Guidelines for Drinking Water Quality, Incorporating the First Addendum, 4th Edn. (Geneva: World Health Organization).
Yang, Y., Yang, X., Liang, L., Gao, Y., Cheng, H., Li, X., et al. (2019). Large-area graphene-nanomesh/carbon-nanotube hybrid membranes for ionic and molecular nanofiltration. Science 14, 1057–1962 doi: 10.1126/science.aau5321
Keywords: graphene, solar still, surface modification, spin coating, desalination
Citation: Baticados EJN, Capareda SC, Liu S and Akbulut M (2020) Advanced Solar Still Development: Improving Distilled Water Recovery and Purity via Graphene-Enhanced Surface Modifiers. Front. Environ. Sci. 8:531049. doi: 10.3389/fenvs.2020.531049
Received: 04 February 2020; Accepted: 10 September 2020;
Published: 26 October 2020.
Edited by:
C. P. Huang, University of Delaware, United StatesReviewed by:
Zacharias Frontistis, University of Western Macedonia, GreeceSajjad Khezrianjoo, Malayer University, Iran
Copyright © 2020 Baticados, Capareda, Liu and Akbulut. This is an open-access article distributed under the terms of the Creative Commons Attribution License (CC BY). The use, distribution or reproduction in other forums is permitted, provided the original author(s) and the copyright owner(s) are credited and that the original publication in this journal is cited, in accordance with accepted academic practice. No use, distribution or reproduction is permitted which does not comply with these terms.
*Correspondence: El Jirie N. Baticados, ZWpuYmF0aWNhZG9zQHRhbXUuZWR1