 Nancy Job
 D. J. Roux
 H. Bezuidenhout4,5
 N. S. Cole
94% of researchers rate our articles as excellent or good
Learn more about the work of our research integrity team to safeguard the quality of each article we publish.
Find out more
ORIGINAL RESEARCH article
Front. Environ. Sci. , 21 May 2020
Sec. Freshwater Science
Volume 8 - 2020 | https://doi.org/10.3389/fenvs.2020.00049
This article is part of the Research Topic Towards the Sustainable Use of African Wetlands View all 14 articles
Given limited time, staffing and specialist expertise, management of wetlands within biodiversity-rich protected areas of developing countries is often held back by a lack of information on the extent and nature of wetland resources. Rapid, realistic and effective wetland ecosystem assessment methods are needed to develop a baseline for monitoring that detects trends and guides management. For our case study national park, lack of available in-house wetland expertise stimulated a novel team approach to harness wide-ranging complementary and, ultimately, indispensable expertise, spanning several branches of the national park agency: park management and rangers, scientific services, and a unit responsible for invasive alien plant control and landscape restoration. Within a year, the team developed a sufficiently comprehensive inventory which captured the variation of wetlands present in Mountain Zebra National Park, South Africa. A total of 267 features were mapped, while 62 were visited in the field and assessed through rapid verification. Careful collation of existing data and imagery informed a catchment approach, an emphasis on wetland-landscape connectivity, and strategic targeting of a sub-set of important and representative sites deserving of targeted field assessment. The remaining wetlands not visited in the field were subject to geographic information system image interpretation. Overall, this resulted in a comprehensive overview assessment of the entire Park at multiple scales. The participatory approach followed here promotes integration of the findings of the study into park planning, management and rehabilitation. The process provides a potential template for scaling and adapting to similar work in other parks and other areas that have limited funding and capacity.
The mapping, classification, and description of wetlands and their associated biotic and abiotic features are vital steps in building a framework to understand, manage, rehabilitate and conserve these ecosystems (Finlayson and van der Valk, 1995; Finlayson et al., 1998; Zedler, 2000; SANParks, 2016). In developing countries, including within their biodiversity-rich protected areas, effective management of wetlands is hampered by a lack of information on the extent and nature of these ecosystems. In these countries, most nature reserve and national park management agencies have limited resources, including specialist expertise. This is also the case in the agencies mandated to support conservation at provincial and national level. For example, in South Africa only one out of nine provincial conservation agencies was found to support an adequate complement of dedicated aquatic scientists (Impson, 2016), and most institutions are experiencing declining funds (Van Deventer et al., 2019). Furthermore, wetland specialization is a relatively recent field of practice in South Africa so that, even where aquatic scientists are present, their expertise often does not include experience of wetlands. Also, wetlands are at the transition between terrestrial and aquatic habitats, and multi-disciplinary expertise is required to comprehensively assess and manage these systems.
In South Africa, assessment and management of wetlands is enabled and guided by three national-scale developments. First, the country has adopted a freshwater conservation target stating that at least 20% of each inland aquatic ecosystem type should be conserved (Roux et al., 2006). Second, classification and spatial mapping of wetlands made the extent of these ecosystems explicit (Ollis et al., 2013; Van Deventer et al., 2018, 2019). Third, a national planning exercise was conducted to identify strategic spatial priority areas for satisfying the 20% target. This resulted in 38% of South Africa’s wetland areas being identified as Freshwater Ecosystem Priority Areas (FEPAs; Nel et al., 2011).
Notwithstanding the above advances, national-scale target setting and assessments do not automatically translate into local-scale implementation (Roux et al., 2016). Wetland validation and verification, and the involvement of wetland scientists and local managers, are essential but often overlooked. National-scale data, especially when derived from modeling or remote sensing, as was the case for South Africa’s dataset, must be validated at scales relevant to management (Gouws et al., 2012; Mbona et al., 2015). At these scales, rapid and realistic wetland ecosystem assessment methods are needed to develop a wetland baseline, with comprehensive information about their distribution and with sufficiently accurate detail to allow management actions to be implemented.
Here we present an approach to map wetlands and validate national-scale wetland priorities (FEPAs) at the scale of a protected area, focusing on a national park as a case study. Although Mountain Zebra National Park (MZNP) is one of the smallest of South Africa’s national parks (20,243 ha), it has all the features to exemplify what is involved in undertaking a wetland inventory, with limited resources. We present an overview of the approach and results of, to the best of our knowledge, the first wetland inventory for a national park in South Africa. Our approach includes wetland boundary delineation, wetland type classification and a preliminary wetland condition assessment. This involved a combination of office and field work, and the collaboration of a multidisciplinary team, including managers and field rangers. A key feature of the approach was identification of sub-catchments for the park and subsequent grouping and presentation of information associated with each sub-catchment. The inventory is presented as a geographic information system (GIS) data set and a report with maps to inform decision-making and provide a baseline for future monitoring, trends analysis and management of key issues. The step-by-step process could serve as a ‘manual’ for doing similar work in other protected areas.
Mountain Zebra National Park is one of the 19 national parks managed by South African National Parks (SANParks). It is situated in the Eastern Cape interior (Figure 1), extending northwards from the slopes of the Bankberg mountain range. The park ranges in altitude from 911 to 1,953 m amsl. The northern area of the park is located on a relatively undulating plateau, with moderate increases in altitude in an outwards direction to approximately 1,300 m.a.s.l. The altitude and topography of the park increase dramatically to the south, varying between 1,300 and 1,953 m.a.s.l, with a number of deeply incised river valleys (kloofs). Recorded average annual rainfall is 405 mm, and average daily temperatures range between 23.1 and 28.4°C in summer (September–March) and 16.2–22.7°C in winter (April–August) (Brown and Bezuidenhout, 2018). Minimum average temperature is 5.6°C in summer and 3.9°C in winter (Brown and Bezuidenhout, 2018). The southern mountainous peaks are exposed to frequent cloud cover and extreme temperature and moisture regimes, with local climate variations resulting in a number of microhabitats. The Bankberg forms a barrier to cold winter fronts, thus, a warmer climate is experienced in the sheltered valley below it, whilst frost and regular snowfall occurs on higher lying areas (Pond et al., 2002). Mucina et al. (2006) characterize the area as Karoo Escarpment Grassland (Gh1) and Eastern Cape Escarpment Thicket (AT13) vegetation types, within the Upper Karoo Bioregion. Bezuidenhout et al. (2015) have classified, mapped and described 13 plant communities for MZNP. They group these into three major landscapes, namely, mountain highlands rugged landscape; middle plateau rolling landscape; and valley bottomland undulating plains landscape (Supplementary Figure S1).
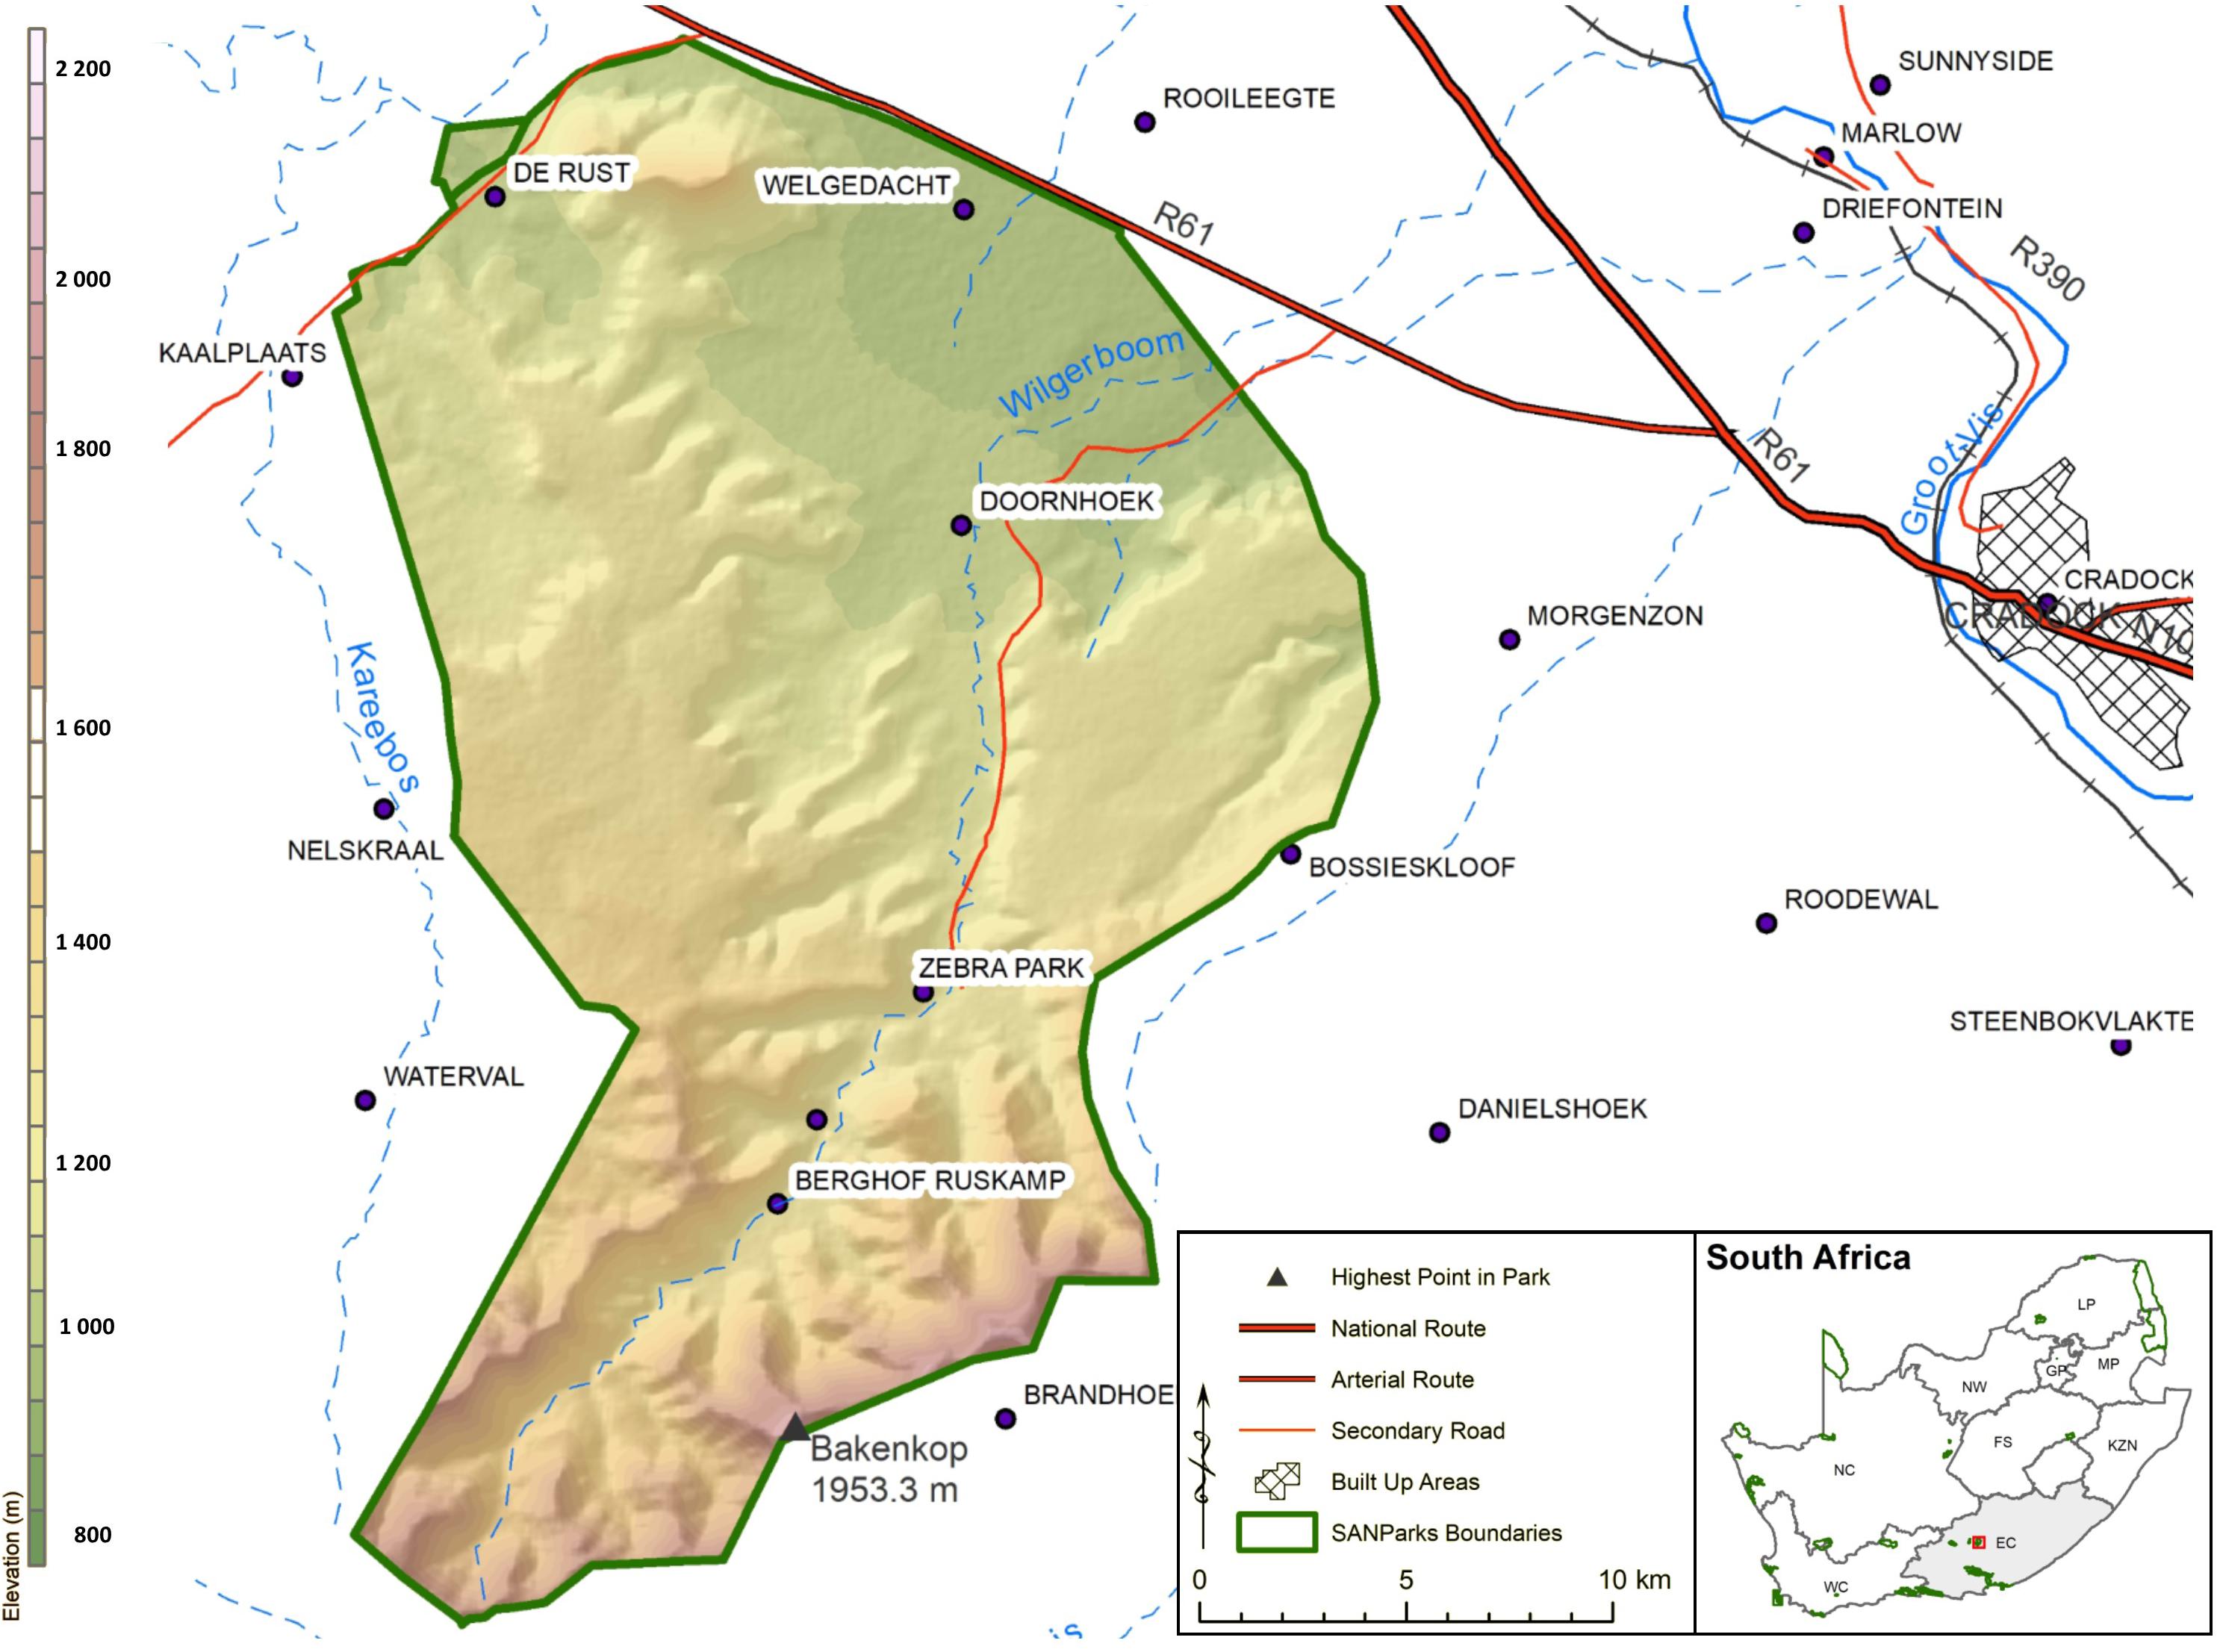
Figure 1. Location of Mountain Zebra National Park.
Mountain Zebra National Park was proclaimed in 1937 for the purpose of protecting a remnant population of the Cape mountain zebra (Van Riet, 1977; Van der Walt, 1980). To make the park both ecologically and financially more viable, it was expanded in the late 1990s from 6,536 to 20,243 ha through incorporating private land. This expanded the scope of MZNP from being a “species park” to also conserving the biodiversity of the region, including charismatic species such as cheetah, brown hyena, Cape buffalo and lion, and a diverse range of ecosystems and landscapes (SANParks, 2016).
Water Management Areas (WMA) have been defined in the South African National Water Act (Act 36 of 1988) and delineated throughout South Africa as primary units for catchment management. These areas are extensive and encompass many main stem rivers and thousands of tributary streams. Mountain Zebra National Park falls within the Fish to Tsitsikamma WMA and Fish sub-WMA. Sub-WMAs are further sub-divided into quaternary catchments (average area of 20,000 ha or more, Table 1), and, in 2011, a finer sub-division of quaternary catchments was undertaken producing quinary catchments as part of the NFEPA project (Nel et al., 2011; Table 1 and Figure 2). Quinary catchments in MZNP range between 15,000 and 4,500 ha (Table 1) and where necessary, 2 or 3 are grouped together to represent the contributing area for only one river or stream per group, which makes them best suited for hydrological management at a local scale. Although these management units exist in the country, it is rare, nation-wide, for managers to organize their management holistically according to sub-catchments. Applying the quinary catchment as the base unit for the wetland assessment strongly links the wetland to its associated terrestrial catchment landscape, where many processes driving wetland hydrology are initiated. It also develops a feel for the catchment landscape, especially of the variation in wetland types present, and allows impacts to be identified and contextualized at a catchment scale, so that relationships may be better understood.
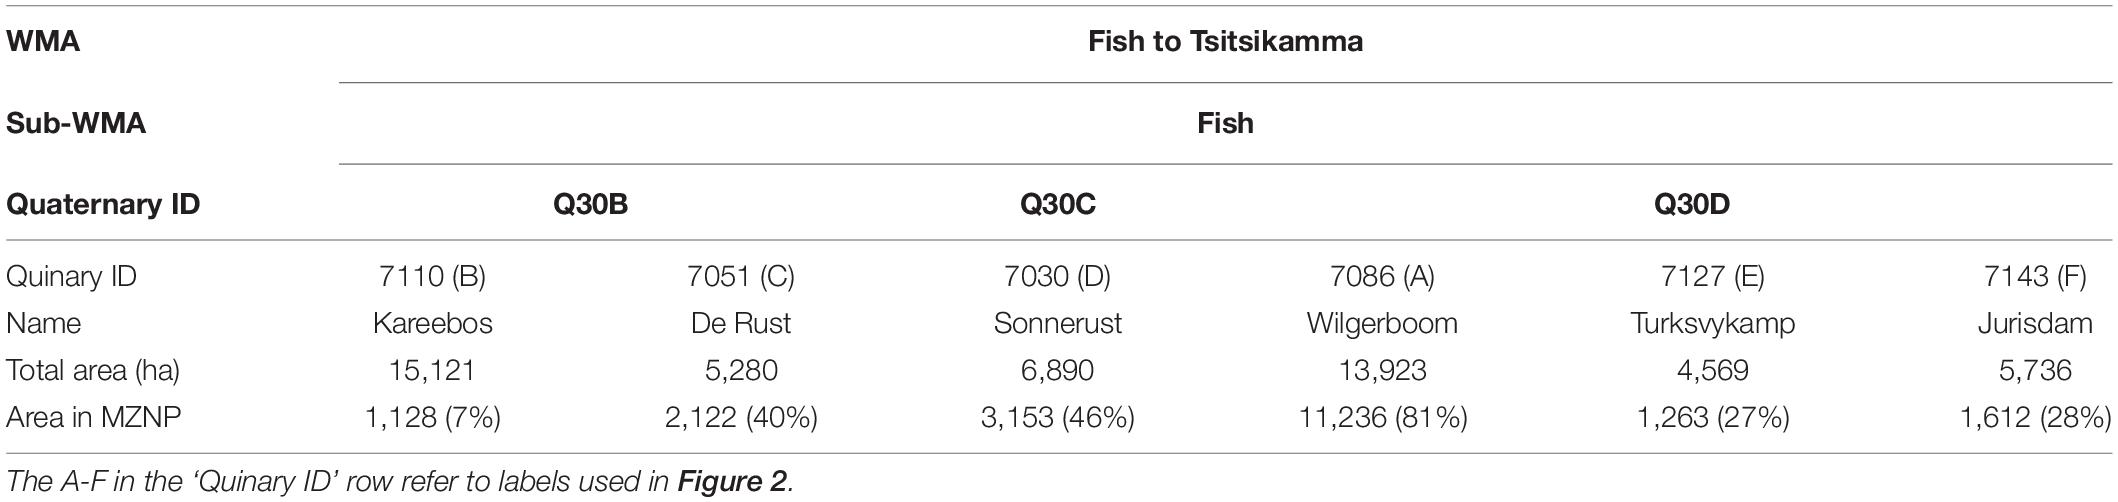
Table 1. Mountain Zebra National Park catchments.
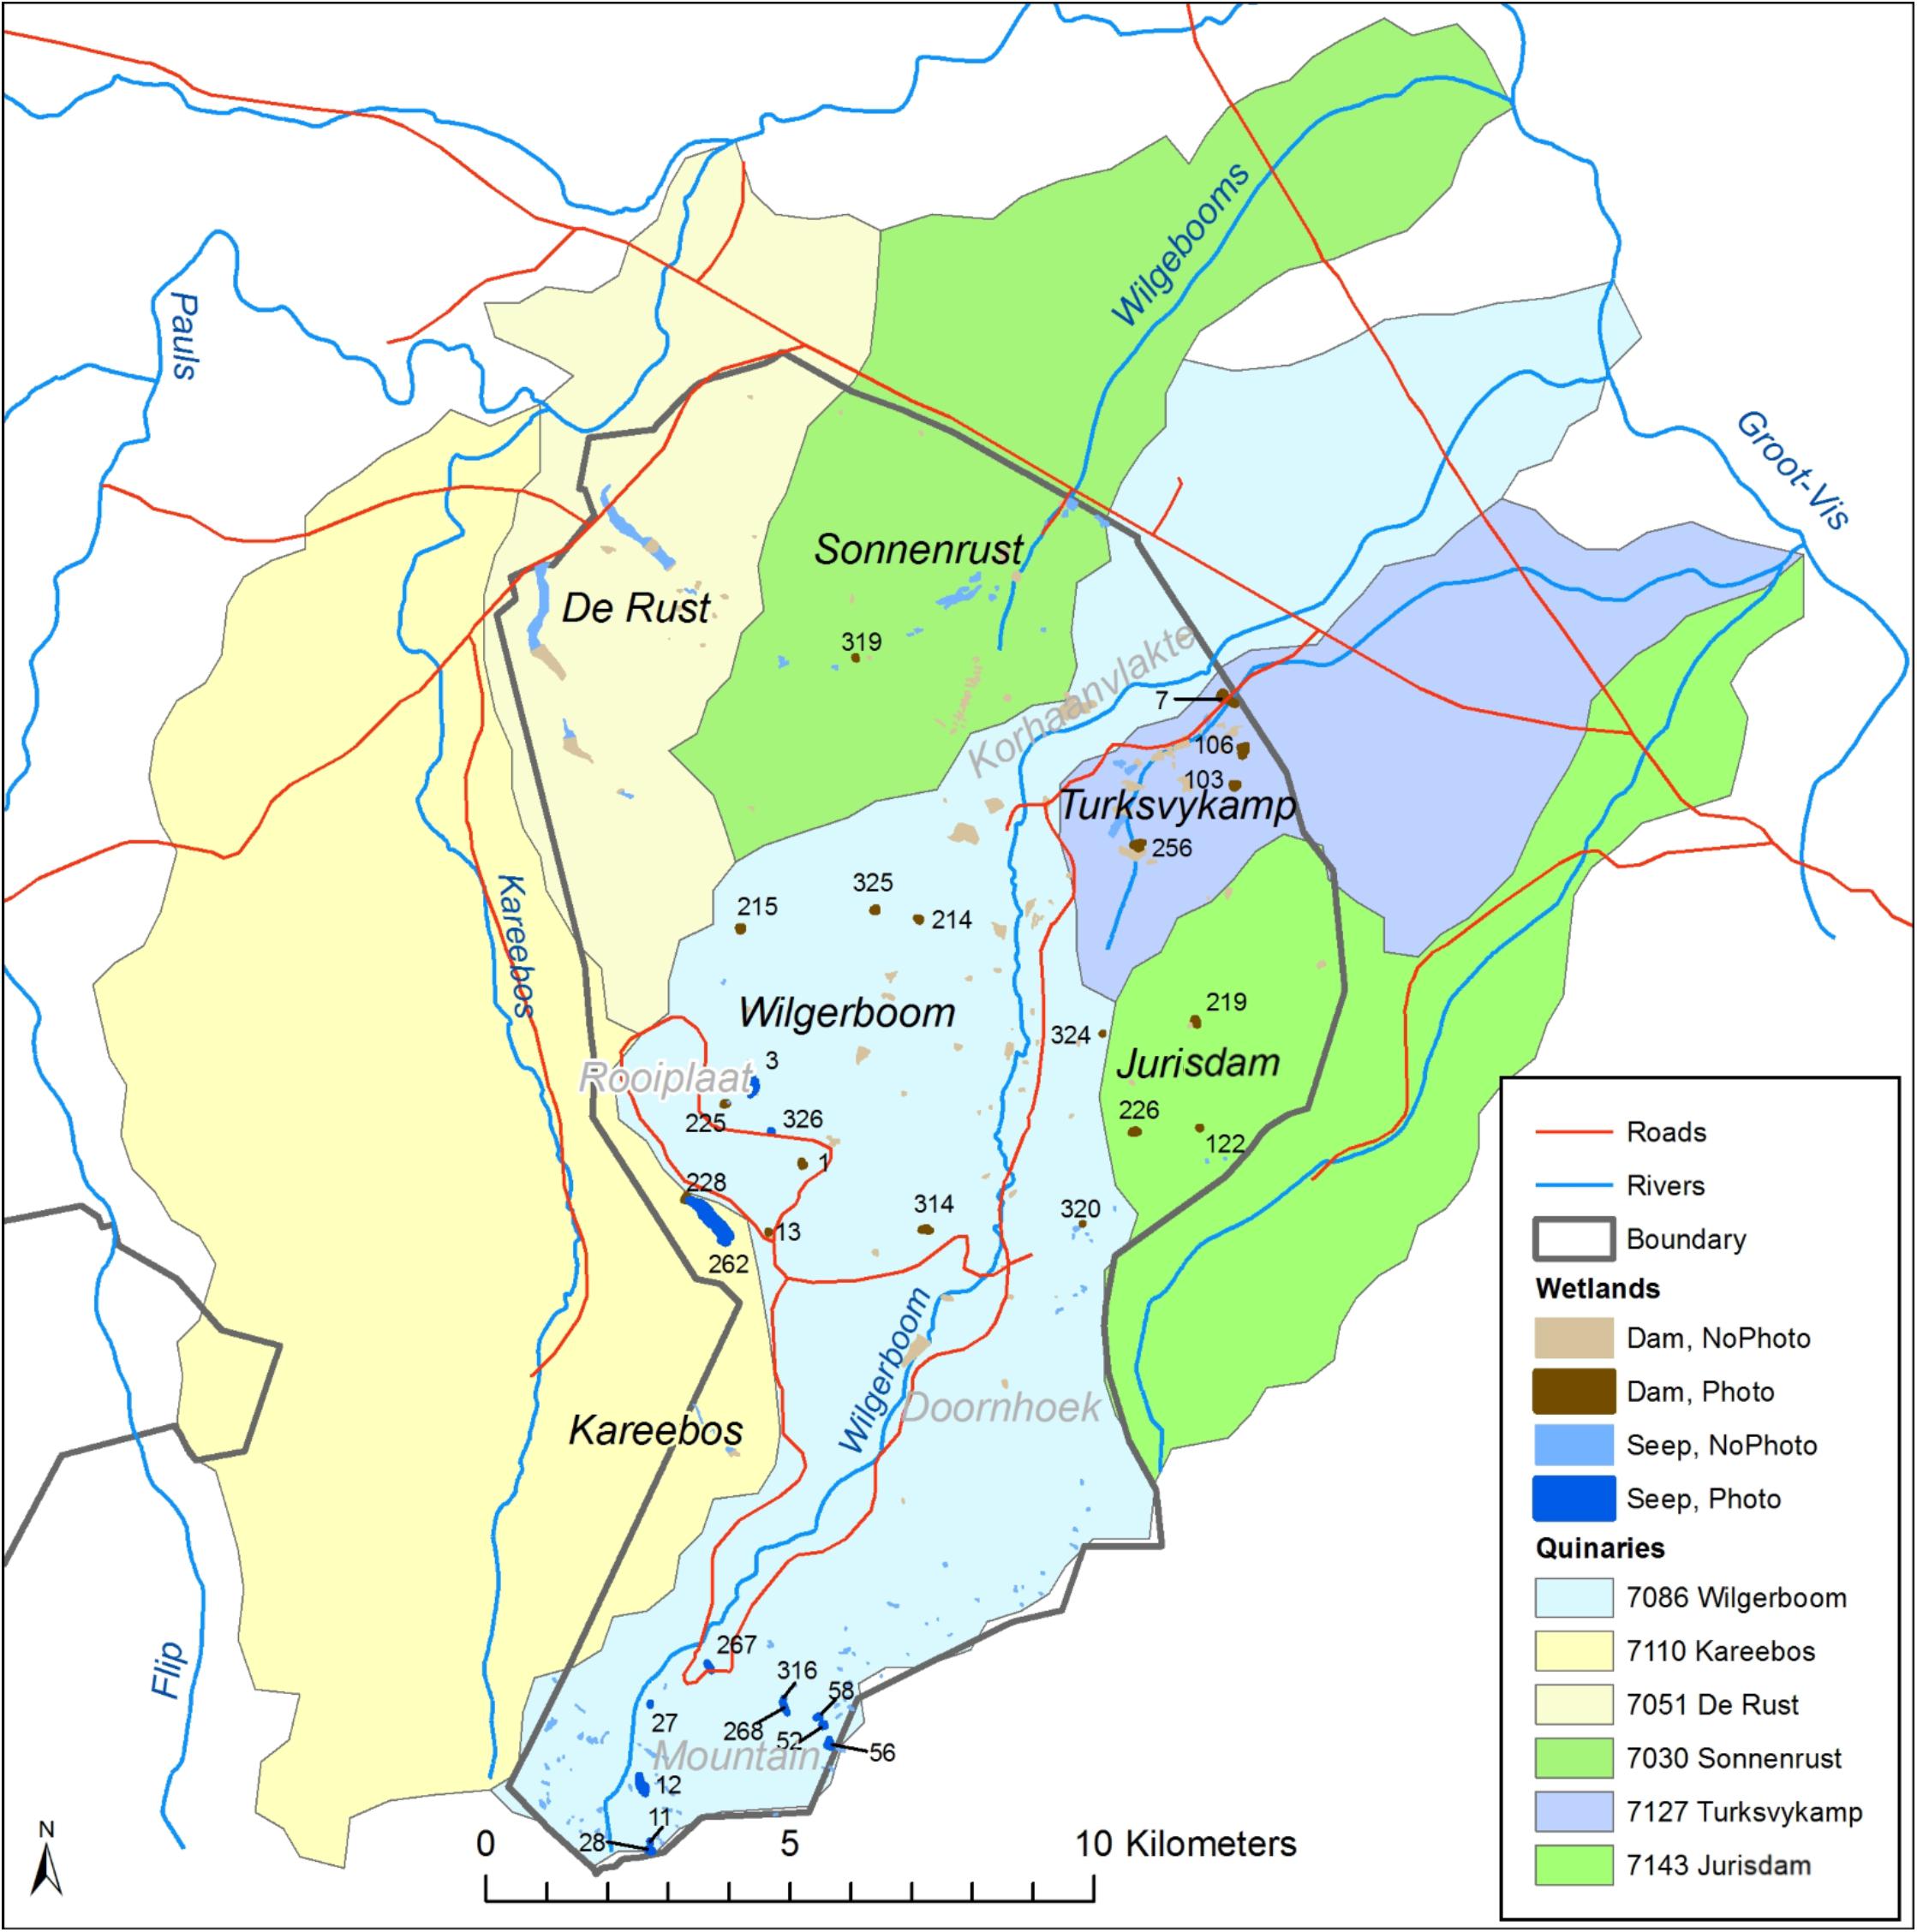
Figure 2. Mountain Zebra National Park sub-catchments.
The practice of wetland science is multi-disciplinary, encompassing but not limited to: GIS, soil science, vegetation ecology, hydrology, and aquatic science. South African National Parks supports most of these skills within their Conservation Services Department, but a focus on inland wetlands was a relatively new area of exploration for this agency. The process of developing a wetland inventory for MZNP, therefore, involved development of wetland-specific understanding and sharing of knowledge across multiple sets of expertise. One external wetland specialist and more than 15 SANParks staff including park management and rangers, scientific services and a unit responsible for invasive alien plant control and landscape restoration, participated in and contributed to the inventory. Apart from assembling an in-house team able to undertake wetland inventory, a further goal was to facilitate appreciation of wetlands as biodiversity features, and an understanding of their ecological functions and sensitivities. In this regard, it was considered vital to include additional park staff, such as rangers and park managers, from the outset, not only once there was a completed product. This allowed their extensive knowledge of the Park and landscape processes to be incorporated into the wetland assessment.
Steps 1 to 9 are in visualised in Figure 3. Step 1. Compile existing (secondary) data relevant to the study area. Data was compiled as comprehensively as possible from multiple sources, to capture and build upon existing information and knowledge, scanning for any mention of rivers, wetlands, riparian habitat, dams, or water. Table 2 lists information supporting the GIS interpretation and illustrates the multiple useful ways data was contributed and verified by park staff over time through their various work programs, none of which were primarily focused on wetlands. In MZNP, the recent park-wide description and mapping of vegetation and habitat landscape units was a significant input (Bezuidenhout et al., 2015; Table 3 and Supplementary Figure S1).
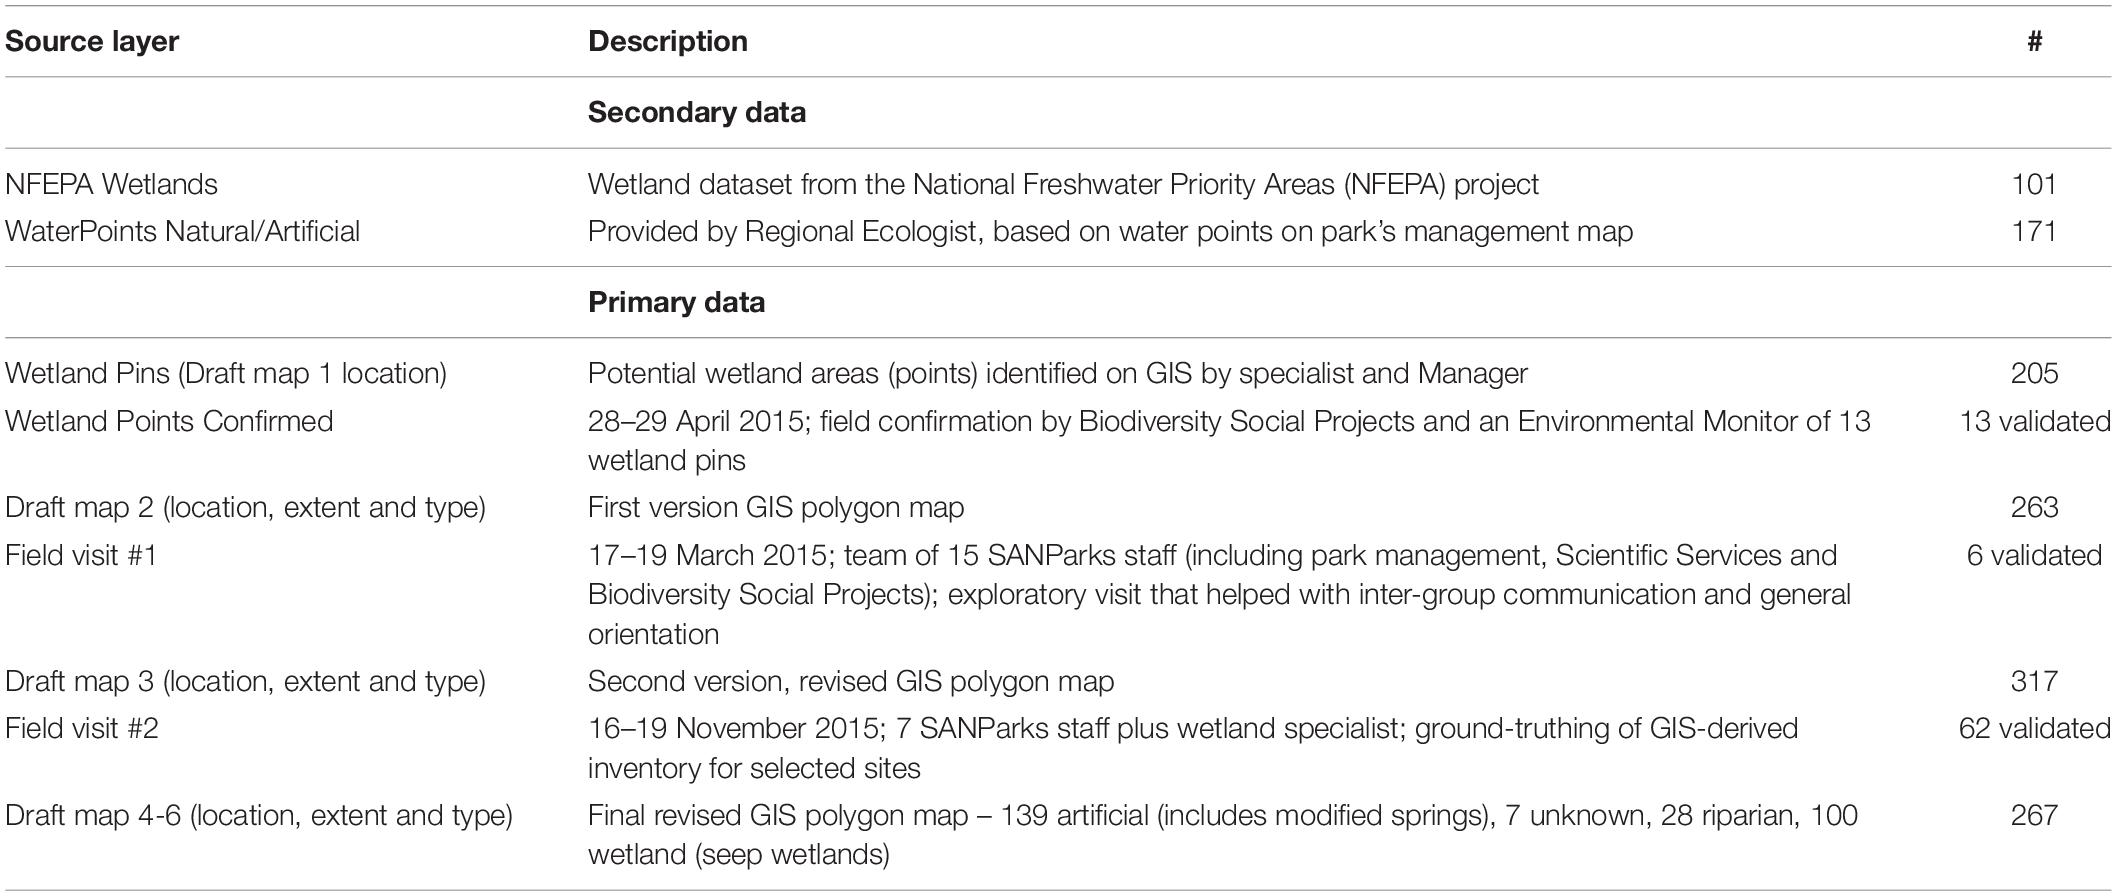
Table 2. Data sources informing the final wetland map of MZNP.
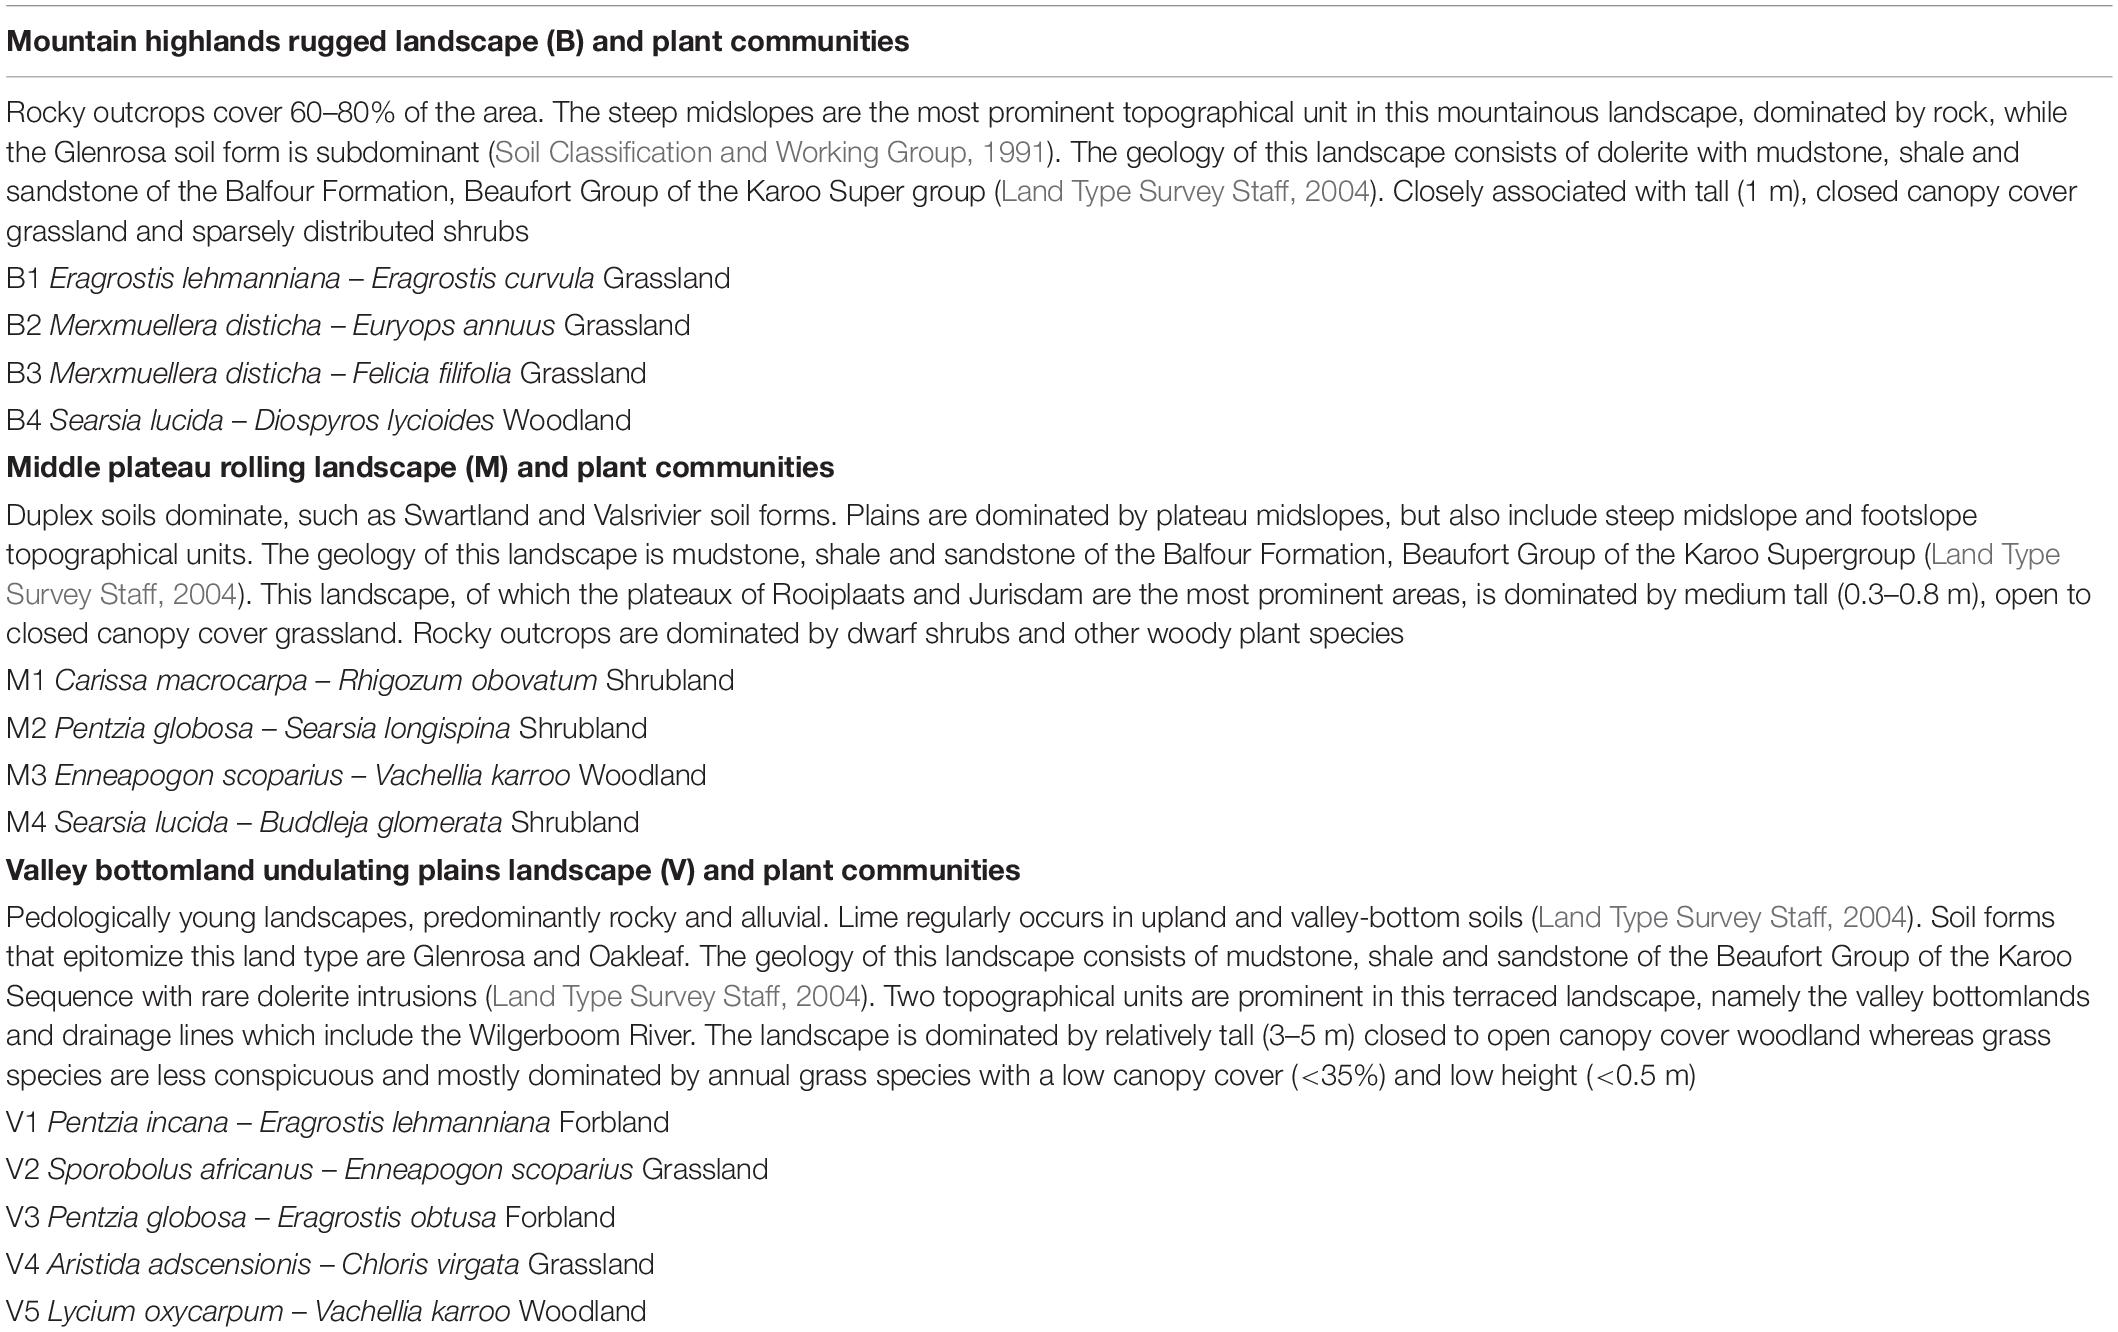
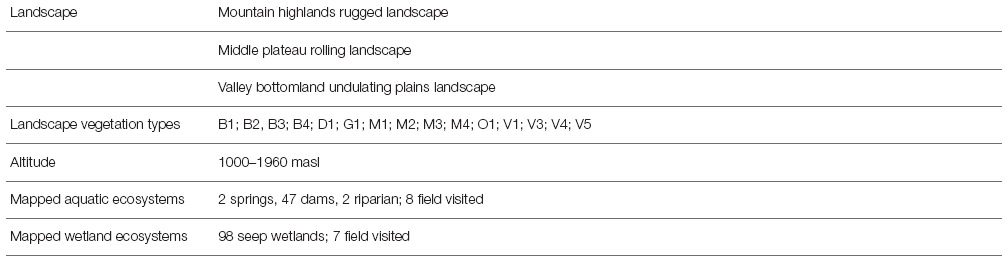
Table 3. Summary of landscape and plant communities of MZNP (Bezuidenhout et al., 2015).
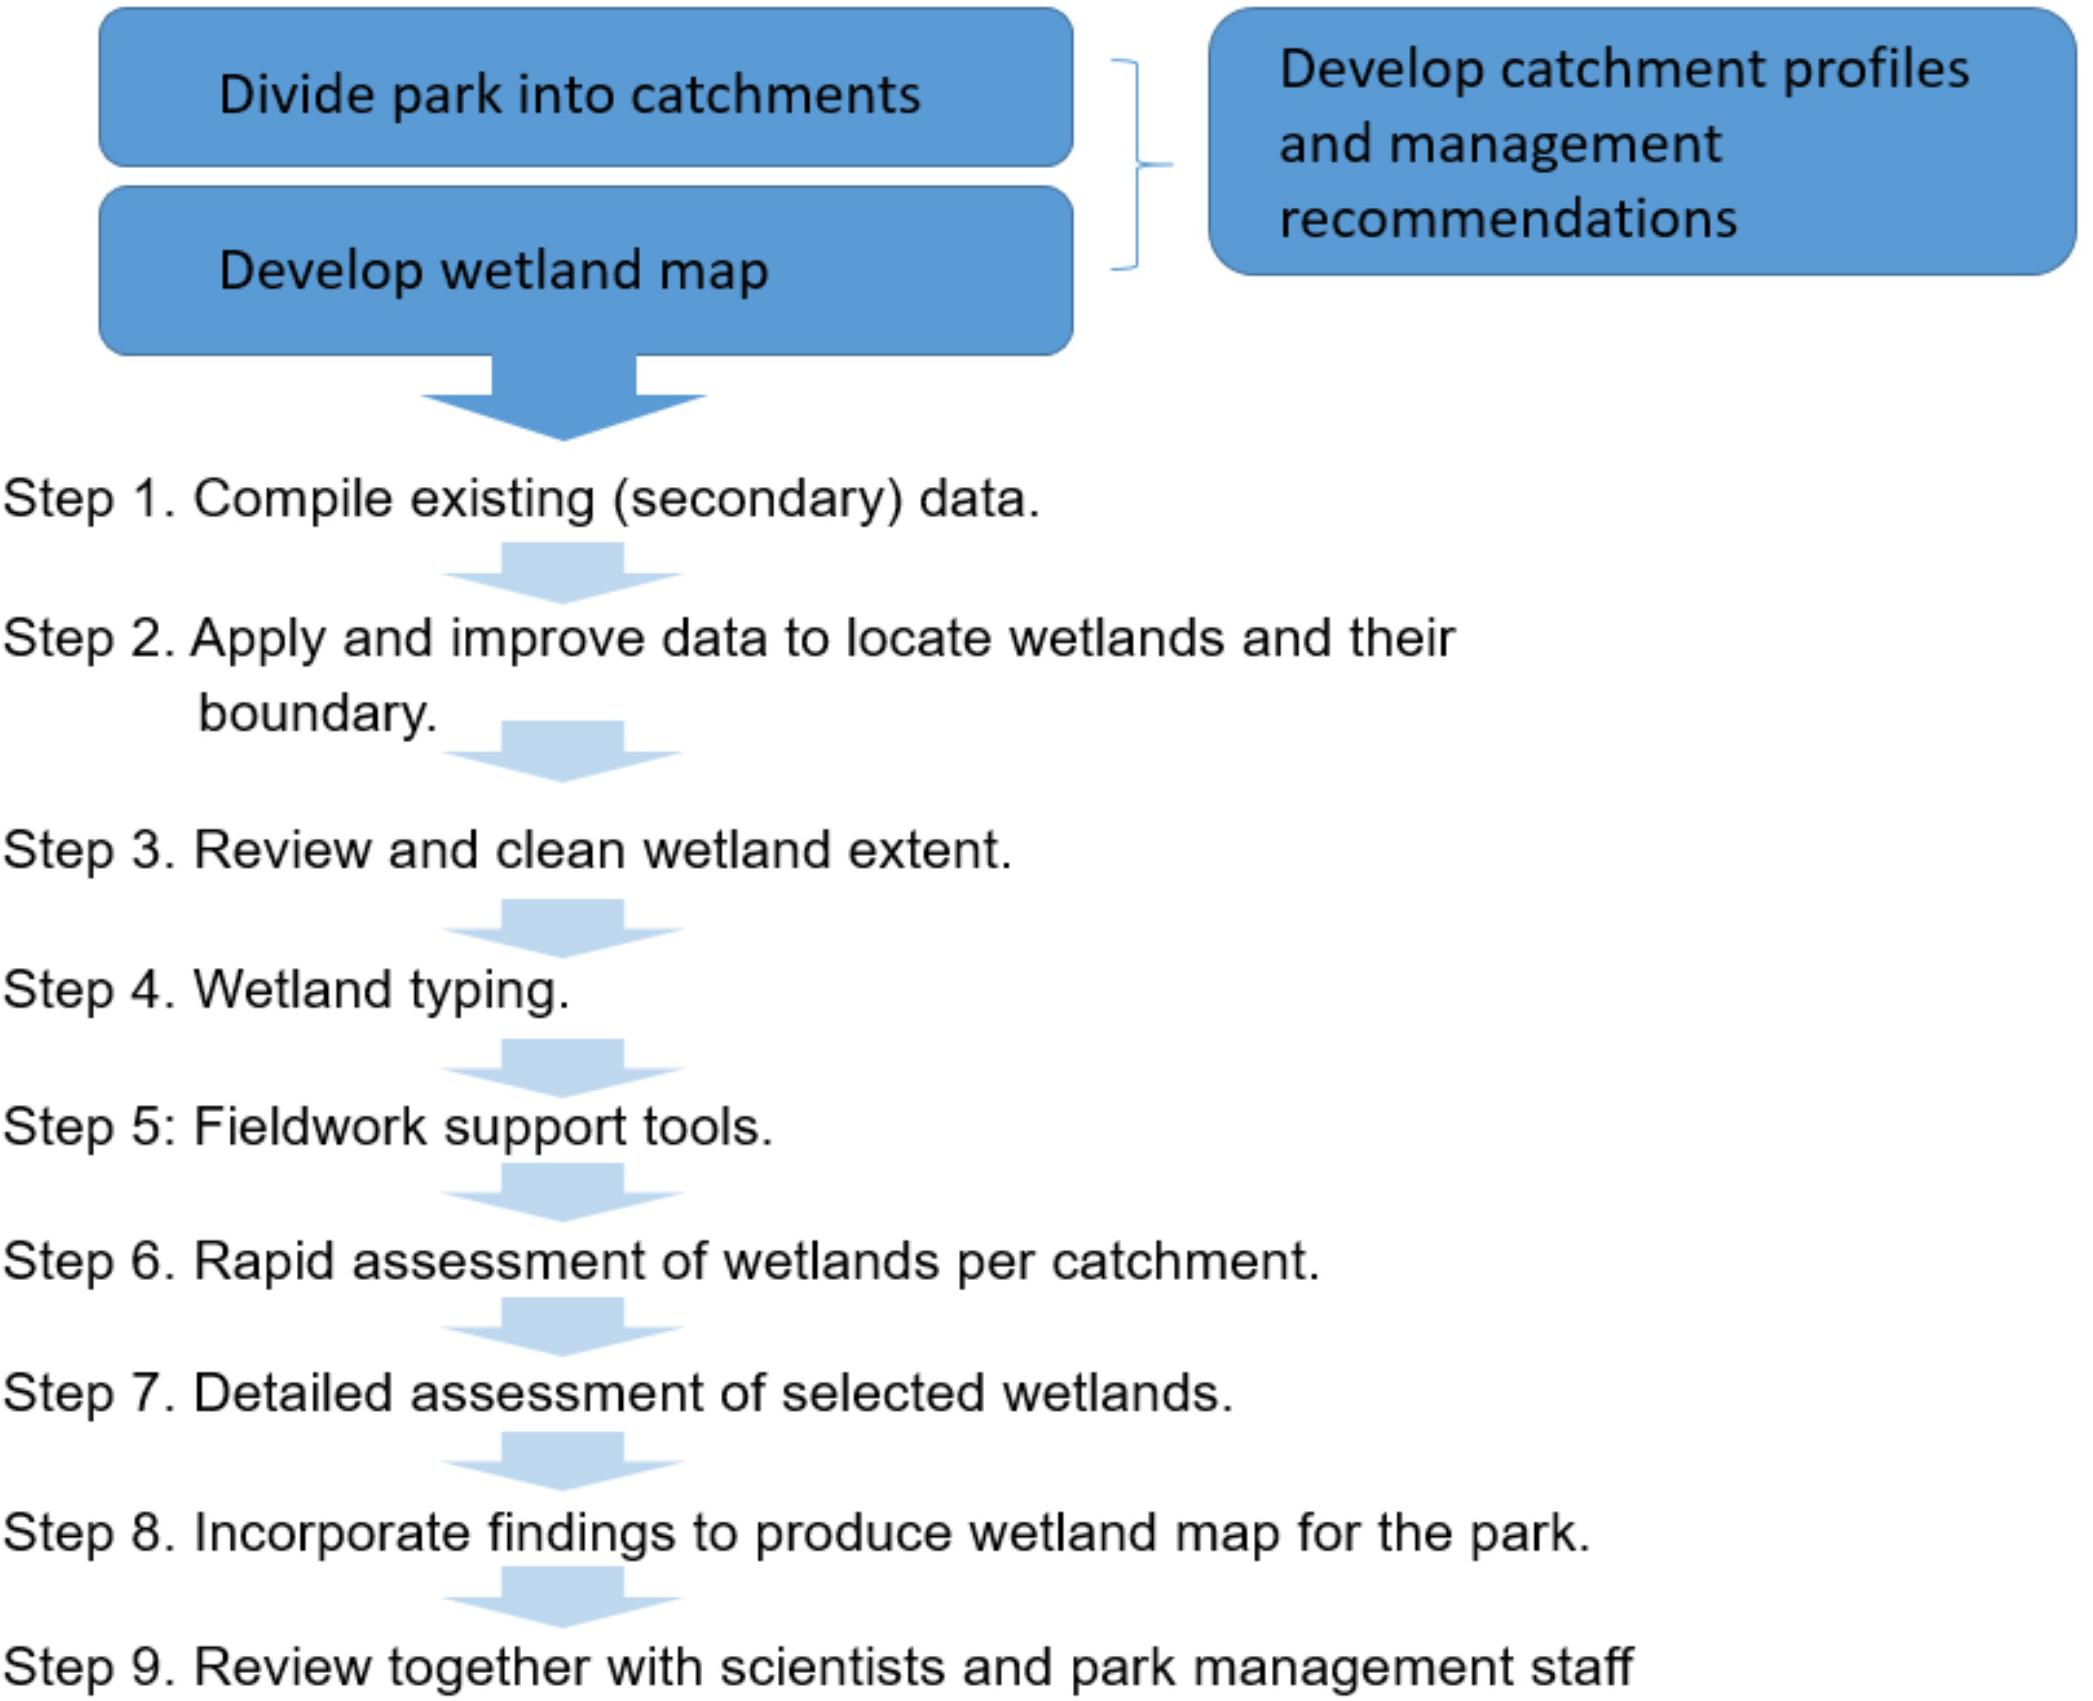
Figure 3. Flow diagram of wetland inventory approach.
Step 2. Apply and improve data to locate wetlands and their boundary. The information collated from park staff was collected as point data (latitude and longitude location data, visualized as points in GIS) and required an extra step to turn it into spatial data, that is, a map of the wetland area. Thus, a first review and improvement of wetland location and boundary accuracy of collated wetland mapping information was undertaken, and additional wetlands were then identified through aerial image interpretation and mapping in GIS. This was undertaken in ArcMap 10.3 and Quantum GIS (QGIS) using a combination of SPOT 5 imagery, Google Earth satellite imagery, 1: 10,000 aerial images, a digital elevation model prepared for MZNP, and 20 m contour and 1:50,000 river lines both obtained from the Chief Directorate: Survey and Mapping. The 1:50,000 rivers and contours layers help identify stream lines and landscape locations where potential wetlands are typically located. Wetlands were digitized at different scales, depending on their visibility and size. The optimal scale (being able to zoom in as far as possible without the image being blurry) ranged between 1: 2,000 and 1: 3,000. This scale range is most useful to locate and identify a wetland and its type. However, digitizing the final wetland boundary required one to zoom in as close as 1: 400.
Step 3. Review and clean data. This step focused on a review of the mapped boundaries over aerial imagery, to ensure none were artificial, as most dams could be recognized through GIS image interpretation. All dams (artificially altered wetlands, as well as dams created in historical non-wetland areas) were identified through GIS image interpretation prior to going in the field, to focus the field time on natural systems. This allowed for potential wetlands in the remoter areas of the park to be identified for further investigation, as well as preparing fieldtrips more effectively.
Step 4. Wetland typing. Typing of freshwater ecosystems according to broadly similar hydrologic processes (the way in which water moves into, through and out of the wetland systems) and geomorphic factors (such as the position of the wetland in the landscape, landscape shape and likely associated active processes) for this study followed the hydrogeomorphic (HGM) classification developed for South Africa by Ollis et al. (2013), adapted from Brinson (1993). These wetland HGM types include floodplain, channeled and unchannelled valley-bottom wetlands, seeps, depressions, and wetland flats. Creating a digital elevation model in GIS and assigning of certain attributes to the wetlands such as slope (e.g., seep wetlands), landscape position and shape (e.g., depression wetlands in closed contour areas) assisted with GIS image interpretation and supported preliminary allocation of wetland HGM type on GIS ahead of going into the field.
Step 5: Fieldwork supporting tools. A mapbook was created with a reference map for orientation and overview of the full study area. The overview map was overlain with grids, each grid labelled with a unique id. Detailed “zoomed in” maps were prepared and printed out for in-field use, one for each grid. A field datasheet was prepared and printed out for hand-written note-taking in the field. The field team also tested the utility of different mobile devices, including iPads, cell phones, and a variety of hand-held GPS devices including Trimble Juno 3B. ESRI’s ArcMap10x was used to create maps and ArcGIS Collector used to develop sequences for infield data collection. The set-up of predetermined coded values to choose from ensured the data capturer adhered to pre-determined naming conventions. These were loaded onto those handheld devices running Arcpad or ArcGIS Mobile Software.
Step 6. Rapid assessment of entire catchment. For MZNP, the aim of achieving a comprehensive inventory with limited budget and time was achieved in the field component through a combination of detailed field assessment (high confidence results) for select, representative, wetlands and rapid assessment (moderate to high confidence results) for as many more wetlands as it was possible to view within a two or three-day field trip (between 16 and 18 November 2015). The efficiency with which wetlands were visited and assessed benefited from the participation of rangers with long-term and extensive field experience of the park. In order to cover large areas of the park, and taking into consideration the relative homogeneity within wetland and across wetland types in the park, the rapid assessment was preferred for the majority of field work, including a rapid walk through, or in some cases, a drive past, and recording of key wetland characteristics. This included checking wetland presence and key characteristics or the presence of an artificial system against the hardcopy map, and capturing data into handheld GPS’s. The rapid assessment was conducted in a catchment at a time as much as the road network and other access would allow. Having the already prepared maps and other handheld tools with annotations of wetland type and other characteristics greatly facilitated the rapid survey, allowing validation, as well as new additional information to be collected, and allowing ground to be covered more rapidly.
Step 7. Detailed assessment of selected sites. A more detailed assessment was applied to a sub-set of wetlands considered to be representative of the wetland types present as identified during the GIS image interpretation. This involved an assessment of the entire wetland, noting vegetation, soil and hydrology characteristics. The goal was a species list, as well as identification of dominant or indicator species, and a description of soil and hydrology per habitat unit or zone if there were multiple. The approach to assessing wetland condition followed that of WET-Health (Macfarlane et al., 2009) and included assigning a wetland impact score on a scale of 0 (unimpacted) to 10 (critically altered) based on estimated change from the historical natural condition. There are many, complex factors which affect wetland condition, not all of which may be visible during a once-off field visit, particularly where only a part of the wetland is visited. For this reason, the field datasheet stipulated only a sub-set of specific issues for the rapidly assessment, to allow results to be nationally consistent. This focused on two wetland components, namely hydrology and vegetation.
Step 8. Incorporate findings and adjust mapping on GIS. The high confidence site assessments and understanding gained from the field trip informed GIS extrapolation of information to any areas missed in the remainder of each sub-catchment, especially for inaccessible areas. This led to adjustments of wetland spatial extent and designation of wetland HGM types, and the deleting of a number of polygons. The final set of GIS attributes for each of the mapped wetlands were assigned High, Moderate or Low levels of confidence. The confidence score was applied separately to wetland HGM type as well as spatial boundary. High confidence status was afforded to mapped wetlands that were ground-truthed and reviewed by the team. Moderate confidence wetlands were reviewed by the team, but not ground-truthed. Low confidence wetlands were mapped at a GIS image interpretation level, but not ground-truthed, implying uncertainty and a need to investigate further. Managers and other park staff were consulted for their insights during this stage, and to discuss monitoring and management needs.
The wetland inventory of MZNP emerged from several cycles of GIS image interpretation mapping, followed by selected field investigations, and extensive GIS image interpretation follow-ups. First was an investment in GIS preparation and data collation, aiming to comprehensively cover the study area and to delineate sub-catchments, amounting to approximately 40% of project time. Secondly, a combination of field ground-truthing of questions arising from GIS preparation and selected wetlands representing the anticipated different types in each catchment of the study area, as well as a more rapid visit through the remainder of each catchment amounted to approximately 20% of project time. Finally, GIS image interpretation follow-up to consolidate and apply the findings to the full study area and review the findings amongst the team members, other experts and managers. This amounted to approximately 40% of project time.
Step 9. Review together with colleagues and managers, supported by new map products.
The two key informant secondary datasets for wetland location during Step 1 were the national (NFEPA) dataset and the dataset of water points for game. Our review of the 101 national (NFEPA) mapped wetland features found that 49 of these polygons were non-wetland and 52 were artificial (dams). These findings were validated in the field during Step 6. Thus no natural wetlands were mapped by the national-scale NFEPA wetland layer for MZNP. The water point dataset added a further 119 points, to a total of 171.
The first, and all subsequent, rounds of mapping for MZNP undertaken during Steps 2–5, and Step 8, were spatially comprehensive, with a view to covering the entire park. During the first round of GIS imagery interpretation and digitizing (Step 2), 34 new wetlands were mapped (Table 2, GIS map 1 total of 205). Wetland location mapping in GIS was reviewed several times, with 58 new wetlands mapped in draft 2 (Table 2, GIS map 2, total of 263) and 54 in draft 3. This amounted to 317 polygons mapped prior to field validation.
During Steps 6 and 7 (field validation), several mapped features were confirmed during the field visit to be artificial (dams, quarries, watering troughs, reservoirs) bringing the total number of dams and water points to 139, 50 mapped features were deleted once it was confirmed in the field they were neither wetland nor dam, 28 were assigned to be stream channel or riparian areas and 7 were designated “unknown” due to inaccessibility. Only 100 were validated or extrapolated to be natural seep wetlands (Figure 2), ranging in size from 2 ha to approximately 0.06 ha. The 100 seep wetlands cover a total area of 261 ha or 1.2% of the surface area of MZNP. Representative photographs of the range of freshwater ecosystems within MZNP are included in Supplementary Plate 1.
There was a significant learning and, hence, change in the type and number of wetland HGM types mapped during the first and second GIS image interpretation exercises, for example two seeps were mapped in the first round and this was amended to 100 in the final count. This was based on feedback from the rapid field visit and review with the field team, including a wetland ecologist.
Box 1. Wilgerboom sub-catchment profile.
Catchment characteristics: The sub-catchment was divided into an upper (Mountain), middle (Doornhoek) and lower (Korhaanvlakte) section, due to noticeably different plant communities and moisture regimes with different management requirements. Evidence of the fractured nature of the rock and flows of water from the rock can be seen in the prevalent white streaking on many outcrops and areas of surface bedrock, evidence of calcium carbonate due to water that has moved through the lenses of limestone said to be present within the sandstone (Toerien, 1972). Shelves of protruding sandstone are evident in the upper catchment. Wetland characteristics: The 98 mapped seep wetlands occur exclusively within the higher altitude, mountainous areas of the park, associated with higher rainfall. Seep wetlands are typically dominated by subsurface flows which generate saturated soils, with limited to no ponded water on the wetland surface. The seep wetlands can be broadly grouped into those forming on the high-lying rocky shelves, and those on long side slopes below the outcrops. These rocky outcrops act as a geological control, giving rise to several small pockets of wetland upslope of the shelf, described elsewhere by Le Roux et al. (2015). There is a notable prevalence of springs, resulting from the prevailing geology. The wetlands support a diverse range of sedges and herbaceous species, including Eleocharis dregeanus, Juncus oxycarpus, Juncus capensis, Mentha longifolia, Lobelia erinus, Juncus effuses, Crassula natans. The slope is moderate to steep. Wetland soils are relatively shallow (<0.3–0.5 m) and the water ponds on bedrock leading these wetlands to be permanently saturated, evidenced by the presence of gray to gley colored soil with high clay-content (>30%).
The long slopes within the mid-section of the Wilgerboom catchment support a second type of seep which is typically seasonally saturated and is located below the high-lying rocky outcrops, often extending down to the stream valley. These wetlands receive their water via a different mechanism to those on the bedrock shelves, rather the water flows laterally as shallow interflow within soils which overlie less permeable horizons horizons (e.g., sandier soils over soils with higher clay content) within the surrounding hillslope duplex soils and also with a second, deeper flow path at the interface of the soil and underlying bedrock (Van Tol et al., 2013; Le Roux et al., 2015; Job and Le Roux, 2018).
Management recommendations: Of the four seep wetlands assessed in detail in the field in the upper section, namely Wetlands 11, 12, 28, and 56 (Figure 2), all showed signs of trampling and grazing, evidence of the use of the wetlands by game. In the wettest seeps, “potholing” or deep hoof prints were noted, which could lead to erosion knick-points in these very steeply sloping systems. This was likely a contributing factor in Wetlands 12 and 28, two seeps which appear to have become desiccated following extensive erosion and an associated lowering of the water. Management recommendations include close observation of trampled areas within wetlands for signs of erosion. Grazing pressure could be managed for less vulnerable times of the year. This a supported by the current fire plan of the park, namely (1) lassaiz faire “natural” fire regime on the mountainous regions of the park, (2) patch mosaic fire regime for removal of moribund material, and (3) burning of firebreaks for safety and security. Monitoring (mapping and record keeping) of fires in the park needs to be improved and co-ordinated.
Several seep wetlands have been impacted by roads crossing through them with subsequent formation of erosion gullies, leading to drying out of sections of the wetland (Wetland 56, Figure 2). The negative effect of roads cutting through the seep wetlands of the upper catchment, a legacy of previous farming practices as well as current access needs to patrol the fenceline and firebreaks, warrants further assessment, followed by the development of appropriate rehabilitation and maintenance measures and guidance on the design and placement of any new roads.
Dividing the national park into hydrologic management units according to sub-catchments was a new management approach for the park (Box 1). This was approached together with managers and rangers to ensure that descriptive and familiar local names were matched with the best fit hydrological boundary. Sub-catchment names were ultimately based on a combination of the existing division of MZNP into management sections combined with the names of the main rivers in each catchment (Figure 2). Six sub-catchments (quinary catchments) were identified (Figure 2).
With the exception of Kareebos sub-catchment, which lies largely outside of the park, and Jurisdam sub-catchment of which only 50% of the headwaters are protected, the park protects the entire headwaters of the remaining four (quinary) sub-catchments and, thus, plays a significant local role with respect to freshwater conservation, despite not being identified as national freshwater priority (FEPA) catchments. Most sub-catchments are 3,000 ha or less (Table 3), while Wilgerboom catchment provides the most significant conservation contribution, with approximately 80% of this sub-catchment (11,236 ha) falling within MZNP. This sub-catchment supports 98 of the 100 seep wetlands mapped for the park, and is, therefore, an important catchment from the perspective of wetland management. The seeps are largely in a good ecological condition and the park potentially makes a significant contribution to the conservation of these wetland ecosystem types at the regional and national scale.
In our study, catchments units were used as basis for formulating wetland-relevant management recommendations (SANParks, 2016). For example, the upper Wilgerboom catchment (mountainous south) was noted to support grasses predominantly unpalatable to wildlife, which limits herbivory and helps protect wetland habitat. To relieve pressure from the drier northern plains, however, a management strategy to attract game into these areas has been to burn the grass on the hilltop and slopes (Novellie, 1990). The early regrowth is more palatable and more animals are then likely to make use of this food source. However, problems associated with burning wetland areas for grazing include increased numbers of grazers on the wetland areas, with associated increased trampling and compaction of soil. On the other hand, the exclusion of fire from mountainous areas may result in an increase in the densification of woody species (Brown, 1997). It was therefore advised that fire management practices for MZNP should aim to imitate natural regimes and processes (Bezuidenhout et al., 2016).
National-scale data can limit local-scale implementation if not validated and verified on the ground. Working at the local scale enables quality checking and feedback on national data. Results from this study are in stark contrast to the national depiction of wetland extent and richness, highlighting the essential role of wetland scientists and local managers to complement the efficiencies and reach of the top-down national approach. No wetland in the park was identified as a national wetland FEPA (Nel et al., 2011) and none of the seeps that occur along the slopes in the south of the park are included on the national-scale FEPA maps. This contradiction (between national-scale data and local reality) highlights the need for field-based mapping of wetlands in the park and for feeding the validated wetland information back to the South African National Biodiversity Institute (SANBI) for refinement of national wetland data. This has indeed happened, and subsequent refinement of national-scale wetland mapping in South Africa has benefited from the local-scale validation that took place in our study as well as elsewhere (Van Deventer et al., 2020).
Often passed over as time-consuming, local wetland ecosystem assessments are essential to develop a wetland baseline for any protected area, with distribution information and sufficiently accurate detail to allow understanding of what drives local wetland type functioning for management actions to be implemented. To achieve a rapid, realistic and effective wetland inventory within a reasonable timespan, the method developed for this study focused on collecting less in-depth data, but on all of the wetlands of the study area. This comprehensive approach facilitates an understanding of the variation in wetland types and impacts present in the park. The approach includes a significant time investment in GIS image interpretation, considered essential preparation before going into the field as it provides a rapid and comprehensive cover of an area. At this scale, the majority of wetlands can be identified and their boundaries roughly mapped through interpretation of aerial imagery. In the case of MZNP, even though it is one of the smaller National Parks, the landscape is rugged, ease of movement for fieldwork is constrained by the potential presence of dangerous wildlife, and the field team was only able to visit a small sub-set of the total wetlands over approximately eight field days. It was found to be most efficient to map as many wetlands as possible ahead of the field work, and also to allocate them a draft GIS-assessed wetland type, to allow the field team to most efficiently plan which locations to visit in the field, and to highlight an initial set of uncertainties requiring resolution through field investigation. Thus, this paper supports the case for a mixed methodology of image interpretation and field validation (Rebelo et al., 2017) to achieve a high confidence inventory for an extensive area. In addition, “rapid” and “detailed” (Figure 2) approaches are combined to deliver a multi-level approach (Nestlerode et al., 2014) in order to comprehensively cover the full park area.
The identification of sub-catchment units is an important component of the approach and promotes management from a hydrological perspective. Working to map the complete set of wetlands in each sub-catchment at a time facilitates a feel for the catchment landscape and allows impacts originating from this associated area to be identified and contextualized, so that relationships may be better understood and managed. Lack of available in-house wetland expertise stimulated a novel team approach which harnessed wide-ranging complementary expertise. The insights of rangers, managers and the mix of skillsets present during the fieldtrip enabled understanding of these previously under-studied ecosystems to be aligned with the existing landscape unit approach to management in MZNP. The existing approach of the park to manage according to landscape unit type (plant community, soils, climate) (Van der Merwe et al., 2015) provided a strong departure point. Wetlands are a result of their catchment landscape, resulting from the prevailing geology, topography, soil, and climate and, thus, align well with this management approach.
The approach of convening a multi-disciplinary team also promotes integrated implementation of the findings into park planning, management, and rehabilitation. We believe that our approach provides a potential template for rolling out similar work in other parks and other areas that have limited funding and capacity.
The datasets generated for this study are available on request to the corresponding author.
Written informed consent was obtained from the individual(s) for the publication of any potentially identifiable images or data included in this article.
The corresponding author prepared the manuscript, with contributions and review from all authors. All authors participated in field work associated with the study.
The authors declare that the research was conducted in the absence of any commercial or financial relationships that could be construed as a potential conflict of interest.
We thank South African National Parks and the South African National Biodiversity Institute for funding and support of this research, as well as Lucky Ramalala for assistance in the early stages of the GIS process and Abel Matsapula for assistance with the maps.
The Supplementary Material for this article can be found online at: https://www.frontiersin.org/articles/10.3389/fenvs.2020.00049/full#supplementary-material
Bezuidenhout, H., Brown, L. R., and Bradshaw, P. (2015). Broad Vegetation Description for Mountain Zebra National Park, Eastern Cape, South Africa. Internal SANParks Report. Kimberley: South African National Parks.
Bezuidenhout, H., Novellie, P., Brown, L. R., and Taplin, M. (2016). Fire Management Plan for Mountain Zebra National Park. Management brief 01/2016. Kimberley: SANParks.
Brinson, M. M. (1993). A Hydrogeomorphic Classification for Wetlands. Technical Report WRP-DE-4. Vicksburg, MS: US Army Engineer Waterways Experiment Station.
Brown, L. R. (1997). A Plant Ecological Study and Wildlife Management Plan of the Borakalalo Nature Reserve, North West Province. PhD Thesis, University of Pretoria, Pretoria.
Brown, L. R., and Bezuidenhout, H. (2018). Ecosystem description and diversity of the jurisdam-seekoegat sections of the mountain Zebra National Park. South Africa. South Afr. J. Bot. 118, 166–178. doi: 10.1016/j.sajb.2018.07.013
Finlayson, C. M., Davidson, N. C., and Stevenson, N. J. (eds) (1998). “Wetland inventory, assessment and monitoring,” in Proceedings of Workshop 4, 2nd International Conference on Wetlands and Development, Dakar.
Finlayson, C. M., and van der Valk, A. G. (1995). Wetland classification and inventory: a summary. Vegetatio 118, 185–192. doi: 10.1007/BF00045199
Gouws, J., Malan, D., Job, N., Nieuwoudt, H., Nel, J., Dallas, H., et al. (2012). “Freshwater Ecosystems,” in Western Cape Province State of Biodiversity. 2012, ed. A. A. Turner (Stellenbosch: Cape Nature Scientific Services).
Land Type Survey Staff (2004). “Land types of the map 3224,” in Graaff-Reinet. Memoirs on the Agricultural Natural Resources of South Africa. No. 26, Pretoria: ARC-Institute for Soil.
Le Roux, P. A. L., Hensley, M., Lorentz, S., van Tol, J. J., van Zijl, G. M., Kuenene, B. T., et al. (2015). HOSASH: Hydrology of South African Soils and Hillslopes. WRC Report No. 2021/1/15. Pretoria: Water Research Commission.
Macfarlane, D. M., Kotze, D. C., Ellery, W. N., Walters, D., Koopman, V., Goodman, P., et al. (2009). WET-Health: A Technique for Rapidly Assessing Wetland Health. Water Research Commission (WRC) Report No. TT 340/09. Pretoria: WRC.
Mbona, N., Job, N., Smith, J., Nel, J., Holness, S., Memani, S., et al. (2015). Supporting Better Decision-Making Around Coal Mining in the Mpumalanga Highveld Through the Development of Mapping Tools and Refinement of Spatial data on wetlands. Water Research Commission (WRC) Report No. TT614/14. Pretoria: WRC.
Mucina, L., Rutherford, M. C., Palmer, A. R., Milton, S. J., Scott, L., Lloyd, W., et al. (2006). “Nama-Karoo biome,” in The Vegetation of South Africa, eds L. Mucina and M. C. Rutherford (Lesotho: Strelitzia), 325–347.
Nel, J. L., Murray, K. M., Maherry, A. M., Petersen, C. P., Roux, D. J., Driver, A., et al. (2011). Technical Report: National Freshwater Ecosystem Priority Areas Project. Water Research Commission (WRC) Report No. 1801/2/11. Pretoria: WRC.
Nestlerode, J. A., Hansen, V. D., Teague, A., and Harwell, M. C. (2014). Application of a three-tier framework to assess ecological condition of Gulf of Mexico coastal wetlands. Environ. Monit. Assess. 186, 3477–3493. doi: 10.1007/s10661-014-3631-y
Novellie, P. (1990). The impact of a controlled burn on Karroid Merxmuellera mountain veld in the Mountain Zebra National Park. South Afr. J. Ecol. 1, 33–37.
Ollis, D. J., Snaddon, C. D., Job, N. M., and Mbona, N. (2013). Classification System for Wetlands and other Aquatic Ecosystems in South Africa. User Manual: Inland Systems. No. 22. Pretoria: South African National Biodiversity Institute.
Pond, U., Beesley, B. B., Brown, L. R., and Bezuidenhout, H. (2002). Floristic analysis of the Mountain Zebra National Park. Eastern Cape. Koedoe 45, 35–57.
Rebelo, A. J., Scheunders, P., Esler, K. J., and Meire, P. (2017). Detecting, mapping and classifying wetland fragments at a landscape scale. Remote Sens. Appl. Soc. Environ. 8, 212–223. doi: 10.1016/j.rsase.2017.09.005
Roux, D. J., Nel, J. L., Fisher, R. M., and Barendse, J. (2016). Top-down conservation targets and bottom-up management action: creating complementary feedbacks for freshwater conservation. Aqu. Conserv. Mar.Freshw. Ecosyst. 26, 364–380.
Roux, D. J., Nel, J. L., MacKay, H. M., and Ashton, P. J. (2006). Cross-Sector policy objectives for conserving South Africa’s Inland Water Biodiversity. Water Research Commission Report (WRC) No. TT 276/06. Pretoria: WRC.
SANParks (2016). Mountain Zebra National Park – Park Management Plan. Pretoria: South African National Parks.
Soil Classification Working Group (1991). Soil classification: a taxonomic system for South Africa. Mem. Agric. Nat. Resour. South Afr. 15, 1–262.
Van der Merwe, H., Bezuidenhout, H., and Bradshaw, P. L. (2015). Landscape unit concept enabling management of a large conservation area: a case study of Tankwa Karoo National Park. South Africa. South Afr. J. Bot. 99, 44–53.
Van der Walt, P. T. (1980). A phytosociological reconnaissance of the Mountain Zebra National Park. Koedoe 23, 1–32.
Van Deventer, H., Smith-Adao, L., Collins, N. B., Grenfell, M., Grundling, A., Grundling, P.-L., et al. (2019). South African National Biodiversity Assessment 2018: Technical Report. Volume 2b: Inland Aquatic (Freshwater) Realm. CSIR Report Number CSIR/NRE/ECOS/IR/2019/0004/A. Pretoria: South African National Biodiversity Institute.
Van Deventer, H., Smith-Adao, L., Mbona, N., Petersen, C., Skowno, A., Collins, N. B., et al. (2018). South African Inventory of Inland Aquatic Ecosystems (SAIIAE). Pretoria: Council for Scientific and Industrial Research.
Van Deventer, H., Van Niekerk, L., Adams, J., Dinala, M. K., Gangat, R., Lamberth, S. J., et al. (2020). National Wetland Map 5-and improved spatial extent and representation of inland aquatic and estuarine ecosystems in South Africa. Water SA 46, 66–79. doi: 10.17159/wsa/2020.v46.i1.7887
Van Riet, W. (1977). The Importance of Wilderness Landscape Analysis in Development Planning Schemes for National Parks, With Special Reference to the Mountain Zebra National Park. Bellville: AOSIS, 55–67.
Van Tol, J. J., le Roux, P. A. L., Lorentz, S. A., and Hensley, M. (2013). Hydropedological classification of South African hillslopes. Vadose Zone J. 12, 1–10. doi: 10.2136/vzj2013.01.0007
Keywords: wetland inventory, Mountain Zebra National Park, protected areas, participatory assessment, catchment and landscape approach, wetland management
Citation: Job N, Roux DJ, Bezuidenhout H and Cole NS (2020) A Multi-Scale, Participatory Approach to Developing a Protected Area Wetland Inventory in South Africa. Front. Environ. Sci. 8:49. doi: 10.3389/fenvs.2020.00049
Received: 04 October 2019; Accepted: 14 April 2020;
Published: 21 May 2020.
Edited by:
Hong Yang, Swiss Federal Institute of Aquatic Science and Technology, SwitzerlandReviewed by:
Lisa-Maria Rebelo, International Water Management Institute, Sri LankaCopyright © 2020 Job, Roux, Bezuidenhout and Cole. This is an open-access article distributed under the terms of the Creative Commons Attribution License (CC BY). The use, distribution or reproduction in other forums is permitted, provided the original author(s) and the copyright owner(s) are credited and that the original publication in this journal is cited, in accordance with accepted academic practice. No use, distribution or reproduction is permitted which does not comply with these terms.
*Correspondence: Nancy Job, bi5qb2JAc2FuYmkub3JnLnph
Disclaimer: All claims expressed in this article are solely those of the authors and do not necessarily represent those of their affiliated organizations, or those of the publisher, the editors and the reviewers. Any product that may be evaluated in this article or claim that may be made by its manufacturer is not guaranteed or endorsed by the publisher.
Research integrity at Frontiers
Learn more about the work of our research integrity team to safeguard the quality of each article we publish.